Table of Contents
Why Value Investing Is Back?
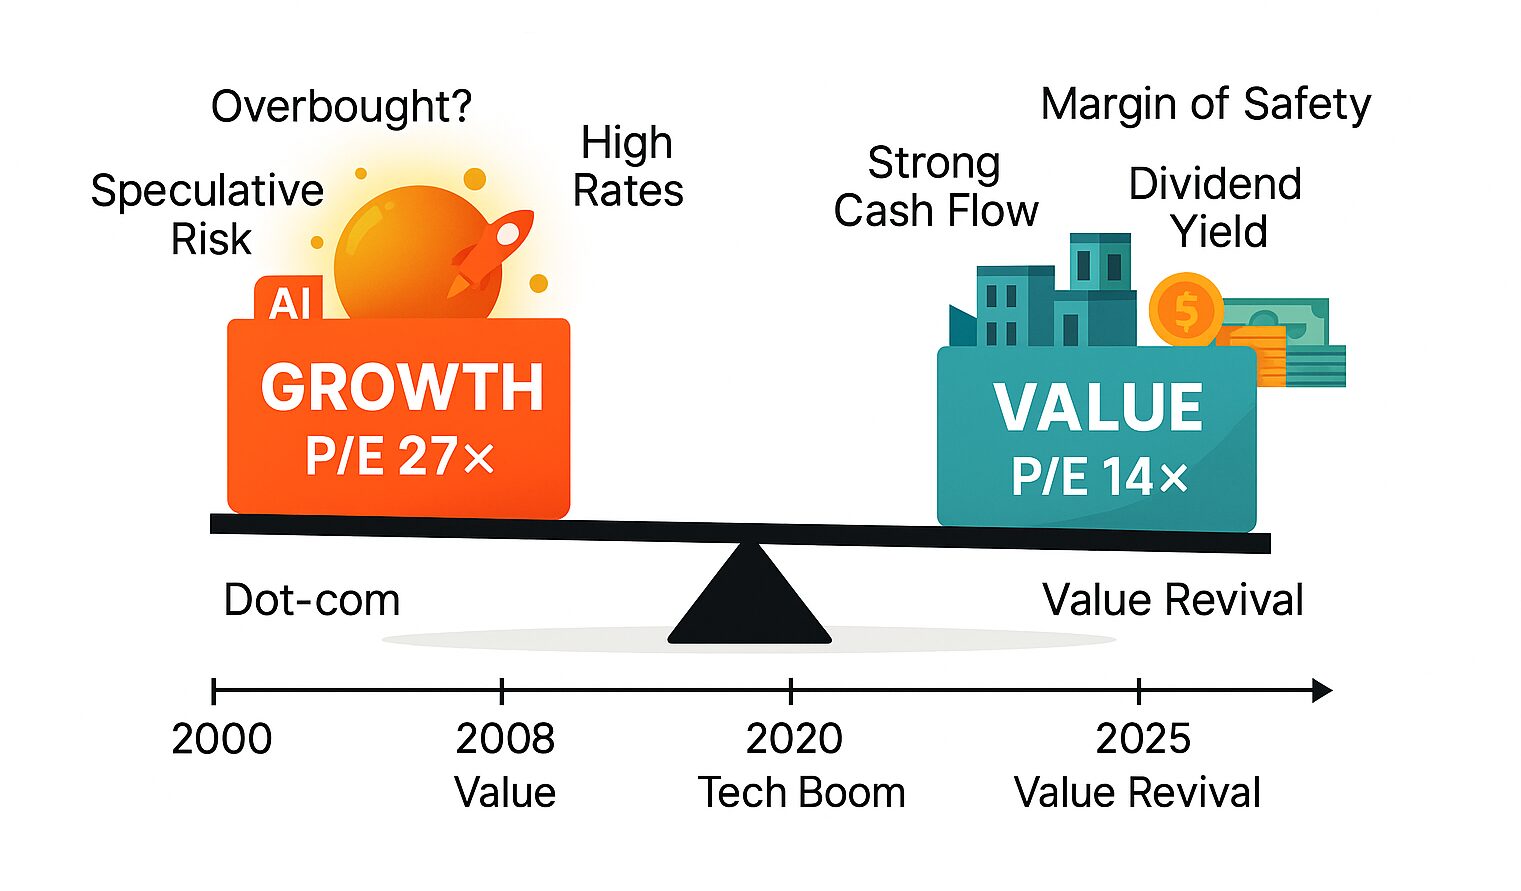
Rate Regimes & Mean Reversion
After the fastest hiking cycle in forty years, the U.S. 10‑year Treasury hovers around 4.4 %. Higher discount rates compress growth‑stock valuations faster than those of cash‑rich incumbents, widening the value‑growth gap to its largest percentile since 1999. The Russell 1000 Value returned 14.37 % in 2024 but slid ‑4.23 % YTD 2025 as profit‑taking hit defensive sectors while AI euphoria persisted in megacaps YCharts. That pull‑back has reopened valuation spreads to 2.3 standard deviations vs. the 20‑year mean—an historically attractive entry point.
Anatomy of the “Value Premium”
Academic data dating back to 1926 show the high book‑to‑market (HML) factor delivered a 3.6 % annual premium over growth, even after its rough 2017‑20 stretch. Updates through December 2024 still record a ‑9.1 % trailing 12‑month HML print—mean reversion fuel if history rhymes. Tuck School of Business
Deep Foundations: Four Cornerstones

| Cornerstone | “Why It Works” | Investor Actionables |
|---|---|---|
| Margin of Safety | Shields you from model risk (DCF assumptions wrong) and macro risk (unexpected recessions). | Demand ≥ 25 % discount to base‑case IV or a 10 % FCF yield buffer. |
| Intrinsic Value | DCF captures economic worth; Residual‑Income models capture surplus returns on equity. | Build both models; if they diverge by > 20 %, revisit your assumptions. |
| Circle of Competence | Sector expertise halves the chance you mis‑read footnote tweaks (e.g., oil reserve write‑offs). | Stay within 2–3 industries; use sector ETFs elsewhere. |
| Temperament | Behavioural finance shows over 60 % of retail underperform their own funds via bad timing. | Automate rebalancing; review watchlist monthly, not daily. |
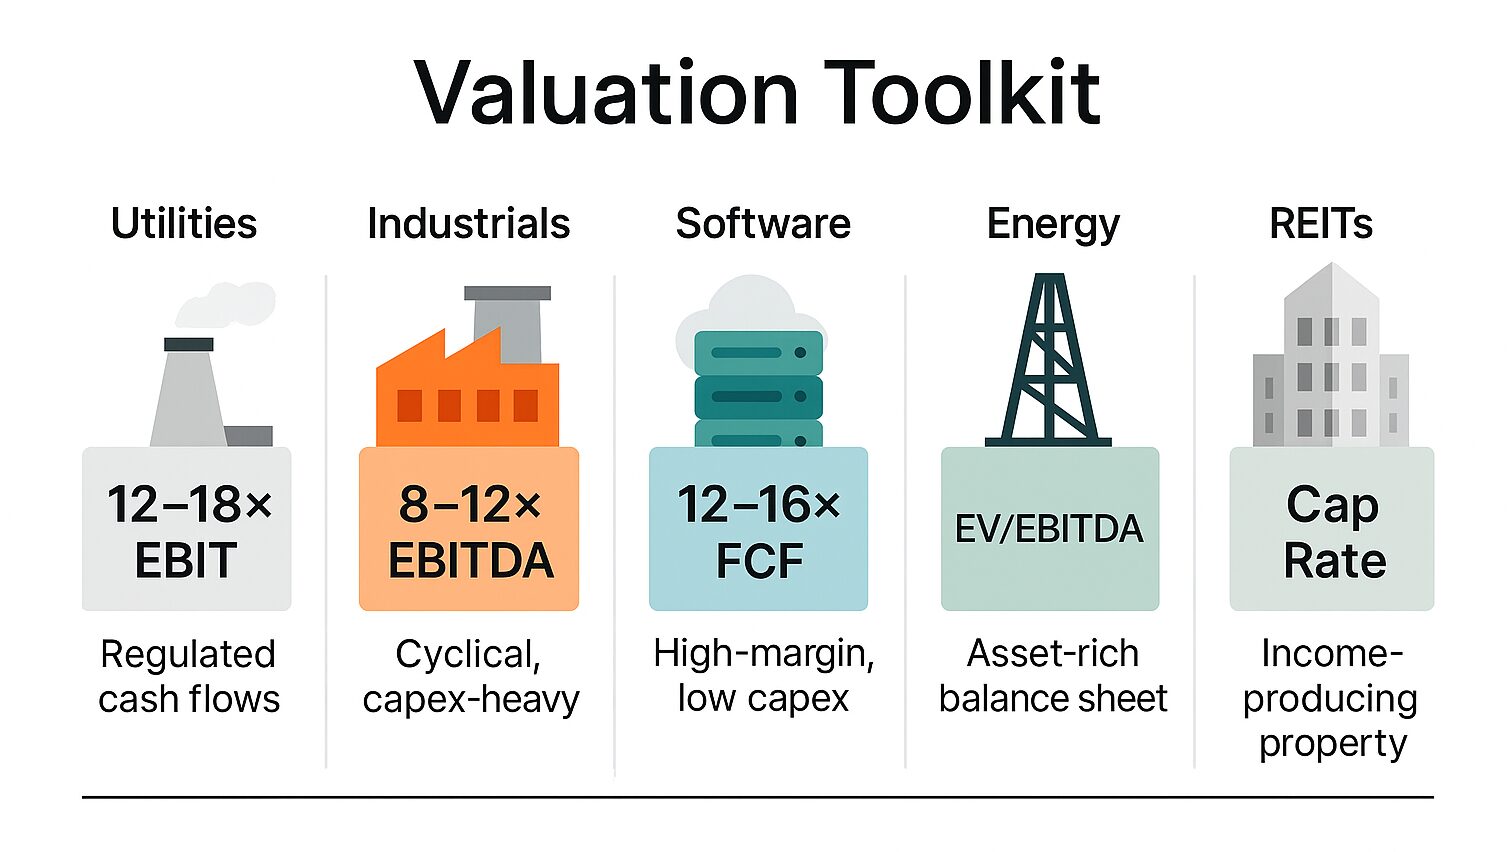
Valuation Toolkit With the Right Lens for Each Sector
Earnings‑Based Multiples 🔍
The classics—P/E, EV/EBIT, EV/EBITDA, FCF Yield—still drive most screens, but only if you calibrate them to a sector’s economics.
| Sector (2025) | “Fair” Band & Go/No‑Go Signal | Why Those Bands Work |
|---|---|---|
| Utilities & Pipelines | 12–18× EBITGreen < 15× | Revenues are regulated, cash flows track bond yields; think of them as equity‑bond hybrids. |
| Industrials & Transports | 8–12× EBITDAGreen ≤ 10× | Cyclical margins and heavy cap‑ex require a lower multiple to offset recession risk. |
| Software/SaaS | 12–16× FCFGreen ≤ 14× | High gross margin and low incremental cap‑ex justify a premium—so judge on free cash flow, not EBIT. |
| Energy Majors | 4–6× EV/EBITDA (mid‑cycle deck) | Commodity cash flows are volatile; investors demand a deep discount to the market P/E. |
| REITs | 12–18× Funds From Ops (FFO) | FFO neutralises depreciation noise; compare by property subtype (industrial, retail, data‑centre). |
Rule of thumb: if a company trades 20 % cheaper than the healthy band for its sector and clears the quality filters (below), you’ve likely found a candidate.
Asset & Replacement‑Cost Metrics 🏗️
- Price‑to‑Tangible Book (P/TB)
- Best for: banks, insurers, miners—businesses whose earning power is anchored to balance‑sheet assets.
- Watch‑list trigger: P/TB < 1.1 and ROE > Cost of Equity.
- Reverse‑engineered Replacement Value
- When to use: IP‑heavy firms (semiconductors, biotech) where book value ≠ economic value.
- Quick method:
- Capitalise the last five years of R&D at a 5‑year straight‑line amortisation.
- Mark PP&E to today’s build‑cost (industry data or turnkey estimates).
- Compare EV to this economic book; a 30 % discount is a green flag.
Earnings‑Quality Filters 🧹
Before trusting any multiple, scrub the income statement:
- Capitalised Operating Leases → Add Imputed Debt
- Multiply annual lease expense by ~7 × to approximate off‑balance‑sheet liability; adjust EV and EBIT.
- Stock‑Based Compensation (SBC) → Treat as Cash Expense
- Subtract SBC from reported FCF; tech firms can be 20–30 % overstated otherwise.
- One‑Off Gains/Losses → Strip Them Out
- Gains on asset sales, litigation windfalls, or restructuring costs distort EBIT. Re‑run ratios on clean EBIT.
- Unusual Working‑Capital Swings
- Sudden drop in payables or jump in receivables often flatters cash flow. Normalise working‑capital lines to five‑year averages.
Cheat code: build a one‑pager that recalculates P/E, EV/EBITDA, and FCF Yield after these adjustments; you’ll instantly see which “cheap” stocks are mirages.
Pairing sector‑tuned multiples with asset realism and earnings hygiene turns a blunt screen into a precision tool—helping you spot true bargains and dodge the traps that look cheap only on headline numbers.
Three Valuation Frameworks — A Cheat‑Sheet
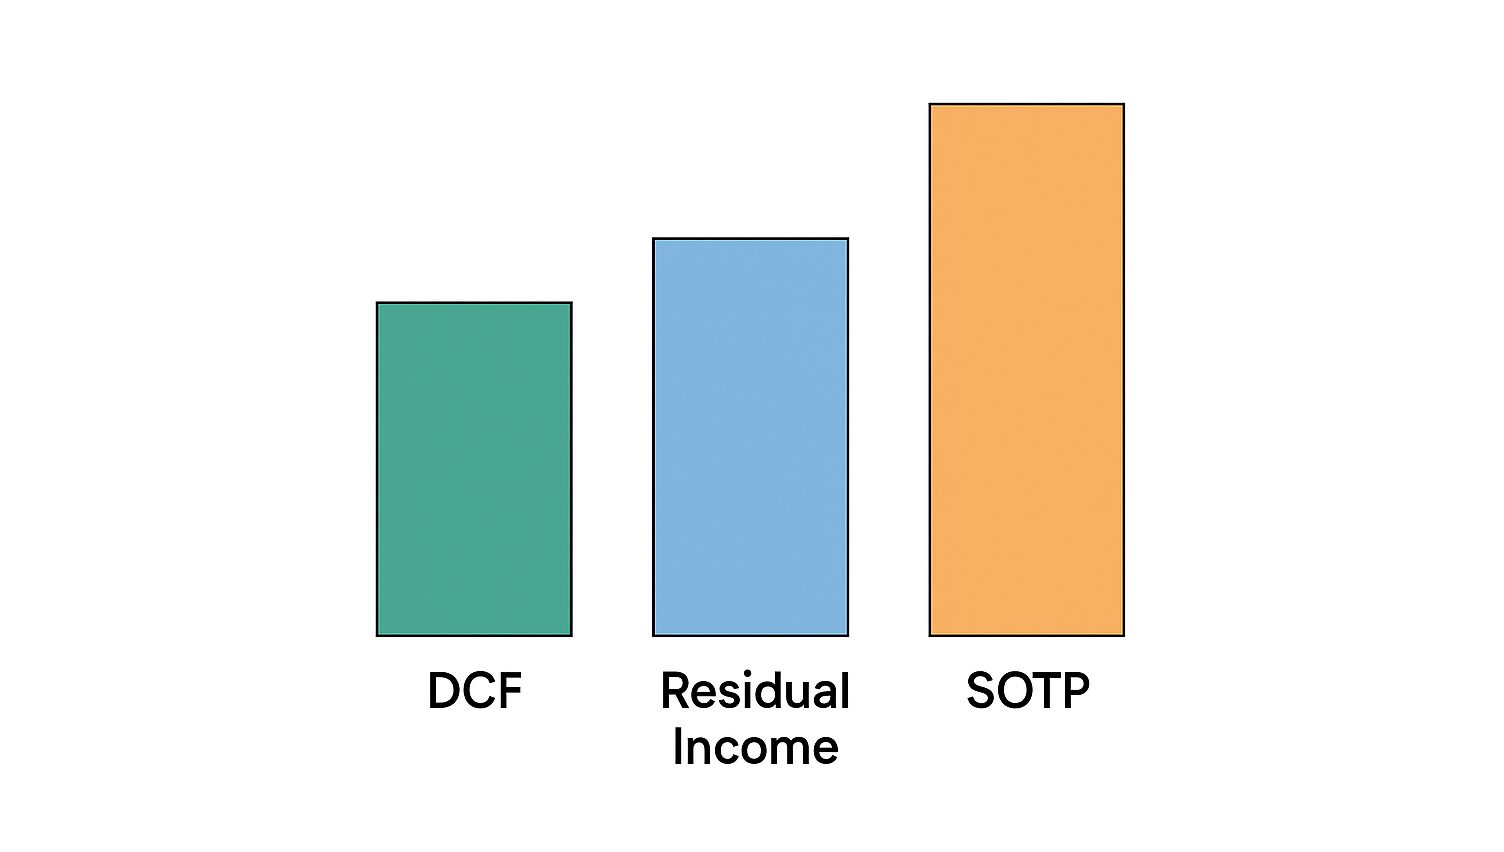
① Discounted Cash‑Flow (DCF) 💵
When you reach for it: predictable, cash‑rich businesses—think software subscriptions, consumer staples, utilities.
How to pull it off (in 90 seconds):
- Sketch three futures – Bull / Base / Bear (change sales ±2 pp, WACC ±1 pp).
- Project five years of free‑cash‑flow; cap the terminal growth at 3 % tops.
- Stress‑test with Monte‑Carlo (5 000 rolls) so you see a range of values instead of one magic number.
Gut‑check: if the terminal value is more than 70 % of the answer, you’re guessing too far out.
② Residual Income (RI) 📚
Best for: banks, insurers, any company where leverage muddles free cash flow.
Quick recipe:
- Start with today’s tangible book value per share.
- Forecast ROE minus Cost of Equity for five years—that difference is “economic profit.”
- Discount those profits back and add them to book value.
Rule of thumb: fade ROE toward the industry average by year 5; otherwise you’re dreaming.
③ Sum‑of‑the‑Parts (SOTP) 🧩
Why you need it: conglomerates or “hidden asset” stories (e.g., ports + real‑estate + logistics).
Three‑step drill:
- Carve the pie – list each segment’s EBITDA, NAV, or tonnage.
- Bolt on peer multiples – shipping might get 8× EV/EBITDA, real estate a 6 % cap rate, etc.
- Add them up, subtract net debt, then shave 10 % for holding‑company complexity (unless a spin‑off is coming).
Reality check: segment margins should look like close peers; if they’re wildly better, you missed some shared costs.
Putting it together — “The Two‑Out‑of‑Three Rule”
Run all three if you can. When two methods land within about 10 % of each other, odds are the valuation is solid. If they’re miles apart, dig deeper—the whole thesis probably rests on one flaky assumption.
Advanced Screening Blueprint (Automatable)
| Stage | Filter | Rationale | Tools |
|---|---|---|---|
| Universe | Market‑cap > $300 m, daily $ value traded > $2 m | Liquidity for execution | Finviz/IBKR |
| Cheap but Liquid | P/E < 70 th percentile within sector | Avoid sector bias | Python + yfinance |
| Quality Overlay | Piotroski F‑Score ≥ 6; ROE > 8 % | Weed out weak balance sheets | FundamentalQuery |
| Momentum Guardrail | 12‑month price > 35‑week SMA | Research shows filtering improves Sharpe | QuantConnect |
| Forensics | Beneish M‑Score < ‑1.78 | Flags earnings manipulation | AuditAnalytics API |
Automate this pipeline on a Sunday evening cron job; push results to Notion or Google Sheets for manual inspection Monday morning.
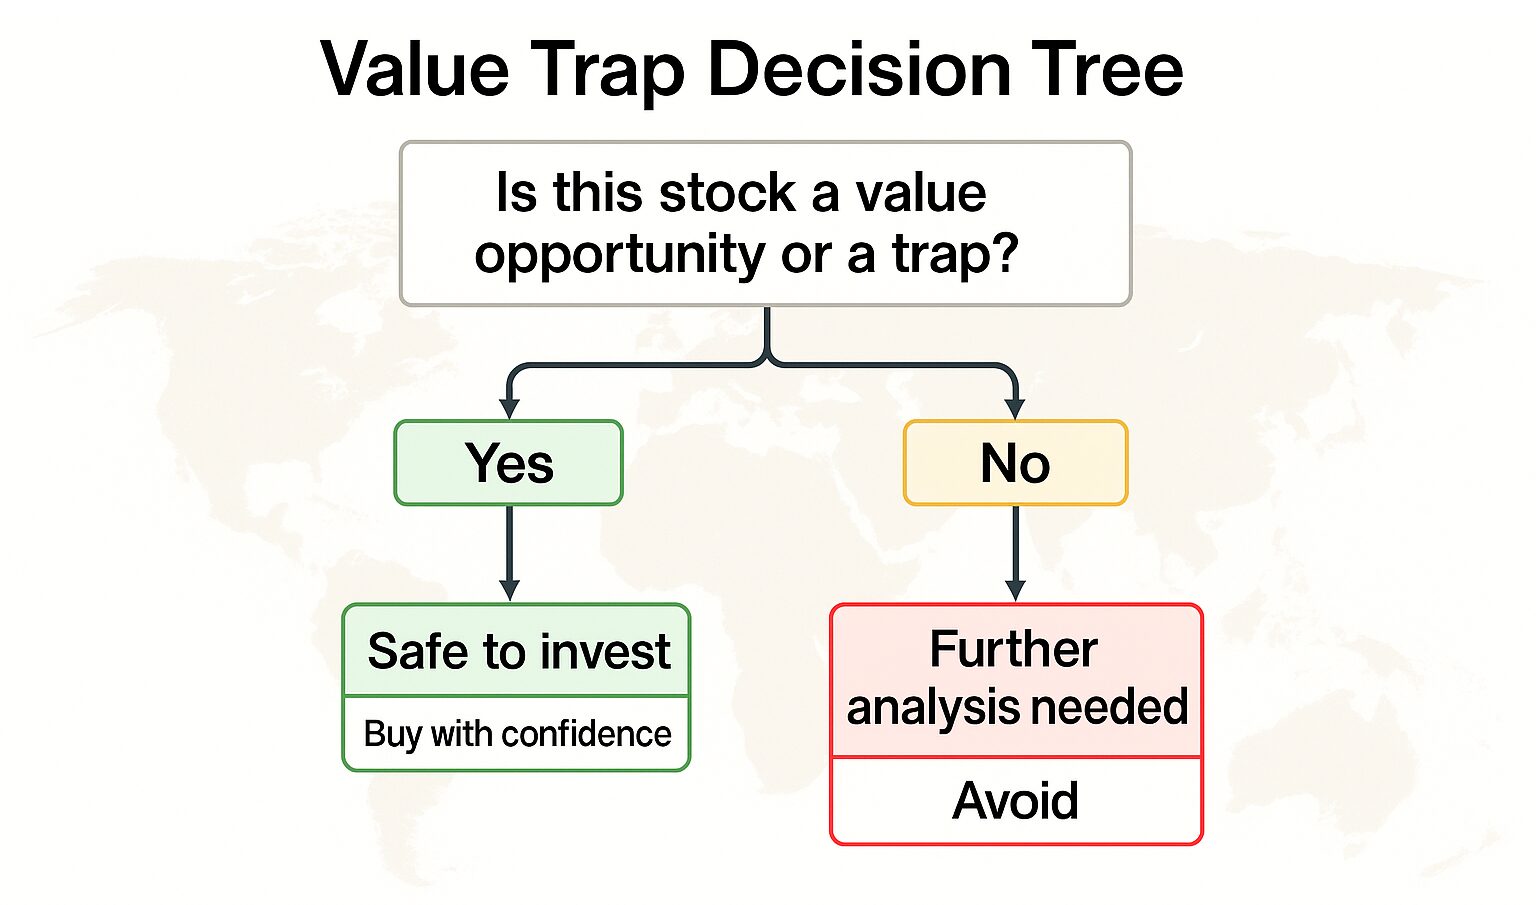
Value Trap Playbook
Quantitative Red Flags – “The Numbers Don’t Add Up”
- Negative operating cash flow while GAAP earnings stay positive – a classic accrual‑accounting mirage; compare CFO ÷ Net Income, look for < 0.7.
- Serial goodwill write‑offs (> 2 % of total assets per year) – signals the firm routinely overpays for acquisitions and then quietly admits failure.
- Interest‑coverage < 2× – one bad quarter could breach covenants; add a liquidity check: current ratio < 1? Run.
- Bonus quick checks: spike in Days Sales Outstanding, and a three‑year rise in total share count despite buyback headlines.
Qualitative Scars – “Smoke in the Boardroom”
- Narrative drift: management abandons hard metrics (units, margins) for fuzzy “strategic alternatives” rhetoric.
- Cap‑ex deferral: maintenance spending falls even as asset base ages—future cash costs just got deferred.
- Regulatory shadows: active probes, auditor resignations, or whistle‑blower suits (SEC, CFPB, OSHA) that could morph into fines or restatements.
- Insider behaviour: cluster selling by C‑suite within 30 days of upbeat guidance is often an early siren.
Research Affiliates’ 32‑year study found that mixing a quality filter (top 40 %) with simple 12‑month momentum expelled most of these traps and added ~5 % α per year.
Fix‑or‑Flee Decision Tree
- ≥ 2 quant flags + ≥ 1 qual scar → Flee (pass).
- Exactly one major issue → demand a ≥ 40 % margin of safety and log a two‑year checkpoint.
- Clean screen → proceed, but still set a thesis kill‑switch: if any new flag surfaces, reassess within 30 days.
A 10‑minute checklist that saves years of dead money.
Risk Management — The “Traffic‑Light” Method 🚦
GREEN ZONE 🚦— Normal Markets
- Check Your Mix (Factor Balance)
- Run a free screener (Morningstar or PortfolioVisualizer).
- If any single style (e.g., “Energy” or “Momentum”) is more than +20 % versus the world index weight, trim it. Example: World index = 5 % Energy. Your portfolio = 8 %. → Slight trim.
- Solo‑Stock Risk (Position Size)
- Use a simple cap: no single position bigger than 5 % of your portfolio.
- If you feel super‑confident, go to 6 %, never higher.
- Think of it like playing poker with only one‑chip raises.
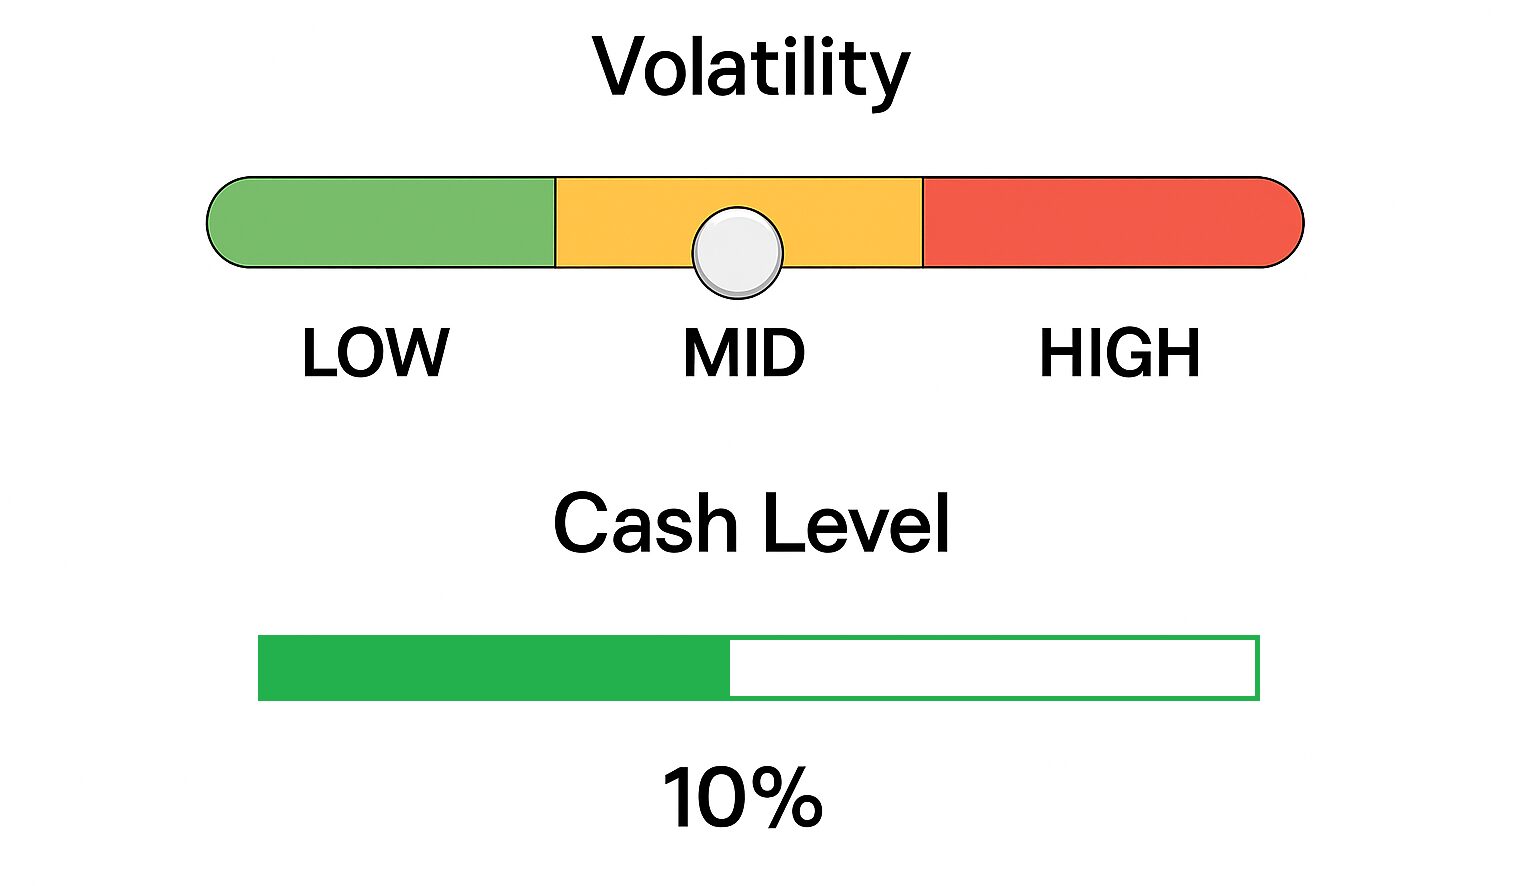
YELLOW ZONE 🚦 — Market Getting Jittery
(Trigger = S&P 500 down 7 – 10 % from recent high or VIX above 25.)
- Move to Safety Bucket
- Shift 10 % of your equity into cash or a 3‑month T‑Bill ETF such as BIL.
- Consider topping up a quality‑bond slice (IGEB, SCHZ).
- Cheap Insurance
- Buy a small “speed‑bump” hedge: one‑month, 5 %‑out‑of‑the‑money S&P put options costing ≤ 0.5 % of portfolio value.
- If options feel daunting, use an inverse ETF for half that size (e.g., SH) instead; sell it when calm returns.
RED ZONE 🚦— Storm Warning
(Trigger = Market drawdown > 15 % or your portfolio lags the benchmark by > 5 % in a falling tape.)
- Raise More Cash
- Lift cash/T‑Bills to 20 – 25 %.
- Re‑check sector weights; keep each within ± 10 % of the index.
- Aggressive Hedge / De‑Risk
- Double the size of your puts or inverse ETF.
- Tighten single‑stock limit to 3 %.
- Pause new buys unless you find screaming bargains you can fund by swapping out weaker names (i.e., stay net‑neutral).
HOW TO RE‑SET BACK TO GREEN
- When the market recovers above its 200‑day moving average and VIX < 18 for two consecutive weeks:
- Gradually redeploy cash in 5 % chunks every fortnight.
- Let hedges expire without rolling.
One‑Page Monthly Routine
| Step | Tool | Time Spent |
|---|---|---|
| Download portfolio to CSV | Broker export | 1 min |
| Check sector/style tilt | PortfolioVisualizer → ‘factor exposure’ | 3 min |
| Count position sizes | Excel “=MAX(range)” | 1 min |
| Look at S&P drawdown & VIX | Free chart (TradingView) | 1 min |
| Apply traffic‑light rules | Trim / hedge / hold | 4 min |
Why This Works
- Simple caps (5 % position, +20 % factor) stop silent creep into one-sided bets.
- Traffic‑light triggers convert scary macro noise into clear, mechanical actions—no guessing.
- Cash plus cheap hedges cushion big hits so you can stay invested enough to catch the rebound.
Spend ten minutes, once a month, follow the colours, and you’ll have 90 % of the protection that complex maths promises—with none of the headaches.
Global & Small‑Cap Angles
Currency Risk — When (and How) to Hedge 🌐💱
| Trigger | Why It Matters | Typical Playbook |
|---|---|---|
| Local inflation > U.S. Core CPI + 3 pp | High inflation often precedes currency weakness; the real return on foreign earnings shrinks | Hedge 50–100 % of the exposure with 3‑ to 12‑month forwards or a currency‑hedged share class |
| FX volatility > 12 % (annualized) | Volatility spikes raise the cost of capital and can swamp underlying equity gains | Partial, rules‑based overlay (e.g., hedge 25 % for every 2 pp vol above 10 %) |
| Carry is negative (short‑term yields below USD) | Hedging cost is positive (you get paid to hedge) | Consider 100 % hedge because it’s effectively “free” or profitable |
| Event risk (elections, capital‑controls chatter) | Gap risk—not captured by normal vol measures—jumps | Short‑dated put spreads or structured forwards for tail coverage |
Evidence: A 2024 Harvard/IMF study of institutional portfolios found that USD investors hedge more aggressively when FX volatility and inflation gaps rise, while letting exposure run in low‑vol, high‑carry regimes.
Tip: If you don’t have forward‑contract access, use ETFs like DBEF (developed markets hedge) or HEEM (emerging‑markets hedge) to bolt a hedge layer onto an unhedged core.
The Small‑Cap Discount — Value Hiding in Plain Sight 🏗️📉
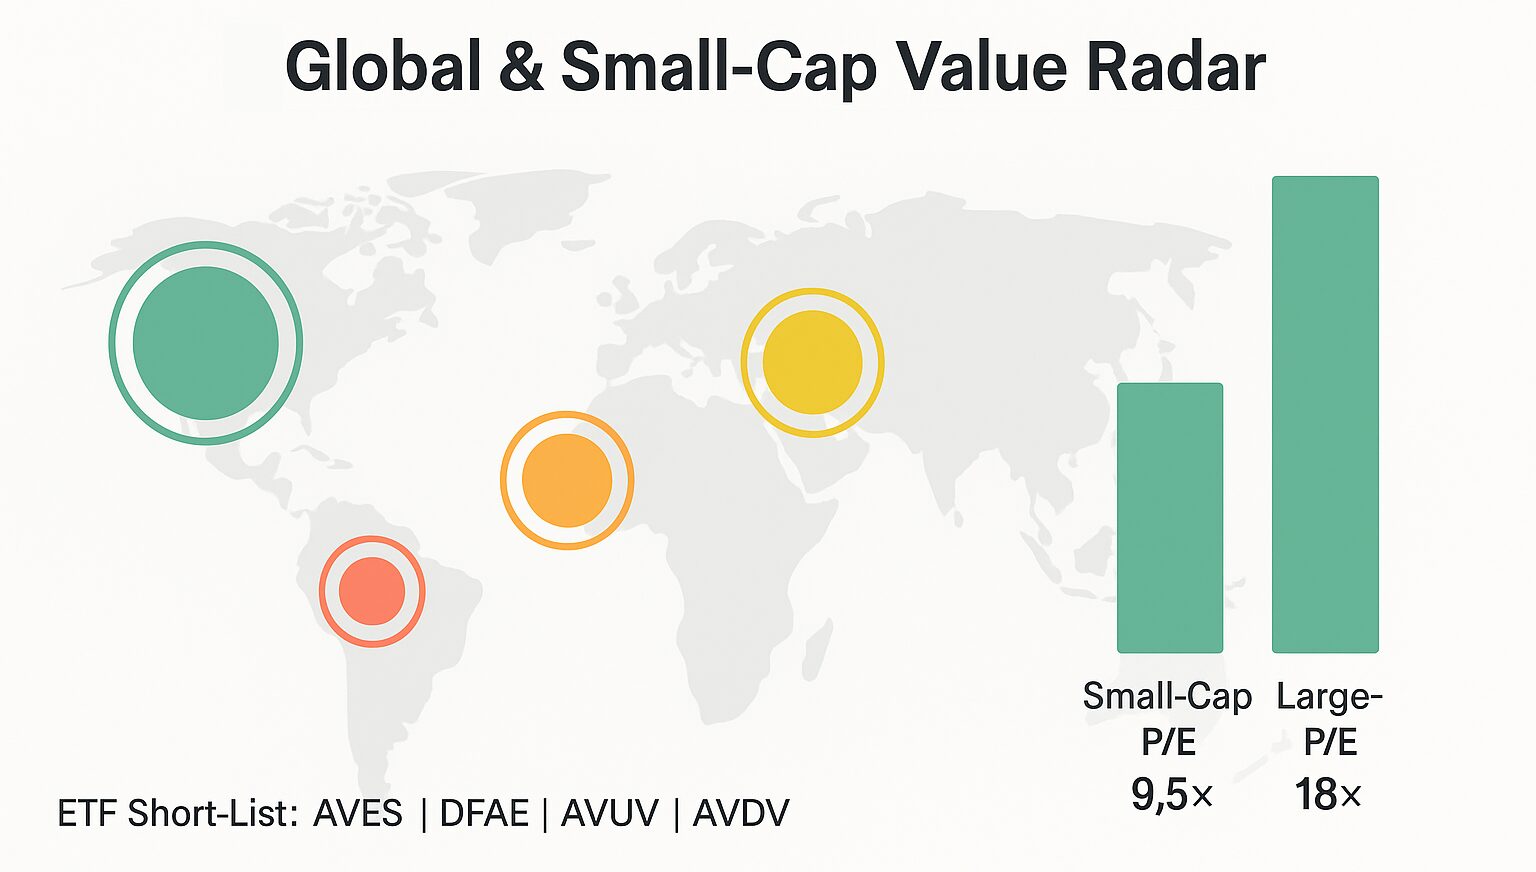
- Valuation gap: As of April 2025, the S&P 600 trades at 9.5 × forward P/E versus 18 × for the S&P 500—its widest spread in 25 years. citeturn0search0
- Macro backdrop: Small‑caps over‑index to floating‑rate debt; once the Fed pauses (or cuts), interest‑expense headwinds flip to tailwinds.
- Re‑rating kicks in fast: Historically, every 1 turn of P/E mean‑reversion has added roughly 7–8 % annualized to small‑cap returns (Janus Henderson back‑test, 1994‑2024).
- Key screens:
- EV/EBITDA < 8 and Net Debt/EBITDA < 3
- Piotroski F‑Score ≥ 6
- Insider net buying last 6 months
Liquidity note: Average bid‑ask spreads in micro‑caps are 25–40 bp; use limit orders and size at < 20 % of 30‑day ADV to avoid moving the market.
Global Value—ETF Short‑List 🧳📊
| Ticker | Region | Factor Tilt | TER | What Stands Out |
|---|---|---|---|---|
| AVES | EM | Deep‑value (P/B ~0.9, high profitability filter) | 0.36 % | Pure factor load, no state‑owned‑enterprise cap |
| DFAE | EM | Value & profitability blend | 0.35 % | Dimensional’s robust trading desk keeps spreads tight |
| AVUV | U.S. | Small‑Cap Value | 0.25 % | Captures the 3‑factor “sweet spot”: size, value, quality |
| AVDV | Int’l (ex‑US) Small Value | 0.36 % | Screens out unprofitable Japanese small‑caps—alpha kicker | |
| ISCV | Core EM Small‑Cap | 0.18 % | Complement to AVES if you want size factor without SOE filter |
Implementation ideas
- Barbell Core/Satellite
- 70 % MSCI ACWI (unhedged)
- 30 % split equally among AVES, AVDV, AVUV for value + size factor punch.
- Dynamic Hedge Overlay
- Pair unhedged AVES with HEEM (EM hedged) in a 70/30 ratio.
- Shift weight toward HEEM whenever EM‑USD vol > 15 %.
- Options Overlay for Small‑Cap Spread
- Long IWM calls financed by short SPY calls 6‑12 months out when small‑cap P/E spread > 2 σ versus 10‑yr mean.
Key Takeaways
- Hedge selectively, not habitually—let carry and volatility dictate the size of the overlay.
- Small‑cap value is the cheapest slice of global equities; mean‑reversion alone can deliver outsized returns when macro headwinds (rates) ease.
- ETF tool‑kit today lets you dial in factor purity (value & profitability) across every region without stock‑picking overhead.
Use these levers to diversify beyond U.S. mega‑caps while stacking size, value, and currency‑aware edges into one cohesive global portfolio.
Psychology & Behavioural Edge

Value investing is as much emotional discipline as spreadsheet skill. Below are three high‑impact biases (plus antidotes) that routinely sabotage otherwise solid strategies.
Endowment Effect 🚪💰
“Because I already own it, it feels more valuable.”
- Quarterly Re‑underwriting Ritual
- Schedule a date (e.g., first Saturday after each quarter‑end).
- For every position write one sentence: “If I had the cash today at $___, I would / would not buy this stock because…”.
- If the answer is “would not,” you either sell or trim to a token position earmarked for tax timing.
- Psychological Trick—Rename the Shares
Create a dummy watch‑list inside your broker that mirrors your holdings but labels them “Candidate XYZ.” Reviewing under a neutral label reduces ownership attachment. - Data Back‑Up
Studies by Kahneman & Knetsch (1992) show investors demand up to 30 % more money to sell an asset than they were originally willing to pay. A disciplined re‑buy test breaks that premium.
Narrative Fallacy 📖✨
“Great story, shame about the numbers.”
Humans knit facts into tidy plots, then cling to them even as reality diverges.
Action Framework
- Time‑Stamped Catalysts: For each thesis list specific, dated milestones:
- “FDA Phase III data by 31 Aug 2025”
- “New import tariff sunset on 15 Jan 2026”
- Binary Scoring: When the date arrives, log Hit / Miss / Partial. No excuses.
- Thesis Drift Alarm: If two major milestones miss, thesis is broken—sell or at least halve the position.
Pro tip: Use a project‑management app (Notion, Asana) with reminder pings so catalysts don’t slip by unnoticed.
Noise Control 🔕📈
Markets spew a fire‑hose of price ticks and hot‑takes that trigger dopamine loops but add zero signal.
- Alert Hygiene
- Set price notifications only at ±15 % from cost basis or when shares approach intrinsic‑value exit zone.
- Everything under that threshold is background chatter; you’ll see it at month‑end review anyway.
- Information Diet
- Morning window: Check Bloomberg / FT headlines once; log anything fundamental (earnings, guidance, M&A).
- Dead‑zone rule: No finance Twitter, Discord, or price apps between 10 a.m. and 3 p.m. trading hours—you can’t change quarterly results in real time, so stop pretending.
- Build a Buffer
Neuro‑finance studies (Lo & Repin, 2002) link elevated heart‑rate variability to poor trading outcomes. Step away: 10‑minute walk or box‑breathing resets your pre‑frontal cortex so you don’t act on impulse.
Quick‑Reference Checklist
- [ ] Did I re‑underwrite every holding this quarter?
- [ ] Are my catalysts dated and tracked?
- [ ] Do I have fewer than five real‑time price alerts per stock?
Master these three habits and you’ll neutralise most behavioural land‑mines that separate lifelong compounders from chronic underperformers.
Sector‑Specific Deep Dives
Banks & Insurers 📑
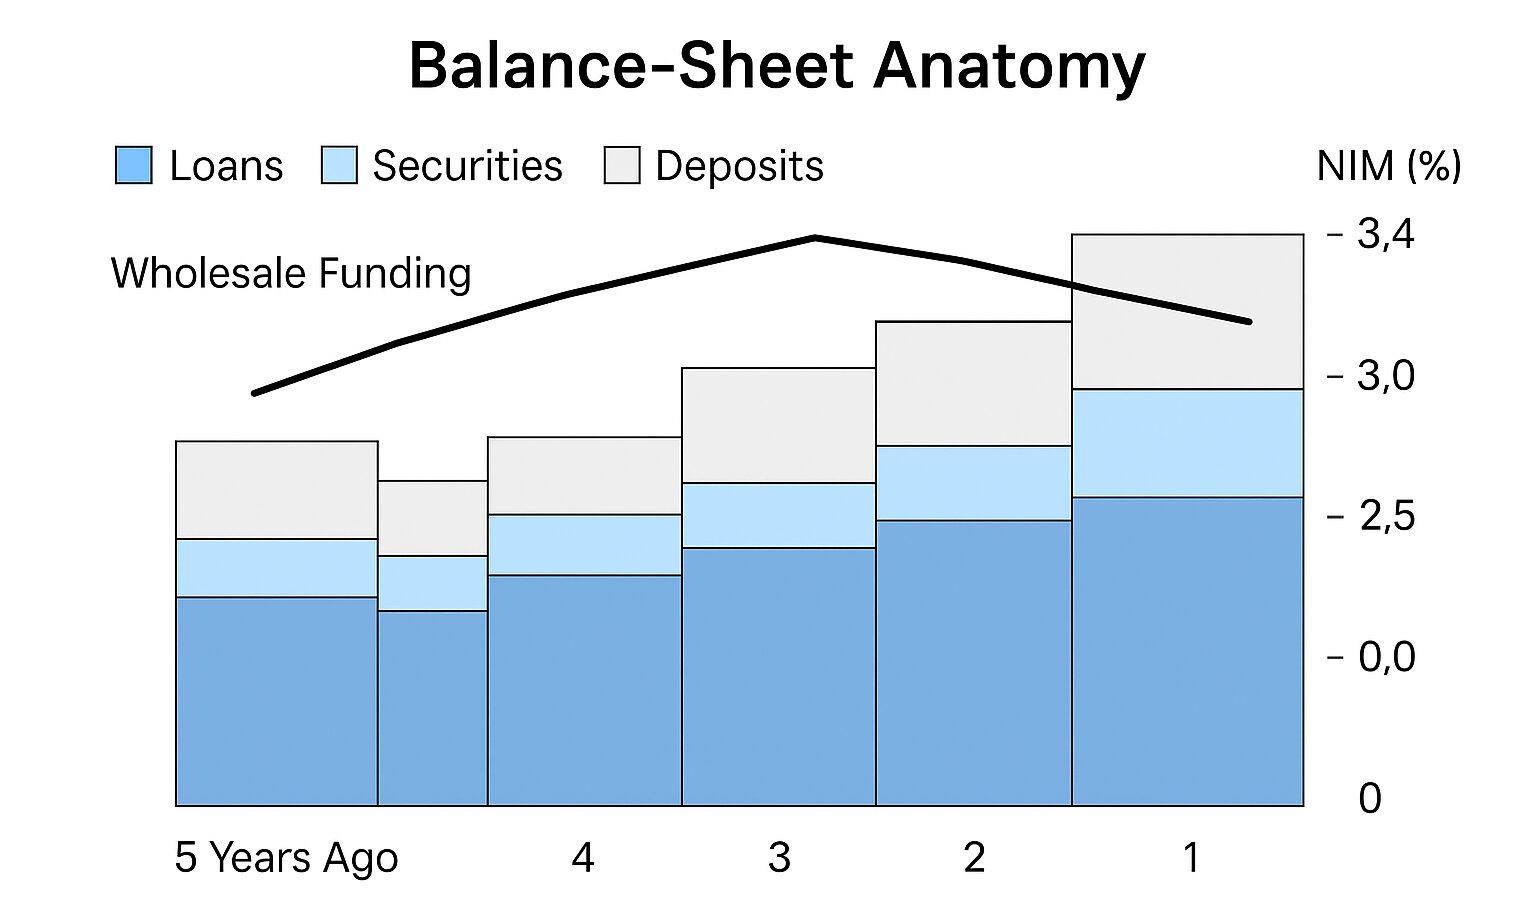
Why they’re different: Financial companies manufacture money rather than physical products. Their raw material is risk, their finished good is yield, and almost everything meaningful happens on the balance‑sheet. Traditional cash‑flow models break down because regulatory capital rules—not CapEx—constrain growth.
Core valuation levers
- Net Interest Margin (NIM). The spread between what the bank earns on loans/securities and what it pays on deposits/wholesale funding. A 25 bp move in NIM can swing ROE by several hundred basis points. Stress‑test your model with rising deposit‑beta scenarios (how quickly deposit rates re‑price upward).
- Common Equity Tier‑1 (CET1) Ratio. Think of it as the bank’s “equity cushion.” Regulators demand ≥ 10–11 % for globally systemic banks. A bank with 14 % CET1 can safely lever up or return capital; one sitting at 9 % is a potential diluter.
- Efficiency Ratio. Non‑interest expense ÷ (Net interest income + Non‑interest income). Under 55 % signals cost discipline; over 65 % erodes operating leverage.
- Credit Cost Cycle. Track net charge‑offs and non‑performing assets vs. loan book mix (CRE, consumer, C&I). Peak‑to‑trough cycles can wipe out two years of earnings.
Rule‑of‑thumb multiples
- Steady regionals: 1.8 – 2.2× tangible book when ROE ≈ 12 %+.
- Super‑regionals with fee engines (asset management, payments): 11–13× forward earnings.
Insurers (P&C focus)
- Combined Ratio under 95 % means underwriting profits before investment income—a green flag.
- Book‑value growth depends heavily on portfolio duration; rising rates boost reinvestment yields but mark down bond portfolios short‑term.
Catalysts & risks
- Catalysts: Rate‑hike pauses (NIM stabilises), balance‑sheet run‑downs at larger competitors (deposit inflows), or digital‑only cost structures.
- Risks: Rapid deposit flight (Silicon Valley Bank lesson), regulatory capital surcharges, aggressive duration mismatch.
Energy & Materials ⛽🪨
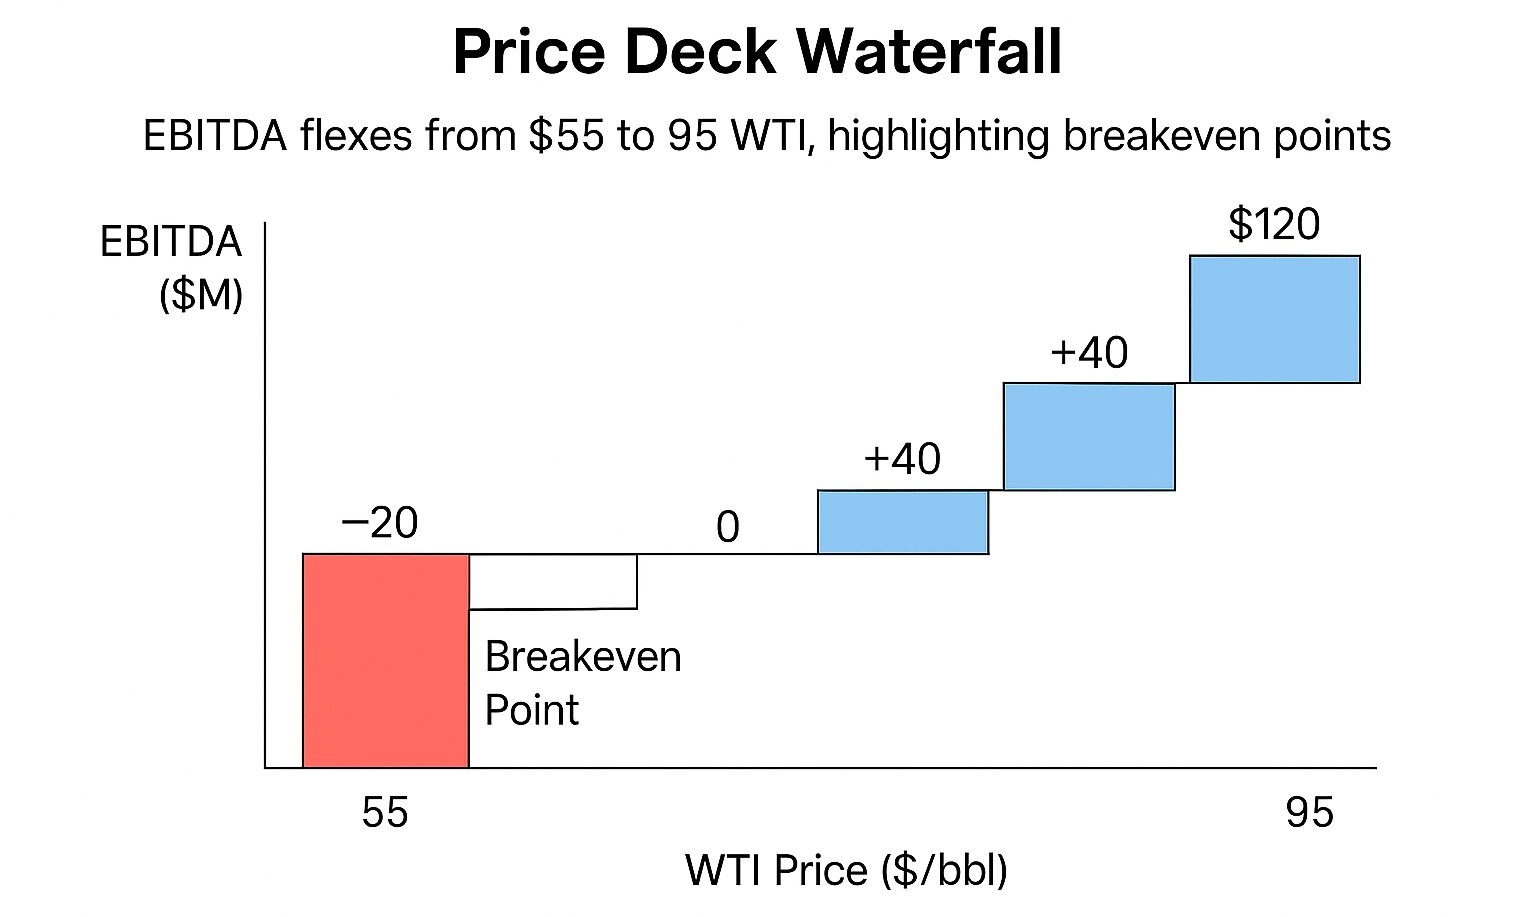
Why they’re different: Earnings swing wildly with commodity prices you don’t control. A DCF using last year’s spot prices is worthless the moment OPEC tweets.
Valuation framework
- Mid‑cycle Price Decks. Set long‑run assumptions— e.g., WTI $65/Bbl, Henry Hub $3.00/MMBtu, Copper $3.50/lb. These are bottoms‑up averages of marginal cost + small incentive premium.
- Through‑the‑cycle Cash Costs. Rank assets on the global cost curve; integrated super‑majors sit in the second quartile, many shale producers in the third.
- Reserve Life Index (RLI). Proved reserves ÷ annual production. Under 8 years means aggressive cap‑ex just to stand still.
- Net Debt / EBITDA. Target < 1.5× through the trough of the cycle; otherwise the balance‑sheet snaps when prices slump.
Metrics in practice
- EV/EBITDA (cycle‑adjusted): 4.5–6× for diversified majors at mid‑cycle.
- P/CF (price to operating cash flow): < 5× generally signals undervaluation unless reserves are depleting.
Catalysts & risks
- Catalysts: New LNG export approvals, pipeline de‑bottlenecking, disciplined cap‑ex plus rising shareholder distributions.
- Risks: Windfall‑profit taxes, OPEC surprise cuts/boosts, ESG‑driven capital flight stranding assets.
Tech Hardware 💻🔌
Why they’re different: Fab plants and foundries have mega fixed costs ($10–25 bn each). Unit demand is cyclical—yet missing a node shrink risks permanent obsolescence.
Valuation focus
- Replacement Value. Sum the cost to rebuild fabs (construction + lithography tools) minus economic depreciation. If market cap < 70 % of replacement value, activist interest often follows.
- Gross Margin vs. Node Leadership. Each new node (~18 → 14 → 7 nm) typically raises gross margin by ~4 pp, but cap‑ex burns cash upfront. Map node roadmap against peers (TSMC, Intel, Samsung).
- Utilization Rate. Every 5‑point drop in fab utilisation can cut EBIT by 200–300 bp because depreciation is fixed.
- Customer Concentration. Apple alone drives ~25 % of global high‑end foundry volume; losing a flagship account is fatal.
Rule‑of‑thumb multiple
- EV/EBITDA mid‑cycle: 8–10× for diversified semis; 6–7× for memory players (more commoditised); 12–14× for specialty analog/power houses with 60 %+ gross margins.
Catalysts & risks
- Catalysts: Node shrink on schedule, CHIPS‑Act subsidies lowering cap‑ex burden, strategic silicon wins (e.g., AI accelerator sockets).
- Risks: Capital blow‑outs (Intel 4‑nm delays), inventory gluts (PC downturns), export‑control shocks cutting off China demand.
Key takeaway:
Sector nuance matters. A textbook P/E screen might flag an 8× energy stock or a 0.9×‑book bank as “cheap,” but without understanding reserve life or deposit stickiness you’re flying blind. Marry the universal value framework (margin of safety, quality overlay) to these industry‑specific levers, and you’ll spot genuine bargains long before headline multiples look inviting.
90‑Day Action Roadmap
| Week | Milestone |
|---|---|
| 1 | Build or download open‑source Python screener template. |
| 2–3 | Calibrate sector‑specific valuation ranges; import into screener thresholds. |
| 4 | Run first screen; shortlist ≤ 40 tickers. |
| 5–8 | Complete one deep valuation per business day; store in research wiki. |
| 9 | Rank top 20 by highest MOS × quality score; open 50 % of ultimate positions. |
| 10–12 | Monitor Q1 earnings; scale in remainder if thesis intact. |
FAQs
Q1: Can a company be both a “growth stock” and a “value stock” at the same time?
A: Absolutely. Style boxes capture today’s valuation, not a company’s DNA. When a fast‑growing firm’s price multiple compresses—say, after a market sell‑off or a period of earnings catch‑up—it can trade at a discount to its own intrinsic value while still compounding revenues. Microsoft between 2010‑2013 and Meta in late 2022 are classic examples: growth economics, value pricing.
Q2: What’s the most tax‑efficient way to run a value strategy?
A: Keep high‑turnover or special‑situation trades in tax‑sheltered accounts (IRAs, ISAs, EPFs). Hold long‑term deep‑value positions in taxable accounts and harvest losses to offset gains. Re‑invest dividends automatically inside shelters; in taxable accounts, let them accumulate and rebalance once a year to minimise short‑term capital‑gains hits.
Q3: Should I pick individual stocks or just buy a value ETF?
A: It hinges on time, skill, and account size. A low‑cost ETF like AVUV, VBR, or IWD gives instant diversification and factor exposure. Stock‑picking can outperform but demands rigorous research, psychological discipline, and low commissions. Many investors split the difference—keep 60‑70 % in a broad value‑factor ETF core, then allocate the rest to a concentrated basket of highest‑conviction ideas.
Q4: How do share buybacks factor into my intrinsic‑value calculation?
A: Treat buybacks as favourable only when they’re executed below intrinsic value. In your DCF, model shares outstanding on a downward glide path if management has the free cash flow to keep buying and a clear authorisation in place. If buybacks occur at inflated prices (common late in bull markets), they destroy value—flag that as poor capital allocation.
Q5: Do I need high‑dividend yields in a value portfolio?
A: Not necessarily. Focus on total shareholder yield: dividends + net buybacks + net debt reduction. Some of the best long‑term compounders (Costco, Berkshire Hathaway) pay little or no dividend because they can reinvest cash at superior returns. Chasing yield without checking payout sustainability often leads straight into value traps.
Q6: How should I approach international value opportunities with different accounting rules and political risks?
A: First, normalise accounting differences (e.g., IFRS lets firms capitalise R&D—restate to compare apples to apples). Second, decide whether to hedge currency—only worth it when FX volatility is high or your liabilities are USD‑based. Third, price in political or expropriation risk by adding 1–2 percentage points to your discount rate or demanding a larger margin of safety for frontier‑market names and state‑sensitive sectors like mining or utilities.
Conclusion — Your Edge Is Process + Patience
Value investing in 2025 isn’t about memorizing raw P/E ratios; it’s about systematizing your curiosity so you can sift opportunity from noise. First, deploy a disciplined screener to shrink the investable “ocean” to a manageable pond of prospects. Next, weigh each candidate with sector‑specific valuation lenses—DCF for cash‑rich software, EV/EBITDA for cyclical industrials, price‑to‑book for asset‑heavy banks. Finally, anchor every decision in temperament: ignore the dopamine hit of daily headlines and trust your process.
What to remember when the market whipsaws:
- Screens save time, not thought – use them to filter, then dig deep.
- Quality + Valuation beats cheap alone – low multiples without strong cash flows are traps in disguise.
- Margin of safety is non‑negotiable – insist on at least a 25 % discount to intrinsic value.
- Patience compounds – allow 2‑3 years for mispricings to close; don’t hop between shiny narratives.
- Risk is more than volatility – position‑size with fractional Kelly and diversify across sectors to survive the unexpected.
- Behavioral edge matters – mute price alerts, journal decisions, and review theses quarterly to escape herd emotions.
Markets will keep mispricing fear, overvaluing glamour, and lurching between greed and panic. Armed with a repeatable toolkit—advanced screening, rigorous valuation, and stoic temperament—you’ll keep netting under‑valued gems, rain or shine, long after today’s news cycle fades.