In the world of financial markets—be it stocks, forex, commodities, or cryptocurrencies—few concepts carry as much weight as support and resistance. Understanding these fundamental levels can drastically improve your trading performance, inform your entry and exit points, and help you manage risk more effectively. This comprehensive guide covers everything you need to know about support and resistance, including key definitions, various methods to identify these levels, strategies to trade them, and top tips for long-term success.
Table of Contents
What Are Support and Resistance Levels?
Support and resistance are foundational elements in technical analysis, representing key price levels that a market struggles to break below (support) or above (resistance). Think of support as a price floor where buying interest tends to emerge, preventing prices from moving significantly lower. Resistance, on the other hand, is like a ceiling where selling pressure tends to appear, capping further upward movement.
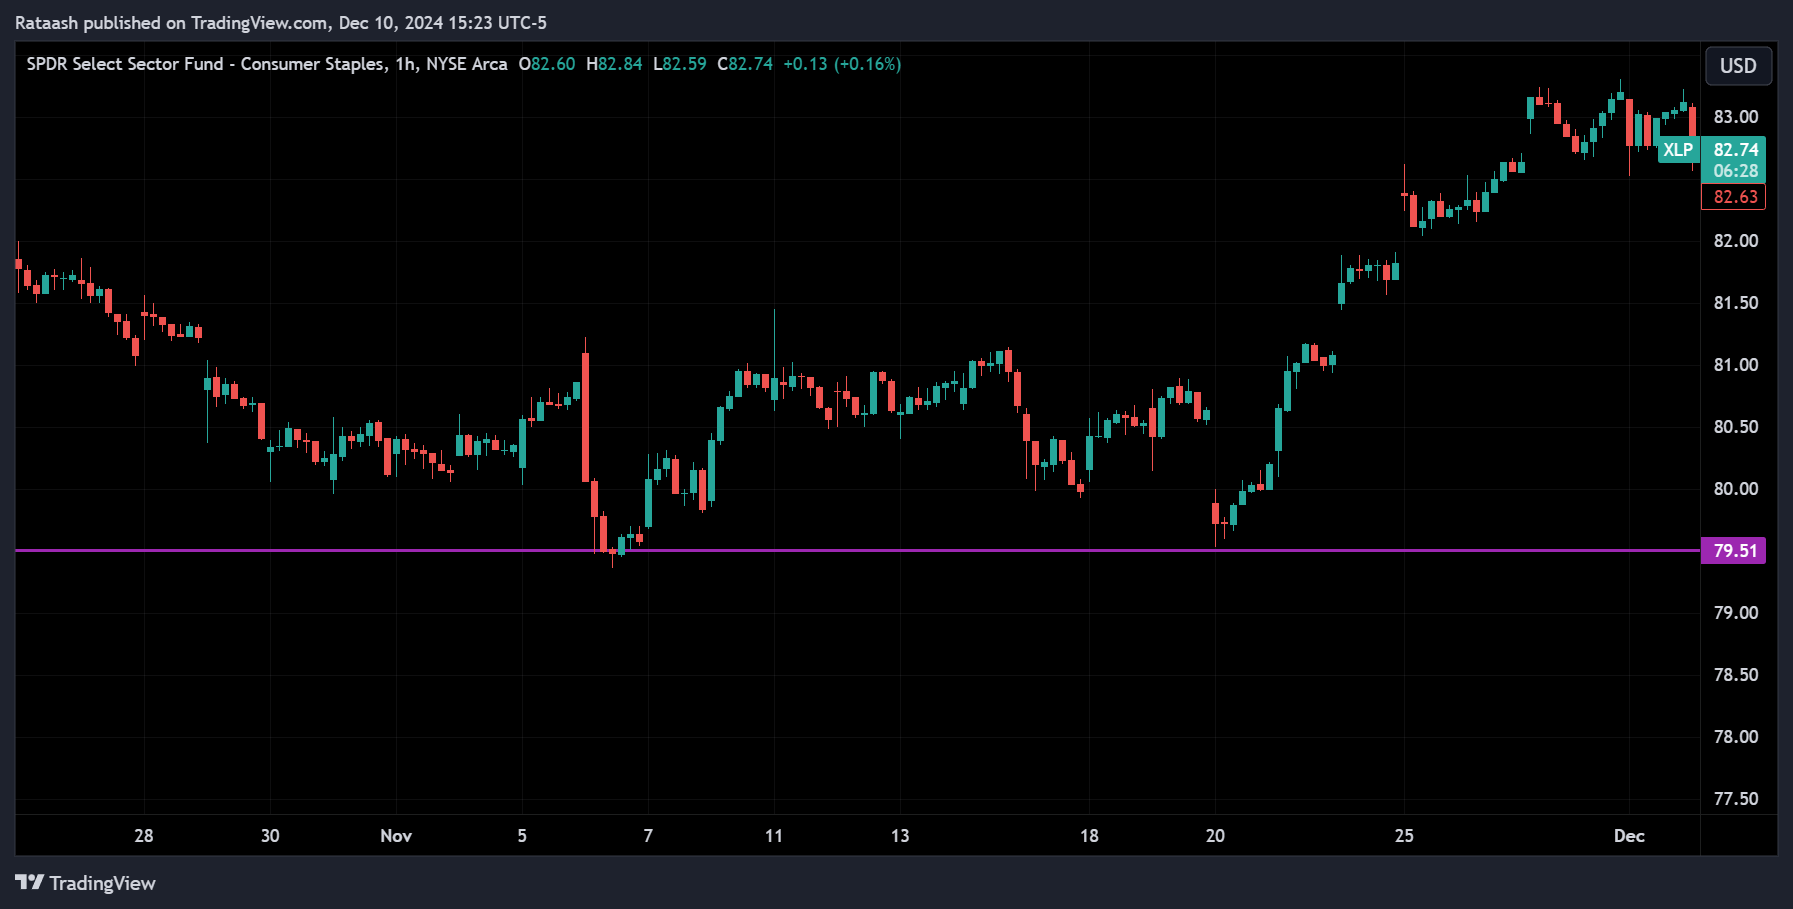
Support Level: A price point where the market tends to find renewed buying interest. When prices approach this level, bulls are more active, often preventing the price from falling further.
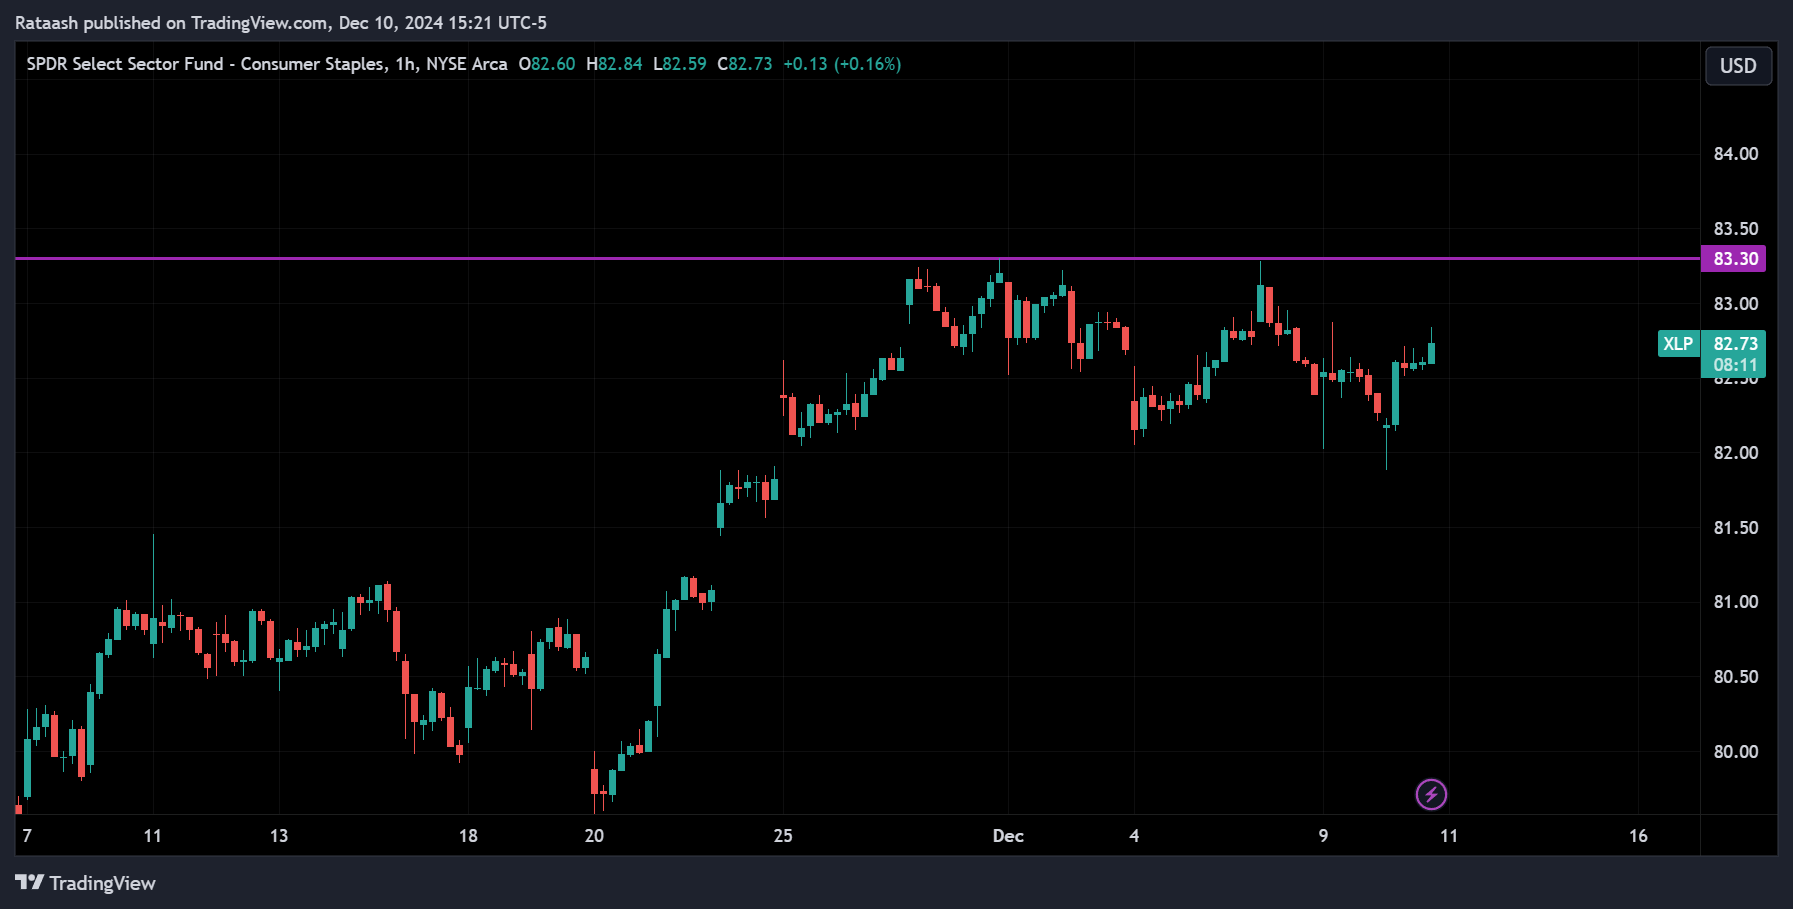
Resistance Level: A price point where the market tends to encounter selling pressure. When prices approach this level, bears become more active, limiting additional price increases.
Why Support and Resistance Matter in Trading
Support and resistance levels are crucial because they help traders determine when to enter or exit trades, where to place stop-loss orders, and how to set profit targets. Whether you’re trading stocks, forex pairs, cryptocurrencies, or commodities, these levels give structure to an otherwise volatile and unpredictable market. By understanding support and resistance:
- Improve Entry Timing: You can time entries better by buying near support levels to minimize downside risk.
- Enhance Exit Strategies: Exiting near resistance levels can lock in profits before a reversal.
- Aid in Risk Management: Placing stop-losses just beyond key support or resistance levels helps control potential losses.
- Strengthen Your Technical Analysis Framework: These levels act as a reference point for other technical tools and indicators, enhancing overall analysis accuracy.
How to Identify Support and Resistance Levels
Identifying support and resistance levels is both an art and a science. There’s no one-size-fits-all approach, and many traders use a combination of methods. Below are several techniques you can use to pinpoint these critical levels.
Horizontal Lines and Zones
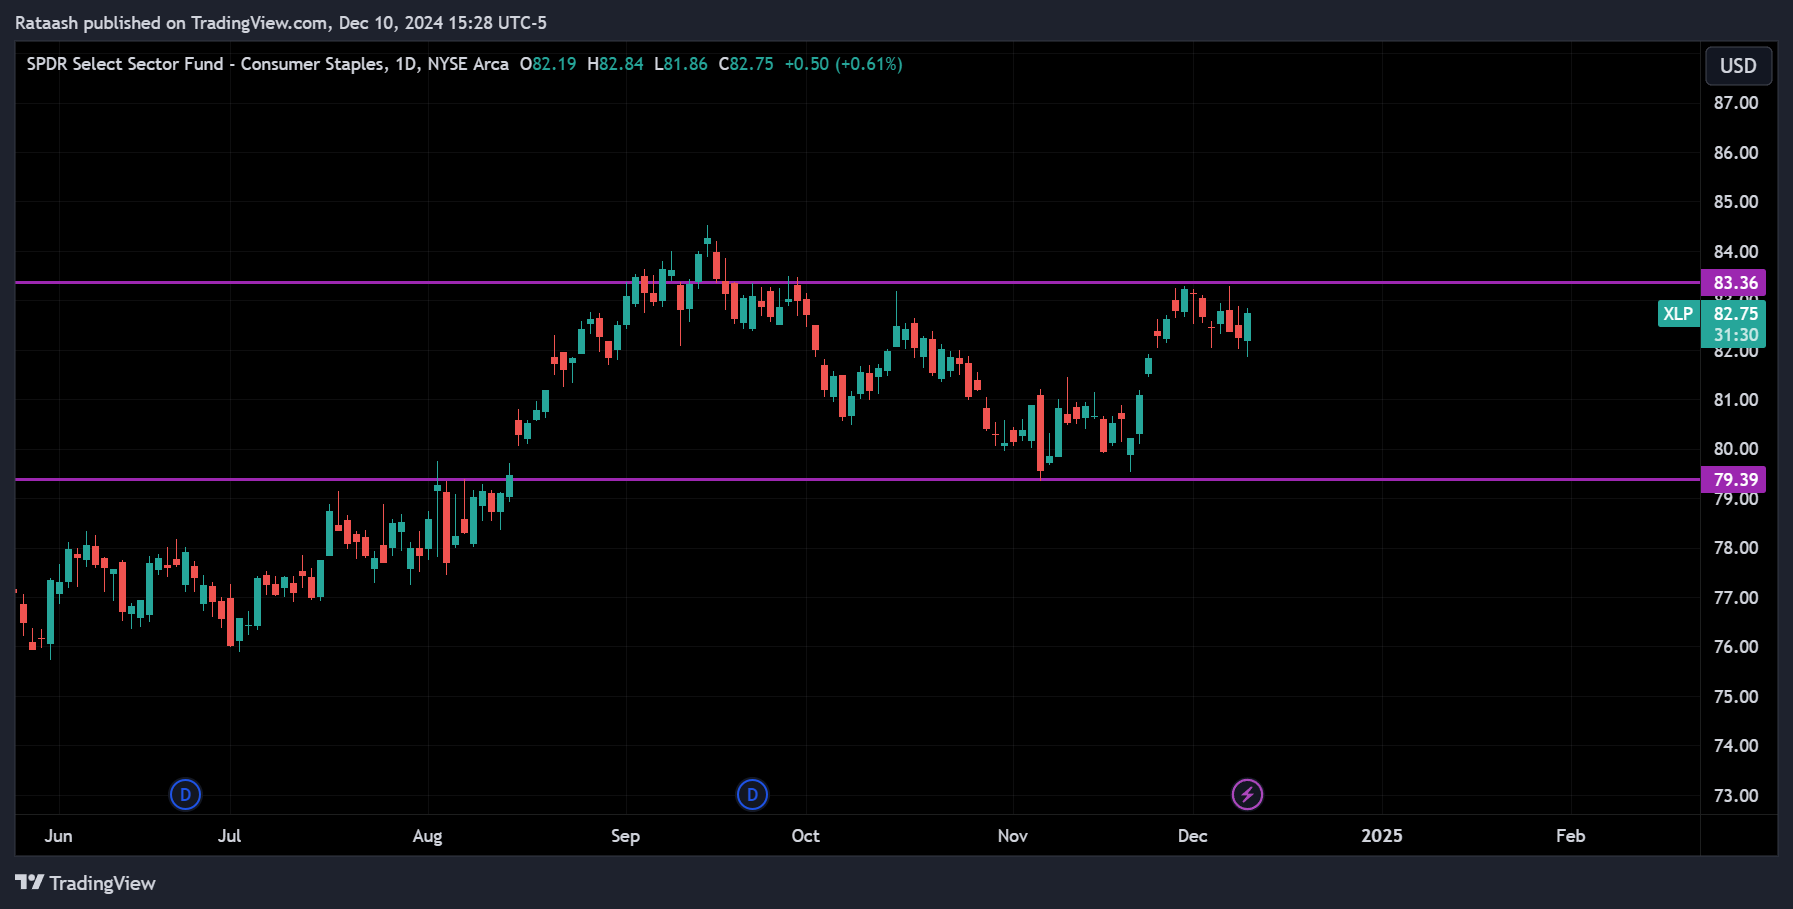
Horizontal levels are perhaps the most common way to identify support and resistance. Traders look for historical price points where the market repeatedly reversed direction. By drawing a horizontal line or “zone” across these areas, you highlight key levels that the market may react to in the future.
- Example: If a stock has bounced off $50 multiple times in the past, that $50 level is acting as a support. Similarly, if the price has been rejected several times at $60, that level forms a resistance.
Trendlines
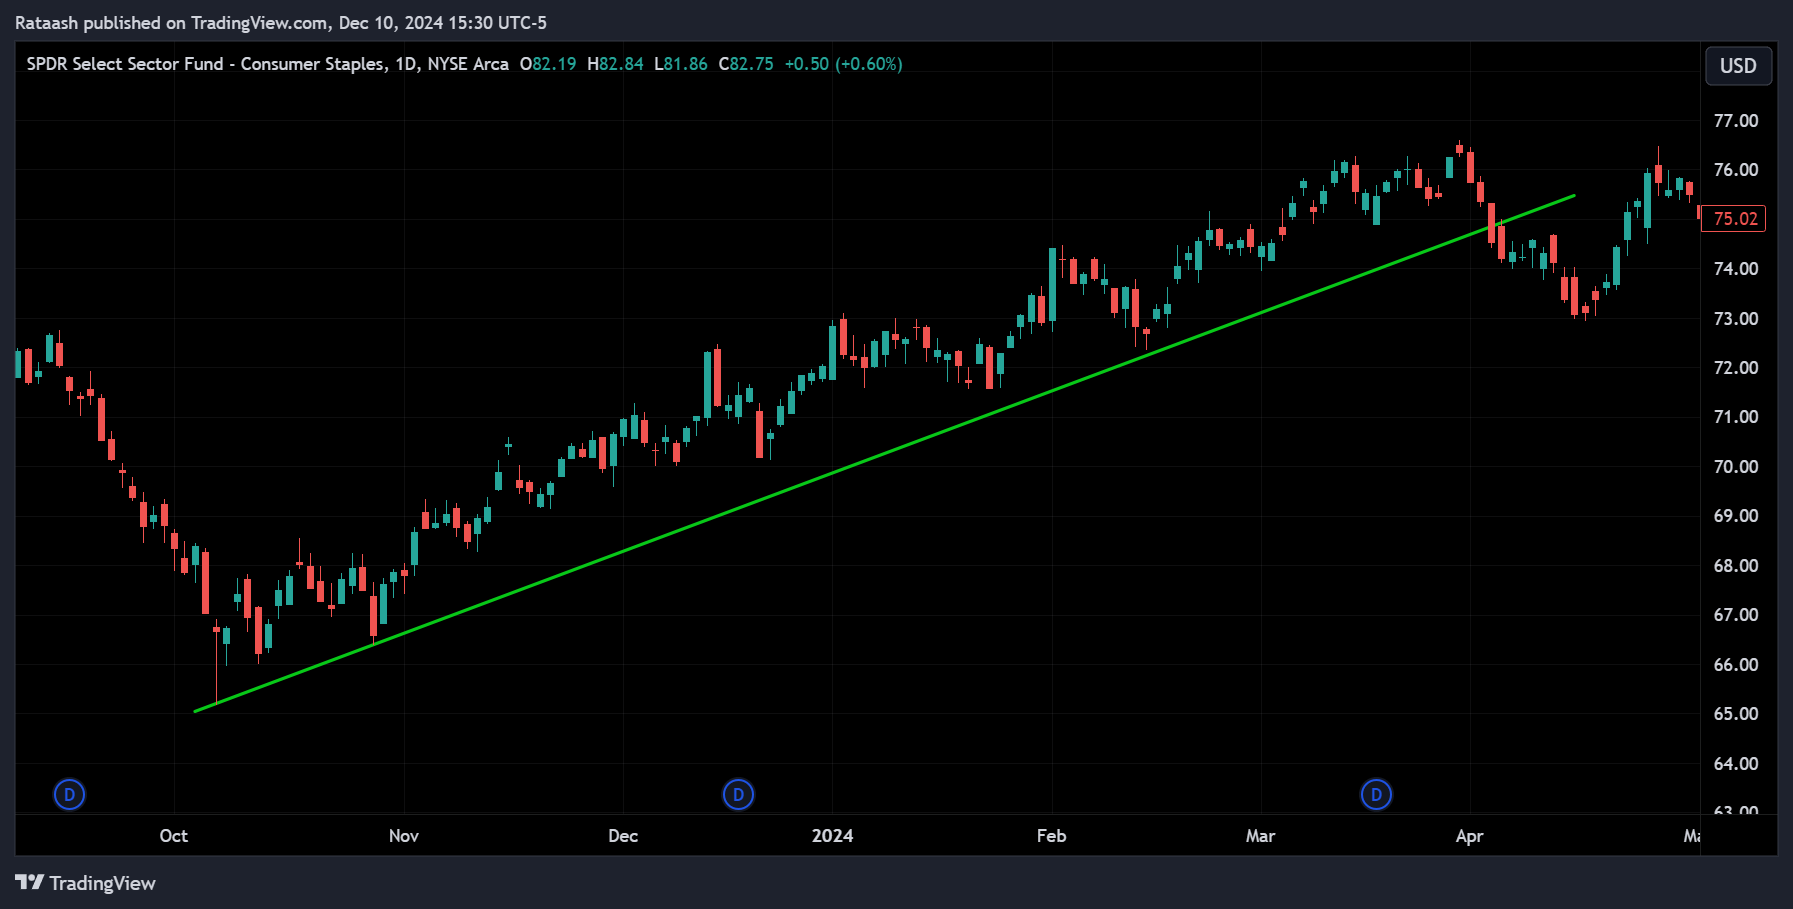
Trendlines are diagonal support or resistance levels drawn by connecting a series of higher lows (for support in an uptrend) or a series of lower highs (for resistance in a downtrend). As long as the price respects the trendline, the trend remains intact.
- Example: In an uptrending stock, you might draw a trendline beneath ascending lows. If the stock price touches the line several times and rebounds, that line acts as a dynamic support level.
Moving Averages
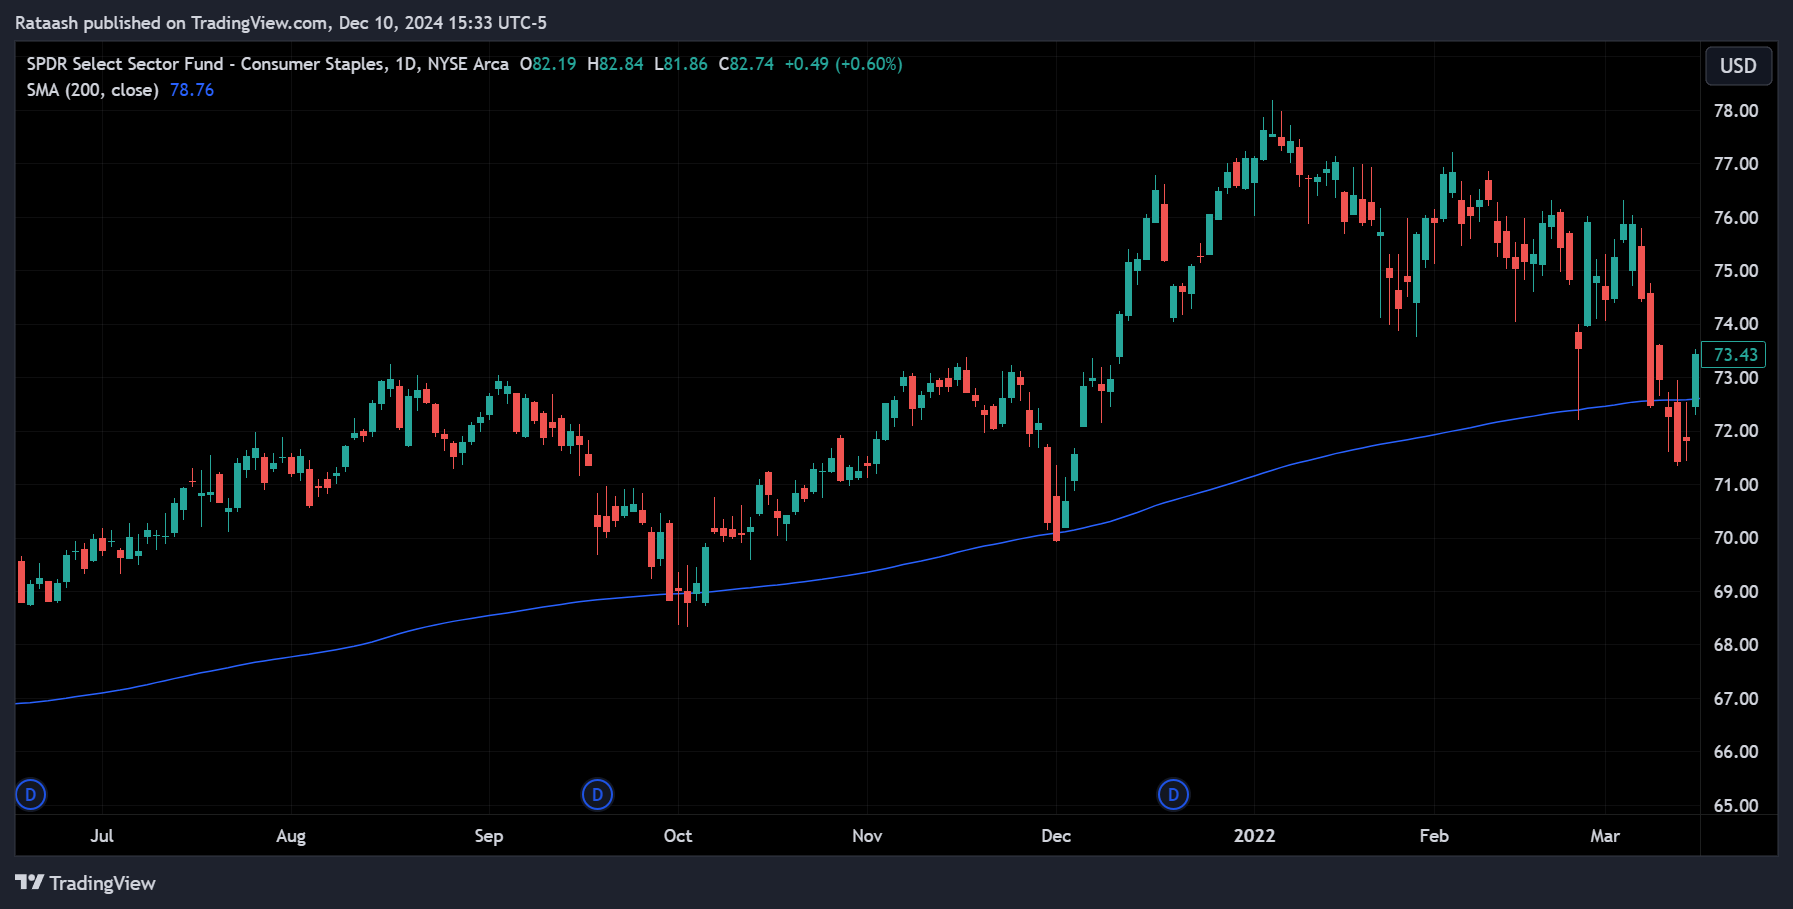
Moving averages (MAs), such as the 50-day or 200-day MA, can serve as dynamic support or resistance. Traders often watch these averages to see if the price bounces off them (acting as support in an uptrend) or gets capped by them (acting as resistance in a downtrend).
- Example: A currency pair repeatedly bouncing off its 50-day moving average can indicate that traders view this MA as a support level. Conversely, if a price struggles to close above the 200-day MA, that moving average could represent strong resistance.
Pivot Points
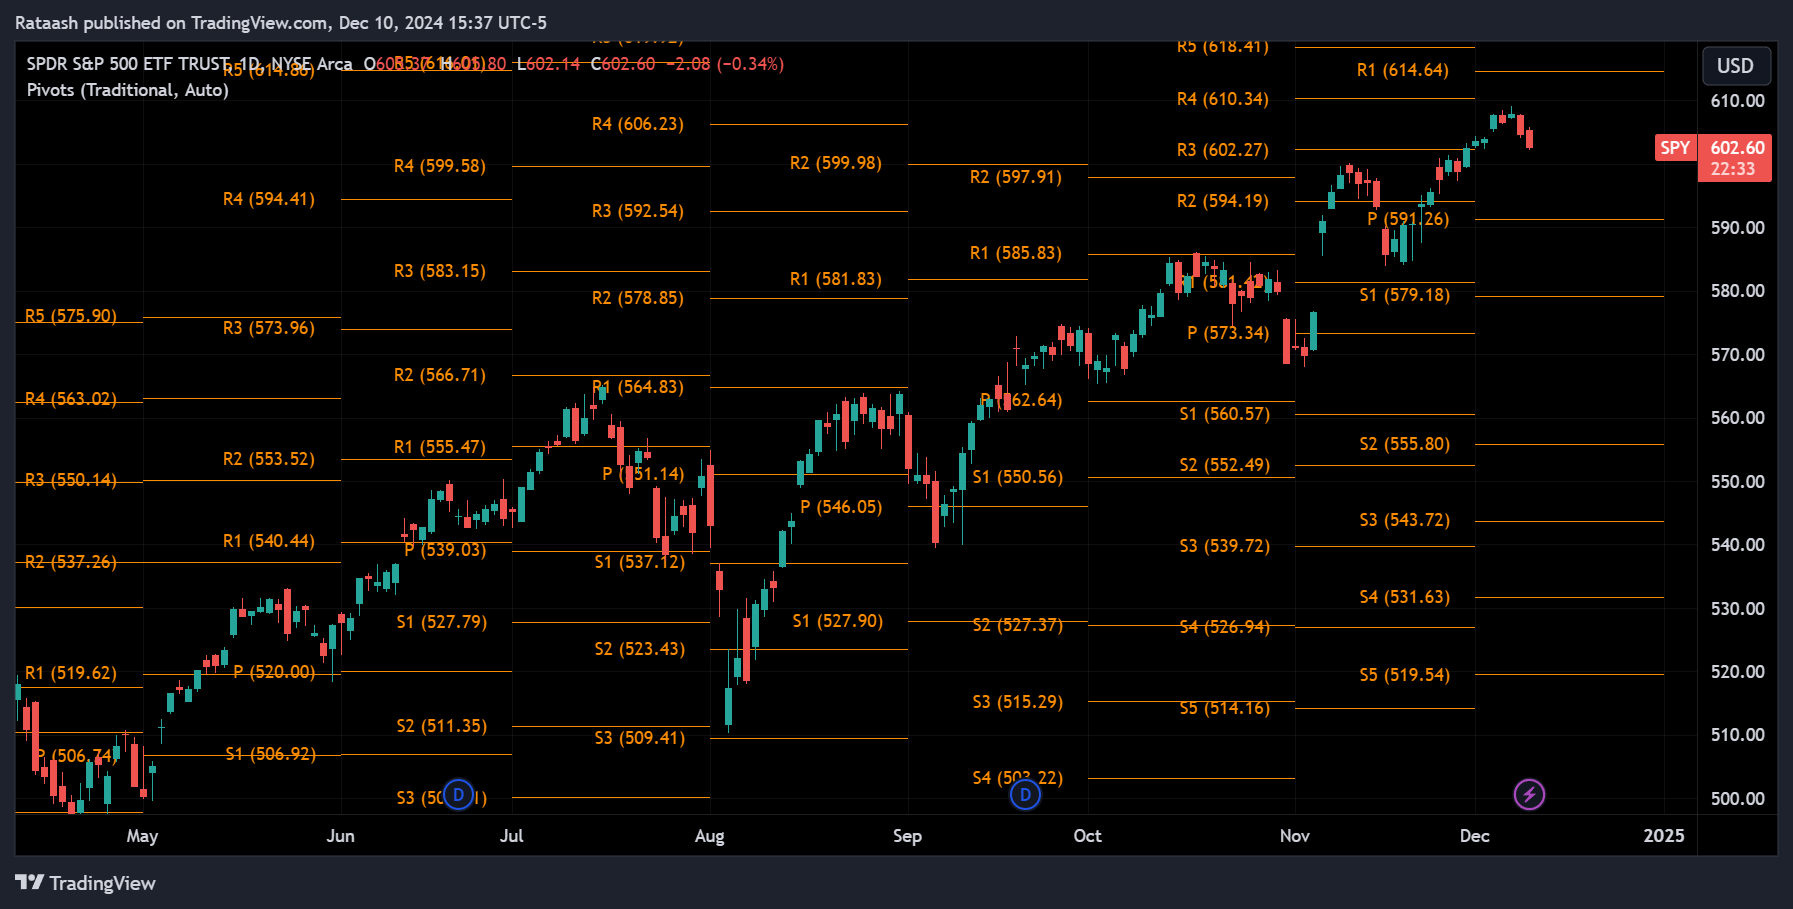
Pivot points are price levels calculated from previous market data (often the previous day’s high, low, and close). These points are widely used in day trading and short-term trading strategies as a quick way to identify potential support and resistance levels for the current trading session.
- Example: If today’s pivot point is $100, the resistance levels might be $102 and $104, and the support levels might be $98 and $96, all derived from yesterday’s price range.
Fibonacci Retracement Levels
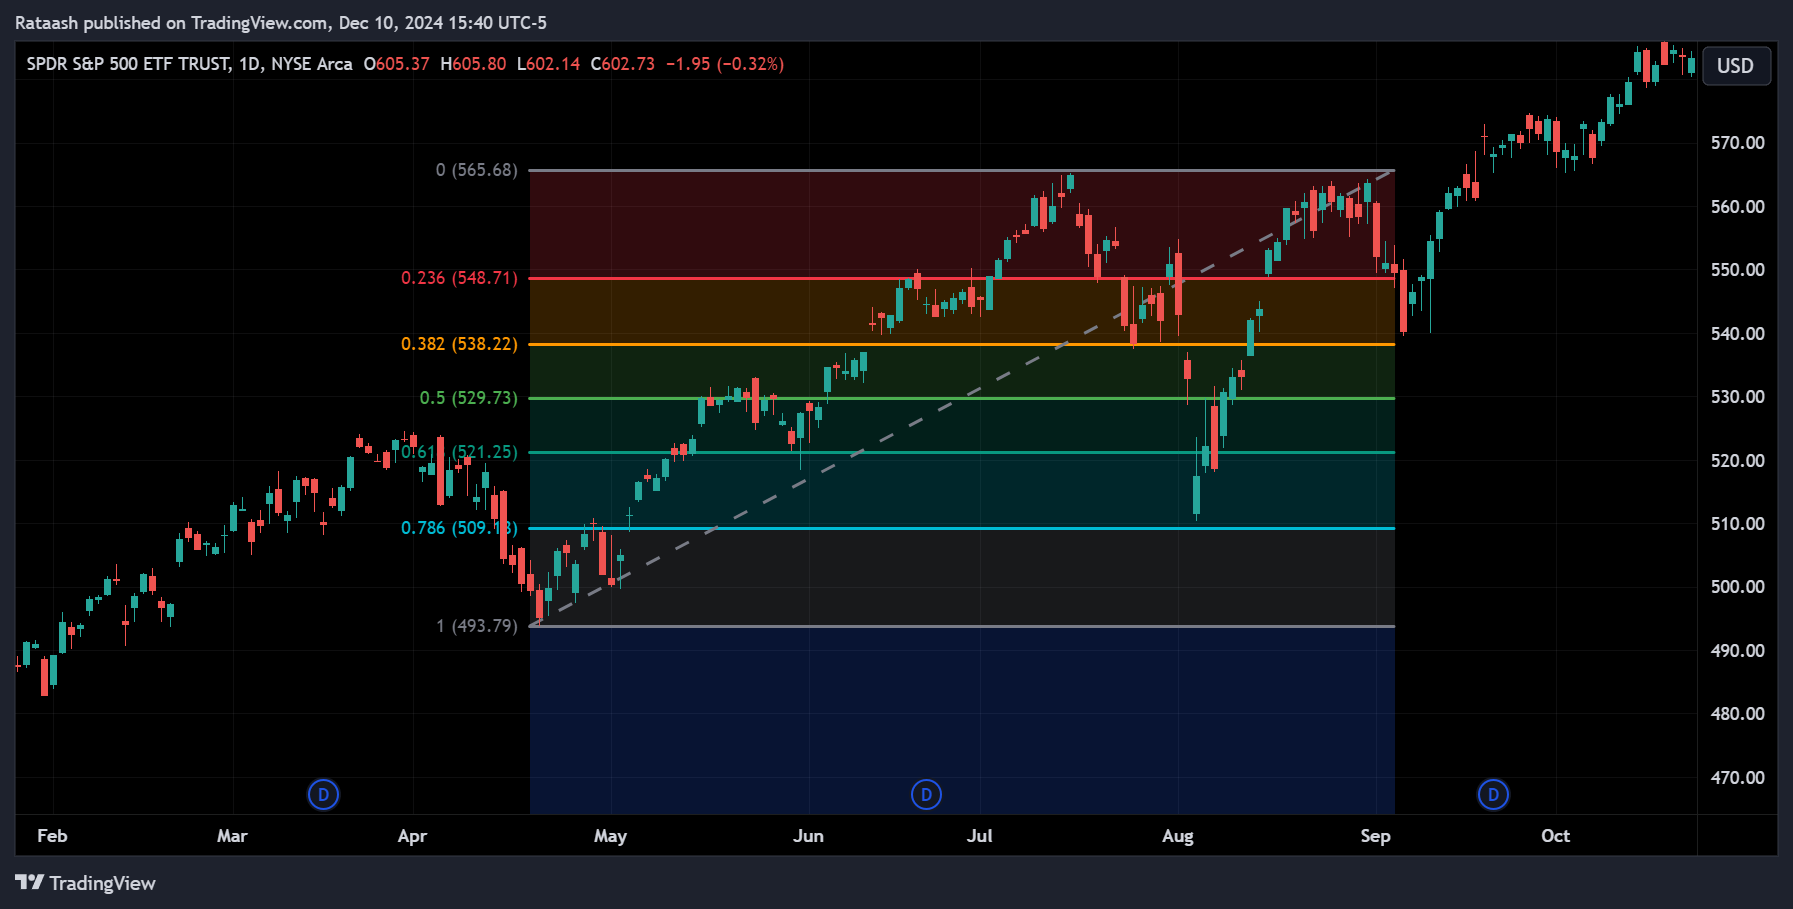
Fibonacci retracements use specific ratio-based levels—like 23.6%, 38.2%, 50%, 61.8%, and 78.6%—between a major market swing high and low. These levels often act as potential support or resistance points as traders pay close attention to them.
- Example: After a significant rally from $1,000 to $1,200 in a stock, a pullback to the 38.2% Fibonacci level (around $1,076) may act as a new support area.
Common Characteristics of Support and Resistance Levels
Not all support and resistance levels are created equal. Certain characteristics can make them more reliable:
- Multiple Touches: The more times a level has caused a price reversal, the more significant it becomes.
- Volume Confirmation: High trading volume near a level often strengthens its importance.
- Time Duration: Levels that have existed for a longer period tend to be more credible.
- Market Context: Aligning support and resistance with other indicators or fundamental events can enhance reliability.
How Support and Resistance Levels Become Stronger or Weaker
Over time, support and resistance levels can evolve. A previously strong support level can be broken, turning it into a new resistance level (and vice versa). A few factors influence this dynamic:
- Market Sentiment Shifts: Changes in investor sentiment due to news, earnings, or economic reports can weaken previous levels.
- Multiple Tests Without Break: If price repeatedly fails to breach a resistance level, that resistance becomes stronger. Similarly, multiple successful defenses of a support level strengthen it.
- Volume Confirmation: If a breakout (above resistance or below support) occurs with high volume, it often confirms the level’s break and reduces its future relevance.
Trading Strategies Using Support and Resistance
There are several strategies traders use to capitalize on support and resistance levels. Below are some popular approaches:
Range-Bound Trading
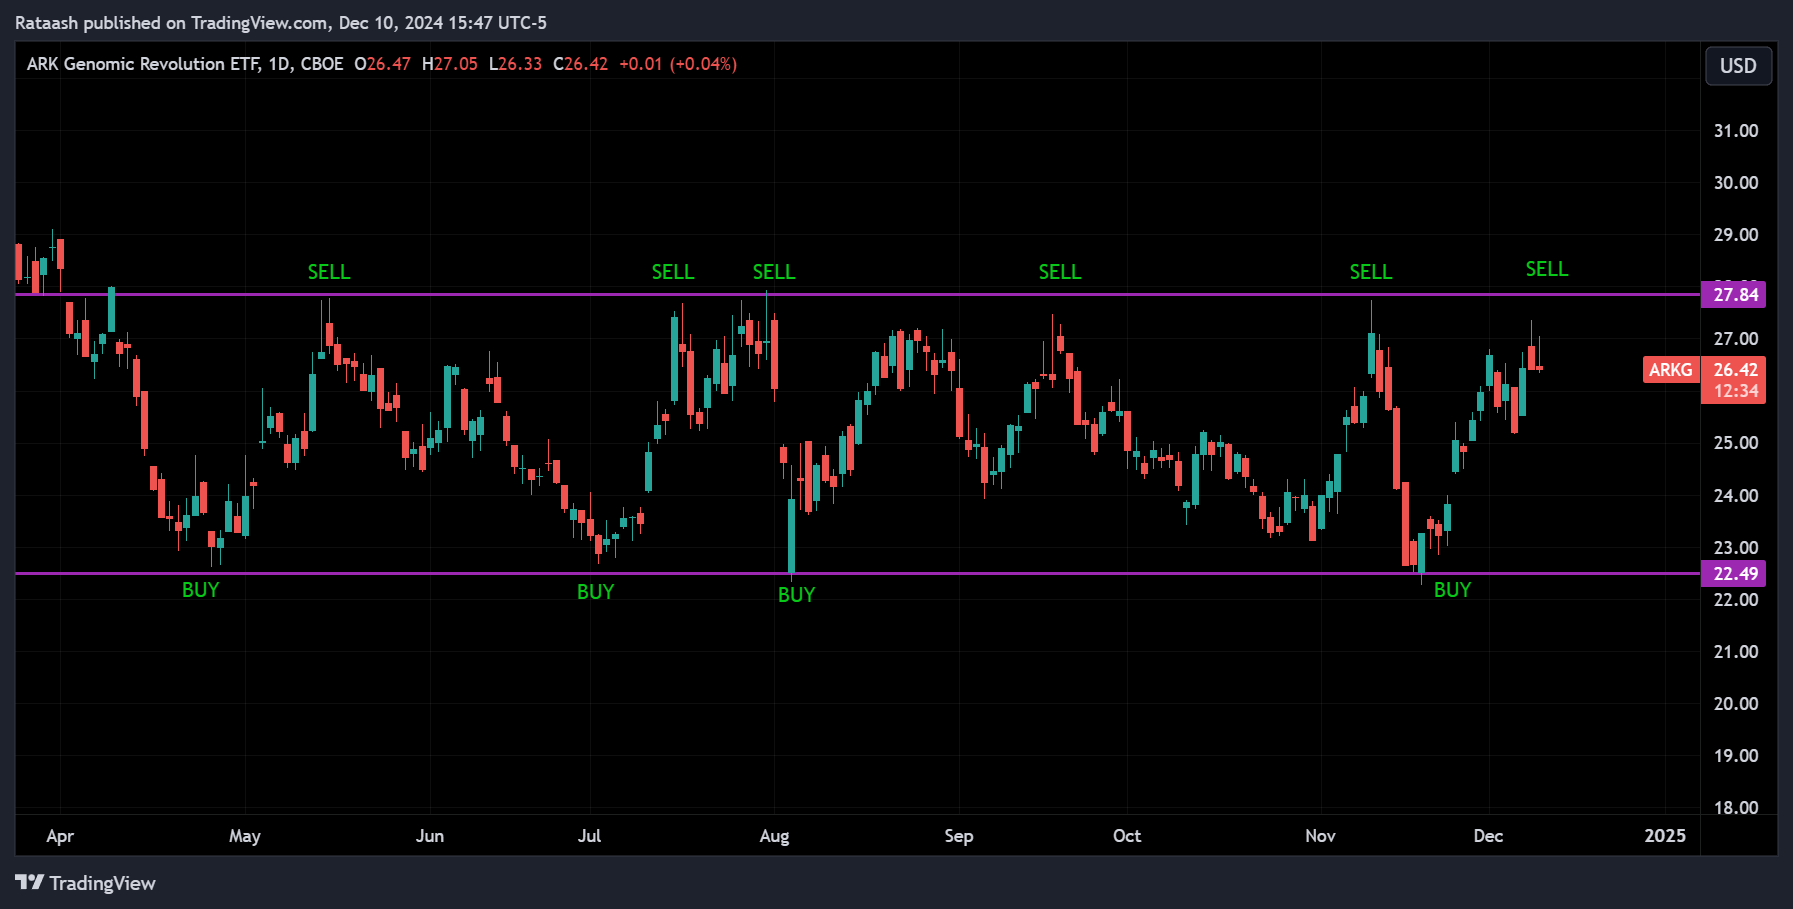
Range-bound trading involves identifying a market that moves sideways between parallel support and resistance levels. Traders can buy near support and sell near resistance to capitalize on predictable price swings.
- Example: A stock oscillates between $50 (support) and $60 (resistance). A range trader might buy at $51 and aim to sell at $59, repeating this until the range breaks.
Breakout Trading
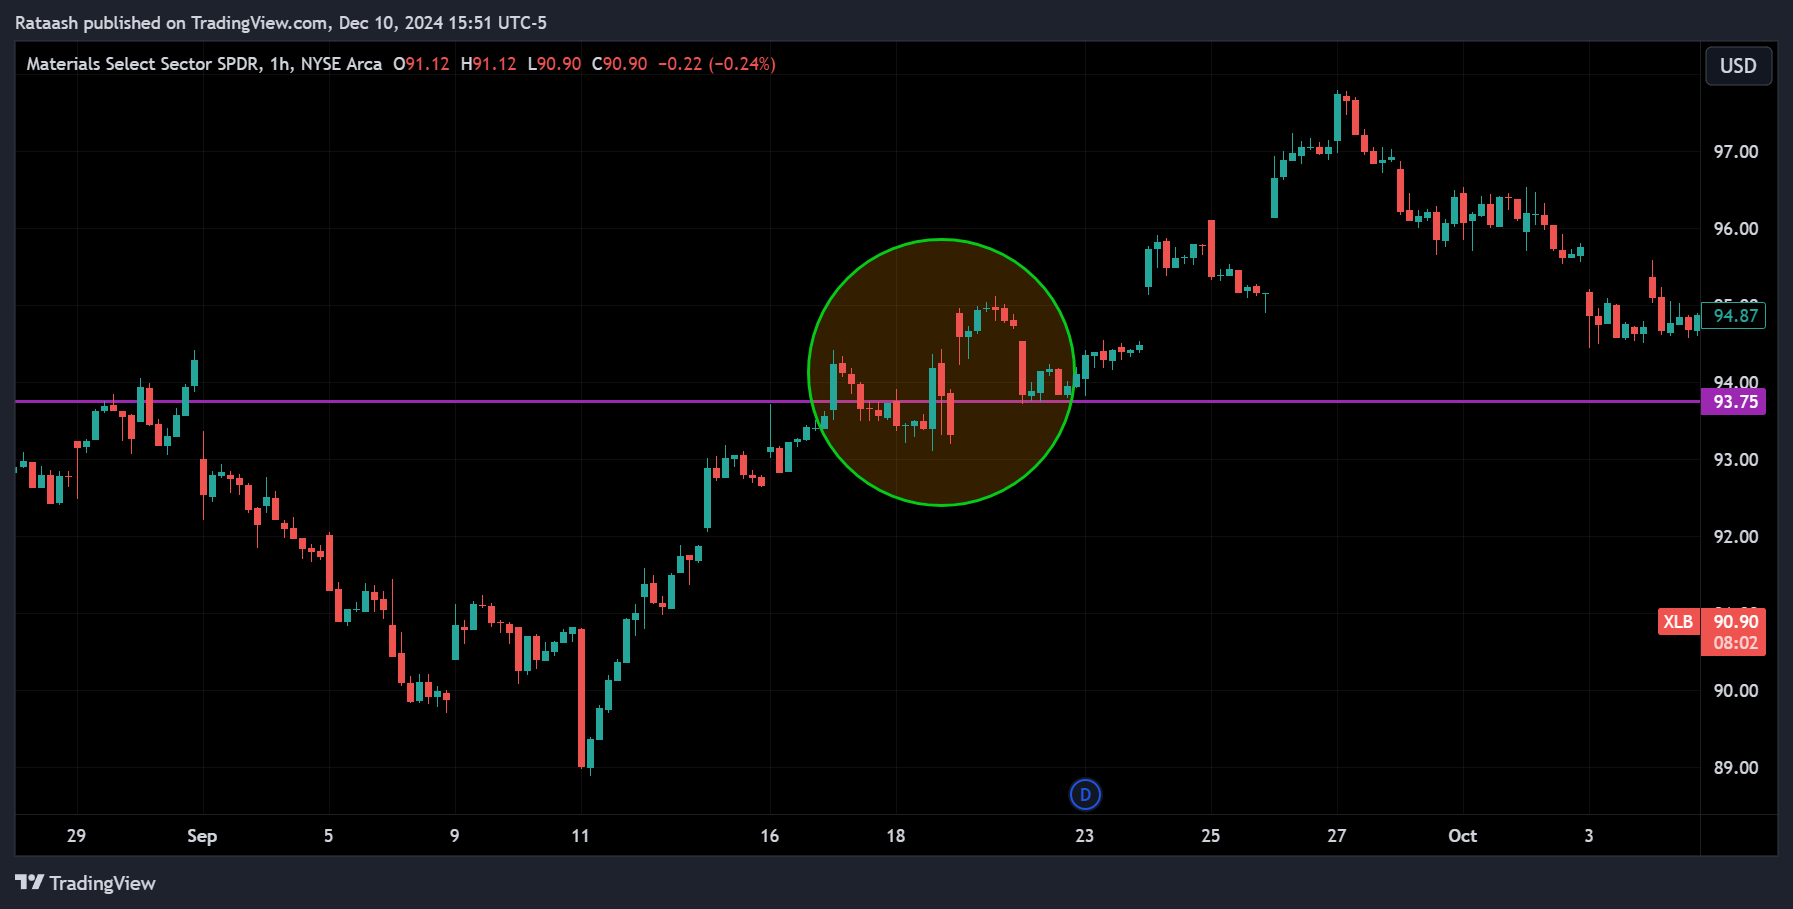
Breakout trading aims to profit when the price breaks through a previously established support or resistance level. A successful breakout can signal the start of a strong trend, offering significant profit opportunities.
- Example: If a currency pair has repeatedly failed to move above $1.3000 and then finally closes above it on strong volume, a breakout trader might enter long, expecting more upside movement.
Bounce Trading
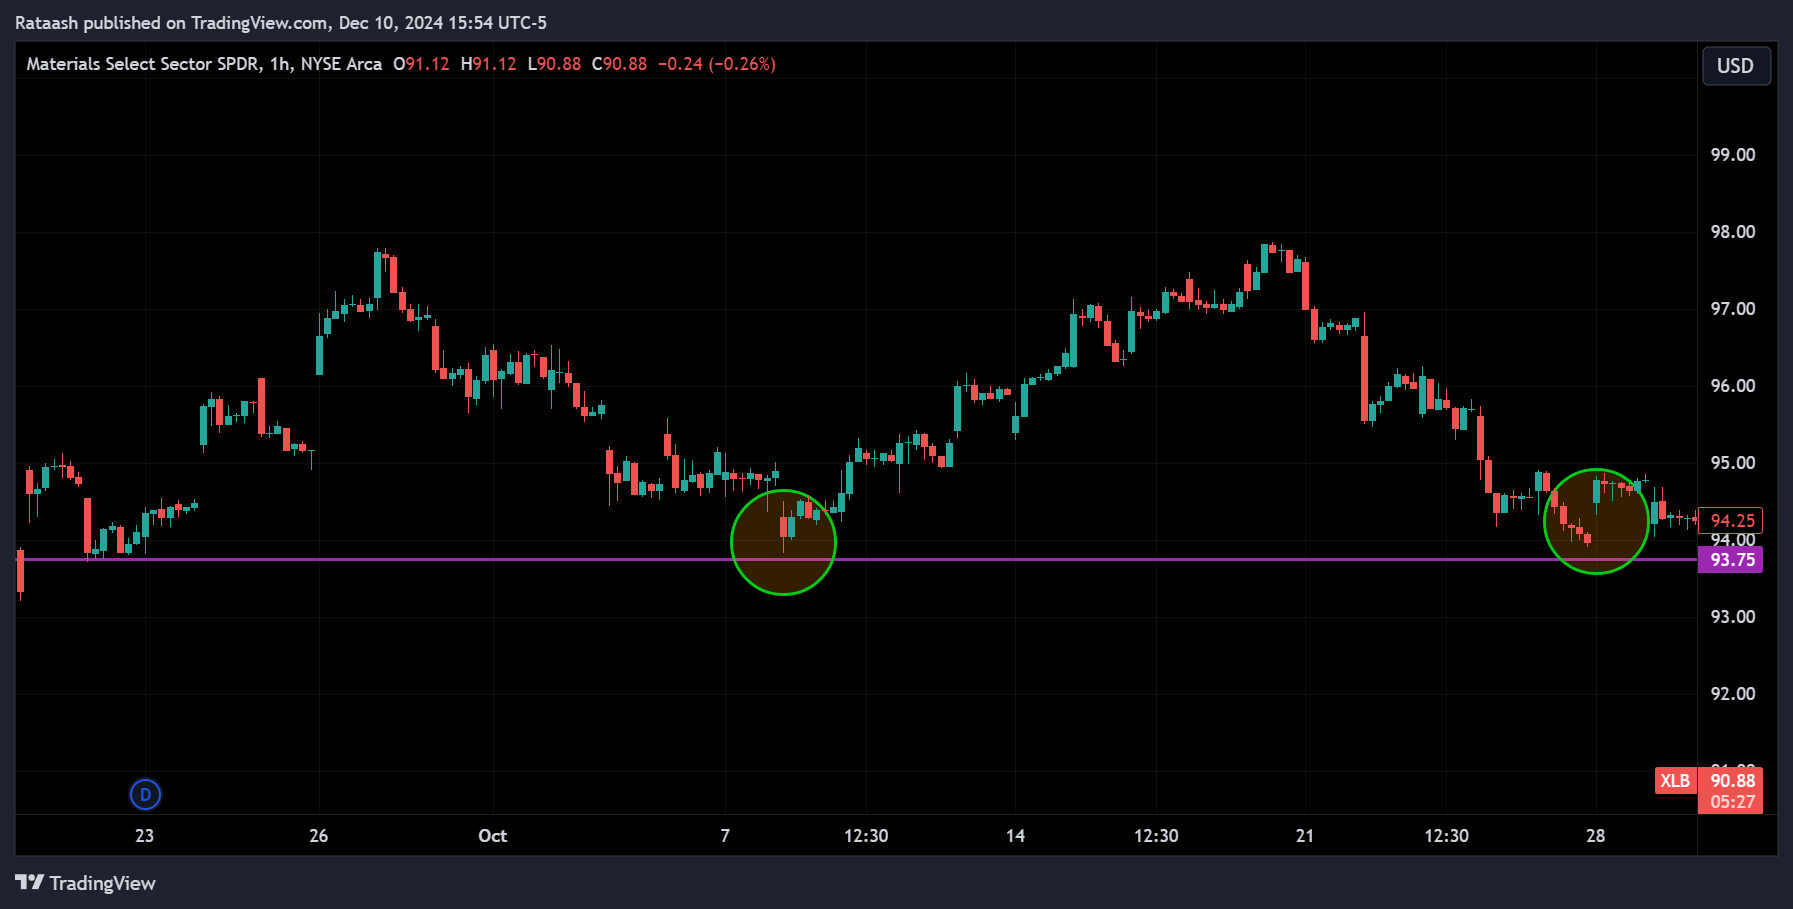
Bounce trading involves waiting for the price to touch a support or resistance level and then enter a trade in the opposite direction of the approach. This strategy aims to profit from short-term reversals at known levels.
- Example: If a commodity price approaches a known support level at $100, a trader might place a buy order just above that level, expecting a bounce back upward.
Confluence Trading
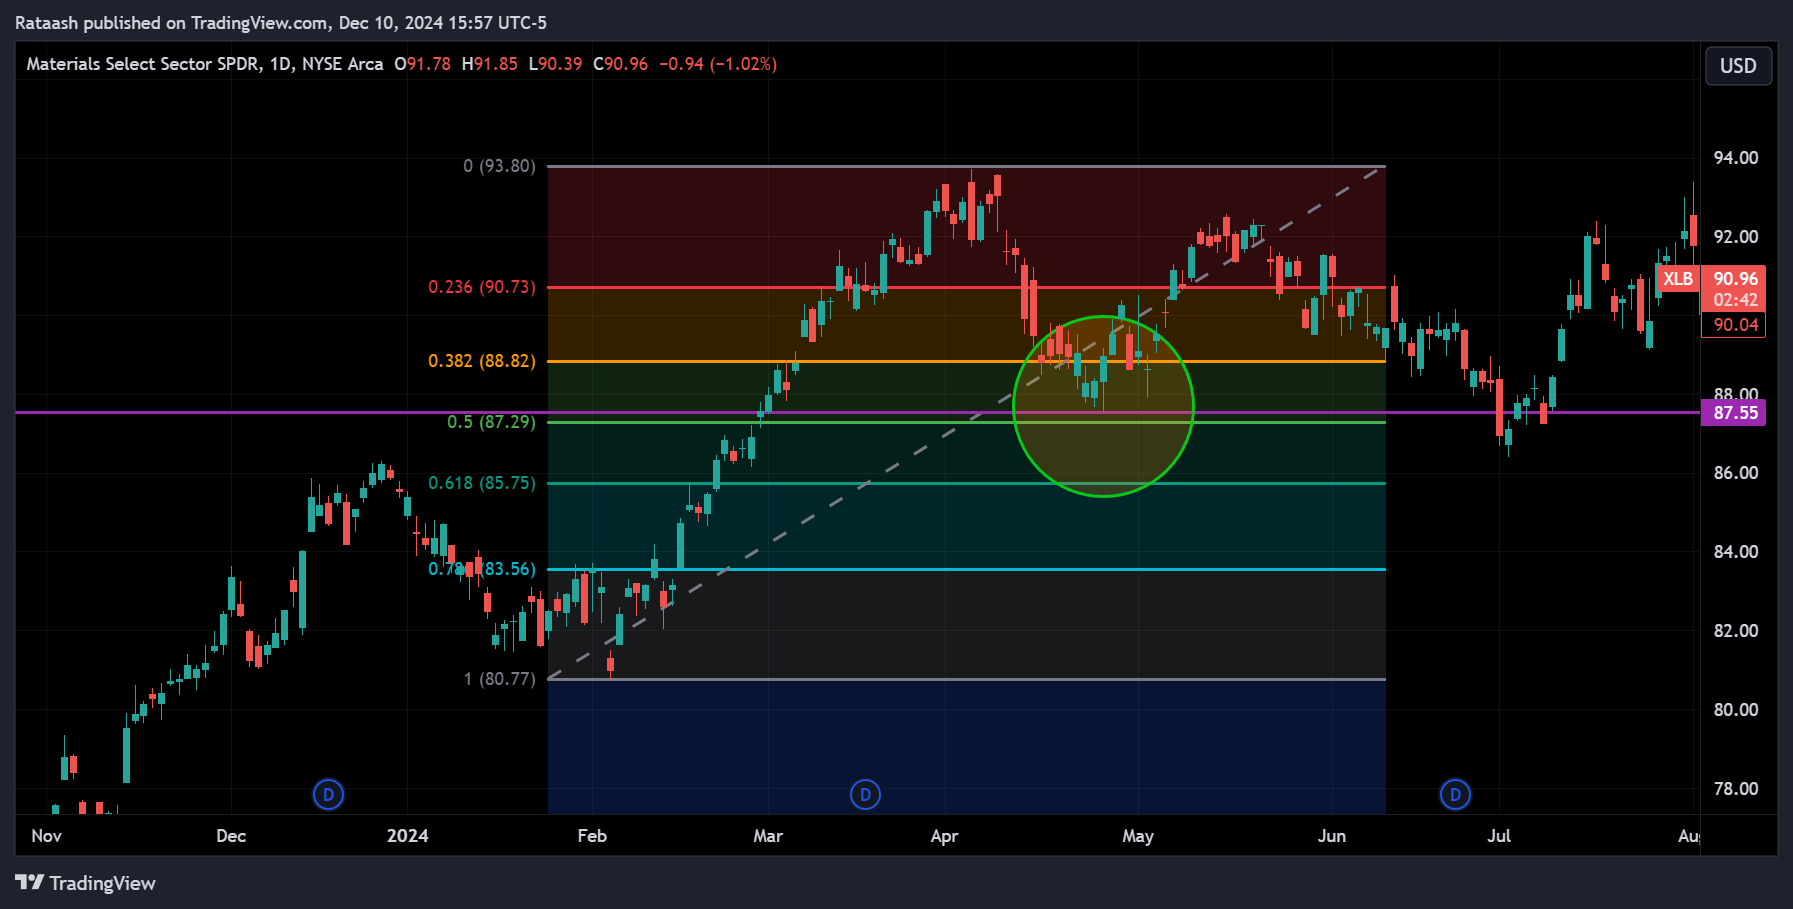
Confluence trading looks for areas where multiple forms of support or resistance overlap. For example, a horizontal support line might coincide with a Fibonacci retracement level and a rising trendline. The more signals that point to a level holding, the stronger the trade setup.
- Example: If a stock’s price is at a Fibonacci retracement level and that same level matches a pivot point and a 200-day moving average, this confluence can create a high-probability bounce scenario.
Risk Management Techniques Around Support and Resistance
Effective risk management is crucial. Support and resistance levels can guide where to place stop-loss orders and profit targets.
- Stop-Loss Placement: If you buy at a support level, place your stop-loss just below it. This ensures minimal loss if the market breaks down. Similarly, if selling at resistance, place your stop just above it.
- Take-Profit Targets: If you are long near support, consider taking profits near the next major resistance. Conversely, if you are short near resistance, aim to close the trade near a key support.
- Position Sizing: Don’t assume a level will always hold. Use proper position sizing so that a single trade won’t significantly harm your capital if the level fails.
Psychology Behind Support and Resistance

The underlying reason support and resistance work often comes down to human psychology and market memory:
- Trader Remorse: Investors who missed buying at a support level may be eager to buy when the price returns to that level. Those who regret not selling at resistance may rush to sell when the price revisits that level.
- Anchoring Bias: Market participants remember certain price points as “cheap” or “expensive,” creating repeated reactions at these levels.
- Self-Fulfilling Prophecy: Because many traders observe and anticipate these levels, they often become self-fulfilling. When enough participants focus on a certain level, it can effectively influence market behavior.
Common Mistakes to Avoid
Even with a solid grasp of support and resistance, it’s easy to make mistakes. Some common pitfalls include:
- Blindly Trusting One Indicator: Avoid relying solely on support and resistance lines. Confirm levels with volume, trendlines, or other technical indicators.
- Ignoring Market Context: A support level formed in a bullish environment may break easily during a sudden bearish shift.
- Not Adjusting Levels Over Time: Markets evolve. Keep updating your analysis as new price information emerges.
- Overlooking the Concept of Zones: Support and resistance aren’t always exact lines; they often form zones. Don’t expect price to reverse at a single point down to the penny.
Practical Examples of Support and Resistance Analysis
Example 1: Stock Trading
Imagine a technology stock trading between $95 and $105 for several weeks. Every time it approaches $95, it bounces back up, indicating a strong support. When it nears $105, sellers come in, pushing the price back down, establishing a reliable resistance. A trader noticing this pattern might buy at $96 and sell at $104 repeatedly until a breakout occurs.
Example 2: Forex Pair
Consider a EUR/USD currency pair that struggles to break above 1.2000 for months. Traders and algorithms alike watch this level. If the pair finally breaks 1.2000 on a bullish European Central Bank announcement and strong volume, this previous resistance might become a new support. Traders could then consider buying dips back to 1.2000, expecting it to hold as support.
Example 3: Cryptocurrency Market
In a volatile cryptocurrency, let’s say Bitcoin forms a strong support around $30,000 due to institutional buying. Each time the price dips near this level, bullish sentiment returns. Meanwhile, a resistance level at $35,000 has repeatedly stopped upward momentum. Knowing these levels, a crypto trader can plan trades—buying near $31,000 with a stop at $29,500, and taking profits near $34,500 before it hits the $35,000 resistance.
Tips for Long-Term Success
- Combine Multiple Tools: Enhance your analysis by combining support and resistance with trendlines, moving averages, volume profiles, or oscillators like RSI and MACD.
- Learn to Recognize Zones Rather Than Lines: Treat support and resistance as approximate areas instead of precise numbers. This approach reduces premature trades.
- Practice Patience: Don’t rush into trades. Wait for the price to come to your identified level and confirm the reversal before entering.
- Use Higher Time Frames for Reliability: Support and resistance levels identified on daily or weekly charts tend to be more robust than those on shorter intervals.
- Keep a Trading Journal: Document trades taken around key levels to refine your strategy, learn from mistakes, and improve over time.
- Stay Flexible and Adaptable: The market is dynamic. Update your support and resistance levels as conditions change, and never marry a single perspective.
Conclusion
Mastering support and resistance is a key milestone on your journey as a trader. These fundamental concepts help you understand market structure, improve timing on entries and exits, and manage risk more efficiently. By learning how to identify, interpret, and trade these levels—and by avoiding common pitfalls—you can significantly enhance your probability of long-term success.
Support and resistance are more than just lines on a chart; they’re reflections of market psychology, patterns of buying and selling pressure, and historical price memory. Incorporating these levels into your strategy, along with sound risk management and a comprehensive technical analysis toolkit, can make you a more confident, disciplined, and profitable trader.
In essence, support and resistance form the backbone of technical analysis. By investing time to master these concepts, you set a strong foundation for making informed, strategic decisions that stand the test of changing market conditions.
