Fundamental Analysis for Stocks might sound like a complex term, but at its core, it’s all about determining what a company is truly worth by analyzing its business operations and the broader economy. By examining key factors like financial statements, industry trends, and management effectiveness, you can assess whether a stock is undervalued, fairly valued, or overvalued. Once you have a clear understanding of a company’s intrinsic value, you can compare it to the current market price and make an informed decision on whether to buy, hold, or sell.
This guide will break down Fundamental Analysis for Stocks in a simple and practical way, covering everything from how it differs from technical analysis to interpreting financial statements, using key financial ratios, and evaluating both individual companies and their industries. We’ll also go over different valuation methods, common mistakes to avoid, and actionable steps to build a strong, long-term investment portfolio. By the end of this article, you’ll have a solid grasp of how to analyze stocks effectively and make smarter investment decisions.
Table of Contents
Introduction

If you’ve ever asked yourself, “Is this company really worth what it’s trading for?” then fundamental analysis is the tool you need. In simple terms, fundamental analysis tries to figure out a company’s actual worth by digging into its:
- Financial health (like revenue, earnings, and cash flow)
- Future growth prospects (like market expansion, product development, etc.)
- Overall economic and industry conditions
- Qualitative factors (such as the skill of management and the strength of the brand)
This style of analysis is often used by long-term investors. It’s based on the idea that while stock prices can swing wildly in the short run because of fear, hype, or global events, they’ll eventually reflect the company’s real value over time. By combining a big-picture view (like the state of the economy or an industry as a whole) with the nitty-gritty details of a company’s finances, you can feel a lot more confident in your decision to buy or sell a stock.
You don’t need to be a certified accountant or an economics professor to grasp fundamental analysis. Sure, you’ll be looking at things like financial statements and industry patterns, but the main point is understanding how a company makes money, how stable that income is, and whether that business can keep growing. That’s the heart of fundamental analysis.
Throughout this article, we’ll explore each piece of fundamental analysis in a relaxed, clear way—no complicated jargon or super-technical language. You’ll learn how to read key financial documents, spot potential warning signs, compare companies, and figure out if a stock is worth its current price or if it might be undervalued or overvalued. By the time you’re done reading, you should have a solid toolkit for examining stocks the way professional analysts do, but without all the unnecessary fluff.
Fundamental vs Technical Analysis
| Aspect | Fundamental Analysis | Technical Analysis |
|---|---|---|
| Focus | Evaluates a company’s financial health & intrinsic value | Analyzes price patterns, trends, and trading volume |
| Time Horizon | Long-term (months to years) | Short-term (minutes to weeks) |
| Main Goal | Identify undervalued or overvalued stocks | Predict short-term price movements |
| Data Used | Financial statements, industry trends, economy | Price charts, indicators, and trading volume |
| Key Tools | Income statement, balance sheet, cash flow statement | Moving averages, RSI, MACD, candlestick patterns |
| Decision Basis | Business performance, competitive advantage, management quality | Market trends, historical price movements |
| Best For | Long-term investors, value investors | Traders, short-term investors |
| Example Question | “Is this stock undervalued based on its earnings and growth potential?” | “Is this stock about to break out based on chart patterns?” |
| Risk Level | Lower risk (focuses on stable, well-researched investments) | Higher risk (reacts to market fluctuations) |
| Common Users | Investors who focus on company fundamentals and long-term value | Day traders, swing traders, and momentum traders |
When people talk about stock market analysis, they usually mention two main approaches: fundamental analysis and technical analysis.
Fundamental Analysis
- What It Focuses On: The company’s business, financials, industry position, and broader economic factors.
- Goal: Figure out the company’s real worth (its intrinsic value) and compare it to its current stock price.
- Approach: Long-term. If you believe the intrinsic value is higher than the market price, you might invest and wait for the market to catch up.
Technical Analysis
- What It Focuses On: Price charts and trading volume. It looks at patterns and trends in the stock’s price movements, assuming that these can hint at where the price might go next.
- Goal: Find the right time to buy or sell based on chart signals, support/resistance levels, and trend lines.
- Approach: Often more short-term, though some investors mix technical signals with long-term fundamental beliefs.
Both methods can be useful in different ways. For example, you might decide on a company based on its fundamentals but then use certain chart patterns to pick a good entry point for your purchase. However, if you’re focused on building wealth over the long haul, fundamental analysis usually takes center stage, since it helps you understand what you’re really buying—a piece of a business, not just a price on a chart.
Key Principles of Fundamental Analysis

Fundamental analysis rests on a few big ideas that guide how investors approach it:
- Intrinsic Value
This is the concept of a stock having a “true” value, regardless of what the market currently thinks. Intrinsic value is based on a company’s cash flow, growth potential, and risk level. If your analysis says a stock’s worth more than it’s trading for, that might signal a chance to buy. - Margin of Safety
Popularized by Benjamin Graham, this is about not just buying a company when it’s slightly cheaper than your best guess of its value, but instead aiming for a significant discount. That extra room helps protect you if your assumptions about growth or risk end up being off. - Long-Term Focus
Short-term swings in stock prices can be driven by fear, excitement, or random events, but over time, a company’s stock price usually reflects its actual business performance. Fundamental analysis is typically more about the next five or ten years, not the next five days. - Both Numbers and Intangibles Matter
Yes, looking at revenue, earnings, and profit margins is crucial. But so is checking out things like the CEO’s experience, the company’s brand loyalty, or whether it has a big competitive advantage that others can’t easily copy. - Compare to Past Performance, Peers, and Industry
You usually don’t look at a company’s figures in a vacuum. Instead, you compare them to where they were last year or how they stack up against other players in the same industry. - Overall Economic Picture Counts
Even if a company itself is great, a recession or major shift in consumer spending can hurt sales. So, it’s important to also look at the bigger economic trends and industry-wide changes.
By keeping these principles in mind, you can ground your analysis in reality and not get caught up in hype or panic. Fundamental analysis is about staying rational, asking the right questions, and basing your decisions on the underlying business rather than noise in the market.
Understanding Financial Statements
Financial statements are like a window into a company’s financial life. They show you how much money is coming in, where it’s going out, and what the company owns or owes at a given point in time. The main ones to focus on are:
- The Income Statement (also called the Profit and Loss Statement)
- The Balance Sheet
- The Cash Flow Statement
Reading these might seem daunting at first, but once you break them down into simpler parts, you’ll see they’re just telling a story about the company’s financial health.
Income Statement
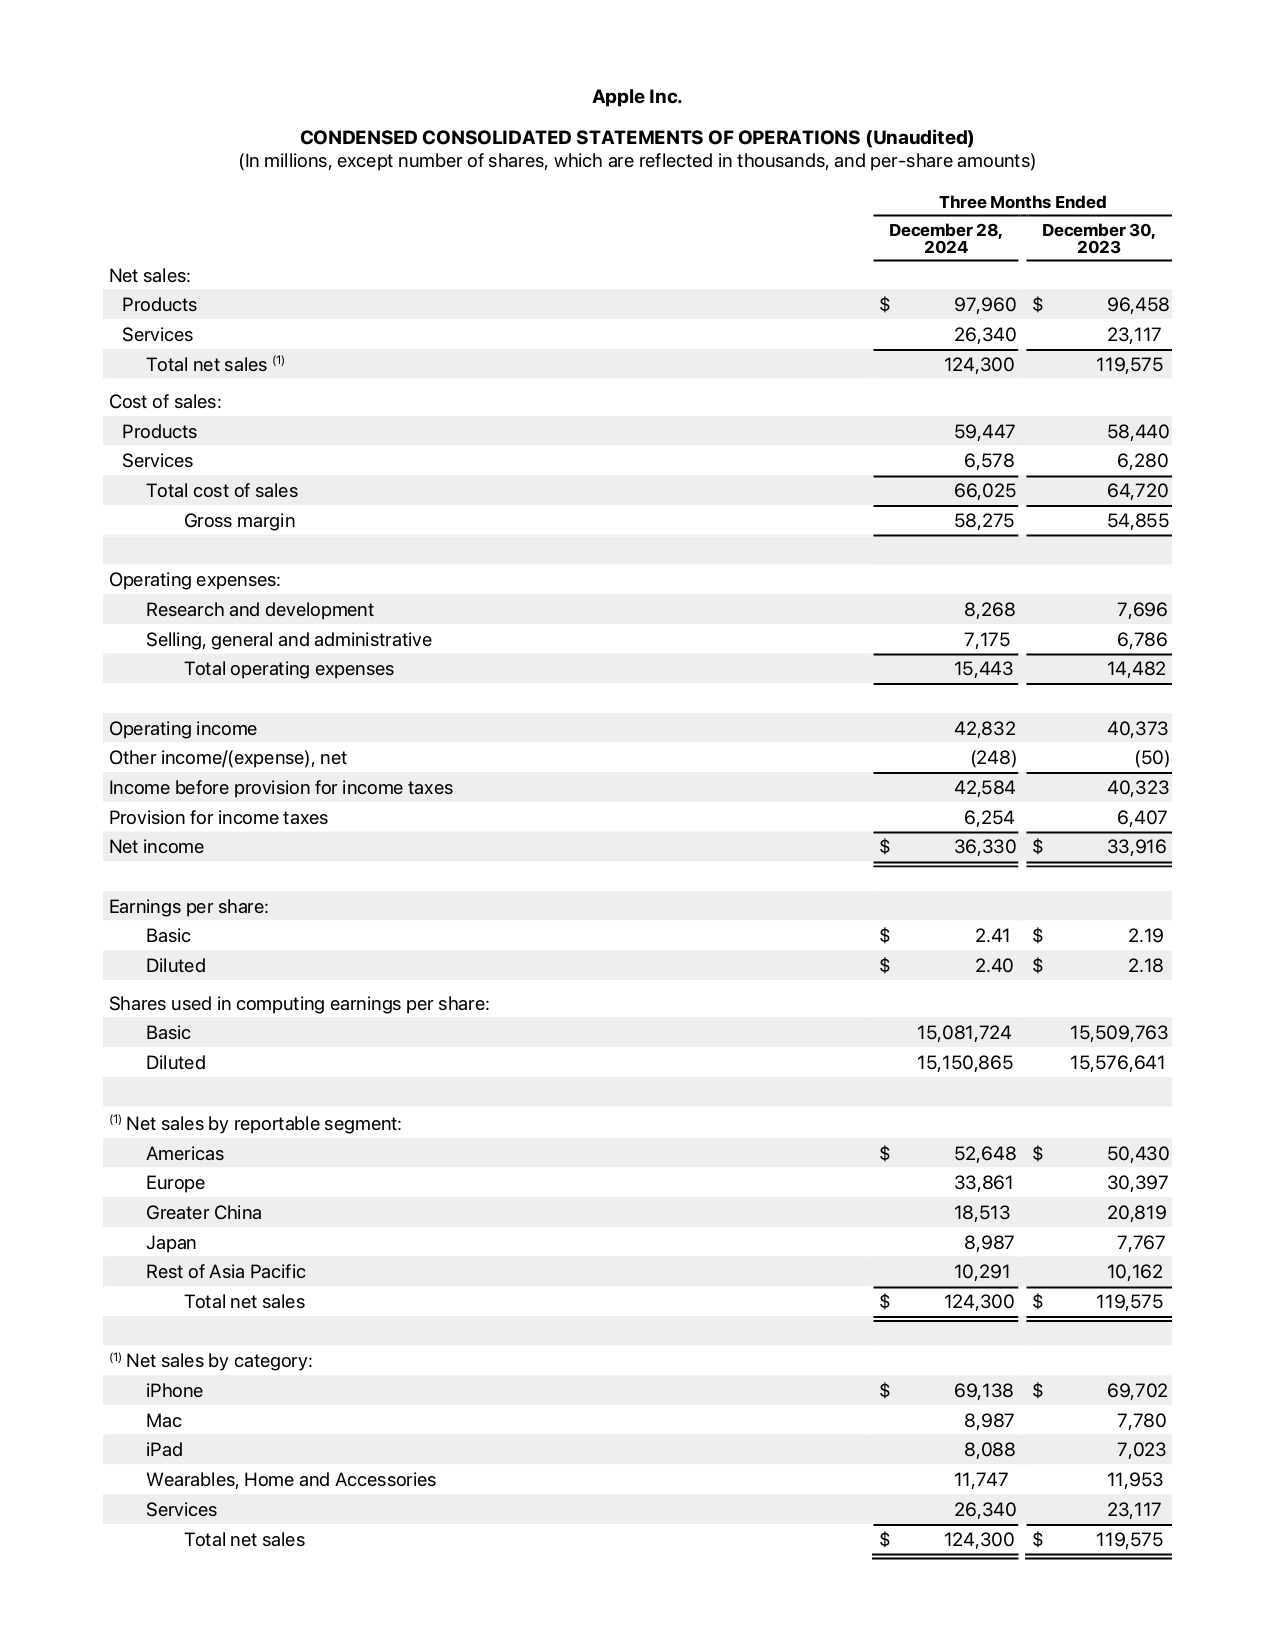
The income statement tracks a company’s income and expenses over a certain period (usually a quarter or a year) and ends with the net profit or loss. Key items include:
- Revenue: This is the total money the company earned from selling its products or services. Watching revenue over time can show you if the company is growing or shrinking.
- Cost of Goods Sold (COGS): These are the direct costs of making or delivering the product or service (like materials or manufacturing costs).
- Gross Profit: This is Revenue minus COGS. It tells you how much money is left after covering those direct costs.
- Operating Expenses: These can include marketing, research and development, administrative costs, and more.
- Operating Income (also called EBIT): This is the money earned from the company’s main operations, after subtracting operating expenses. It’s often viewed as a good measure of how healthy the core business is.
- Net Income: Also known as the bottom line. This is the final profit (or loss) after all expenses, including taxes and interest, have been taken out.
When you check out an income statement, it’s helpful to look at multiple years or quarters. Do you see a consistent uptrend in revenue and net income? Are costs rising faster than revenue? This can point to efficiency issues or good management if costs are kept in line.
Balance Sheet
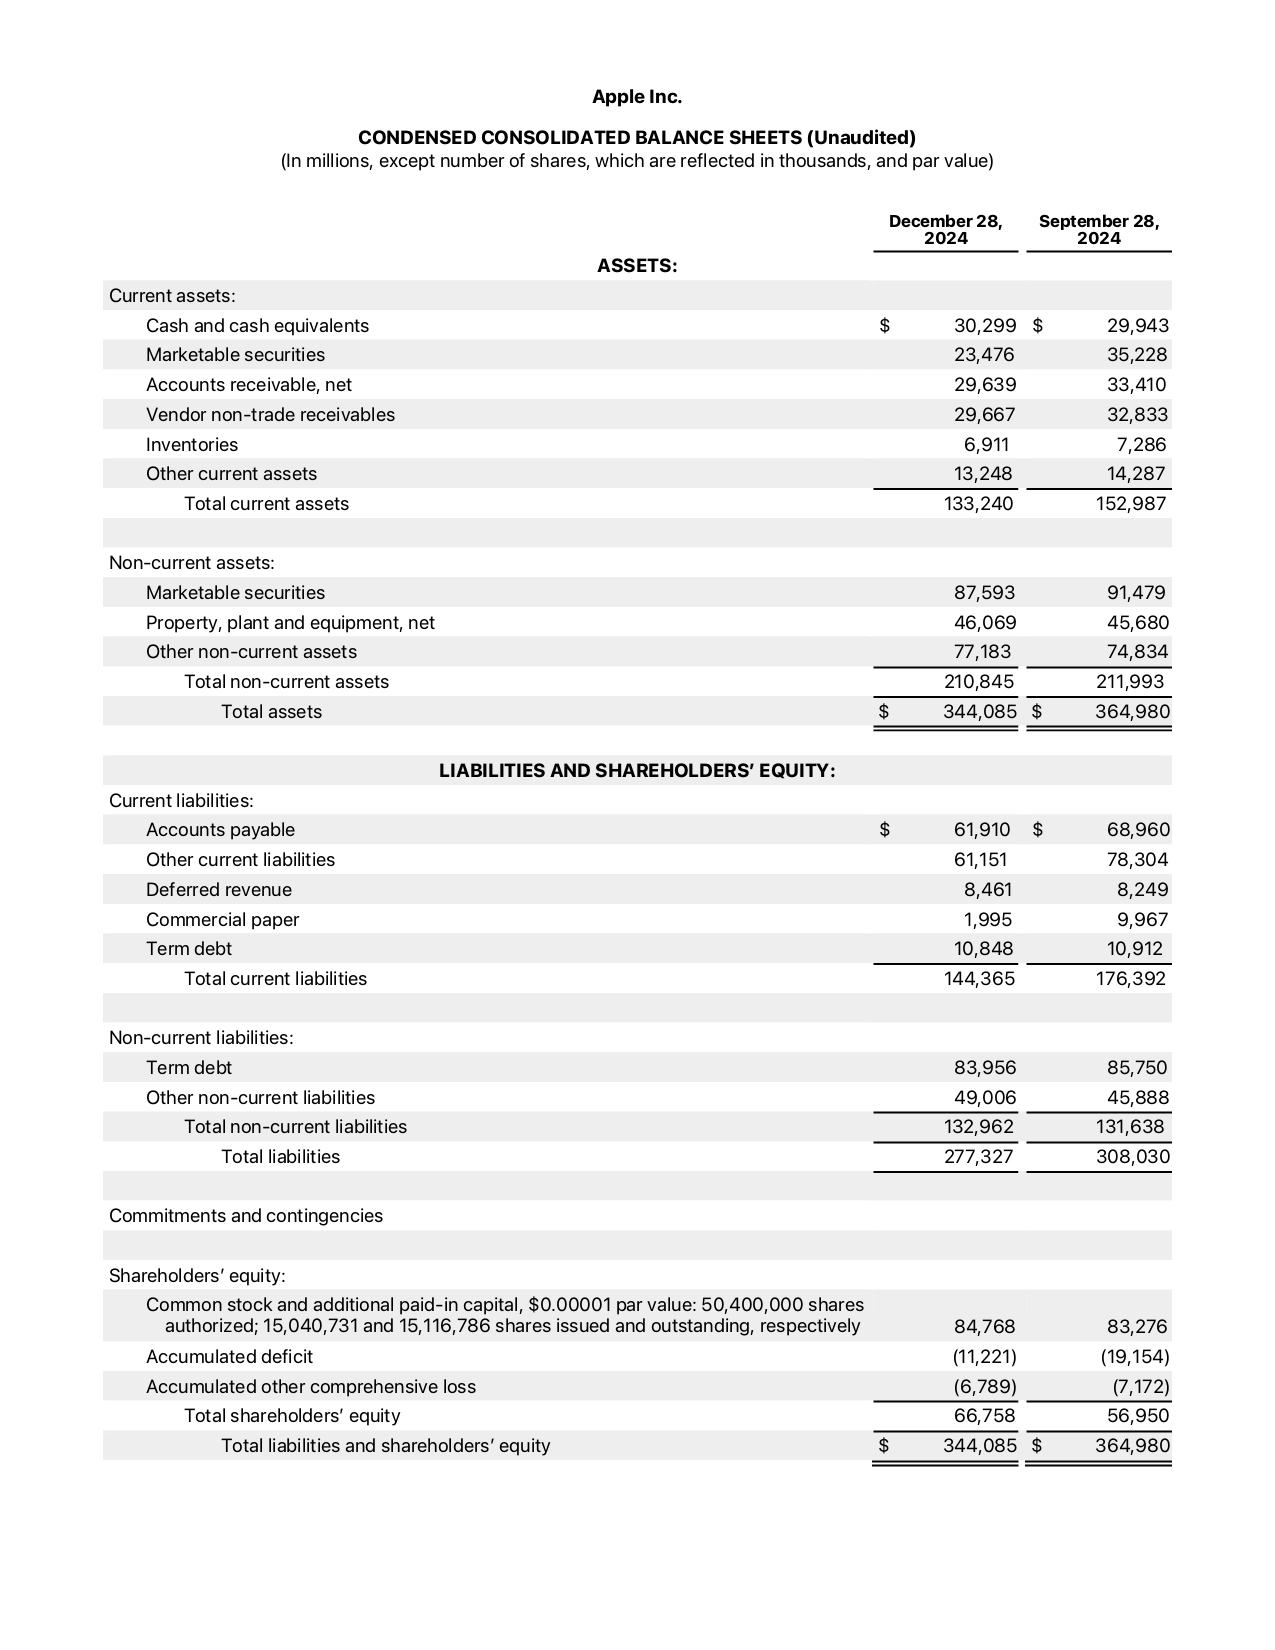
A balance sheet offers a snapshot of what the company owns (assets), what it owes (liabilities), and what’s left over for shareholders (equity) at a specific point in time. The basic formula is:
Assets = Liabilities + Shareholders’ Equity
- Assets: These include things like cash, inventory, property, equipment, and anything else that can provide future value.
- Liabilities: These are debts or obligations—like loans, accounts payable, or bonds.
- Shareholders’ Equity: This is the net worth of the company after liabilities are subtracted from assets. It includes retained earnings, which are the company’s accumulated profits reinvested back into the business.
A strong balance sheet usually has enough assets to cover short-term obligations, meaning the company is unlikely to face immediate cash problems. It also tends to have a manageable level of debt. Too much debt can be risky because economic downturns or drops in sales can make those debt payments hard to cover.
Cash Flow Statement
The cash flow statement tracks the actual cash that moves in and out of a company over a certain period. This is important because a company can look profitable on an income statement (thanks to accounting rules) but still struggle to generate real cash. The statement usually has three sections:
- Cash Flow from Operating Activities: Cash generated or used from the company’s main business activities—like cash received from customers and cash paid to suppliers or employees.
- Cash Flow from Investing Activities: Cash spent on or gained from buying or selling long-term assets (like equipment or real estate), or from acquisitions.
- Cash Flow from Financing Activities: Cash that comes from issuing or repaying debt, issuing stock, or paying dividends.
This statement helps you see how “real” the earnings are. For example, if net income is high but the company’s operating cash flow is consistently negative, it might mean they’re booking sales on paper but not collecting enough cash. That can be a red flag.
Why All Three Matter
By combining the income statement, balance sheet, and cash flow statement, you can paint a complete picture of a company’s health. You’ll see:
- How much profit the company is making.
- Whether it can handle its short-term bills and long-term debts.
- How effectively it’s turning profits on paper into actual cash in the bank.
If something looks off in one statement, the other statements might explain why. For example, a big jump in net income alongside negative cash flow could show that sales are mostly on credit, or the company has big expenses it hasn’t fully recognized yet. Always take a holistic view.
Key Financial Ratios and How They Help
Financial ratios turn raw data from financial statements into simple metrics you can use for quick comparisons. They help answer questions like: “Is this company profitable?” “Can it pay its bills?” “Is its stock overpriced or cheap?” Let’s go over some categories.
Profitability Ratios
These ratios show how well a company is making money.
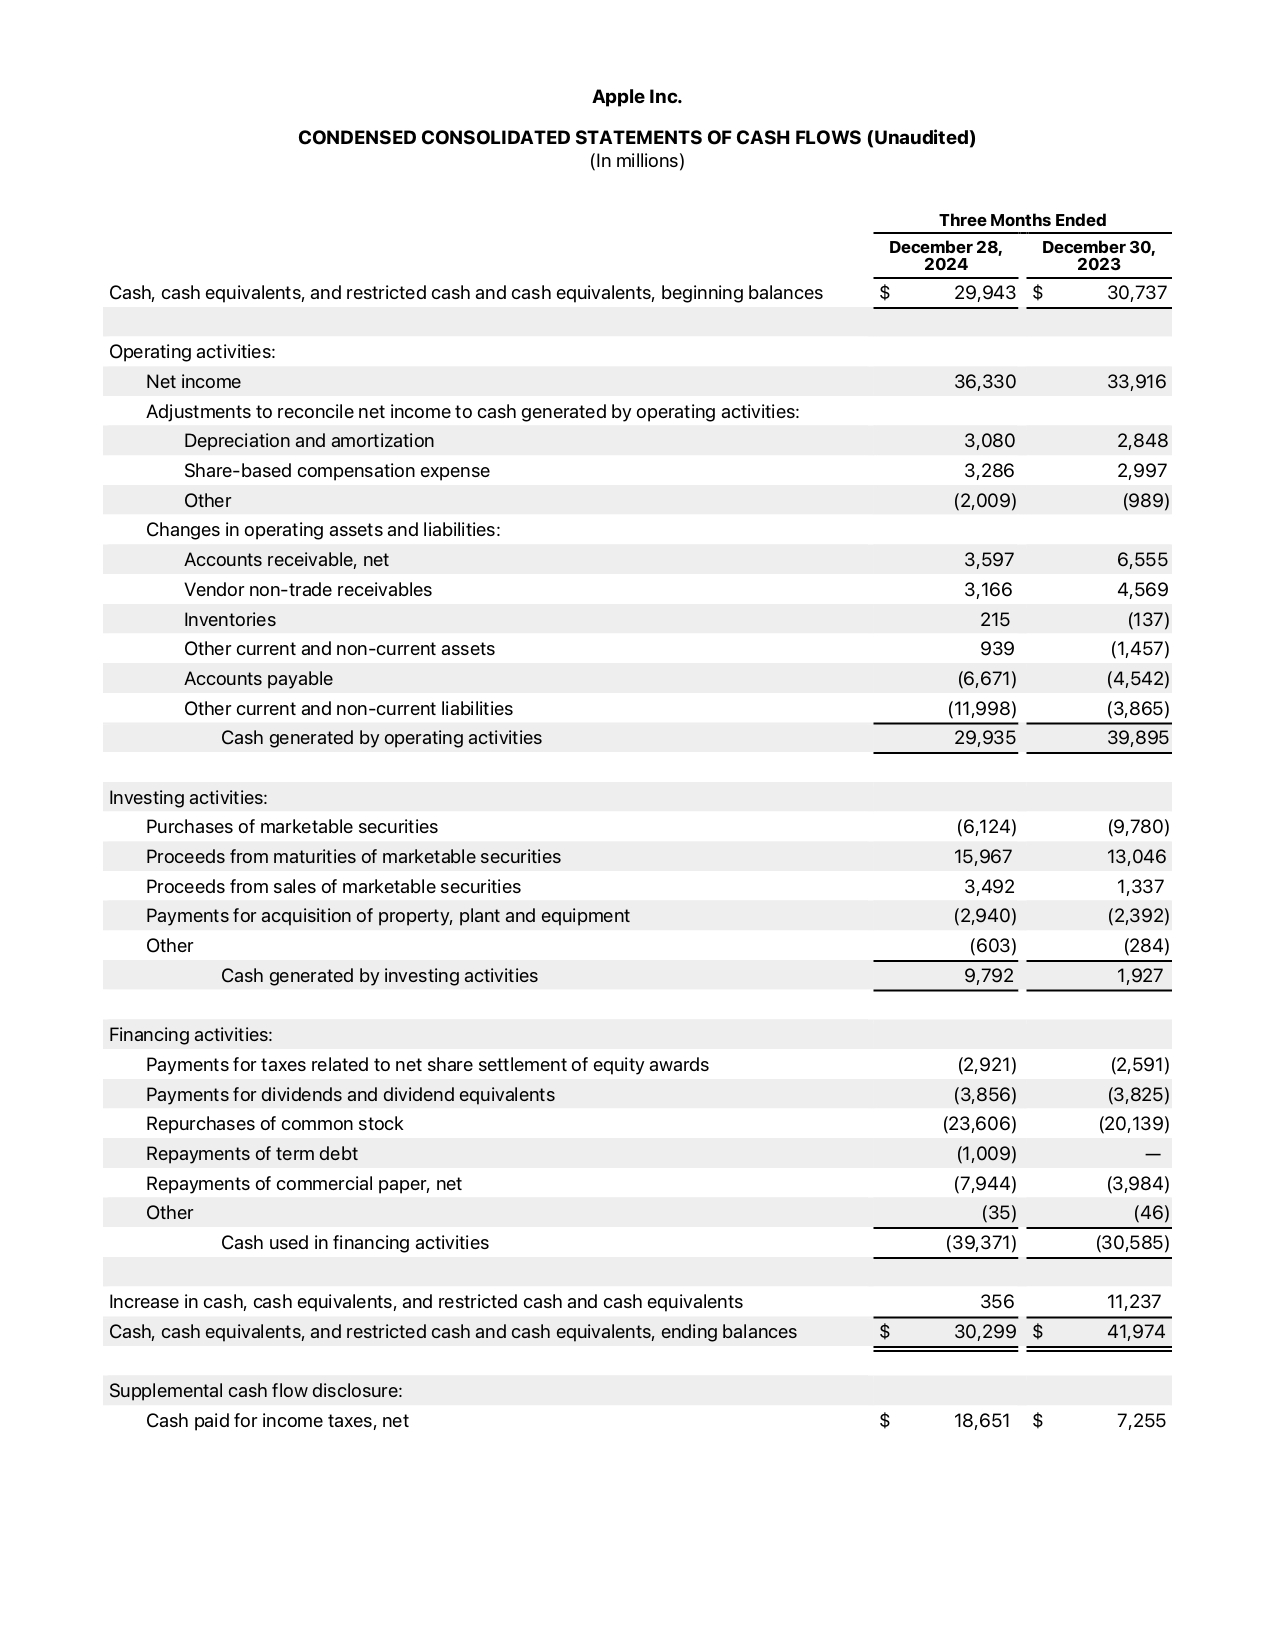
Gross Profit Margin
Tells you what percentage of revenue remains after paying the direct costs of making the product.
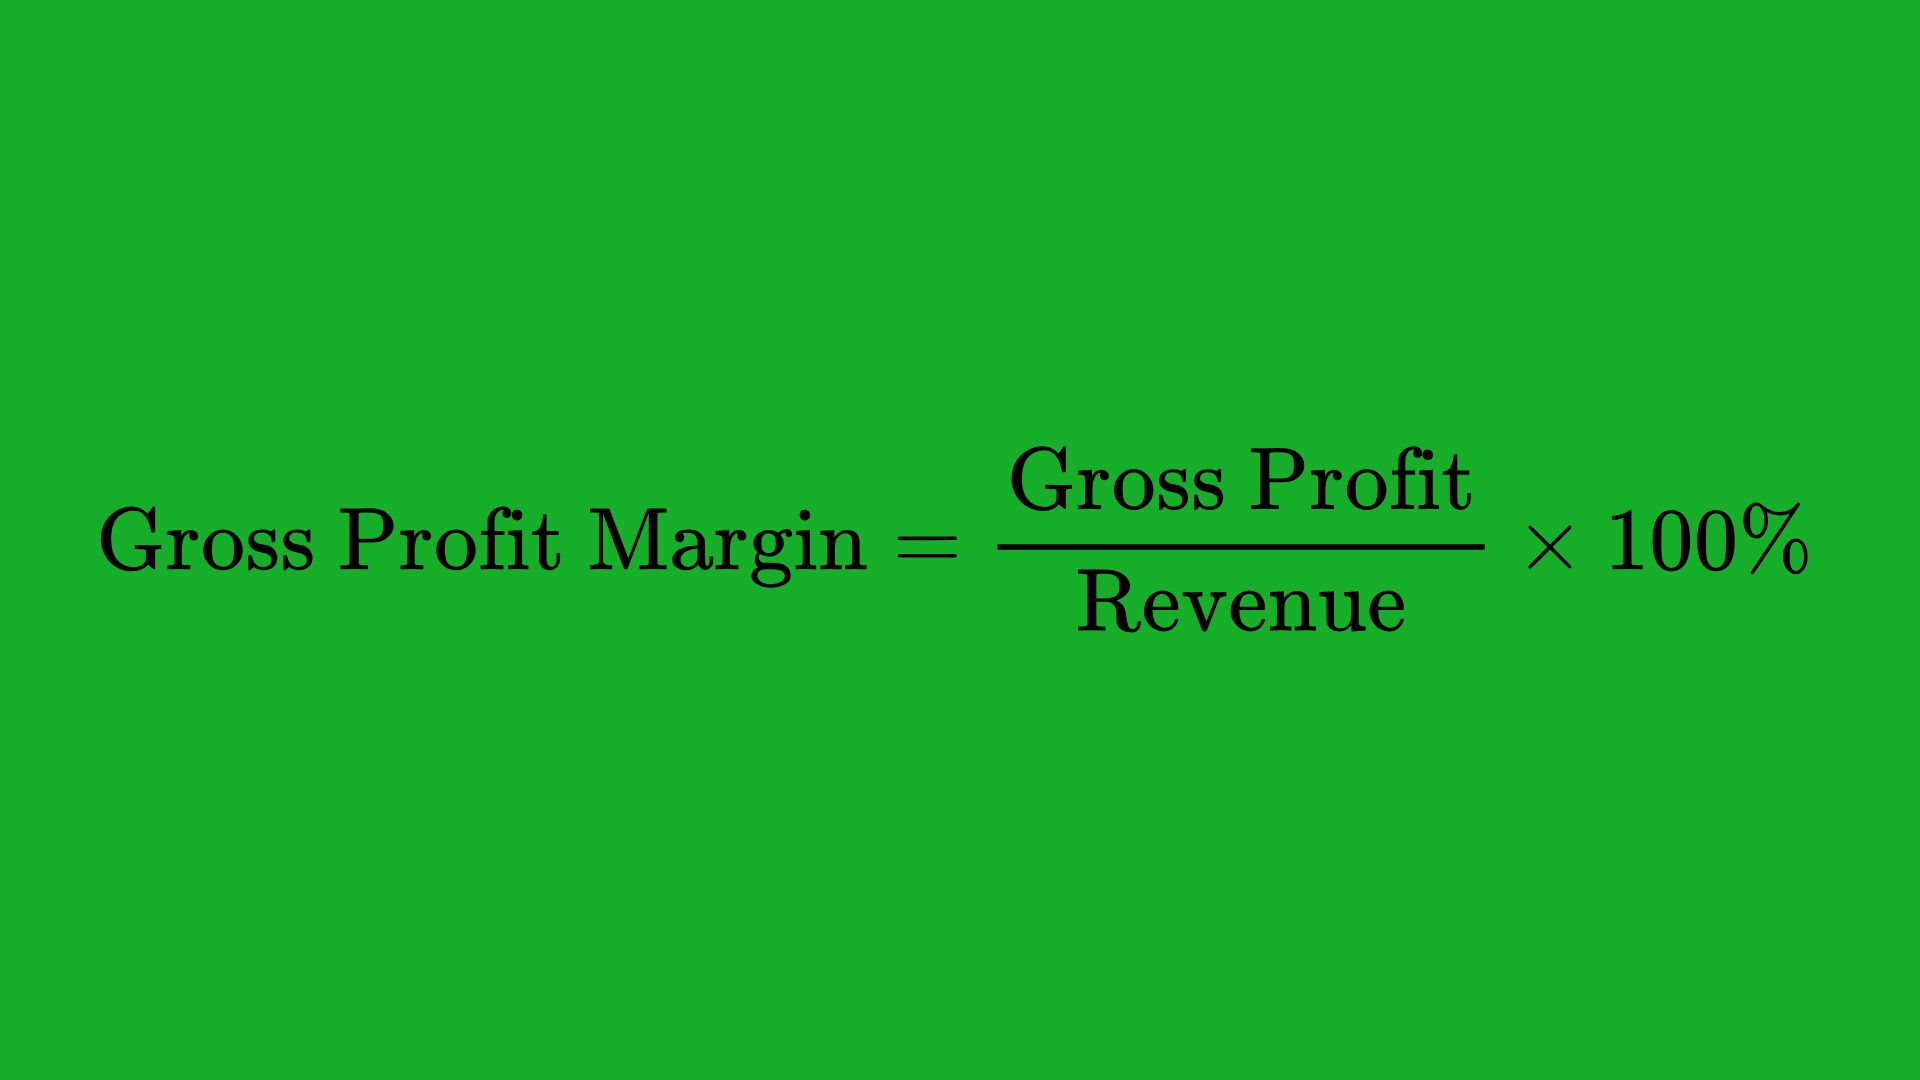
Operating Margin
Shows how efficient the company is in its regular business activities, excluding things like interest and taxes.
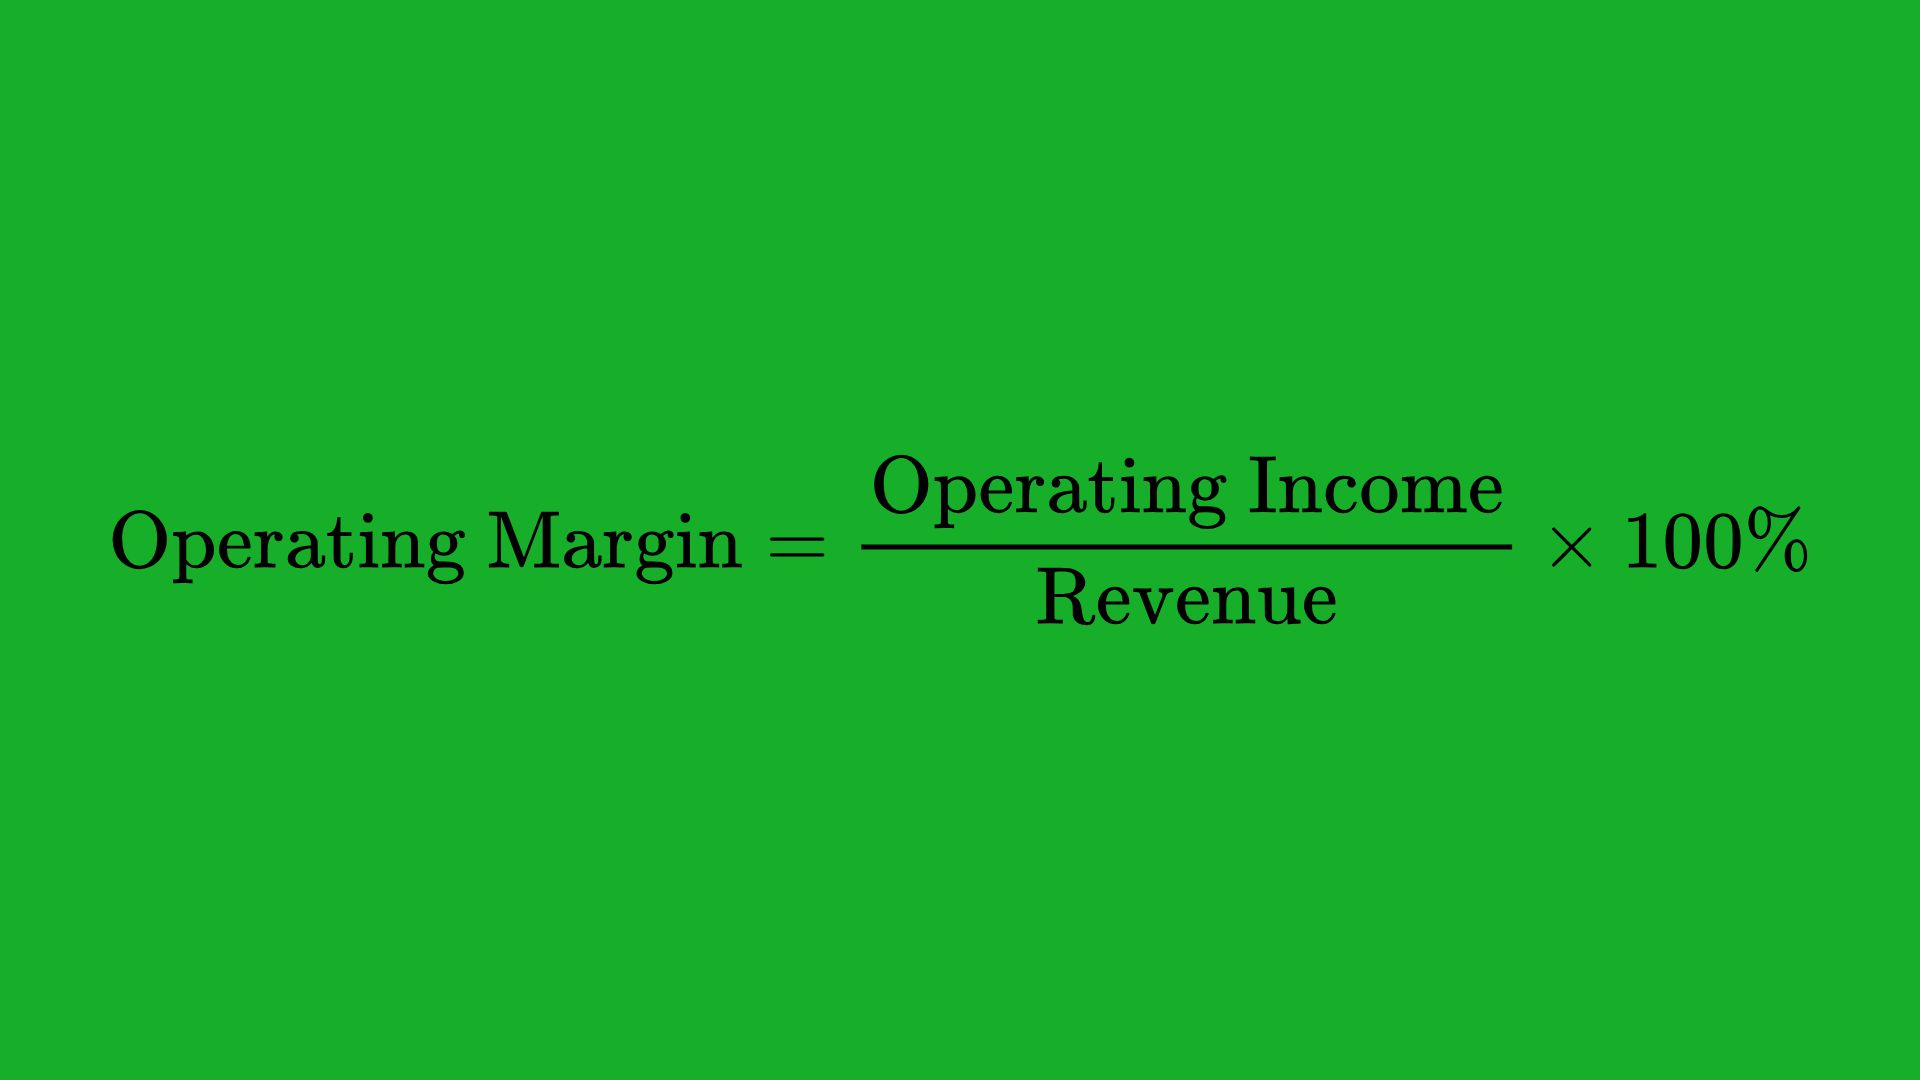
Net Profit Margin
Tells you how much of each dollar of revenue ends up as profit.
Return on Equity (ROE)
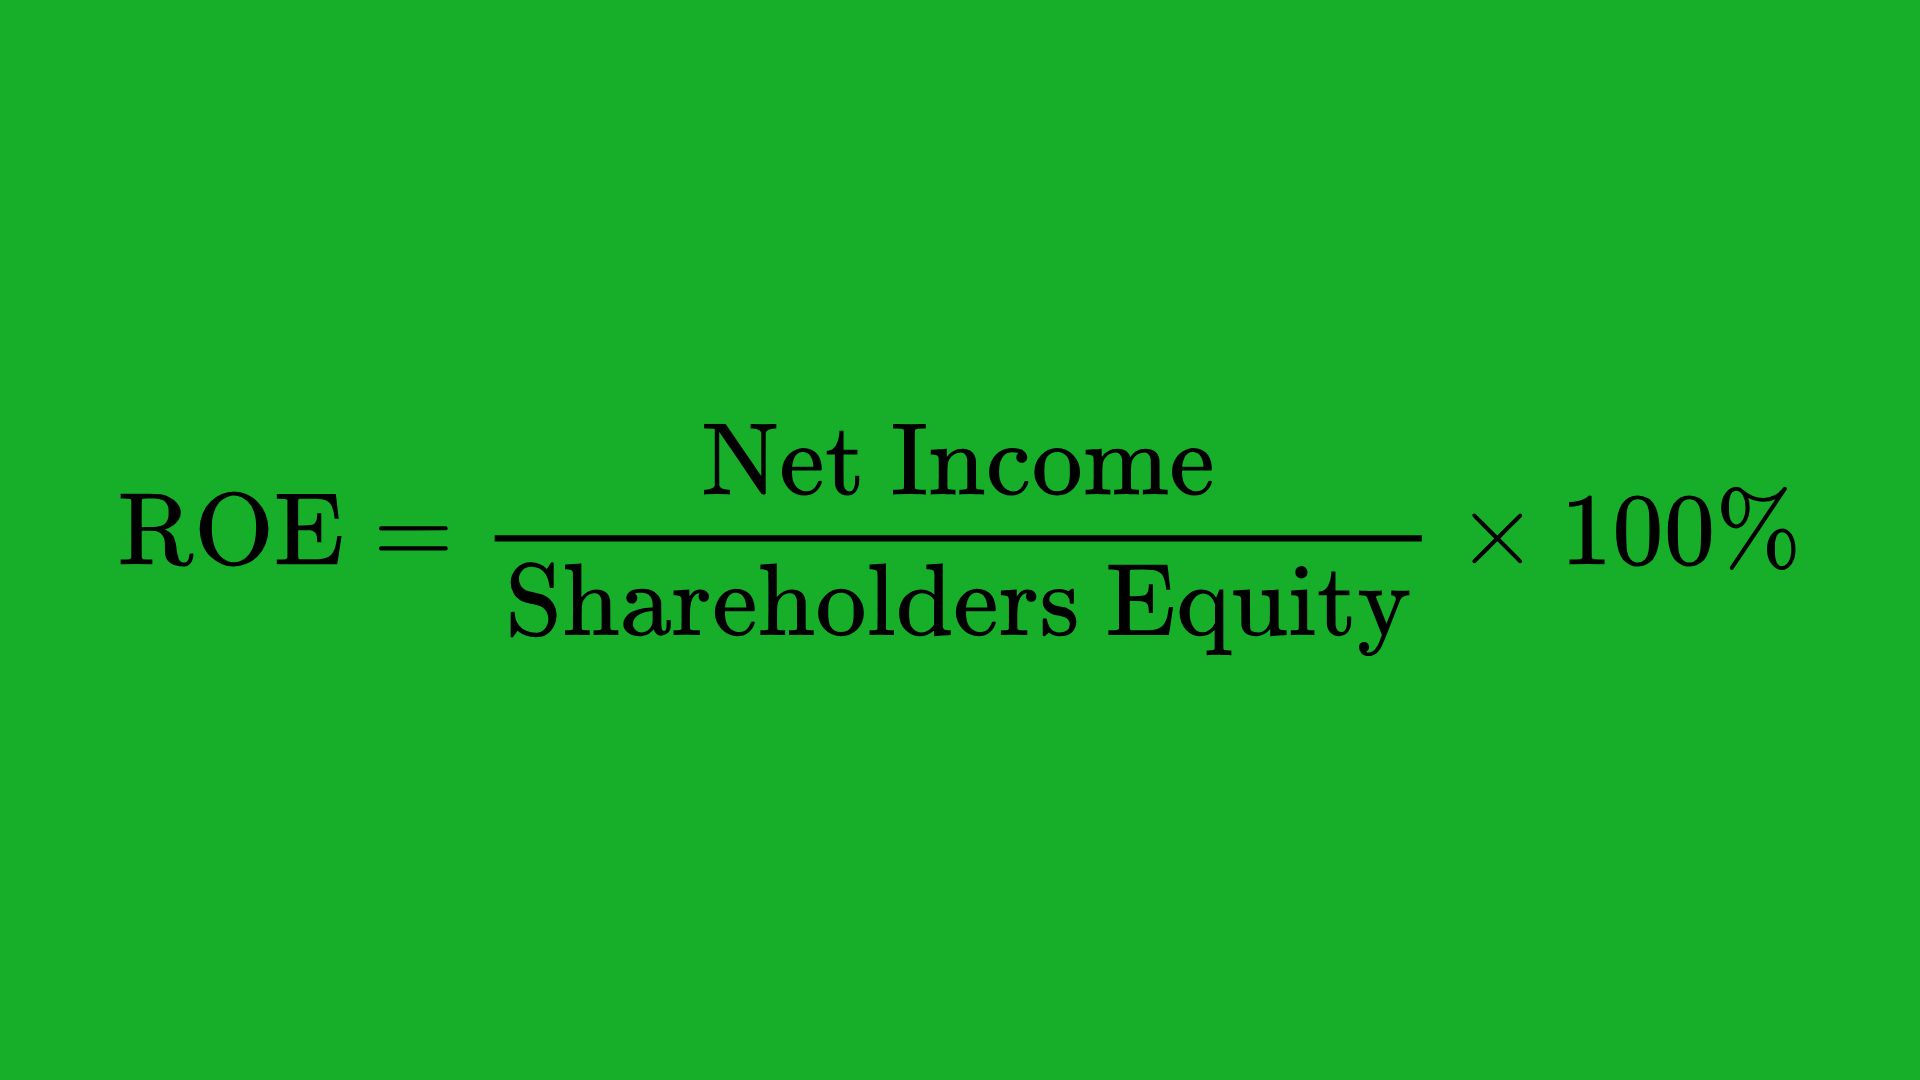
Shows how effectively the company uses the money shareholders have invested to generate profits.
Liquidity Ratios
Liquidity ratios help you see if a company can pay its short-term obligations.
Current Ratio

If it’s above 1, that usually means the company can cover its short-term debts with its short-term assets.
Quick Ratio (or Acid-Test Ratio)

Removes inventory from current assets to give a more strict test of liquidity. Inventory can sometimes be hard to quickly turn into cash.
Leverage Ratios
These ratios show how much debt a company uses compared to equity or income.
Debt-to-Equity (D/E) Ratio
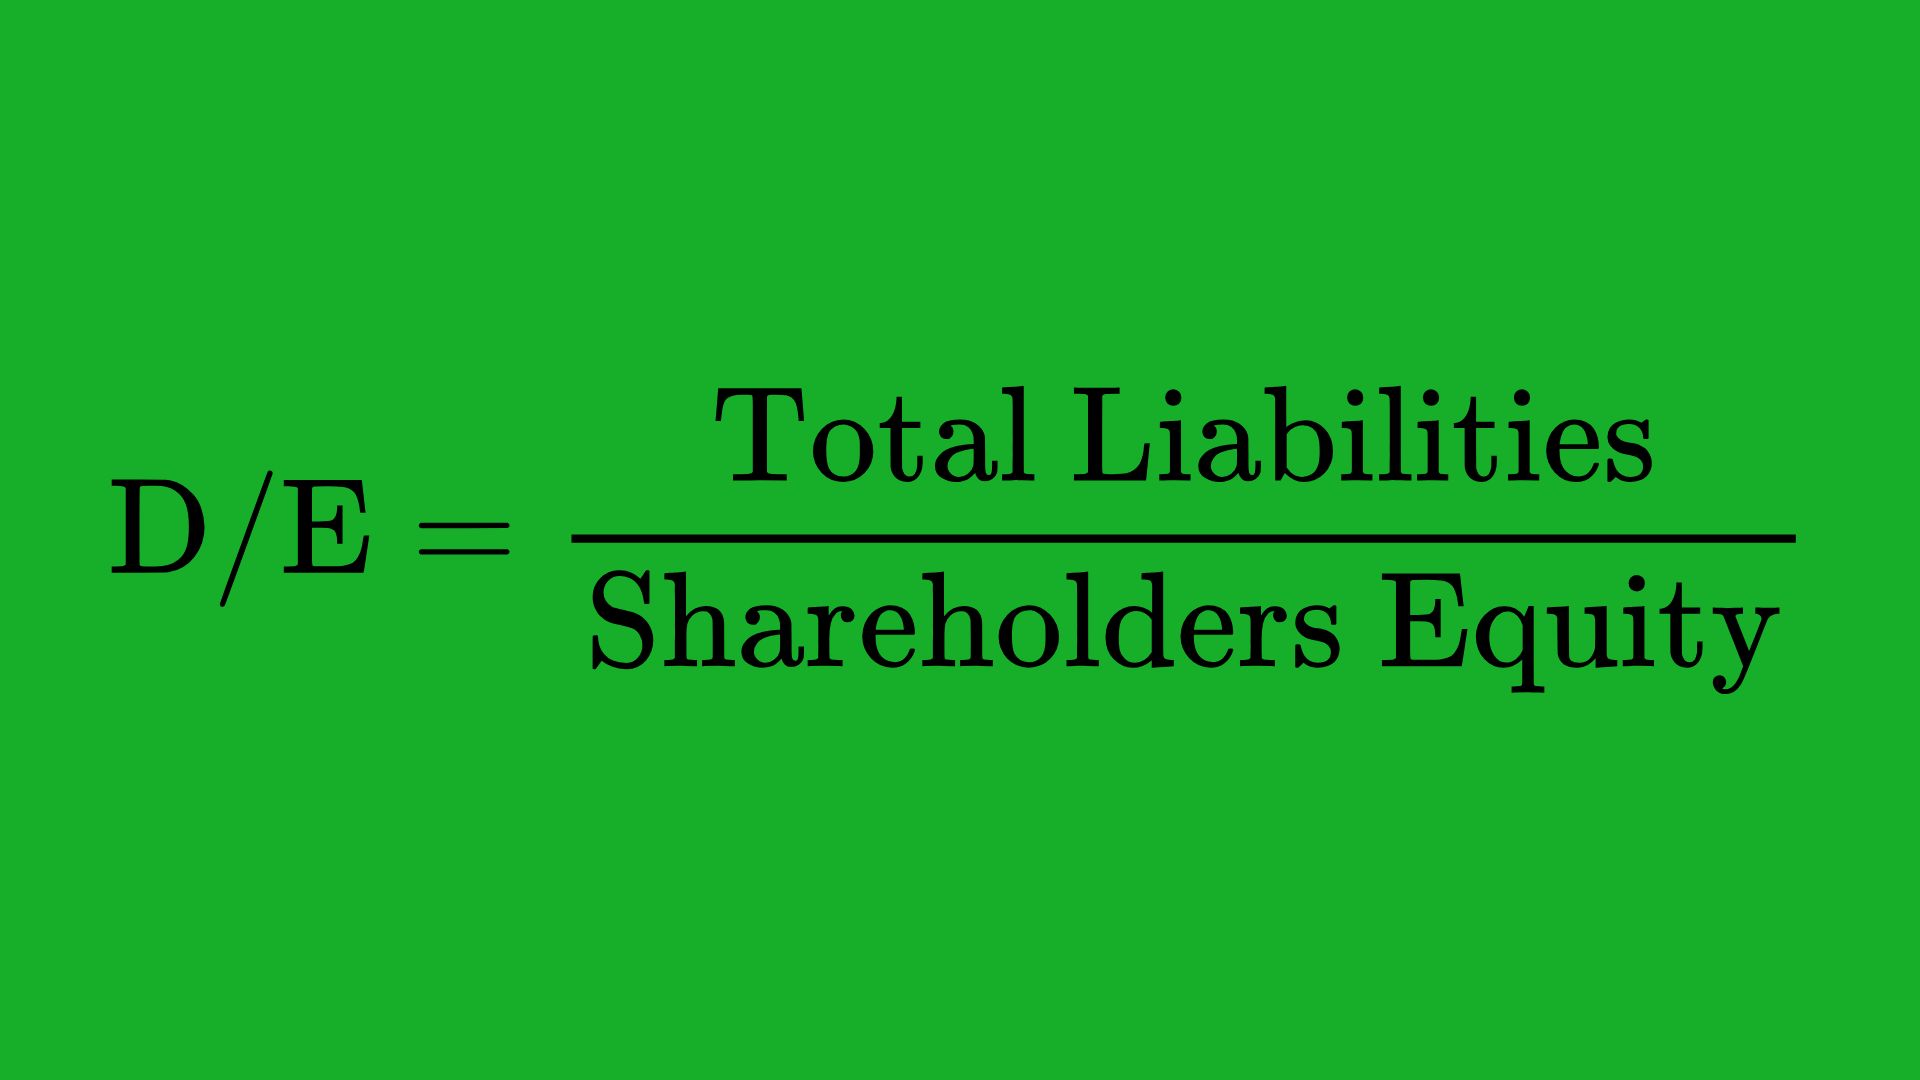
Tells you the proportion of company financing that comes from debt. High debt can mean higher risk, but it can also boost returns if used wisely.
Interest Coverage Ratio

Measures how easily a company can pay interest on its debt. The higher, the better.
Efficiency Ratios
These ratios measure how effectively a company uses its assets.
Asset Turnover
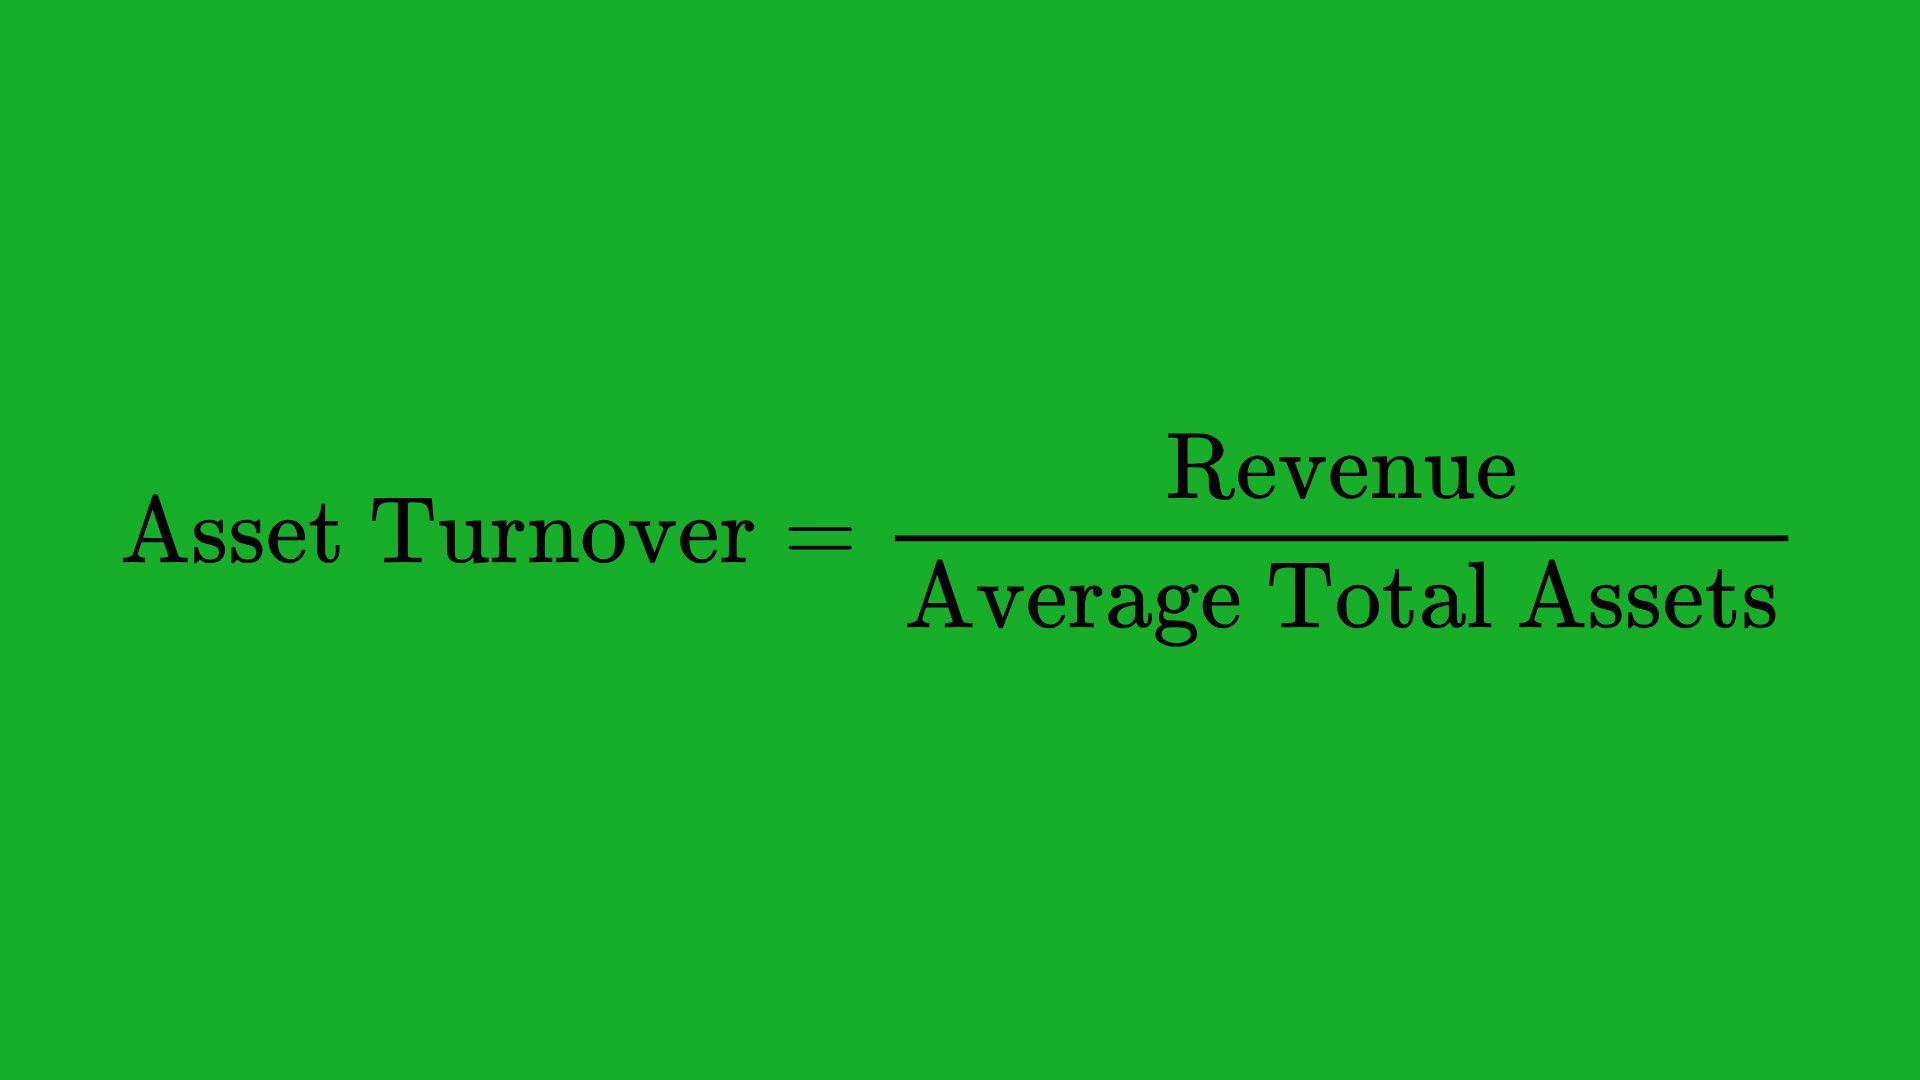
Shows how much revenue is generated from each dollar of assets. Higher means better efficiency.
Inventory Turnover
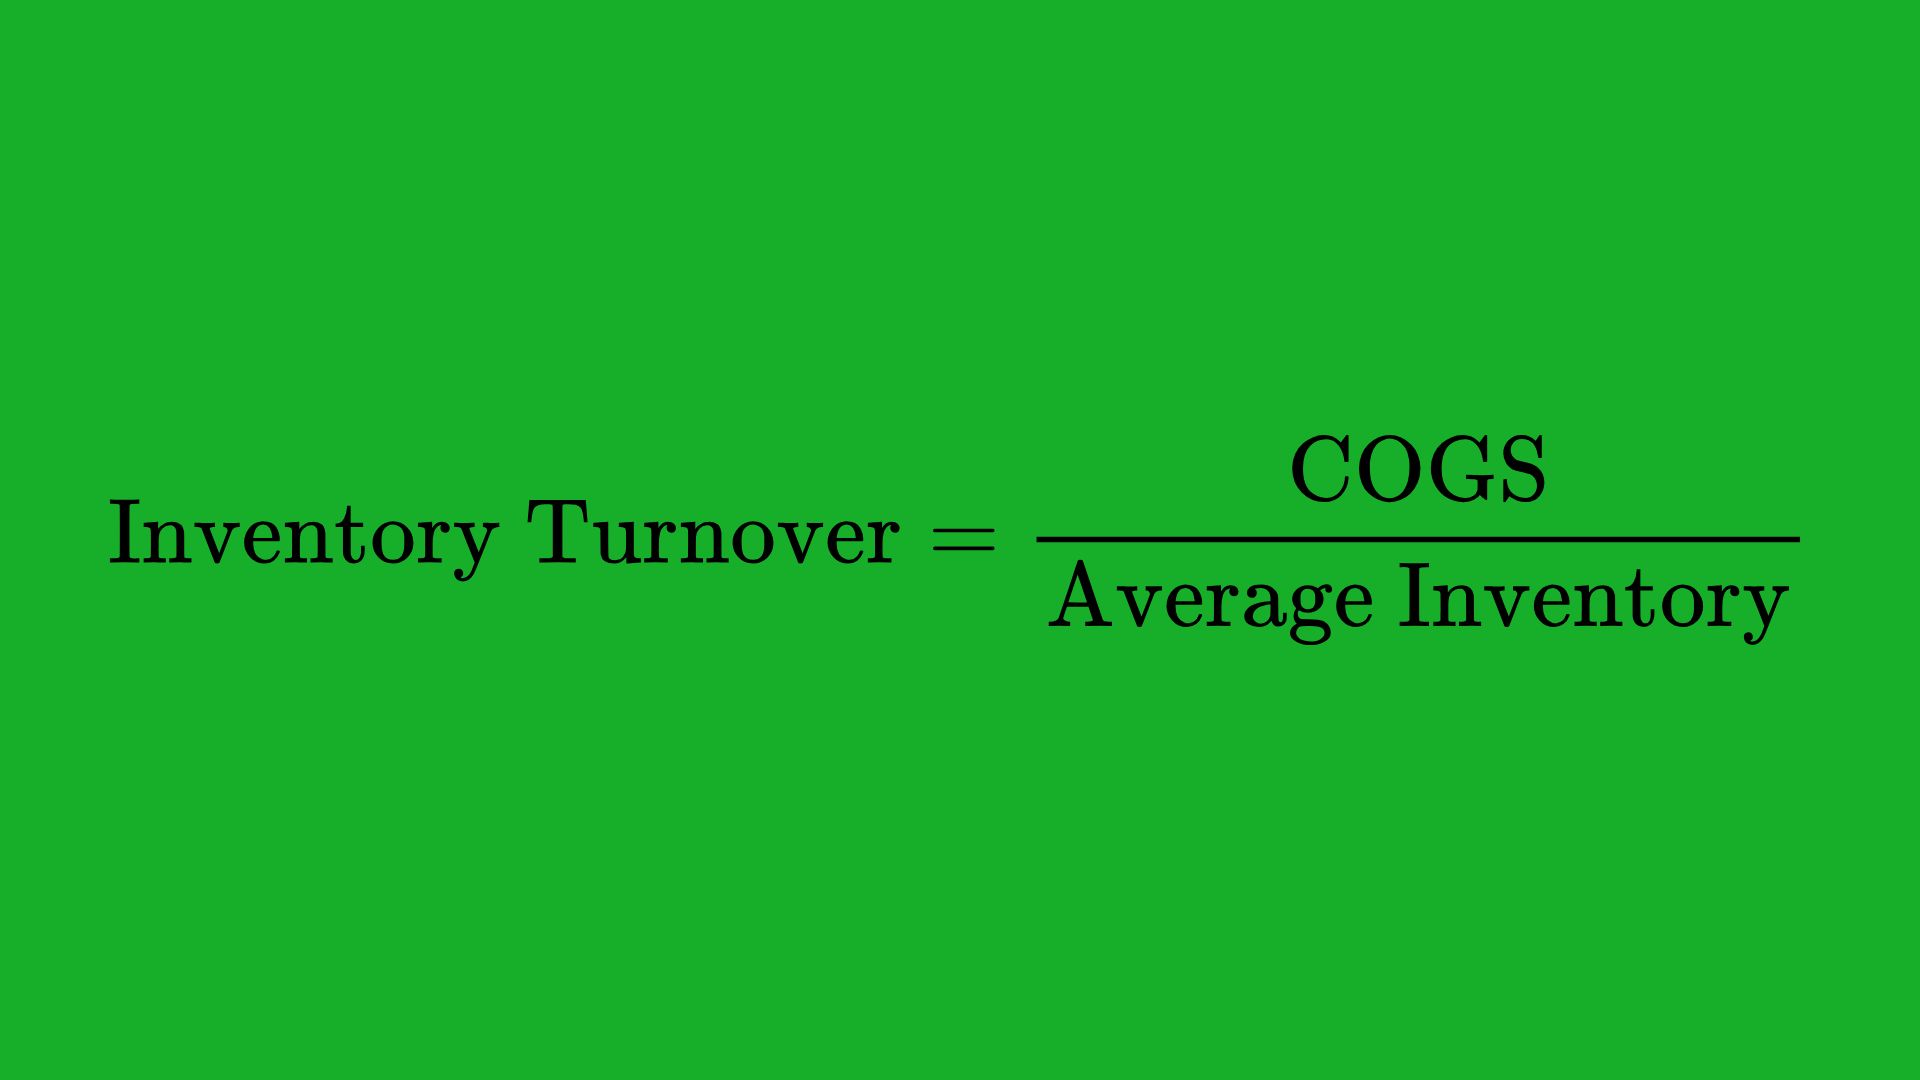
Tells you how quickly a company sells and restocks its inventory. A higher ratio usually means sales are happening faster.
Valuation Ratios
Valuation ratios help you figure out if a stock might be cheap or expensive.
Price-to-Earnings (P/E) Ratio

One of the most common ratios. A very high P/E might mean the stock is pricey or that investors expect big growth in the future.
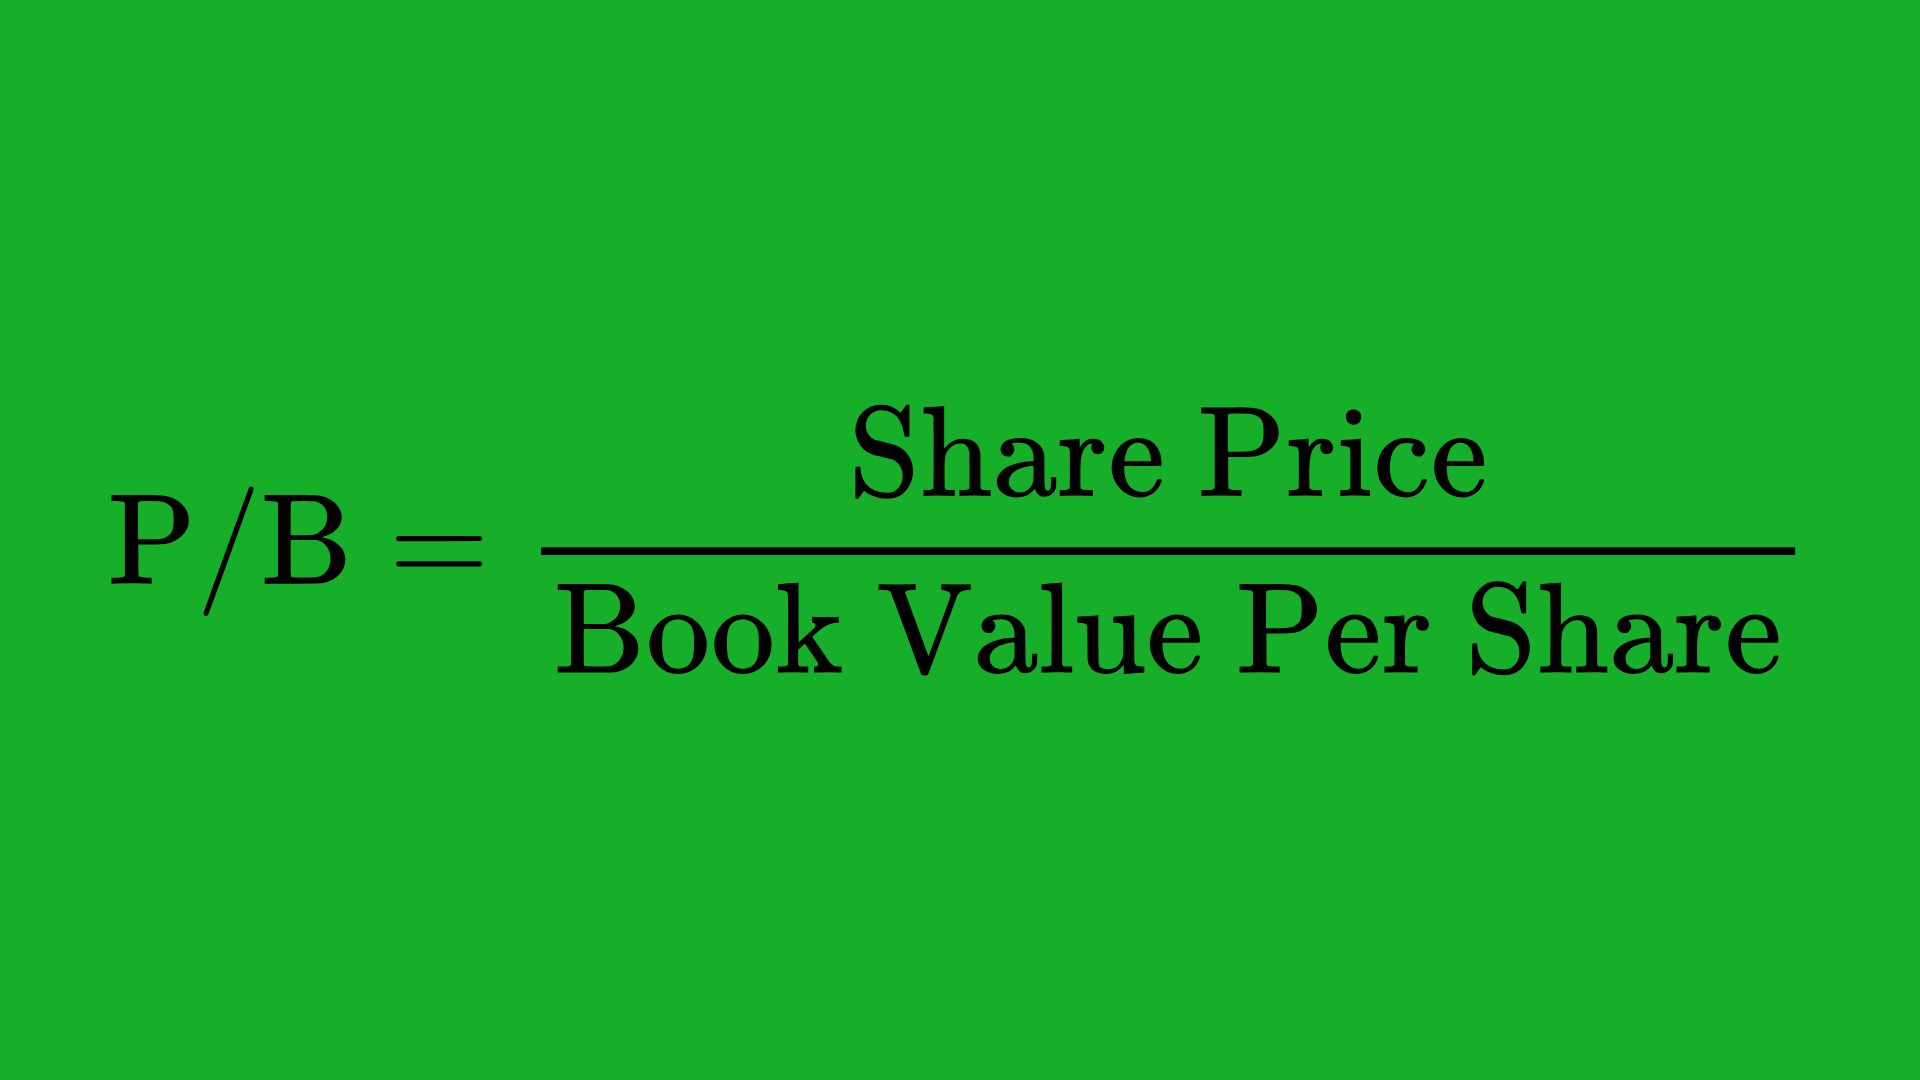
Price-to-Book (P/B) Ratio
Often used for companies with lots of physical assets. A P/B less than 1 can mean the stock is undervalued or that the company is in trouble.
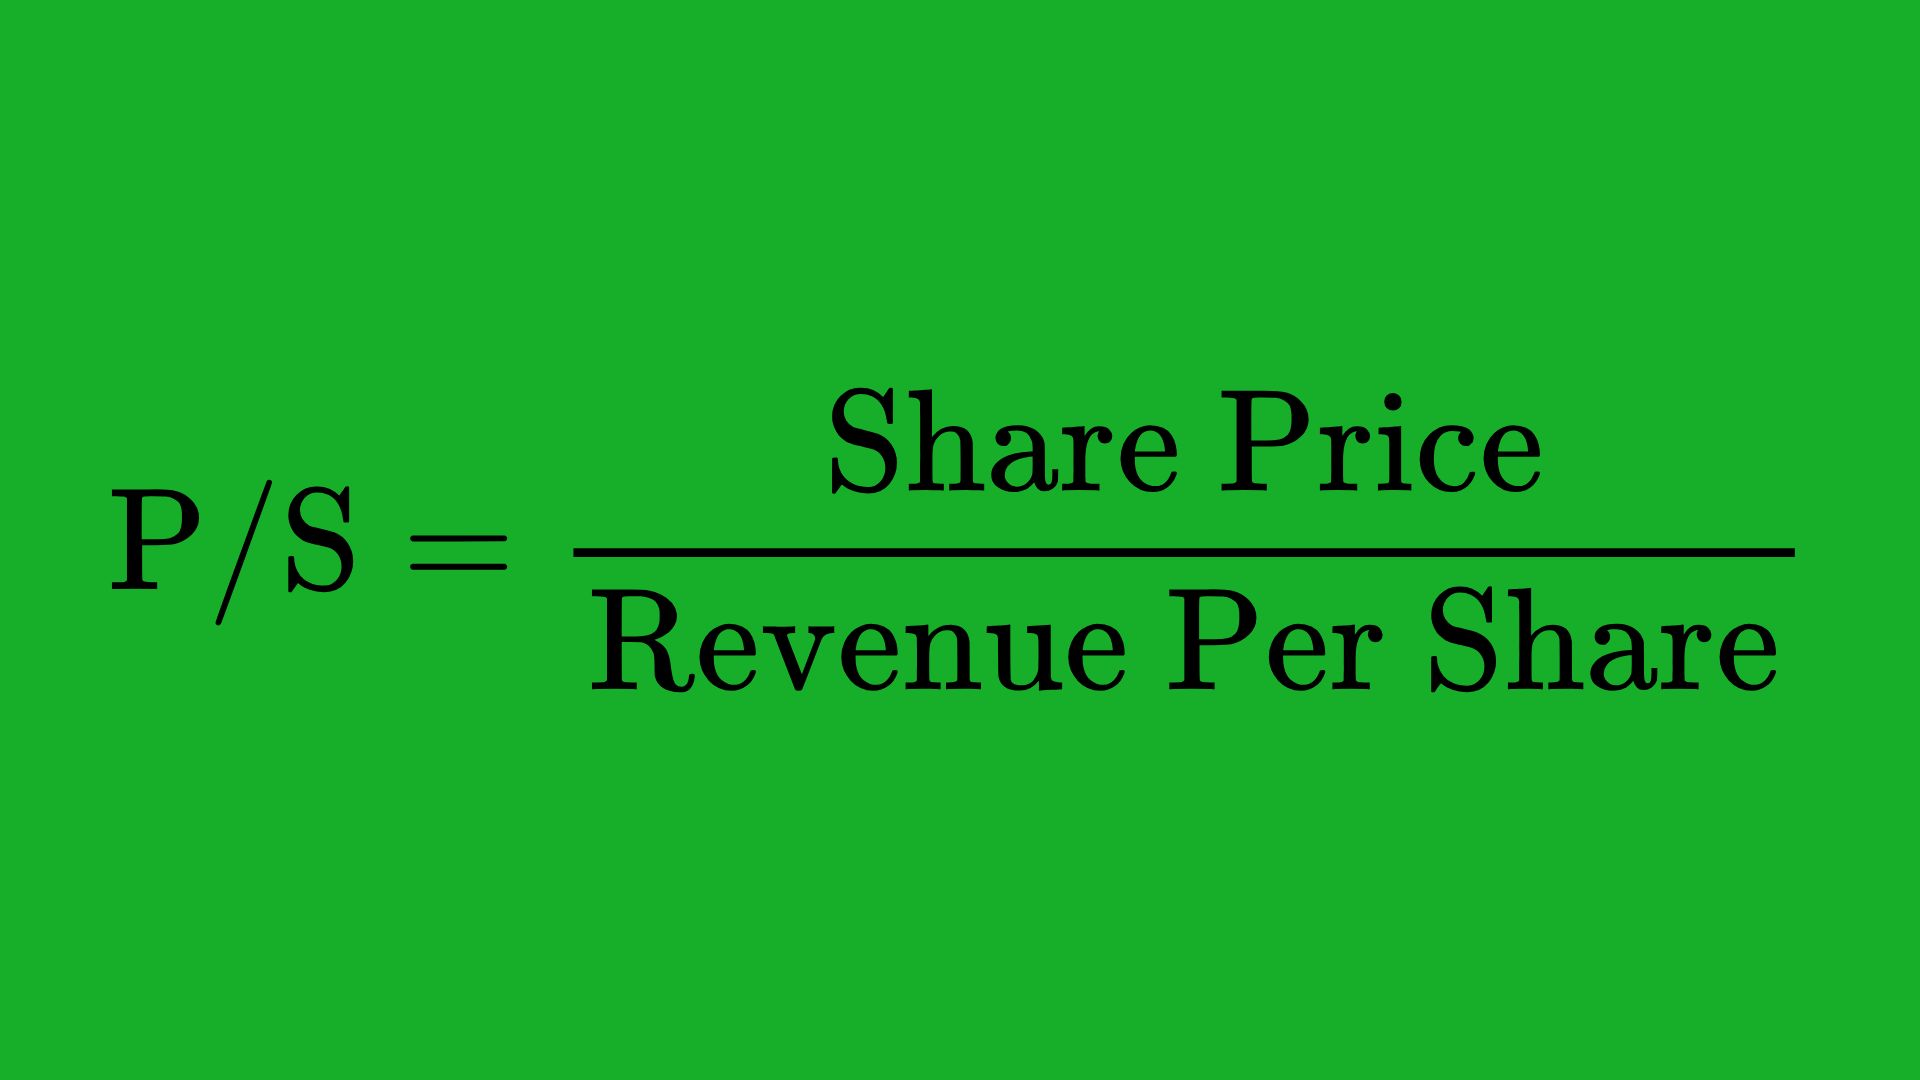
Price-to-Sales (P/S) Ratio
Helpful for startups or companies that don’t have profits yet.
Price-to-Free Cash Flow (P/FCF)

Free cash flow is the actual cash a company can use after covering its operating and capital expenses. A lower ratio may suggest better value if the company generates strong cash flow.
By looking at several ratios together—rather than focusing on just one—you can get a more complete view. A company may appear great in terms of profitability but might be overloaded with debt. Another might have a great balance sheet but be trading at a sky-high price. Ratios help you uncover these details quickly.
Looking at Qualitative Factors

Numbers matter, but they don’t always give you the full story. Sometimes, a company’s future hinges on elements that are harder to measure, like who’s running it, how innovative it is, or how strong its reputation is with customers.
Management Quality
A company’s leadership can make or break its success. Here are a few things to check:
- Track Record: Has the CEO or executive team built successful businesses before, or do they have a history of poor results?
- Honesty and Clarity: During earnings calls or in shareholder letters, do they communicate openly about problems and goals?
- Capital Allocation: How do they spend the company’s money? Are they investing in smart projects, returning money to shareholders, or just loading up on debt for risky deals?
Sometimes, reading or listening to quarterly earnings calls can be enlightening. Watch for whether management tends to overpromise and underdeliver, or if they set realistic goals and meet them.
Competitive Advantage (Moat)
A big idea from Warren Buffett is the economic moat, which is basically how a company protects its market share and profit against competitors. Think of it like a castle with a moat around it:
- Brand Loyalty: Are customers dedicated to the brand and willing to pay more for it?
- Patents or Licensing: Does the company own special technology or patents that lock out competitors?
- Cost Edge: Can the company produce or sell more cheaply than others?
- Switching Costs: Would it be hard or expensive for customers to switch to a competitor?
A strong moat can mean stable or rising profits over time because competitors have a harder time stealing market share.
Corporate Governance & Ethics
Governance might sound boring, but it’s crucial to know how a company is run at the highest levels:
- Board Independence: Boards that have independent directors (not just the CEO’s friends) can better keep management in check.
- Transparency: Is the company open about how it sets executive pay or deals with conflicts of interest?
- Legal Issues: Has the company faced lawsuits, scandals, or regulatory problems often?
Good governance often leads to fewer nasty surprises down the road.
Brand Value & Reputation
A strong brand can create customer loyalty and support higher profit margins. On the flip side, a poor reputation can tank sales, especially in the age of social media. Read reviews, follow social media trends, and watch how the public reacts to the company. If the brand is respected and has a positive image, that’s a big plus. If the brand is constantly dealing with controversy, it might be a red flag.
Macroeconomic & Industry Analysis

No matter how great a company is, it still has to deal with bigger factors like economic cycles, consumer trends, and government policies. That’s why it’s smart to also look at:
- Economic Indicators
- GDP Growth: Is the economy expanding, staying flat, or shrinking?
- Interest Rates: High rates can raise a company’s borrowing costs and impact consumer spending.
- Unemployment: High unemployment can reduce consumer demand.
- Regulations and Policies
Some industries face heavy regulation (like healthcare or banking). If laws change or new taxes appear, that can impact profits. - Industry Stage
Industries usually move through phases: introduction, growth, maturity, and decline. A high-growth sector might offer more upside, but it can also have steeper competition. A mature sector could be stable but not grow much. - Competition
How many other companies are fighting for the same customers, and how big are they? Is the market dominated by a few large players, or is it scattered among many small competitors? - Consumer Trends
Tastes and needs can shift fast. Think of how quickly streaming services disrupted cable TV. If your company is in an industry that’s likely to be upended by new technology or consumer behavior, that’s a big deal for its future prospects.
By combining your company-level insights with what’s going on in the overall economy and specific industry, you can spot both opportunities and risks that might not show up on a balance sheet.
Valuation Methods in Fundamental Analysis
After studying the numbers, the leadership, and the industry, you want to figure out how much the stock is really worth. There are different ways to do this, and they each have pros and cons.
Discounted Cash Flow (DCF)
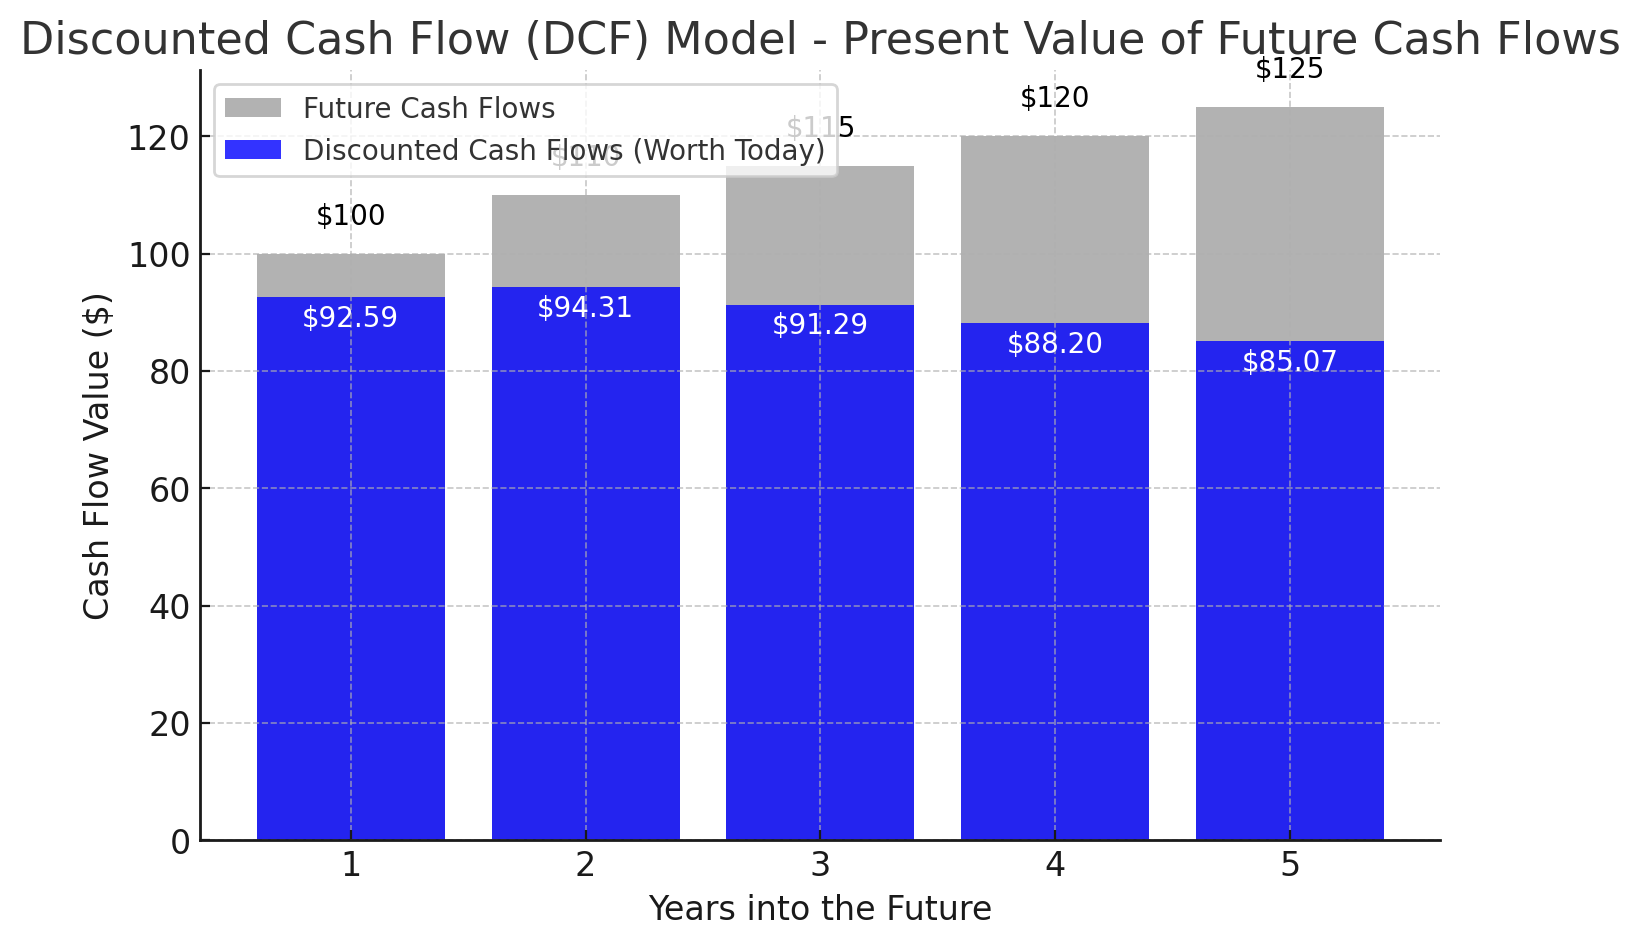
A popular and thorough method, DCF calculates what the company’s future cash flows are worth in today’s money. Here’s a quick breakdown:
- Project Future Cash Flows: Estimate the free cash flow the company might produce each year for, say, the next 5-10 years.
- Calculate a Discount Rate: This reflects the return you want or the company’s “cost of capital,” factoring in how risky it is.
- Discount the Future Cash Flows: Convert each future year’s cash flow into today’s dollars using that discount rate.
- Add the Terminal Value: Because most companies keep operating well past 5-10 years, you’ll usually estimate a long-term value called the “terminal value.”
- Sum It All Up: Once you add these discounted cash flows and the discounted terminal value, you get a total. Divide by the number of shares to find a per-share value.
DCFs can be very detailed, but they’re sensitive to the assumptions you plug in (like growth rates and discount rates). A small tweak can lead to a big change in the final value, which is why it’s often wise to run different scenarios (like conservative, moderate, and optimistic) rather than betting on one outcome.
Relative Valuation (Using Comparables)
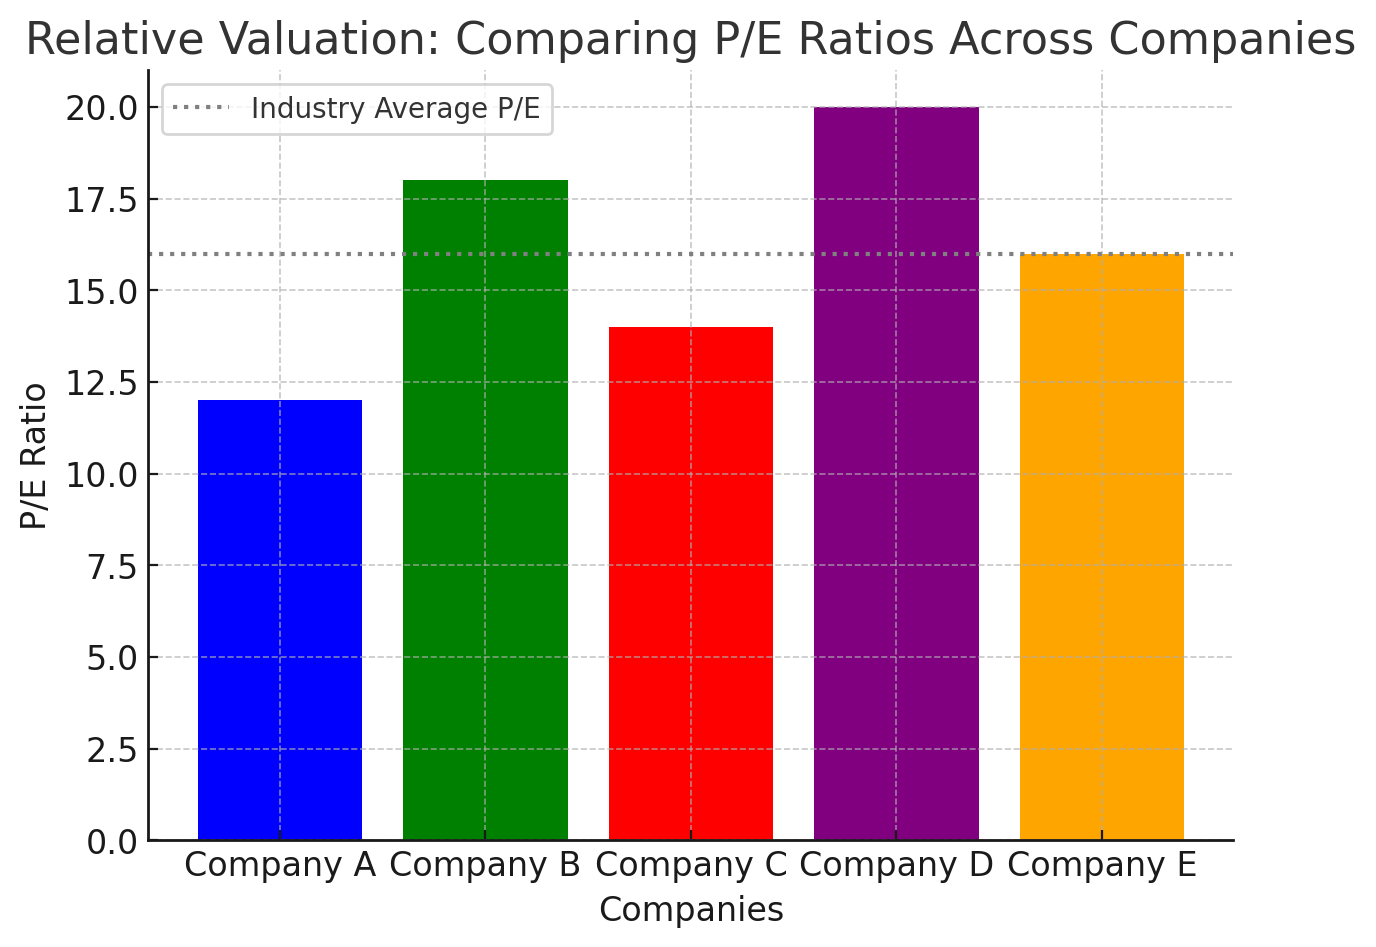
This approach checks how a company measures up to similar companies in its industry. You compare ratios like P/E, P/B, or EV/EBITDA (Enterprise Value to Earnings Before Interest, Taxes, Depreciation, and Amortization). If your target company has a lower P/E than others with similar growth rates and profitability, it might be undervalued. However, be aware that the entire industry could be overvalued or undervalued at times, so you need a sense of the broader market, too.
Dividend Discount Model (DDM)
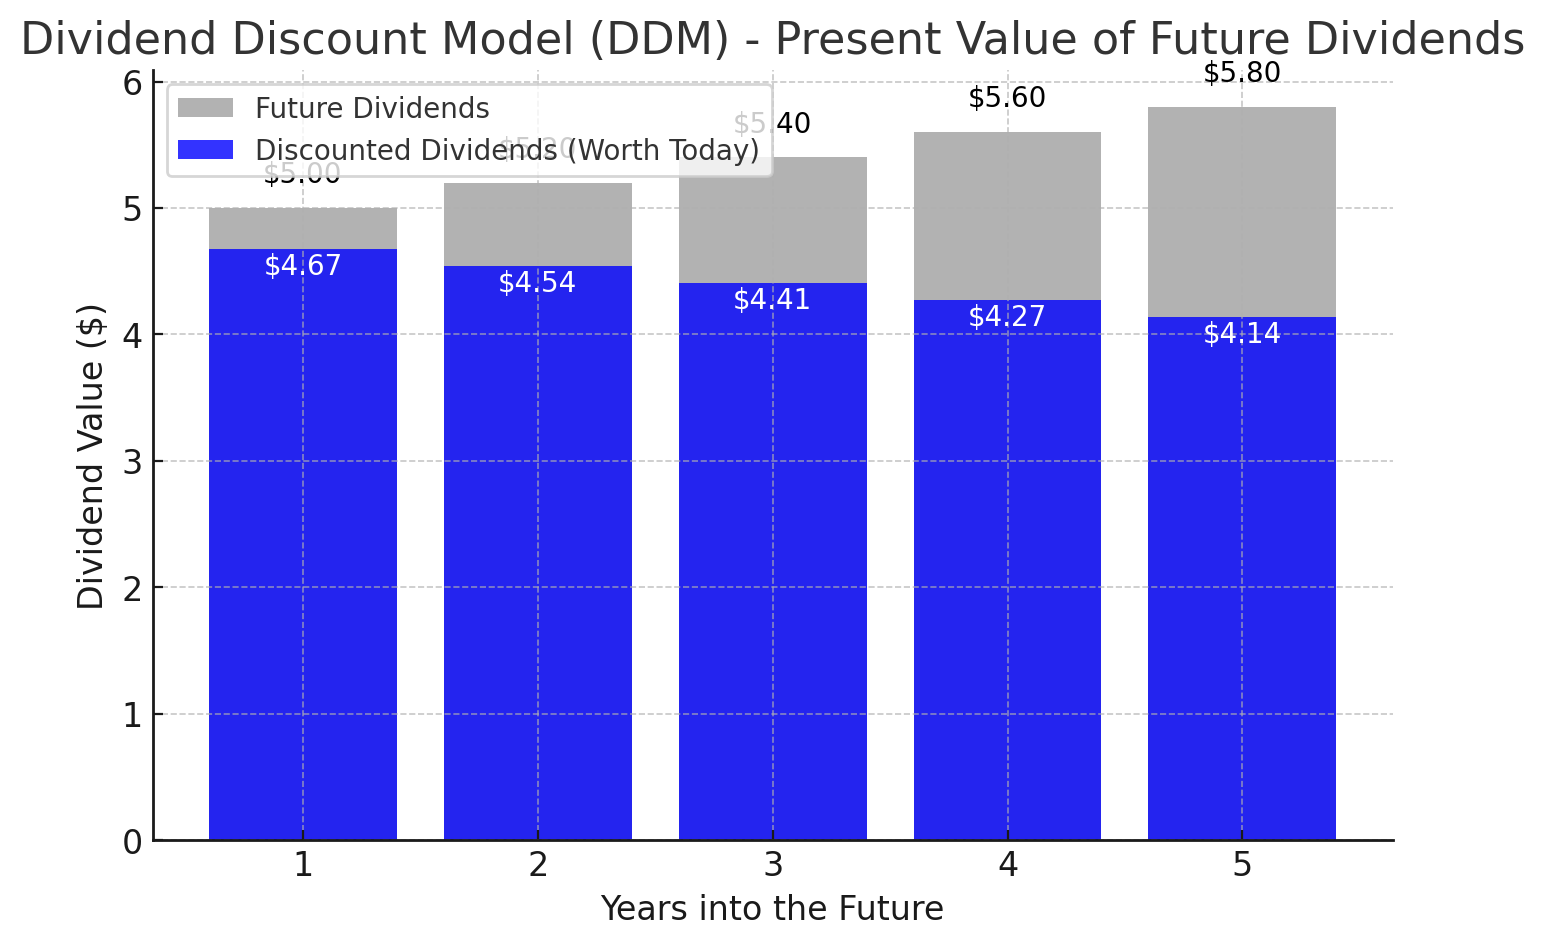
The DDM looks at the value of a stock based on all future dividends you expect it to pay. A simple version is called the Gordon Growth Model:

- D1 = Next year’s expected dividend per share.
- r = Required rate of return (the return you want for the risk you’re taking).
- g = Expected dividend growth rate.
This model is handy if the company regularly pays and grows its dividends. If it doesn’t pay dividends, then DDM isn’t very helpful.
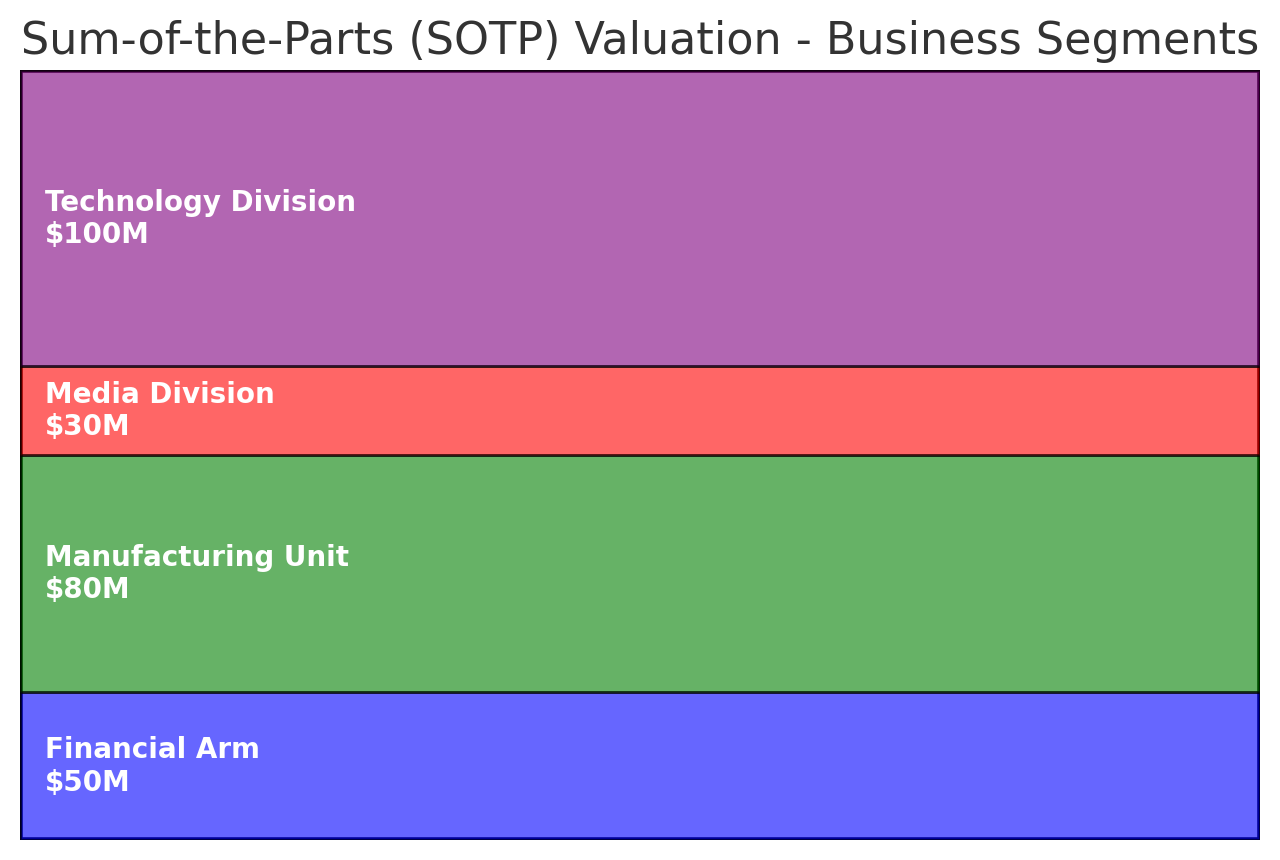
Sum-of-the-Parts Valuation
For companies that have diverse business segments, you might want to value each segment separately and then add them up. For example, a big conglomerate might own a financial arm, a manufacturing unit, and a media division. Each of these might be worth different amounts based on their own separate outlooks. By valuing them individually and then summing those figures, you can see if the company’s overall stock might be mispriced.
Growth vs Value Investing
These two investment styles both use fundamental analysis, but they look at slightly different things.
Value Investing
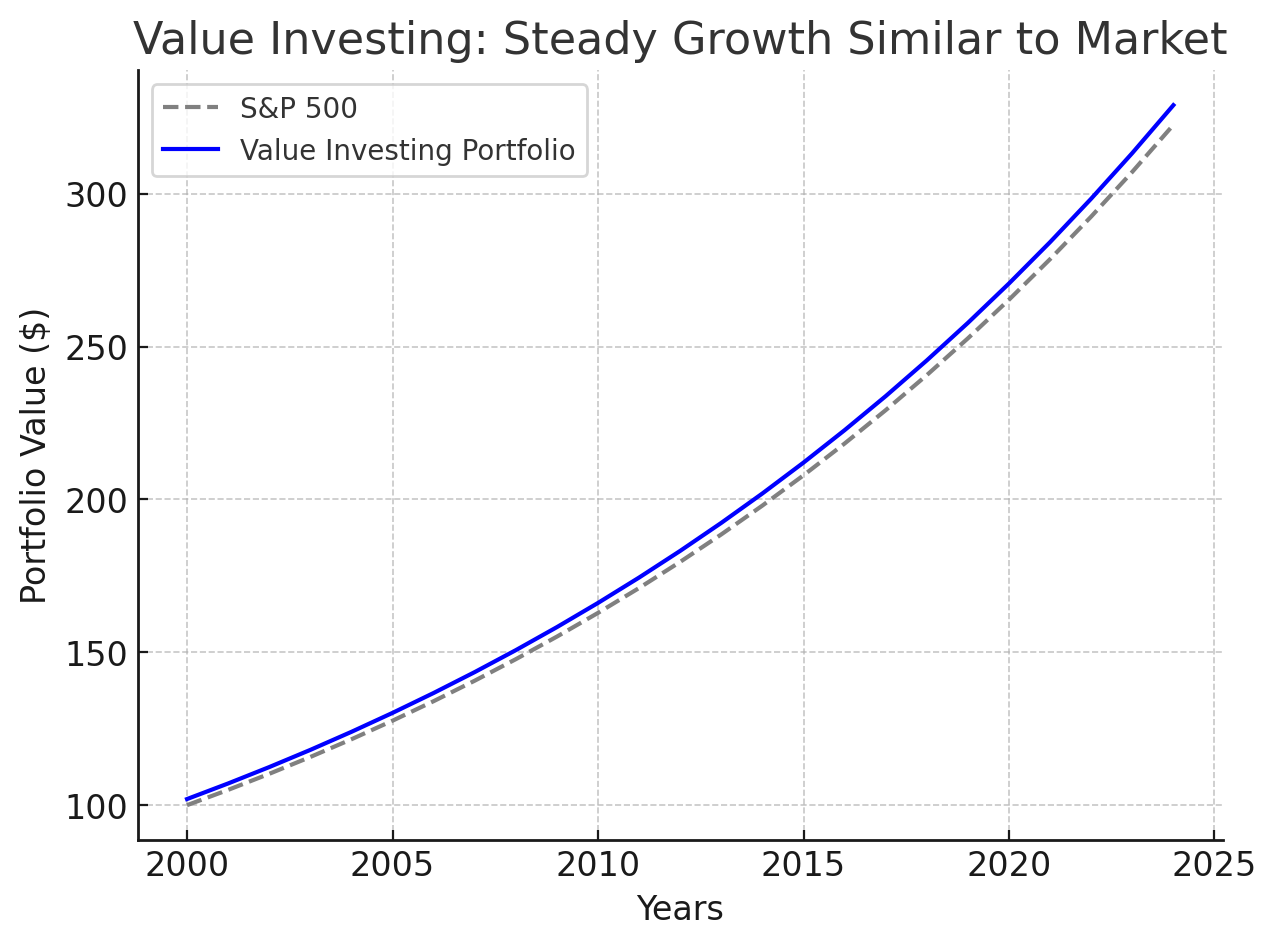
- Focus: Stocks that seem cheap compared to their actual worth.
- Key Metrics: Low P/E, low P/B, strong cash flows, stable earnings.
- Mindset: Buy undervalued companies and wait for the market to realize their true value.
- Risk: Sometimes companies are “cheap” for a real reason—like declining sales or outdated products. That’s called a “value trap.”
Growth Investing
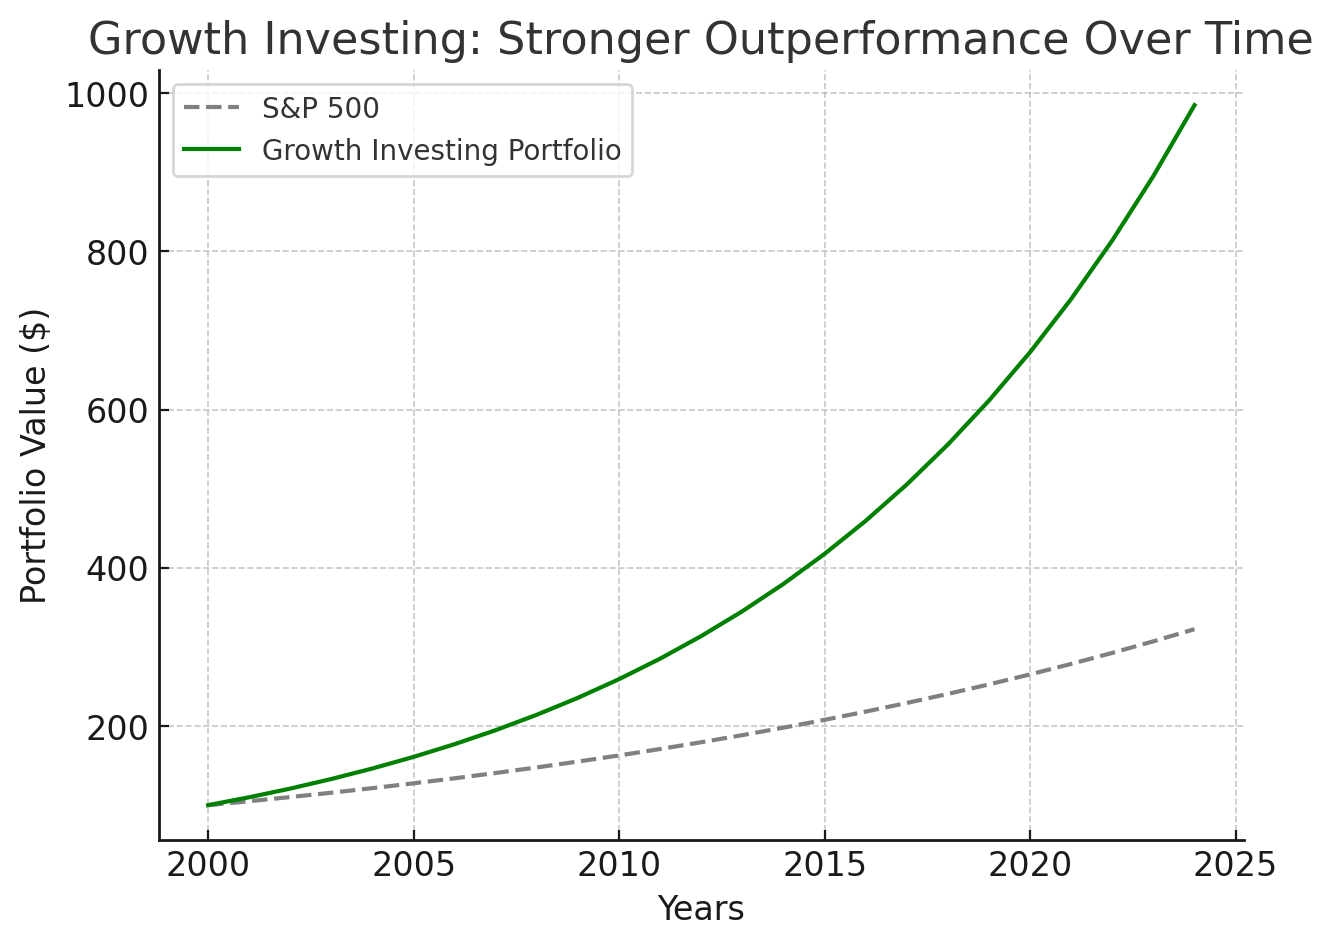
- Focus: Companies expected to grow revenue and earnings faster than the overall market.
- Key Metrics: High revenue growth, big market potential, maybe a disruptive technology.
- Mindset: Pay a higher price today because you believe the company’s future earnings will be much larger.
- Risk: Expectations might be overly optimistic, and if growth slows, the stock could drop hard.
Some investors mix the two, looking for “growth at a reasonable price” (GARP). Ultimately, the style you prefer depends on your goals and risk tolerance.
Building and Managing a Portfolio

Fundamental analysis isn’t just about picking individual stocks. It also plays a key part in how you build and maintain your overall investment portfolio.
Step-by-Step Approach
- Set Your Goals and Risk Tolerance
Figure out if you’re investing for retirement (long-term), saving for a house (mid-term), or just trying to grow your money. Also decide how much risk you can handle. This helps you know what kinds of stocks or assets to look for. - Initial Screening
Use metrics like P/E ratios, market cap, or revenue growth to narrow down a list of potential stocks. - Deep Dive
Pick a few stocks from your shortlist and really dig into their financial statements, management quality, industry outlook, and valuation. - Diversify
Don’t put all your money into one stock or one sector. Spread your investments across different industries, and possibly different asset classes (like bonds or real estate) to reduce risk. - Monitor Your Holdings
Keep an eye on earnings releases, industry news, or changes in economic indicators. Did something major change in the company’s fundamentals? - Rebalance When Needed
If one stock or sector grows a lot and becomes a big chunk of your portfolio, you might sell some shares to bring your allocation back to a comfortable level. Rebalancing helps lock in gains and keeps you aligned with your risk preferences.
Long-Term Perspective
The heart of fundamental analysis is long-term thinking. Even if a good stock dips for a few weeks or months, strong fundamentals often mean it can bounce back over time. By staying focused on the company’s actual performance and not just the daily price swings, you avoid knee-jerk reactions to market noise.
Common Pitfalls and How to Avoid Them
Even experienced investors slip up. Here are some frequent mistakes and how you can steer clear:
- Relying Too Much on Past Performance
Just because a company was successful in the past doesn’t guarantee the future will be the same—especially in industries that change fast, like tech. Always look ahead. - Forgetting Qualitative Factors
Don’t get so caught up in financial ratios that you forget about the importance of a strong brand, good leadership, and ethical practices. Numbers can hide underlying issues. - Ignoring the Bigger Picture
Focusing solely on a company’s financials without checking the economy or industry can lead to surprise downturns. For example, a great retail chain might suffer if consumer spending weakens due to a recession. - Using a Single Ratio
Leaning on just the P/E ratio or just the P/B ratio can give a misleading view. Always combine multiple metrics to see the whole story. - Getting Trapped by “Cheap” Stocks (Value Traps)
A stock can look cheap because its price is low, but it might be on the decline for valid reasons—like outdated products or lost market share. Investigate thoroughly to see if it’s a real bargain or a trap. - No Margin of Safety
If you’re buying a stock when it’s only slightly below what you think it’s worth, you have little cushion if your analysis proves too optimistic. Aim for a decent discount to protect yourself. - Emotional Investing
Fear of missing out (FOMO) or panic-selling when the market dips can be dangerous. Stick to your analysis and don’t let short-term emotions derail you. - Not Reviewing Holdings Regularly
Businesses evolve, industries shift, and new competitors appear. Check in on your investments to ensure the original reasons you bought a stock still hold true.
Remember, mistakes are part of learning. The goal is to minimize them and build confidence in your strategy over time.
Conclusion
Fundamental analysis offers a roadmap for anyone who wants to invest in stocks with a clear, logical approach. Instead of chasing hot tips or reacting to short-term market swings, you’re trying to understand the true worth of a company based on its finances, its leadership, its competitive advantages, and the world around it. Here’s a final recap of the key points we covered:
- Fundamental vs. Technical Analysis
While technical analysis focuses on charts and price trends, fundamental analysis digs into the business itself to find its intrinsic value. - Core Principles
Ideas like intrinsic value, margin of safety, and a long-term outlook help keep you disciplined. - Financial Statements
The income statement, balance sheet, and cash flow statement each reveal different aspects of a company’s financial health. - Financial Ratios
Profitability, liquidity, leverage, efficiency, and valuation ratios help you quickly gauge strengths and weaknesses. - Qualitative Factors
Management quality, corporate ethics, competitive advantages, and brand reputation can greatly influence a company’s success but aren’t always evident in just the numbers. - Big-Picture Analysis
Consider the broader economic trends, regulatory environment, and overall industry conditions before deciding on an investment. - Valuation Methods
Tools like DCF, comparables, DDM, and sum-of-the-parts can help you figure out whether a stock’s current price makes sense. - Growth vs. Value
Both styles rely on fundamental analysis but aim for different types of companies and risk profiles. - Building & Managing a Portfolio
Use fundamental analysis at every step—from screening stocks to rebalancing your holdings—and keep a long-term view. - Common Pitfalls
Watch out for value traps, emotional decisions, and focusing too much on a single metric or only on the past.
If you’re just starting out, pick a few companies you’re genuinely interested in and review their annual reports. Look at how sales, profits, and cash flows have trended over a few years. Then dig deeper into their competitive landscape and management strategies. Do they have a strong edge in their market, or are they trying to break into a crowded space? Are they consistently making money, or is cash flow patchy?
Try to estimate a fair value using simple ratios at first—like comparing P/E ratios to industry averages. If you get more comfortable, you can explore DCF models or other valuation techniques. And remember, always leave yourself a margin of safety in case something goes wrong or your assumptions turn out to be too rosy.
By sticking to the process of fundamental analysis, you shift your mindset from short-term guessing to long-term investing. You learn to focus on whether the business is strong and can grow sustainably, rather than obsessing over day-to-day stock price noise. Over time, this approach can give you more confidence in your stock picks and help you avoid some of the emotional roller coasters that many investors experience.
Action Steps Going Forward:
- Pick a company you like. Download its annual report (often called a 10-K in the U.S.) and read at least the sections on business overview, risk factors, and financial statements.
- Calculate a few key ratios (like the current ratio, net profit margin, and P/E). See how they compare year over year and against other companies in the same industry.
- Keep an eye on news for that company. Did management miss their guidance? Are they launching a new product? Any legal or regulatory troubles?
- Revisit your analysis every quarter or at least every year to see if the story has changed.
Over time, you’ll sharpen your skills and start spotting trends—and red flags—that you might have missed before. That’s the beauty of fundamental analysis: the more you practice, the better you get at reading the tea leaves of a company’s financial and strategic direction.
Thanks for reading this comprehensive guide. Hopefully, it helps set a strong foundation for your investing journey.
Frequently Asked Questions (FAQ)
1. What is Fundamental Analysis, and why is it important?
Fundamental analysis is a method of evaluating a stock by analyzing the company’s financial health, industry trends, management quality, and economic conditions. It helps investors determine a stock’s intrinsic value and decide whether it is overvalued, undervalued, or fairly priced.
2. How is Fundamental Analysis different from Technical Analysis?
Fundamental analysis focuses on the company’s actual business performance, such as revenue, earnings, and competitive advantage.
Technical analysis, on the other hand, looks at price charts, trends, and trading volume to predict future price movements.
3. What are the key financial statements used in Fundamental Analysis?
The three main financial statements are:
- Income Statement: Shows revenue, expenses, and profitability.
- Balance Sheet: Lists assets, liabilities, and shareholder equity.
- Cash Flow Statement: Tracks cash inflows and outflows, indicating liquidity and financial stability.
4. What financial ratios are most important for analyzing stocks?
Some key ratios include:
- Price-to-Earnings (P/E) Ratio: Compares stock price to earnings per share.
- Debt-to-Equity (D/E) Ratio: Measures financial leverage.
- Return on Equity (ROE): Shows profitability relative to shareholder investment.
- Current Ratio: Measures liquidity and ability to pay short-term obligations.
- Price-to-Book (P/B) Ratio: Compares stock price to book value per share.
5. What is the Discounted Cash Flow (DCF) model?
DCF is a valuation method that estimates a company’s intrinsic value by calculating the present value of expected future cash flows. This helps investors determine if a stock is trading above or below its true worth.
6. How does the Dividend Discount Model (DDM) work?
DDM is used for valuing dividend-paying stocks. It estimates the stock price based on the present value of future expected dividends. This method is useful for investors focused on dividend income.
7. What is Sum-of-the-Parts (SOTP) Valuation?
SOTP valuation is used for companies with multiple business segments. Each segment is valued separately based on its earnings and market conditions, and then all values are summed to determine the company’s total worth.
8. Should I focus on Growth Investing or Value Investing?
It depends on your investment goals:
- Growth Investing: Focuses on companies with high earnings growth potential (e.g., tech startups). Higher risk but greater rewards.
- Value Investing: Looks for undervalued companies with strong fundamentals. More stable but with slower returns.
9. How do macroeconomic factors affect fundamental analysis?
Economic conditions such as interest rates, inflation, GDP growth, and unemployment can impact stock valuations. A strong economy boosts company profits, while a weak economy can reduce consumer spending and corporate earnings.
10. How can beginners start using Fundamental Analysis?
- Begin with basic financial ratios like P/E and ROE.
- Read a company’s annual report (10-K) to understand its business model.
- Compare stocks within the same industry to get a better valuation perspective.
- Follow macroeconomic trends to see how they affect industries and companies.