In today’s dynamic financial markets, knowing how to use trading metrics is essential for success. Trading metrics quantifiable data points offer valuable insights into strategy performance and optimization. By understanding and leveraging these metrics, you can effectively manage risk, identify profitable opportunities, and maintain consistency in even the most unpredictable market environments.
This comprehensive guide will show you how to use trading metrics to adapt to changing market conditions. From key definitions to practical examples, this article is packed with actionable insights to help traders at any level make smarter, data-driven decisions.
Table of Contents
What Are Trading Metrics?

Trading metrics are quantifiable data points that help traders evaluate the effectiveness of their strategies, measure performance, gauge risk, and identify areas for improvement. These metrics can cover a wide range of areas:
- Profit and loss measurement: Tracking how much capital is gained or lost over a given period.
- Risk metrics: Understanding exposure to volatility and market downturns.
- Market condition metrics: Evaluating broader market sentiment, trend strength, and volatility to fine-tune trading decisions.
By examining these metrics, traders can make informed decisions on where to adjust position sizing, how to set stop losses, and which market segments to focus on. A thorough understanding of trading metrics is crucial for adapting to changing market conditions—whether it’s a bullish, bearish, or sideways market.
Why Are Trading Metrics Important?
- Risk Management: Metrics like maximum drawdown and volatility help traders protect their capital by highlighting the risk levels of current strategies.
- Performance Evaluation: Tracking win rate or profit factor can reveal strengths and weaknesses in a trading approach.
- Consistency and Discipline: Consistent tracking discourages impulsive decisions, allowing traders to follow a structured plan.
- Adaptability: Metrics indicate when market conditions change, guiding traders toward strategies that are more appropriate for bull, bear, or sideways environments.
- Emotional Control: With objective data, traders can reduce emotional interference and focus on systematic improvements.
In essence, trading metrics act as a feedback loop. You devise a strategy, implement it, gather data, and then evaluate that data. This ongoing cycle allows you to refine your strategies over time.
Common Categories of Trading Metrics
While there are countless metrics traders can use, most metrics fall into three primary categories: Performance Metrics, Risk Metrics, and Market Condition Metrics.
1. Performance Metrics
Performance metrics evaluate how effectively a trading strategy generates profits and manages losses. They measure aspects like win rate, average profit/loss, and profit factor (which compares total profits to total losses).
2. Risk Metrics
Risk metrics focus on the potential downsides and volatility of a trading strategy. These include metrics such as maximum drawdown, Sharpe ratio, Sortino ratio, and beta (which measures a portfolio’s volatility relative to the market).
3. Market Condition Metrics (Volatility, Trend, Sentiment)
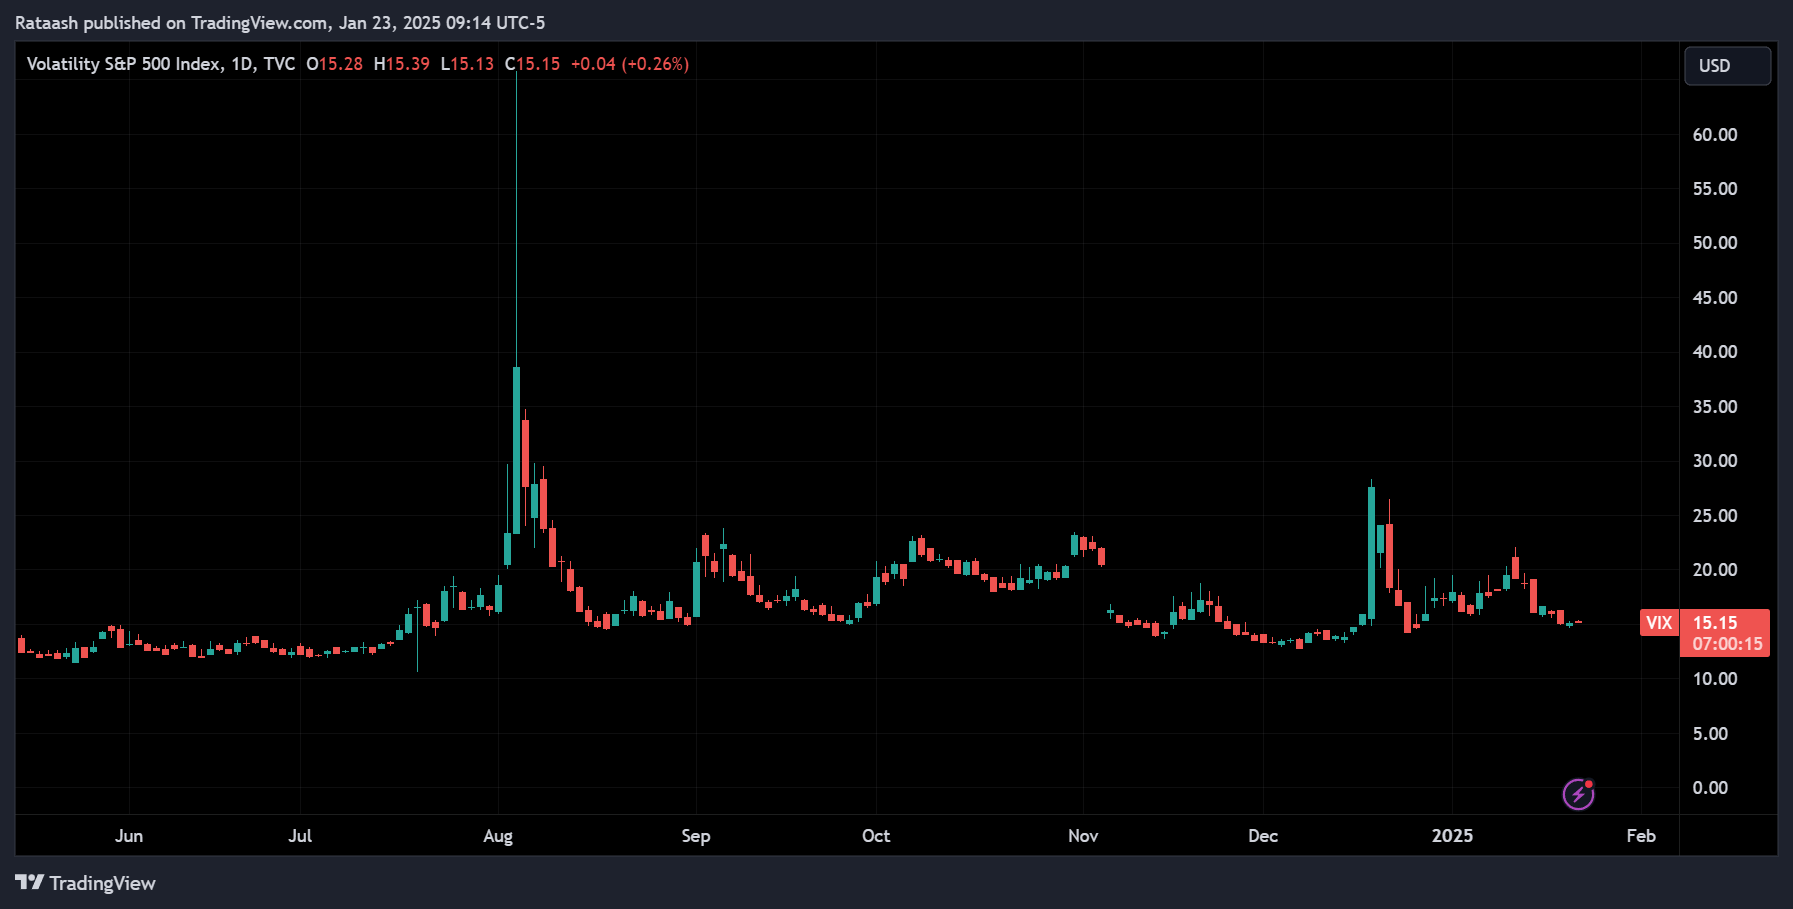
Market condition metrics help identify whether you’re in a bull, bear, or range-bound market. Volatility (like the VIX index), trend analysis (through moving averages or trendlines), and market sentiment (survey data, put/call ratios, etc.) are all key to recognizing shifts in the broader market environment.
Popular Trading Metrics Explained
Below is a deep dive into some of the most popular trading metrics you’ll encounter. Understanding these in detail will help you make more data-driven decisions and adapt to market changes quickly.
1. Win Rate (Batting Average)
- Definition: The percentage of trades that close in profit relative to the total number of trades taken.
Calculation:

- Interpretation: A high win rate (above 50%) may be desirable, but it doesn’t guarantee profitability. A system can have a high win rate yet still lose money if losses on losing trades outweigh gains.
- Example: If you place 100 trades and 55 of them are profitable, your win rate is 55%.
While the win rate is an easy metric to understand, it should never be used in isolation. It must be paired with measures of average profit and loss to gain a full picture.
2. Average Profit/Loss
- Definition: The average monetary amount gained or lost per trade.
Calculation:
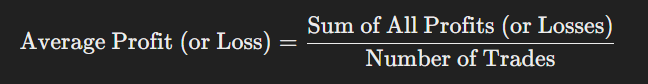
- Interpretation: This metric helps you assess how much you typically gain for each winning trade and how much you typically lose for each losing trade.
- Example: If over 100 trades, your total profit is $5,000, the average profit per trade is $50.
Traders can use average profit/loss in conjunction with the win rate to evaluate if a strategy is truly profitable. For instance, a low win rate can still be profitable if the average profit significantly outweighs the average loss.
3. Risk-Reward Ratio
- Definition: A ratio that compares potential profit to potential risk (loss) on a single trade or strategy.
- Calculation Example: If you risk $100 to potentially make $300, your risk-reward ratio is 1:3.
- Interpretation: Traders often aim for higher risk-reward ratios (e.g., 1:2 or 1:3) to ensure that their winning trades more than compensate for their losing ones.
- Example: If you place a stop-loss at $100 below your entry and a take-profit at $200 above your entry, your risk-reward ratio is 1:2.
This is particularly important in volatile markets, where you want to ensure that your potential profits outweigh your losses.
4. Maximum Drawdown
- Definition: The largest peak-to-trough drop in your trading account equity over a specific period.
- Calculation: Typically measured as a percentage from the highest equity point to the subsequent lowest point before a new high is made.
- Interpretation: A high maximum drawdown indicates significant risk in your trading approach. It helps you understand the worst-case scenario in terms of account balance declines.
- Example: If your account goes from $10,000 to $8,000 before rising again, the drawdown is $2,000 or 20%.
Knowing your maximum drawdown helps you decide if a trading strategy is tolerable. Some traders can handle a 20% drawdown, while others may consider that too risky.
5. Sharpe Ratio
- Definition: A measure of the excess return (above the risk-free rate) per unit of volatility or total risk.
Calculation:
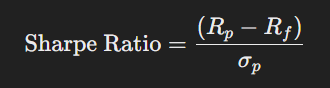
Where:
- Rp = Portfolio return
- Rf = Risk-free rate
- σp = Standard deviation of the portfolio’s excess return
- Interpretation: A higher Sharpe ratio indicates better risk-adjusted returns. For many traders, a Sharpe ratio above 1.0 is considered good, above 2.0 is excellent, and above 3.0 is exceptional.
The Sharpe ratio helps you understand how effectively a strategy uses risk to generate returns.
6. Sortino Ratio
- Definition: A refinement of the Sharpe ratio that focuses only on downside volatility (instead of total volatility).
Calculation:
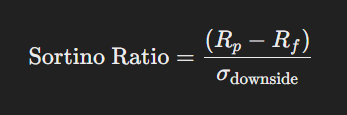
Where:
- σdownside = Standard deviation of negative returns only
- Interpretation: The Sortino ratio is particularly useful for evaluating strategies that experience little downside risk but may have high upside volatility. It penalizes only negative volatility rather than overall volatility.
If your trading system aims to minimize losses at the expense of missed gains, the Sortino ratio can be more telling than the Sharpe ratio.
7. Profit Factor
- Definition: The ratio of the gross profit of your profitable trades to the gross loss of your losing trades.
Calculation:
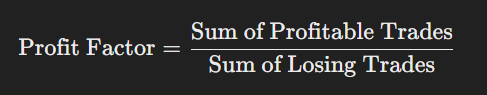
- Interpretation: A profit factor above 1.0 means your strategy is profitable overall; the higher, the better. A profit factor of 2.0 indicates that your total profits are twice your total losses.
- Example: If you made $5,000 from profitable trades and lost $2,500 from losing trades, your profit factor is 2.0.
Profit factor is a straightforward but powerful metric for summarizing profitability.
8. Equity Curve
- Definition: A visual representation of your trading account balance over time.
- Usage: By plotting account equity (or cumulative profits and losses) on a graph, you get a clearer picture of how performance evolves.
- Interpretation: An upward-sloping equity curve indicates profitable trading, while large swings up and down can show high volatility or inconsistent performance.
- Example: If you track daily or weekly account equity, you’ll quickly identify extended drawdown periods and changes in performance trends.
Monitoring your equity curve helps you see patterns of consistency or detect early signs that a strategy might be failing.
9. Volatility Measures (Standard Deviation, Beta)
- Standard Deviation: Measures the variation or dispersion of returns around the mean. A higher standard deviation indicates greater volatility.
- Beta: Measures how an asset or portfolio moves relative to the broader market. A beta above 1 suggests more volatility than the market, while a beta below 1 suggests less volatility.
Volatility metrics are essential for position sizing and setting stop-losses in rapidly fluctuating markets.
10. Technical Indicators (RSI, MACD, Bollinger Bands, etc.)
These are more “dynamic” metrics but are still critical for adapting to market conditions:
- RSI (Relative Strength Index): Measures the speed and magnitude of price changes to identify overbought or oversold conditions.
- MACD (Moving Average Convergence Divergence): Helps identify momentum shifts and trend changes.
- Bollinger Bands: Calculate a moving average plus and minus standard deviations to highlight potential overbought/oversold price levels.
These indicators can be used in tandem with performance and risk metrics to time entries and exits effectively.
11. Fundamental Metrics (Earnings, P/E Ratio, etc.)
For traders who incorporate fundamental analysis, these metrics are crucial:
- Earnings per Share (EPS): Indicates a company’s profitability.
- Price-to-Earnings (P/E) Ratio: Compares a company’s share price to its per-share earnings to gauge relative valuation.
- Revenue Growth, Debt-to-Equity, Return on Equity (ROE): Evaluate the financial health and growth potential of a company.
In certain market conditions—especially in long-term bull runs—fundamental metrics can guide value and growth investing strategies.
How to Collect and Analyze Trading Metrics

Accurate data collection and regular analysis are essential for making the best use of trading metrics. Here’s how to structure your approach.
1. Manual Tracking
- Spreadsheet Software (Excel, Google Sheets): Enter trade details such as entry price, exit price, stop-loss, take-profit, and timeframes.
- Pros: Full customization, total control over your data.
- Cons: Labor-intensive, prone to human error, time-consuming.
2. Automated Tools and Trading Journals
- Brokerage Platform Analytics: Many brokers offer built-in reporting tools.
- Third-Party Tools (e.g., Trading Journal Software): Automatically import trades for analysis.
- Pros: Saves time, reduces errors, provides pre-built analytics.
- Cons: Subscription costs, less customization.
3. Data Organization
- Categorize by Strategy: Keep trades grouped by the type of strategy (e.g., swing trading, day trading, options selling).
- Time Period Segmentation: Review metrics over different time horizons (daily, weekly, monthly, quarterly).
- Market Condition Tagging: Mark trades made in bullish, bearish, or sideways markets to see how each strategy performs in each environment.
4. Regular Review and Analysis
- Weekly or Monthly Review: Regularly update your data and check key metrics like win rate, average profit/loss, and maximum drawdown.
- Quarterly or Annual Deep Dive: Assess changes in your overall strategy, risk tolerance, and market outlook.
- Actionable Improvements: Use insights to adjust risk management, position sizing, or even the choice of instruments you trade.
Adapting to Bull Markets Using Metrics
1. Identifying a Bull Market
A bull market is characterized by extended price increases and generally positive sentiment. Here are some ways to identify one:
- Increasing Equity Index Values: Major stock indexes like the S&P 500 or NASDAQ show consistent upward trends.
- Positive Economic Indicators: Rising GDP, lower unemployment, and increasing consumer confidence.
- Technical Signals: Simple or exponential moving averages trending upward, breakouts above resistance levels, etc.
2. Performance Metrics in a Bull Market
Bull markets often allow traders to take advantage of momentum or trend-following strategies:
- Win Rate and Average Profit: Because price momentum is strong, you might see a higher win rate if you ride the trend. However, ensure you also monitor your risk.
- Profit Factor: In a trending market, your profit factor can jump if you let winning trades run and cut losing trades quickly.
- Risk-Reward Ratio: In bull runs, it’s tempting to widen stop-losses to avoid being shaken out. However, always ensure that potential reward remains significantly higher than risk.
3. Risk Management Adjustments
Even in a bull market, corrections can happen swiftly:
- Volatility Measures: While overall market sentiment is positive, volatility spikes can occur during market pullbacks. Monitor Beta and VIX levels to adjust position sizes when volatility rises.
- Position Sizing: Incrementally increase your position size only if your metrics (e.g., Sharpe ratio, win rate) show consistent success.
- Trailing Stop-Losses: Use trailing stops to lock in gains if the market turns.
4. Market Sentiment Indicators
- Investor Surveys (e.g., AAII Sentiment Survey): Bullish readings can confirm upward momentum, but extremely bullish sentiment may signal an overheated market.
- Put/Call Ratio: A very low put/call ratio can indicate excessive bullishness, often a contrarian signal.
Keep sentiment metrics balanced with fundamental and technical insights to avoid chasing overvalued assets.
Adapting to Bear Markets Using Metrics
1. Recognizing a Bear Market
A bear market is generally defined as a 20% or more decline in broad market indexes over a sustained period. Indicators include:
- Falling Equity Indexes over multiple weeks or months.
- Negative Economic Reports (e.g., high unemployment, declining consumer confidence).
- Technical Signals such as lower lows, lower highs, and moving averages sloping downward.
2. Protecting Capital with Risk Metrics
- Maximum Drawdown: Monitor carefully. In a bear market, you want to keep your drawdown as small as possible.
- Sharpe and Sortino Ratios: Deteriorating ratios can indicate the strategy is underperforming given the new market volatility.
- Volatility Measures: Elevated VIX levels signal heightened fear, which may require tighter stop-losses or smaller positions.
3. Adjusting Strategy and Position Sizing
- Short Selling or Inverse ETFs: Some traders use short positions or inverse ETFs to profit from declining prices.
- Defensive Sectors: Sectors like consumer staples, utilities, and healthcare are less sensitive to economic downturns, making them viable during bear markets.
- Safe Haven Assets: Gold or government bonds are often considered safe havens when equities are falling.
4. Evaluating Fundamental and Technical Signals
- Fundamentals: Look for companies with strong balance sheets, low debt, and stable earnings as they might weather a bear market better.
- Technical Indicators: Momentum indicators (e.g., RSI, MACD) in oversold regions can point to potential bounces or reversals.
Adapting to Sideways/Range-Bound Markets Using Metrics
1. Detecting Range-Bound Conditions
A range-bound market is when prices oscillate between a defined support and resistance level without a clear upward or downward trend. Look for:
- Sideways Moving Averages: Shorter and longer-term moving averages converge or move horizontally.
- Horizontal Support and Resistance: Price repeatedly bounces off similar lows and highs without breaking out.
- Low Volatility Indicators: Bollinger Bands might tighten as price variation narrows.
2. Identifying Relevant Indicators
- Oscillators: RSI or Stochastic Oscillator can be useful for spotting overbought and oversold conditions within a range.
- Volume Analysis: Low volume often corresponds to less conviction in price movement, typical of a sideways market.
3. Strategy Tweaks for Low Volatility
- Range Trading: Buy near support and sell near resistance or use mean reversion strategies.
- Short-Term Trades: Quick scalps or day trades can capture small price movements.
- Option Strategies: Iron condors, credit spreads, or butterflies can profit from stable, non-trending prices.
4. Trading Psychology in Sideways Markets
- Patience is Key: Sideways markets can be boring, tempting traders to overtrade.
- Avoid Over-Leveraging: Lower volatility doesn’t necessarily mean lower risk. Whipsaws can still happen.
By carefully monitoring metrics like average profit/loss and win rate, you can determine if range-bound strategies are performing well.
Advanced Topics and Specialized Metrics

If you’re more advanced or interested in specialized trading approaches, here are some additional metrics and topics to consider.
1. High-Frequency Trading Metrics
- Latency: The time it takes for a trading signal to be executed.
- Fill Rate: The percentage of orders successfully filled at the desired price.
- Slippage: The difference between the expected fill price and the actual fill price.
2. Algorithmic Trading Metrics
- Annualized Return vs. Benchmark: Measures how an algorithmic strategy compares to a standard benchmark over a year.
- Alpha: Indicates how much a strategy outperforms the market on a risk-adjusted basis.
- Drawdown Duration: How long it takes to recover from the deepest drawdown.
3. Sector-Specific Metrics
Depending on what you trade (commodities, currencies, stocks), sector-specific metrics can be invaluable:
- Commodities: Look at inventory levels, seasonal trends, and open interest in futures markets.
- Currencies (Forex): Track interest rate differentials, CFTC positioning, and purchasing power parity.
- Stocks: Focus on earnings growth, profit margins, dividend yields, and insider buying/selling.
4. Economic Indicators and Macroeconomic Data
- GDP Growth, Inflation, Interest Rates: Macroeconomic data can drive entire markets, impacting both equities and commodities.
- Central Bank Policies: Decisions on interest rates, quantitative easing, and other policies can significantly alter market sentiment and valuations.
Common Mistakes and Pitfalls

Even the most meticulous traders can stumble if they misuse or misunderstand trading metrics. Here are key pitfalls to avoid:
1. Over-Reliance on a Single Metric
Relying solely on win rate or Sharpe ratio can mask underlying issues. Always combine multiple metrics (e.g., maximum drawdown, Sortino ratio, profit factor) to get a well-rounded view.
2. Ignoring Market Context
A strong strategy in a bull market may fail in a bear market. Market conditions (volatility, sentiment, macro factors) are crucial for interpreting your metrics correctly.
3. Emotional Bias and Overtrading
Data can help reduce emotional decisions, but traders often fall back into emotional patterns like revenge trading after losses. Stick to your metrics and trading plan to maintain discipline.
Case Studies: Real-World Applications of Trading Metrics
1. Bull Market Example
- Scenario: In 2020–2021, U.S. equities soared. A swing trader using a trend-following system might see a win rate jump from 50% to 65%.
- Metrics in Action: The Sharpe ratio could rise significantly if daily volatility remained moderate while returns skyrocketed. The trader continued to raise position sizes after each new equity high, managing risk with trailing stops.
- Outcome: The equity curve displayed a steady upward trend, with a maximum drawdown limited to 10% thanks to disciplined stop management.
2. Bear Market Example
- Scenario: During the 2008 Financial Crisis, markets fell sharply. A trader using a long/short equity strategy saw their win rate dip, but short positions offset losses.
- Metrics in Action: The Sortino ratio was more telling than the Sharpe ratio, as downside risk was the primary concern. The trader regularly monitored maximum drawdown, which spiked briefly but remained within acceptable limits due to strategic short positions.
- Outcome: While many long-only portfolios suffered 40–50% drawdowns, the trader’s strategy limited losses to 15%, illustrating the power of adjusting based on market conditions.
3. Range-Bound Market Example
- Scenario: In a low-volatility environment, say mid-2013 for some currency pairs, prices fluctuated within tight ranges.
- Metrics in Action: The trader used a mean-reversion strategy with the Stochastic Oscillator to buy oversold conditions near support and sell overbought conditions near resistance.
- Outcome: While the overall profit factor was modest (around 1.5), the trader maintained a high win rate (70–75%), capturing small but consistent gains until volatility spiked.
Best Practices for Using Trading Metrics
- Combine Multiple Metrics: A single number never tells the whole story. Pair win rate with average profit/loss, Sharpe ratio with Sortino ratio, etc.
- Contextualize with Market Conditions: Know if your strategy and metrics are suitable for bull, bear, or sideways markets.
- Review Regularly: Schedule weekly or monthly check-ins to update your trading journal or analytics software.
- Use Forward Testing and Backtesting: Historical data can guide you, but always validate metrics in live market conditions.
- Stay Adaptable: If you notice a metric consistently trending downward, it may signal the need to adjust or pivot your strategy.
- Maintain Discipline: Adhering to the data will help you avoid impulsive decisions that undermine your trading plan.
Conclusion
Trading metrics are not just about tracking profits and losses; they are a compass that guides your trading decisions through different market terrains—bullish, bearish, or sideways. By diligently recording and analyzing metrics such as win rate, maximum drawdown, Sharpe ratio, profit factor, and various technical and fundamental indicators, you gain the power to:
- Pinpoint Strategy Strengths and Weaknesses: Understand where and how you perform best.
- Manage Risk Proactively: Use data to size positions correctly, adjust stop-losses, and protect your capital.
- Stay Ahead of Market Shifts: Recognize early warning signs of a changing market and adapt before losses mount.
- Boost Long-Term Consistency: Rely on quantifiable feedback rather than emotional or impulsive decisions.
Whether you’re trading stocks, currencies, or commodities, these metrics form the backbone of a robust and adaptive trading system. The art of trading lies in combining technical insight, fundamental analysis, market sentiment, and sound risk management into a cohesive plan. Trading metrics serve as the language that keeps your plan honest and aligned with the reality of ever-evolving financial markets.
By applying the concepts laid out in this comprehensive guide, you’re setting yourself up for a more disciplined, data-driven, and profitable trading journey. Embrace these metrics, continually refine your approach, and you will be well-equipped to navigate any market condition that comes your way.