![Crypto Market Analysis Today [2024.06.27]: BTC Holds Above 60K, ETH Crashing, BNB Downtrend Continues
xlearnonline.com](https://xlearnonline.com/wp-content/uploads/2024/06/Crypto-Analysis-1.png)
Hi, Welcome to Crypto Market Analysis Today!
- BTC: BTC broke 60K but is trading just above it. Support is around 50500, resistance at 67000. On the 1-hour chart, it’s pulling back up from 60600, heading towards 62400. Watch for consolidation or breakouts.
- ETH: ETH is crashing, pulling back from 3350 support. Next resistance is 3650. On the 1-hour chart, it’s heading up, possibly to 3500. It may pull back or consolidate there.
- BNB: BNB is crashing after hitting 720, breaking support at 635, and heading to 508. The 1-hour chart shows a downtrend, with potential pullbacks or moves up to 630 if it breaks above 590.
Key Economic Events Today
These events encompass important global news, macroeconomic reports, and economic indicators. For more details, you can check the CoinMarketCal & Crypto Craft
- US President Biden will speak at the first presidential debate of the 2024 general election in Atlanta. If the debate mentions crypto, it will impact the market.
BTC
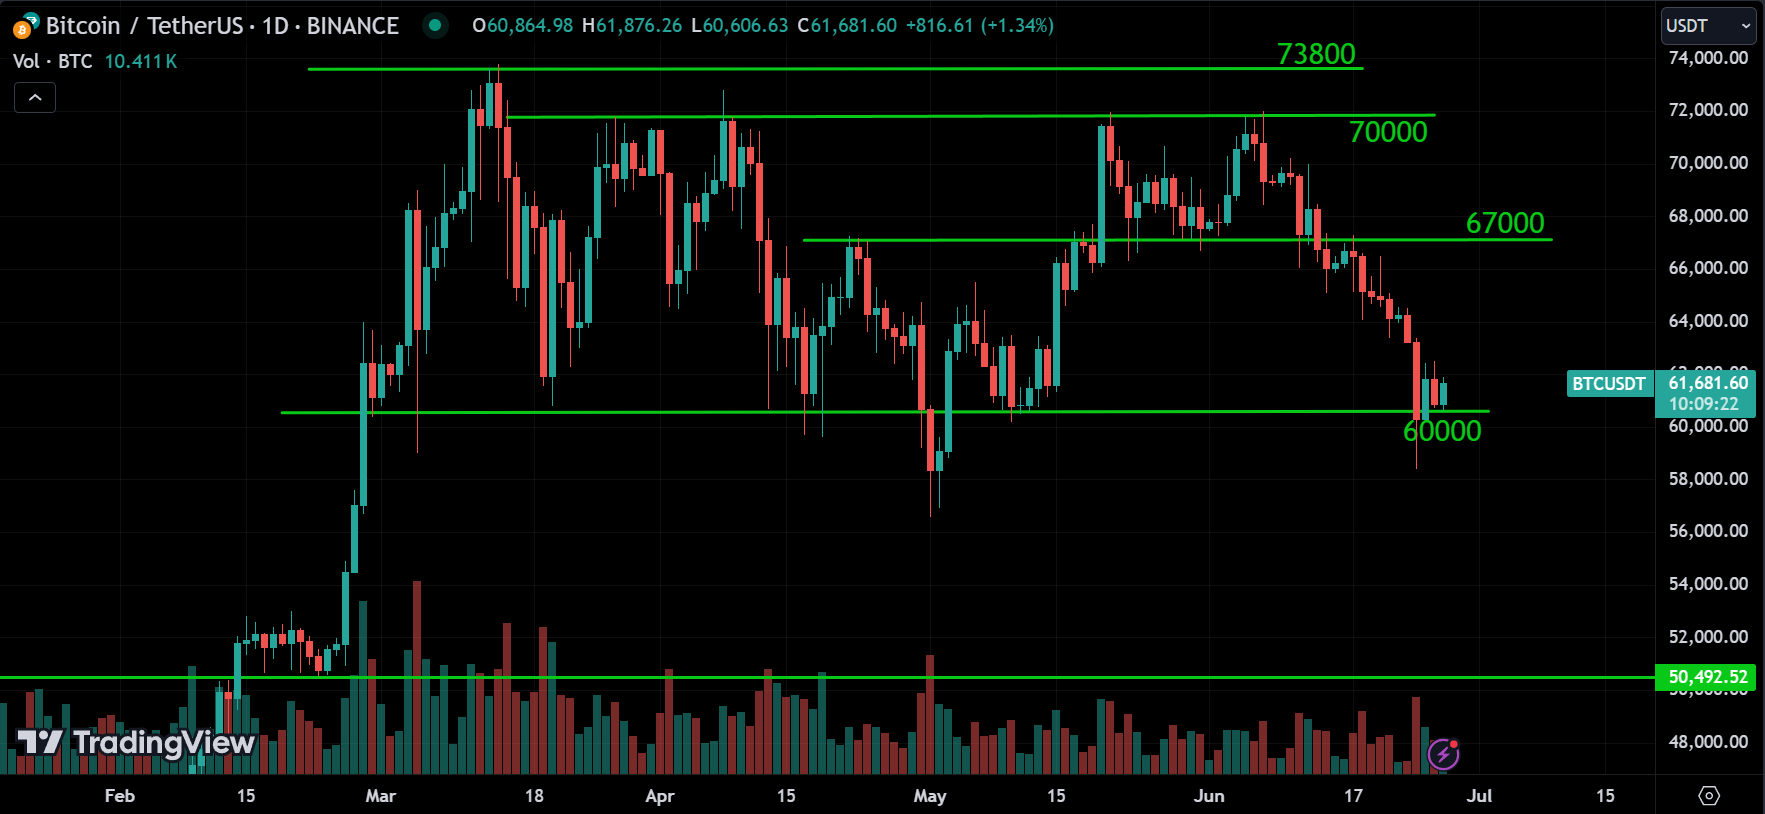
Looking at BTC, even though it broke the 60K level, it’s now trading just above that level. The next major support is around 50500, and the resistance is around 67000.
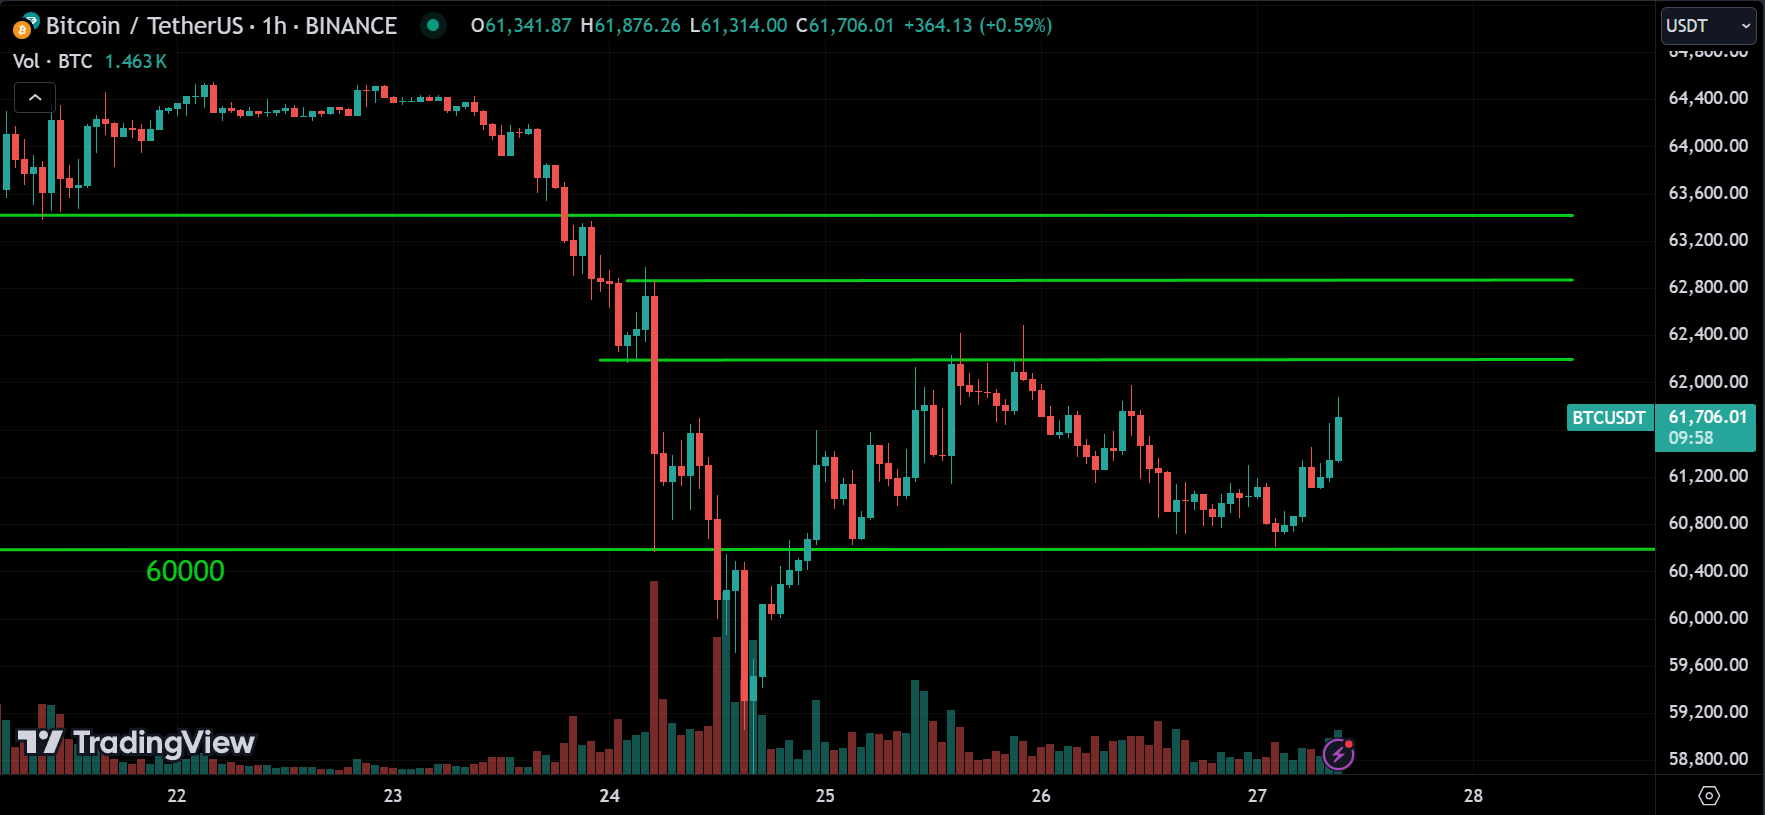
Looking at the 1-hour chart, you can see the price is pulling back up from the 60600 level and heading towards the resistance around 62400. We can expect the price to consolidate around these levels for a bit. If the price breaks either of these levels, it will move in that direction next.
ETH
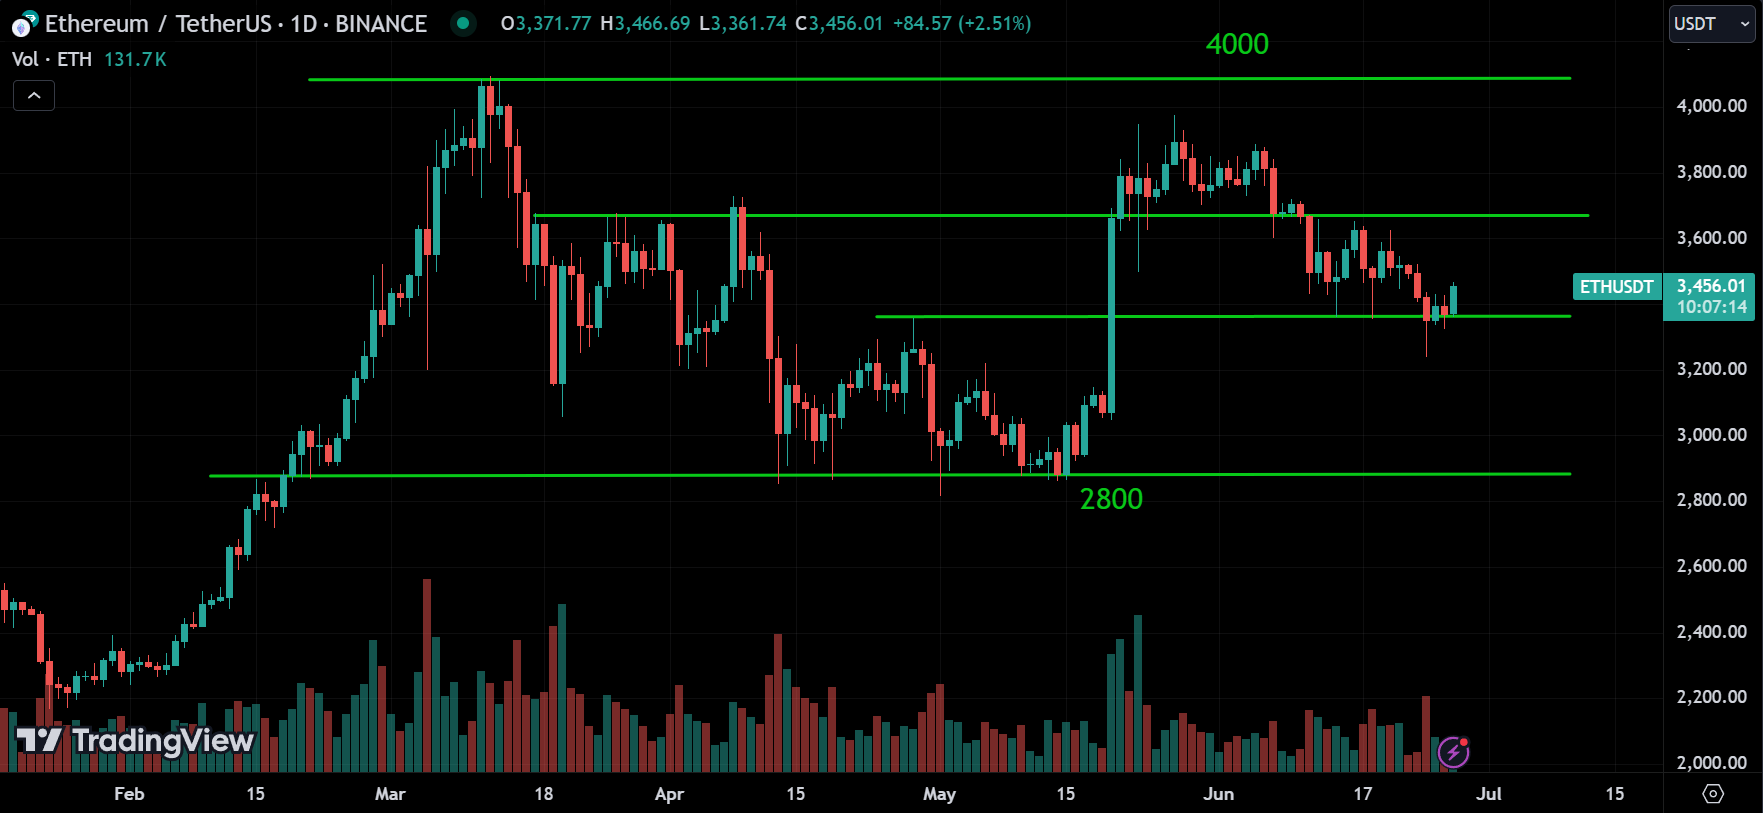
Looking at ETH, it’s definitely crashing. It’s pulling back up from the 3350 level, which might be a support. The next resistance is around 3650.
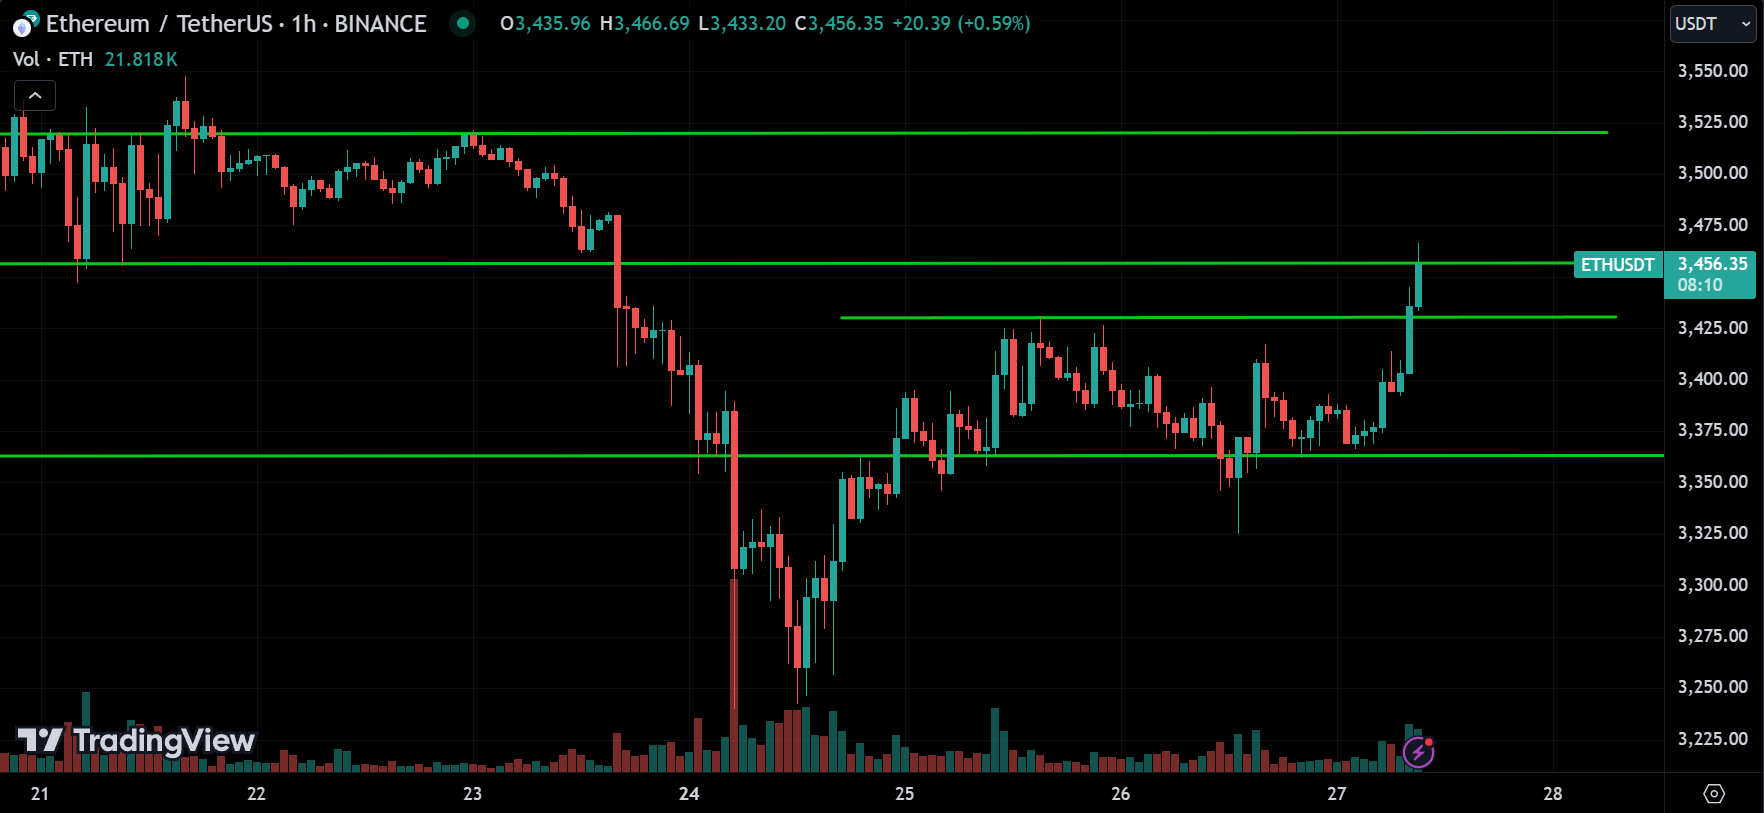
Looking at the 1-hour chart, you can see the price heading up. The next stop might be around the 3500 level, and the price may pull back from there. If the price breaks that level, it will continue to go up, but it’s more likely that the price will head down or consolidate at that level.
BNB
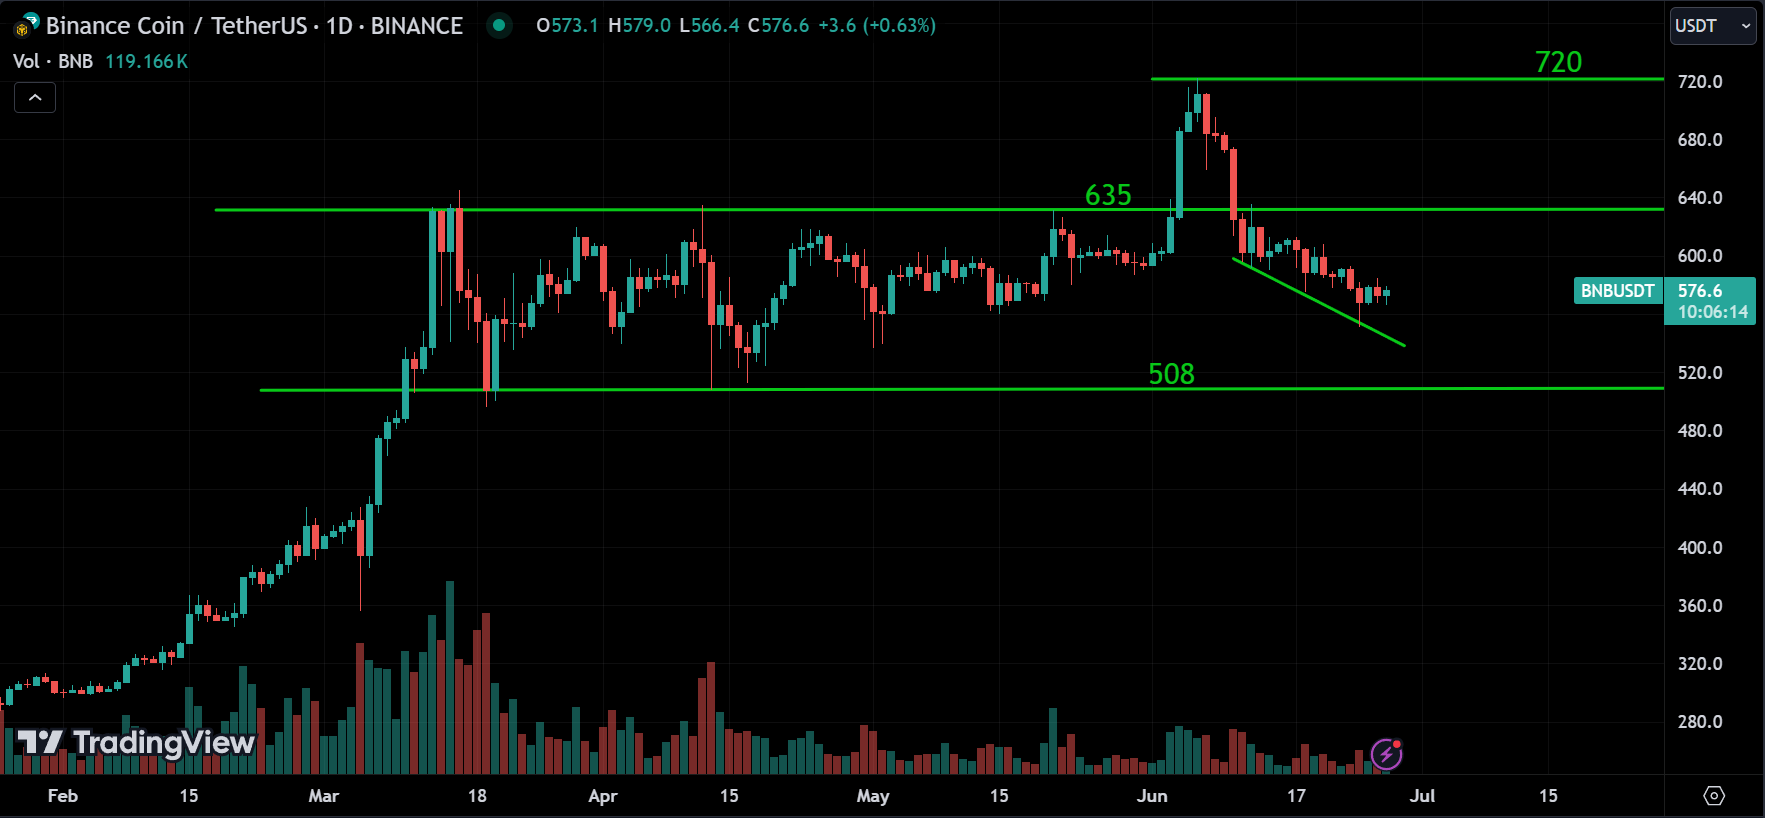
Looking at BNB, after reaching a high of around 720, it’s crashing. It broke the support at 635 and is heading for the next support around 508.
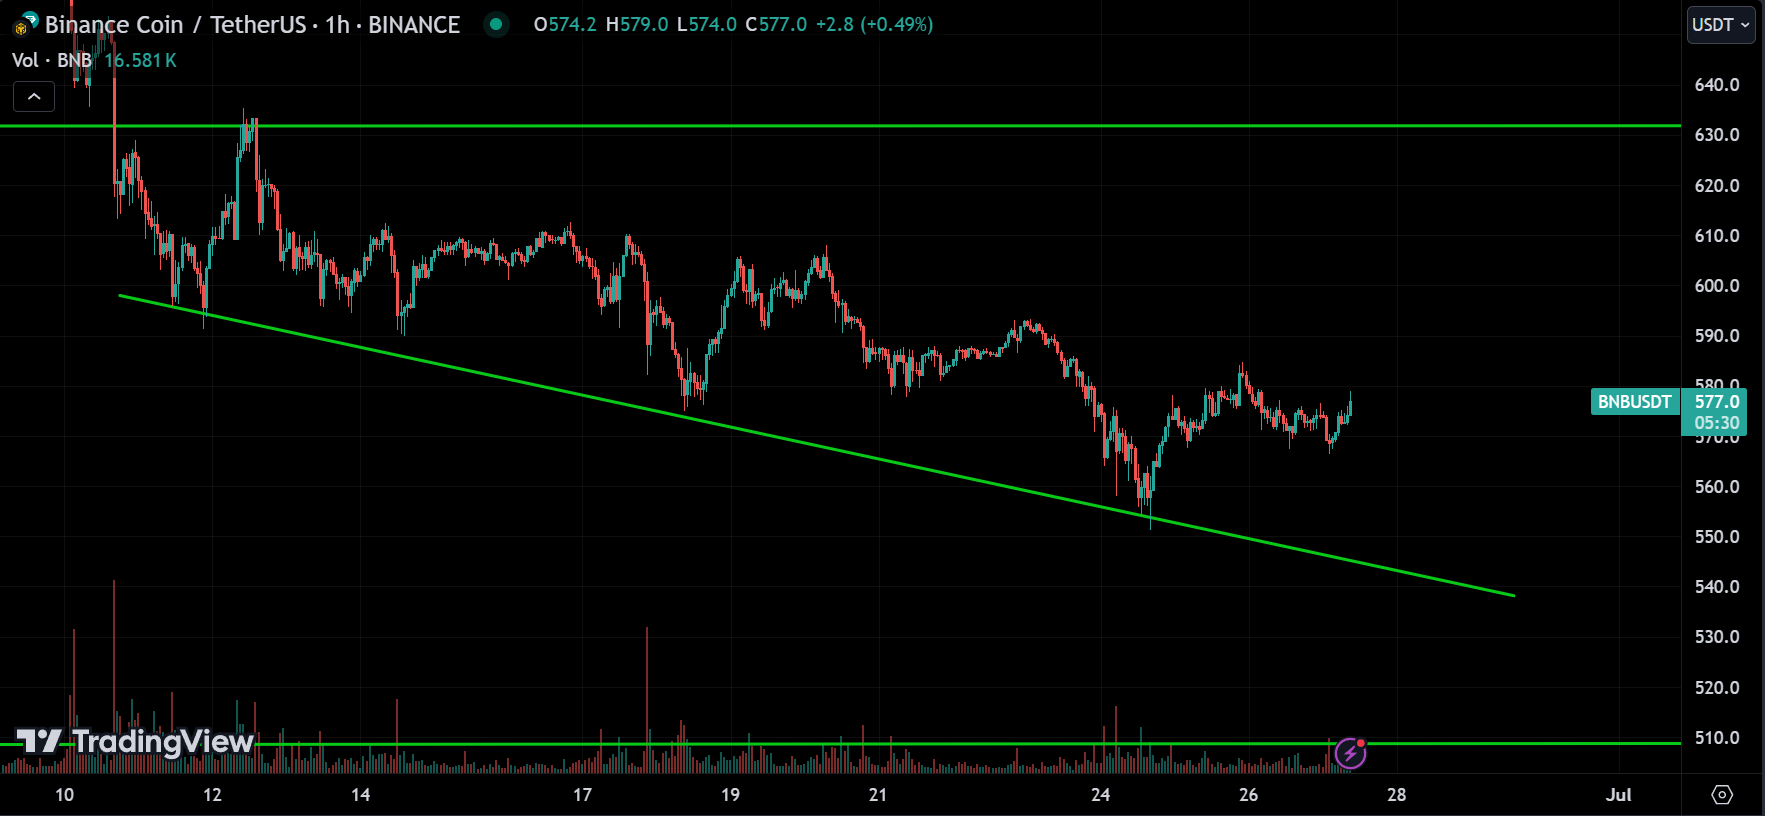
Looking at the 1-hour chart, you can clearly see the downtrend. Right now, the price is at a higher level, so it will either pull back soon or break above this level. If the price goes above 590, it will likely reach 630 before pulling back. If the price pulls back as expected, it will find support around the trendline indicating the downtrend.
Conclusion & Disclaimer
Please provide your feedback on how we can improve this article. Thank you!
These analyses are here to help you understand how to analyze the market. They’re not about giving buy or sell signals. It’s simply about observing market behavior. I don’t recommend when to buy or sell because trading doesn’t work that way. You need a strategy to guide your decisions about when to enter or exit positions. That’s the key to making consistent profits in the financial markets over time.
The information provided in this market analysis is for educational and informational purposes only. It should not be construed as financial advice or a recommendation to buy, sell, or hold any securities or investments.
All investments involve risk, and past performance is not indicative of future results. The analysis provided may not be suitable for all investors and should be used at their own discretion.
Readers are encouraged to conduct their own research.
Trading and investing in financial markets carry inherent risks, including the risk of losing invested capital. It is important to carefully consider your investment objectives, risk tolerance, and financial situation before making any investment decisions.
GOOD LUCK!!!