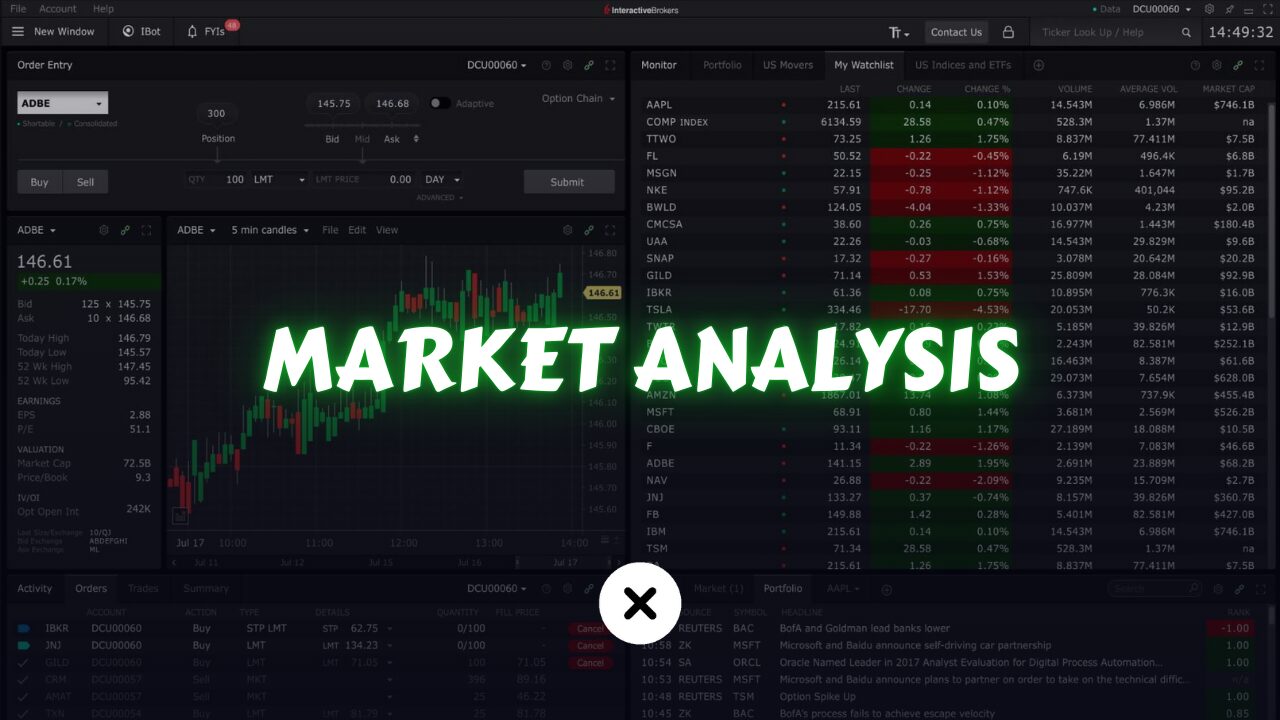
Market analysis is an essential tool for both traders and investors, providing the foundation needed to navigate the complexities of financial markets. Whether you’re trading stocks, forex, or cryptocurrencies, understanding market trends, economic indicators, and technical patterns is crucial for making informed decisions. Our market analysis articles are designed to offer comprehensive insights and data, helping you to stay ahead of market movements and optimize your trading strategy.
Each article delves into the latest market developments, offering detailed analyses of key economic events, sector performance, and individual asset behavior. We combine macroeconomic perspectives with technical analysis to give you a well-rounded view of the markets. This allows you to not only grasp the broader economic context but also pinpoint specific opportunities within your preferred asset classes.
By regularly following our market analysis, you’ll gain a deeper understanding of how various factors influence market dynamics, from global events and policy changes to company earnings and technological advancements. Whether you are a seasoned trader or just starting, our insights are tailored to help you identify trends, spot opportunities, and mitigate risks in your trading journey.
Here’s a step-by-step guide to using our articles effectively to enhance your trading strategy, ensuring you make well-informed decisions based on solid analysis.
What are Economic Events?
Economic events are significant occurrences that can impact the financial markets. These events include:
Central Bank Announcements: Interest rate decisions, monetary policy statements, and other communications from central banks can influence currency values and market sentiment.
Employment Reports: Data on employment rates, such as the Non-Farm Payroll (NFP) report in the U.S., can indicate economic health and influence market movements.
Gross Domestic Product (GDP) Data: GDP figures provide insight into a country’s economic performance and can affect investor confidence.
Inflation Reports: Consumer Price Index (CPI) and Producer Price Index (PPI) reports can indicate inflation trends, influencing interest rate decisions and market behavior.
Trade Balance Reports: Data on a country’s imports and exports can affect currency values and overall market sentiment.
Impact of Economic Events on Forex, Stock, and Crypto Markets
Economic events play a crucial role in shaping the movements of forex, stock, and crypto markets. Each market responds differently depending on the nature of the event, the specific data released, and the overall economic context. Understanding these impacts can help traders and investors make more informed decisions.
Forex Market
Interest Rate Decisions: Central bank interest rate decisions are among the most influential economic events for the forex market. When a central bank raises interest rates, it typically strengthens the currency as higher rates attract foreign investment. Conversely, lowering rates can weaken a currency as investors seek better returns elsewhere.
Inflation Reports: Inflation data is closely watched by forex traders because it can signal future central bank actions. High inflation may lead to interest rate hikes, which would strengthen the currency, while low inflation could result in rate cuts, weakening the currency.
Employment Data: Employment figures, such as the U.S. Non-Farm Payrolls (NFP), significantly impact currency values. Strong employment growth often signals economic strength, leading to currency appreciation, while weak employment data can lead to currency depreciation.
Geopolitical Events: Events such as trade wars, political instability, or international conflicts can cause volatility in the forex market. Safe-haven currencies like the U.S. dollar (USD), Japanese yen (JPY), and Swiss franc (CHF) often appreciate during times of uncertainty as investors seek safety.
Stock Market
Earnings Reports: Company earnings reports are critical events for the stock market. Positive earnings surprises can lead to stock price increases, while negative surprises often result in declines. These reports also influence market sentiment and sector performance.
Economic Indicators: Indicators like GDP growth, consumer confidence, and retail sales data directly impact stock markets. Strong economic data typically boosts investor confidence, leading to stock market gains, while weak data can cause declines as investors anticipate lower corporate profits.
Interest Rate Decisions: Just as in the forex market, interest rate decisions impact stock markets. Higher interest rates can lead to higher borrowing costs for companies, potentially reducing profitability and leading to lower stock prices. Conversely, lower rates often stimulate economic growth, boosting stock prices.
Global Events: Geopolitical tensions, trade policies, and natural disasters can cause market uncertainty and volatility. Stocks in sectors directly affected by these events (such as energy during oil price shocks or tech during trade disputes) may experience significant price movements.
Crypto Market
Regulatory Developments: The crypto market is highly sensitive to regulatory news. Announcements of stricter regulations or government crackdowns on crypto trading can lead to sharp declines in crypto prices. On the other hand, positive regulatory developments, such as the approval of crypto ETFs or favorable legislation, can drive prices higher.
Adoption and Technological Advancements: News of increased adoption of cryptocurrencies by major companies or technological advancements in blockchain technology can significantly impact the market. Positive developments in these areas often lead to increased investor confidence and rising prices.
Market Sentiment: The crypto market is heavily influenced by market sentiment and social media trends. Positive news, endorsements from influential figures, or bullish market sentiment can drive prices up quickly, while negative news or bearish sentiment can cause rapid declines.
Macroeconomic Events: Although the crypto market is often seen as separate from traditional financial markets, macroeconomic events can still have an impact. For example, during times of economic uncertainty or inflation concerns, some investors may turn to cryptocurrencies like Bitcoin as a hedge, driving up prices. Conversely, during periods of economic stability, the demand for cryptos as a hedge might decrease.
By understanding the impact of economic events on these markets, traders and investors can better anticipate market movements and adjust their strategies accordingly. Whether you’re involved in forex, stocks, or crypto, staying informed about economic events and their potential effects is key to successful trading.
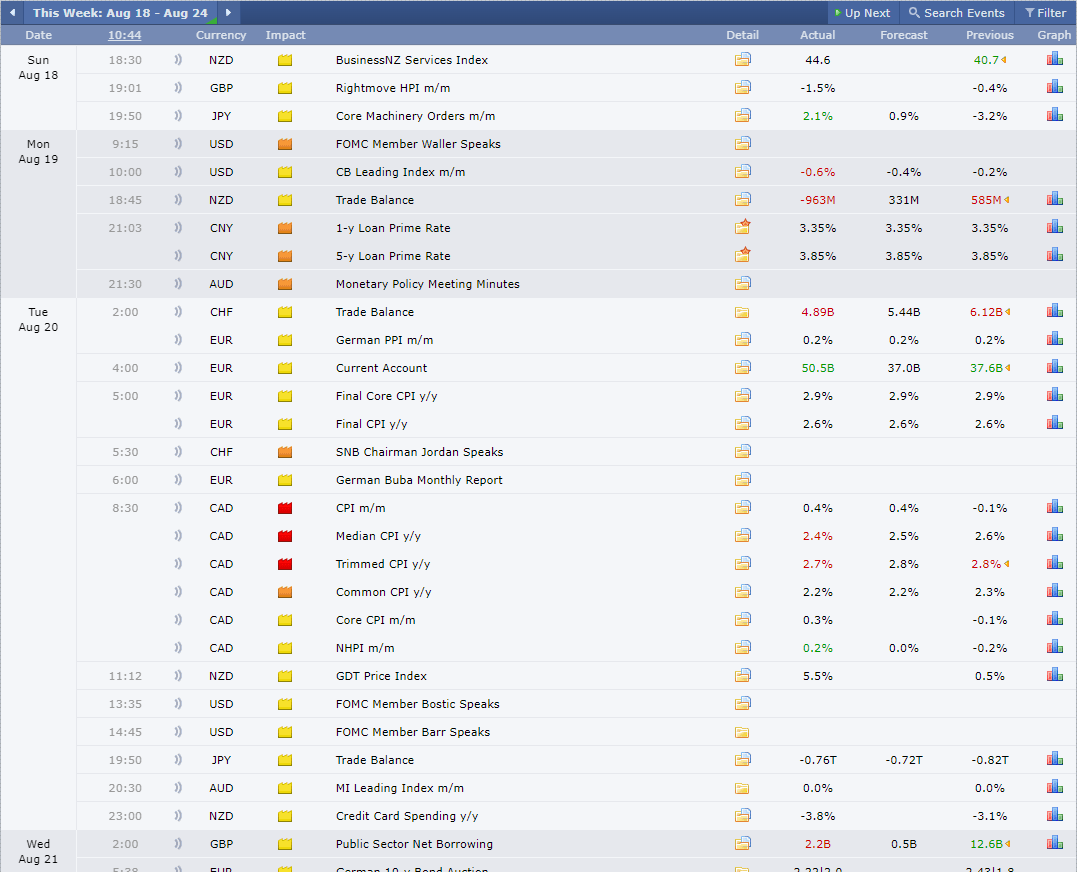
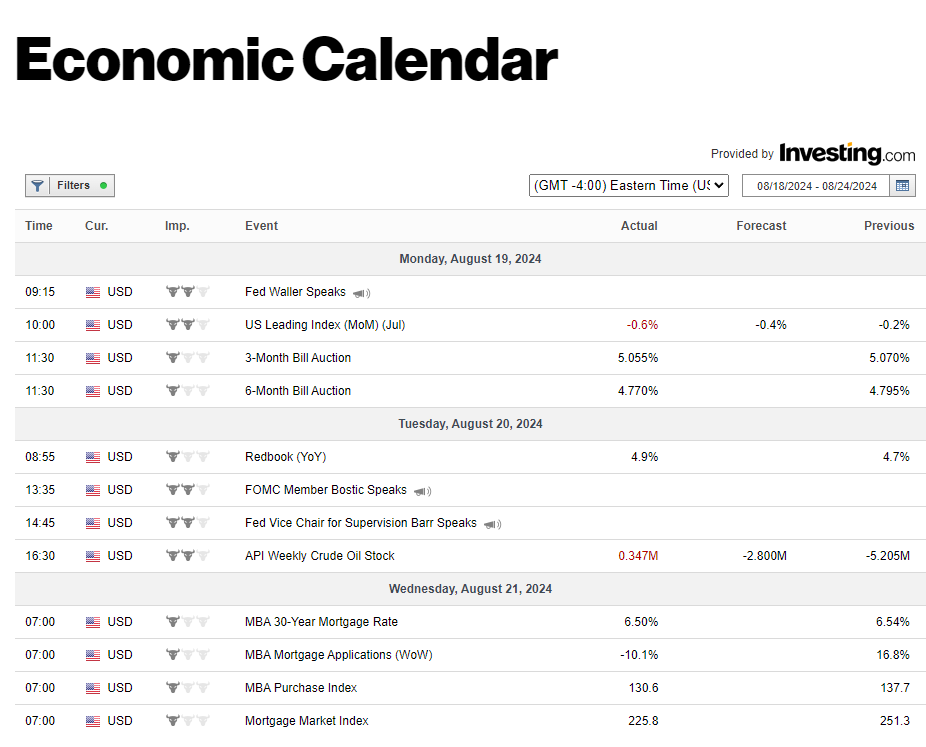
Forex Factory and Bloomberg economic calendars are the best out there. If you’re just trading forex, Forex Factory is all you need. If you also trade stocks, Bloomberg’s calendar is best because it highlights important events for the US stock market.
TradingView also offers a calendar, but even though I use multiple calendars, Forex Factory is still my favorite because of its simplicity and the amount of information it provides.
Why Economic Events Matter?
Economic events can cause market volatility, presenting both opportunities and risks for traders. By understanding and anticipating these events, you can make better-informed trading decisions.
The key idea is not just to study economic events but to understand how they affect the market and the assets we trade. For example, if the market expects an interest rate cut but the monetary policy statement announces a rate increase instead, the market will react strongly. In the case of EURUSD, it might fall sharply because everyone expected it to go up.
You need to understand how certain economic data might affect the asset and the market. If the data comes out as expected, there’s no need to worry since the market has already priced it in. However, if there’s a surprise, it can either make you lose or gain a lot of money. Being aware of this is crucial.
Our article series includes a section on the economic events for the day. We discuss how these events might affect the market based on expected outcomes and what could happen if the results are different from what was expected.
Importance of Staying Informed About the World
Staying informed about global events is crucial for traders and investors. The interconnected nature of today’s world means that political developments, economic changes, and significant events in one part of the globe can have far-reaching effects on markets everywhere.
For instance, geopolitical tensions, natural disasters, or policy changes by major economies can create market volatility and impact asset prices. By keeping up with global news, you can better understand these influences and make more informed trading decisions.
Our market analysis articles highlight key global events and their potential impacts, helping you stay prepared and adapt your strategies accordingly. Being aware of the broader world ensures you are not caught off guard by sudden market shifts and can take advantage of opportunities that arise from global trends.
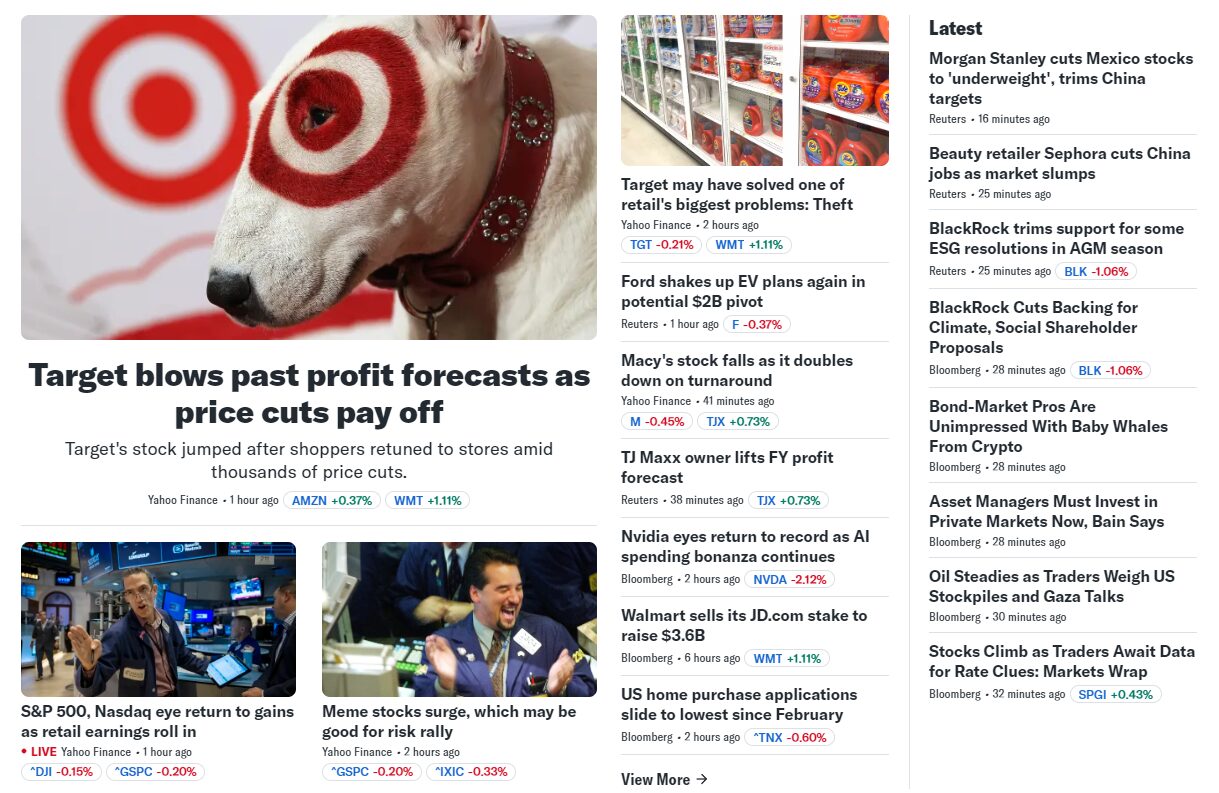
I personally like to use Yahoo Finance as my main news provider. It brings together a lot of media sources and information all in one place, covering almost everything you need to know.
What is Top Down Approach?
This explanation is for those who follow our U.S. stock market analysis series. However, the top-down approach can also be effectively applied to forex and crypto analysis. I’ll explain how this works at the end of this section.
The top-down approach in market analysis is a method that begins by examining the broader economic environment before narrowing down to specific sectors and individual assets. This approach ensures that your investment decisions are aligned with overarching economic trends, providing a more informed and strategic perspective. Here’s a detailed breakdown:
Macro Analysis
Economic Indicators: Start by assessing key economic indicators such as GDP growth, inflation rates, and employment figures. These indicators provide insight into the overall health and direction of the economy. For instance, strong GDP growth might signal a bullish market environment, while rising inflation could indicate potential challenges ahead.
Global Events: Consider the impact of global events such as geopolitical tensions, trade policies, and international economic conditions. These factors can significantly influence market sentiment and economic stability. For example, trade wars or sanctions can affect entire industries or economies, creating opportunities or risks in the market.
Sector Analysis
Performance Evaluation: Once you have a grasp of the macroeconomic landscape, the next step is to evaluate the performance of different sectors. Identify which sectors are thriving and which are struggling based on the current economic conditions. For instance, in a low-interest-rate environment, sectors like technology and real estate might perform well, while others, such as utilities, may face challenges.
Trends: Look for sectors that are poised to benefit from broader macroeconomic trends. For example, technological advancements might drive growth in the tech sector, while a push for renewable energy could boost the energy sector. Understanding these trends allows you to focus on sectors with the highest potential for growth.
Stock Analysis
Fundamental Analysis: After identifying promising sectors, drill down to the individual stock level. This involves analyzing financial statements, earnings reports, financial ratios and the quality of company management. Assessing these factors helps you determine the intrinsic value of a company and its potential for long-term growth.
Technical Analysis: Complement your fundamental analysis with technical analysis. Study stock charts, price patterns, and technical indicators like moving averages and relative strength index (RSI) to identify optimal entry and exit points. This helps you time your trades more effectively and manage risk.
Applying the Top-Down Approach to Forex and Crypto Analysis
The top-down approach isn’t limited to stock market analysis; it can also be applied to forex and crypto markets:
Forex: Start by analyzing global economic conditions and major economic indicators like interest rates, inflation, and trade balances. Next, assess the strength of specific currencies based on these macroeconomic factors. Finally, drill down to the technical analysis of currency pairs to identify trading opportunities.
Crypto: Begin with a broad understanding of the global economic environment and regulatory landscape, as these can heavily influence crypto markets. Then, analyze sectors within the crypto space, such as DeFi (Decentralized Finance) or NFTs (Non-Fungible Tokens), to identify emerging trends. Finally, focus on individual cryptocurrencies, using both fundamental factors (such as adoption rates and technological development) and technical analysis to make informed decisions.
Using the top-down approach helps you understand the broader economic context before making specific investment decisions, whether you’re dealing with stocks, forex, or cryptocurrencies. This method ensures a comprehensive and well-rounded strategy, enhancing your ability to navigate different markets effectively.
What is Price Action Trading?
Price action trading is a strategy that focuses on analyzing and making decisions based purely on the price movements of an asset, without relying on technical indicators like moving averages or oscillators. The idea is to interpret market behavior by observing how price reacts at certain levels, forming patterns and trends that indicate potential future movements.
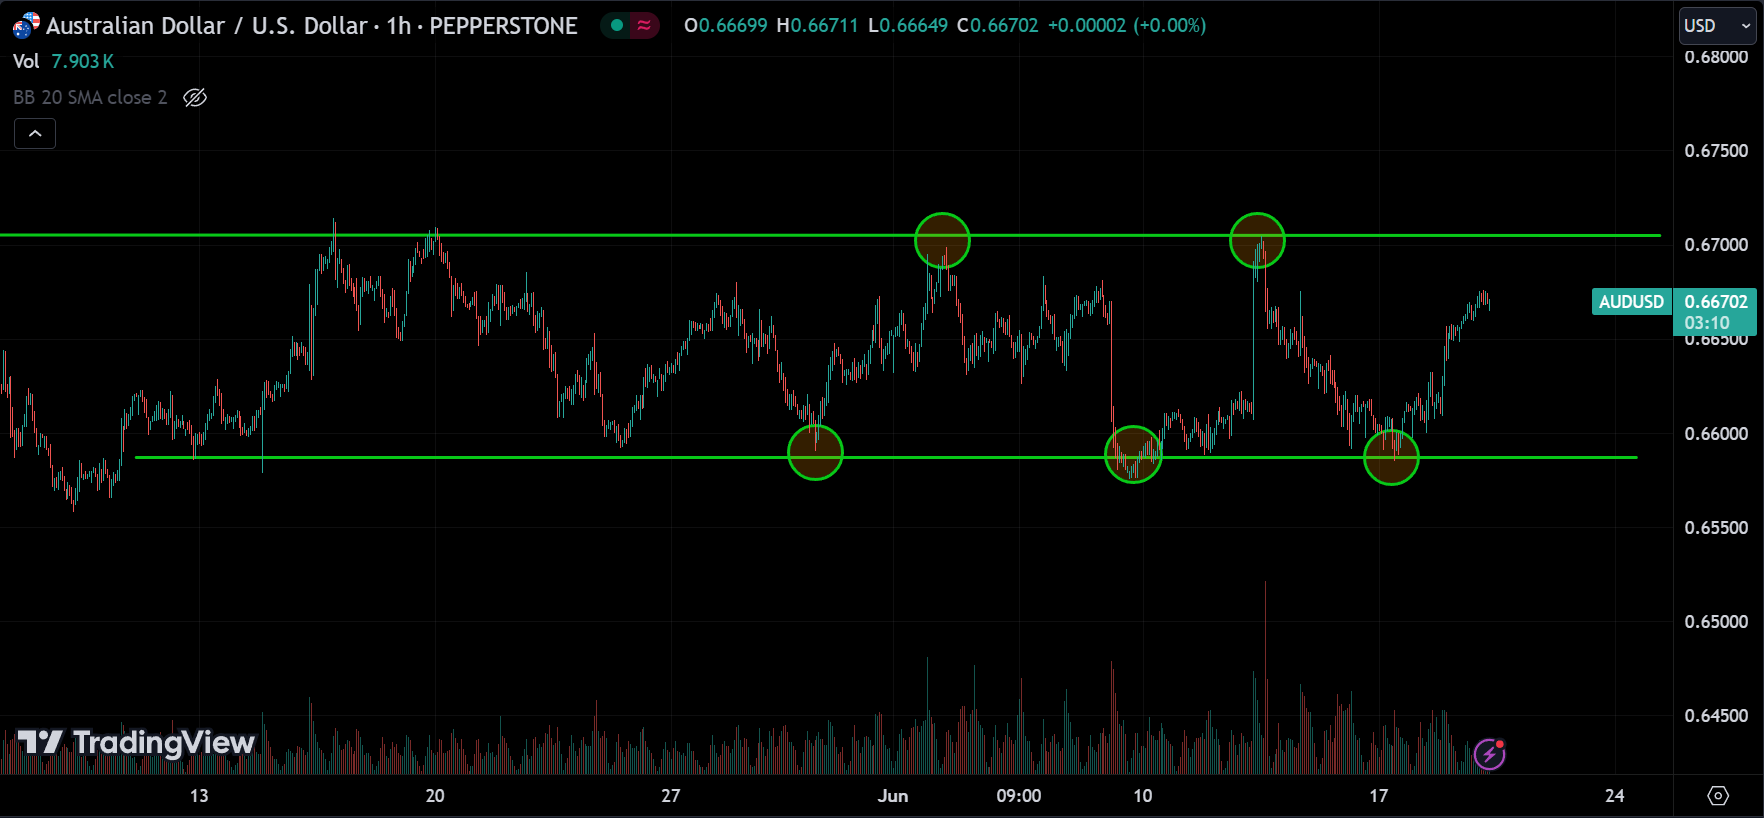
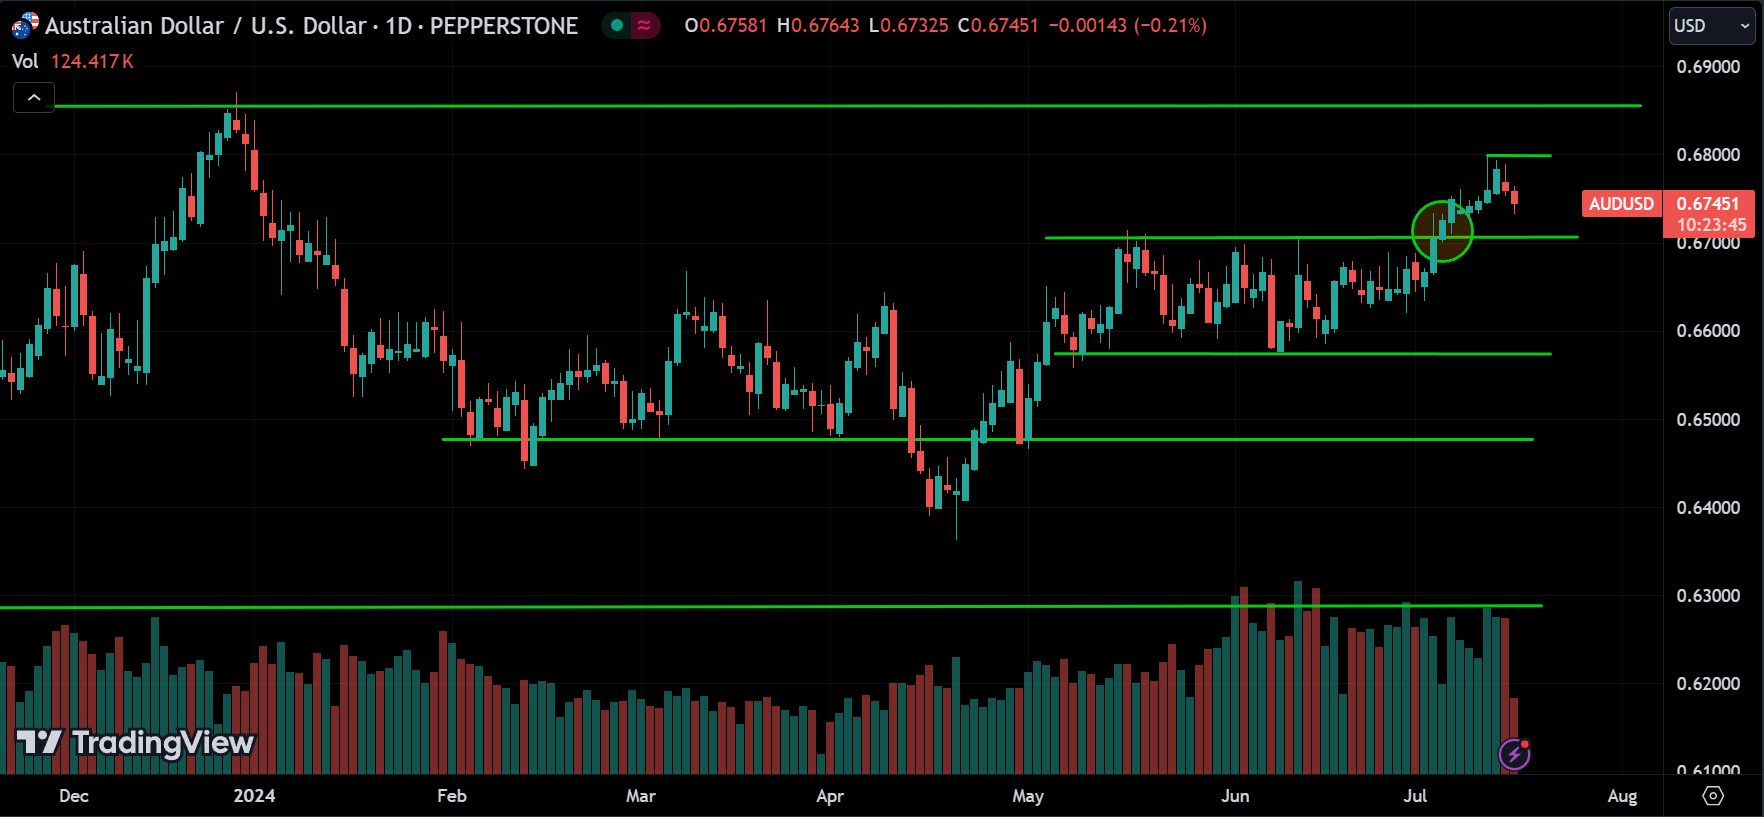
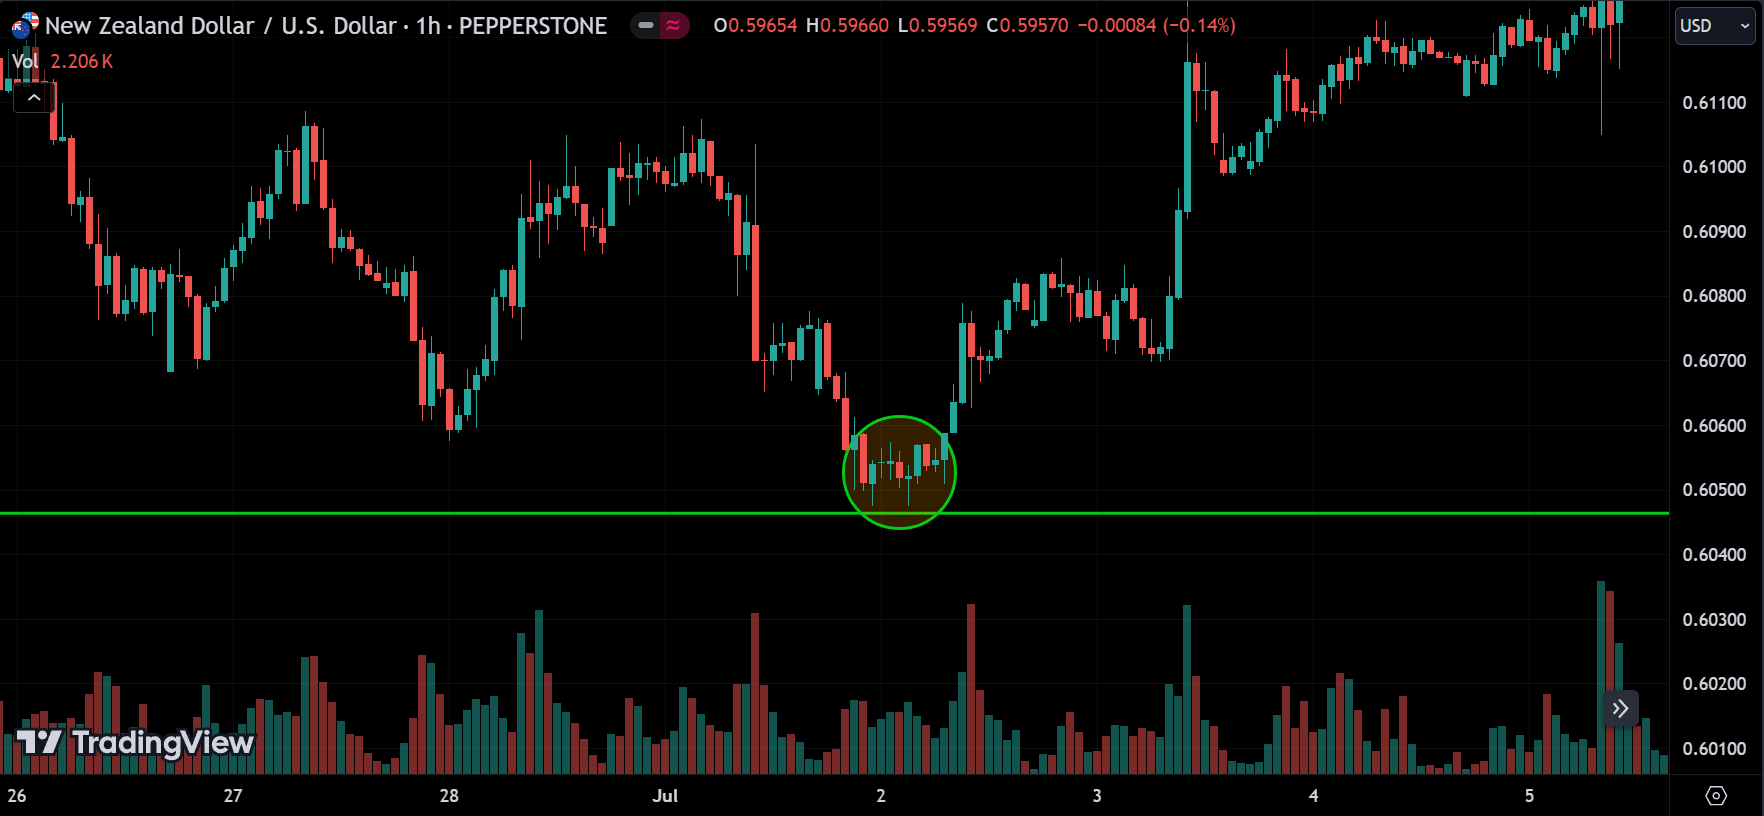
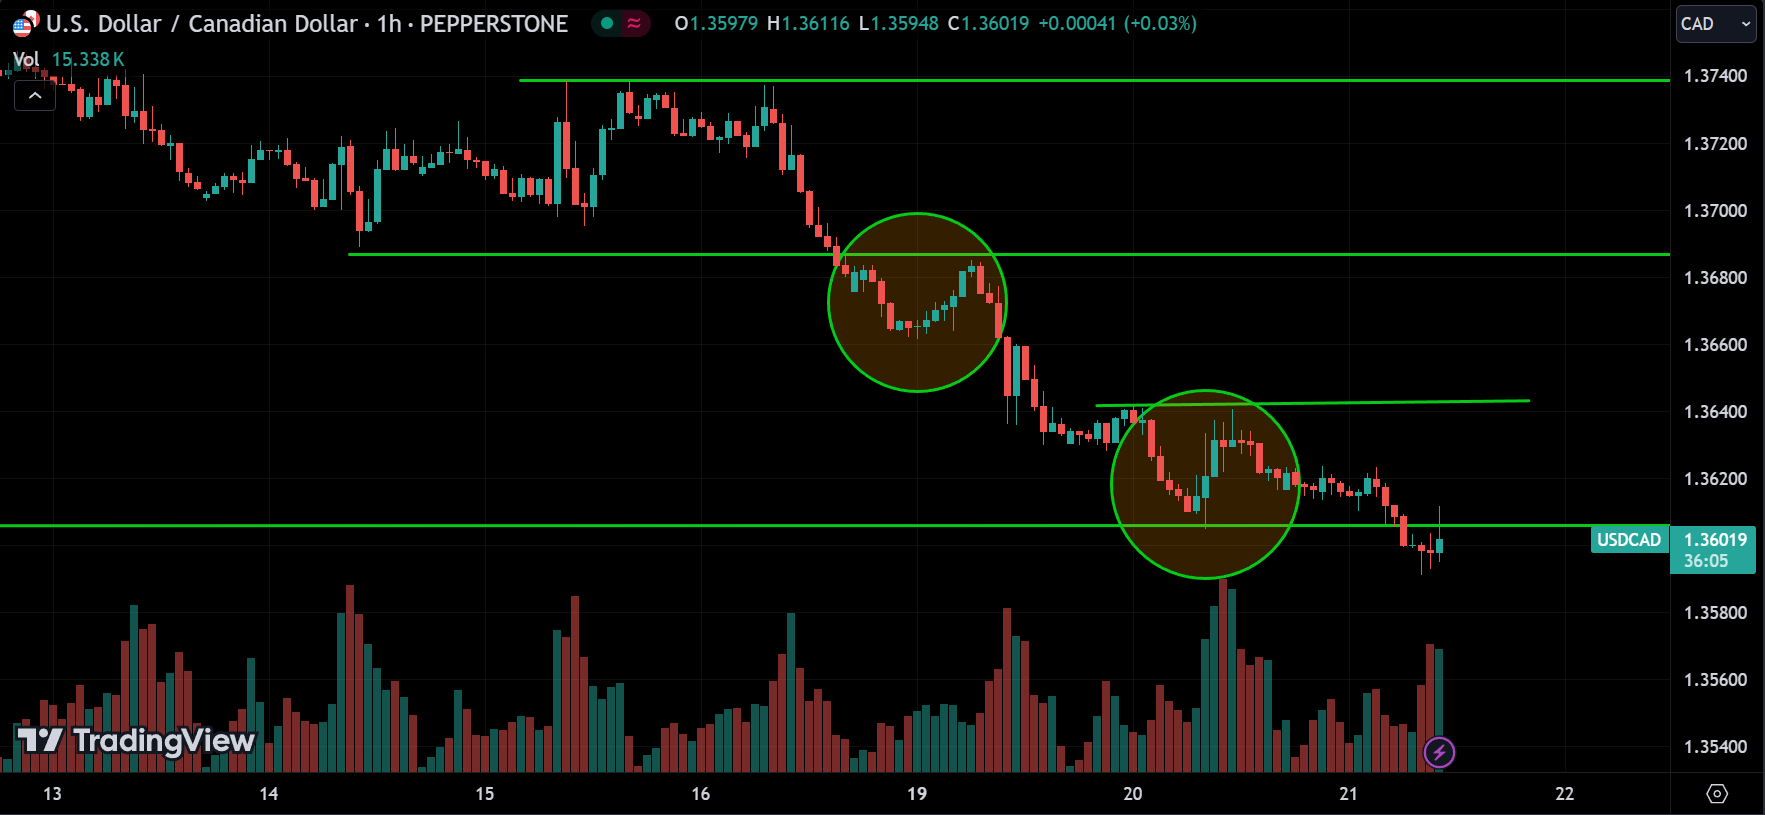
Support and Resistance Levels
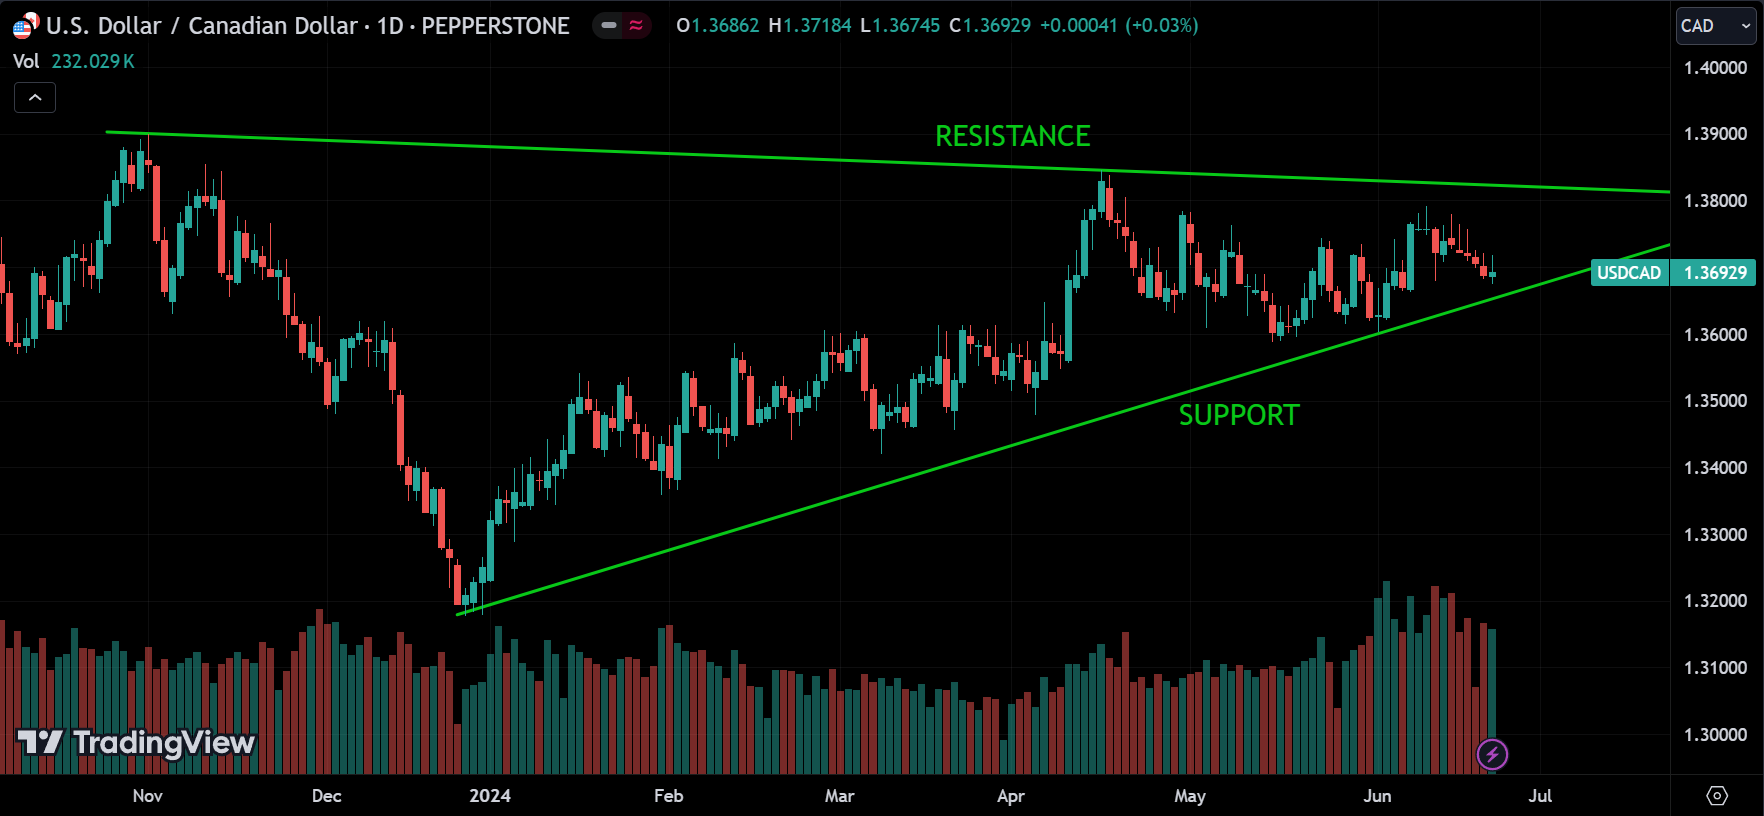
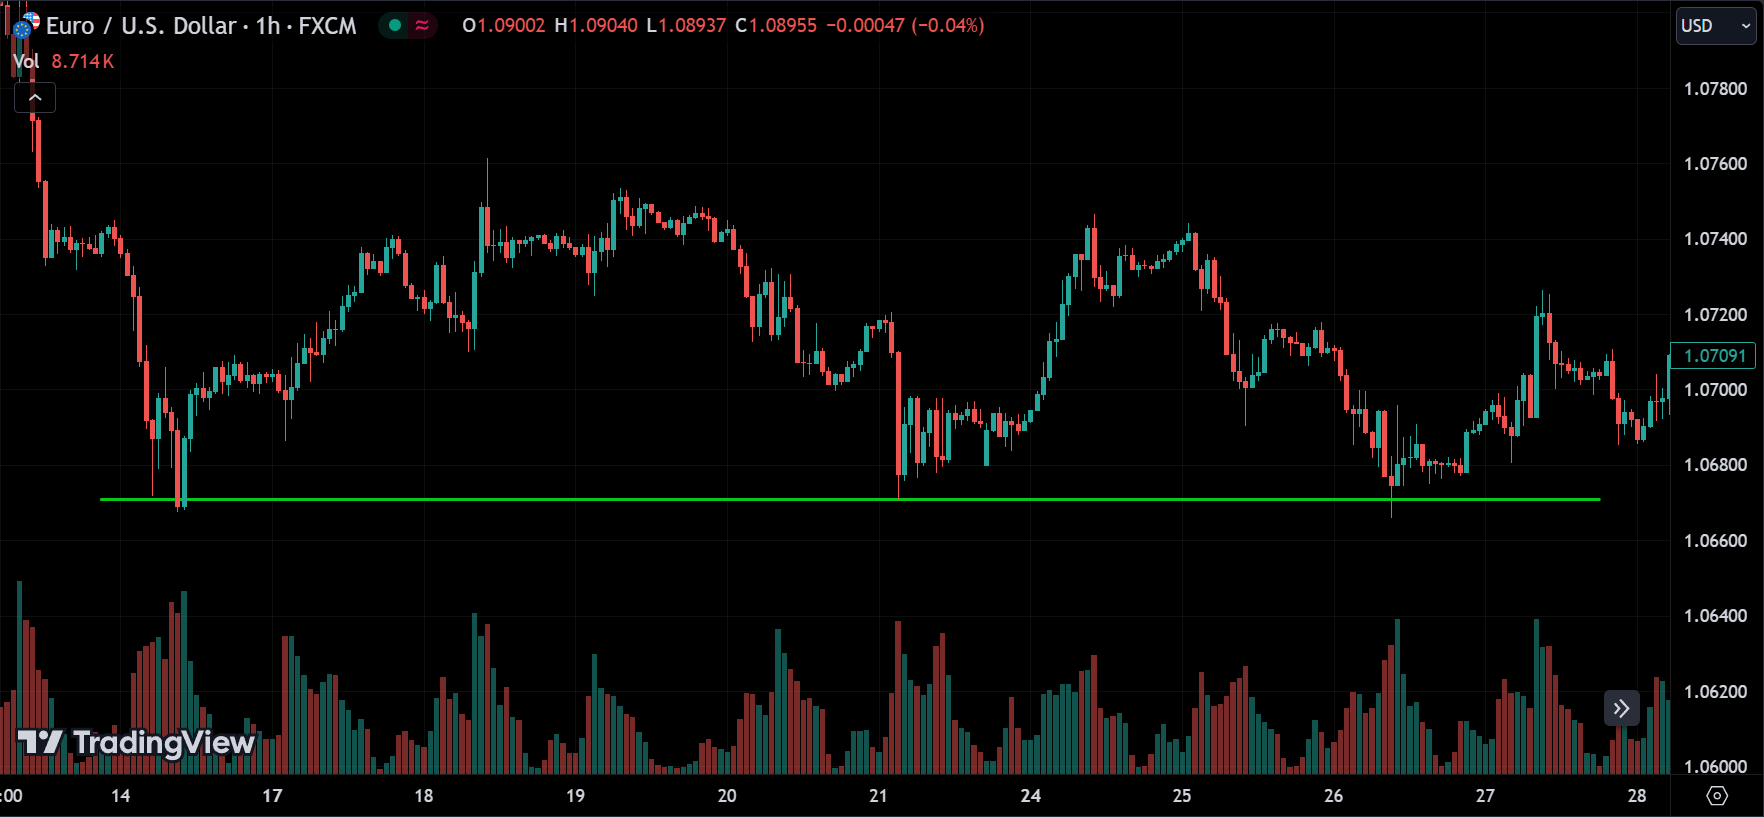
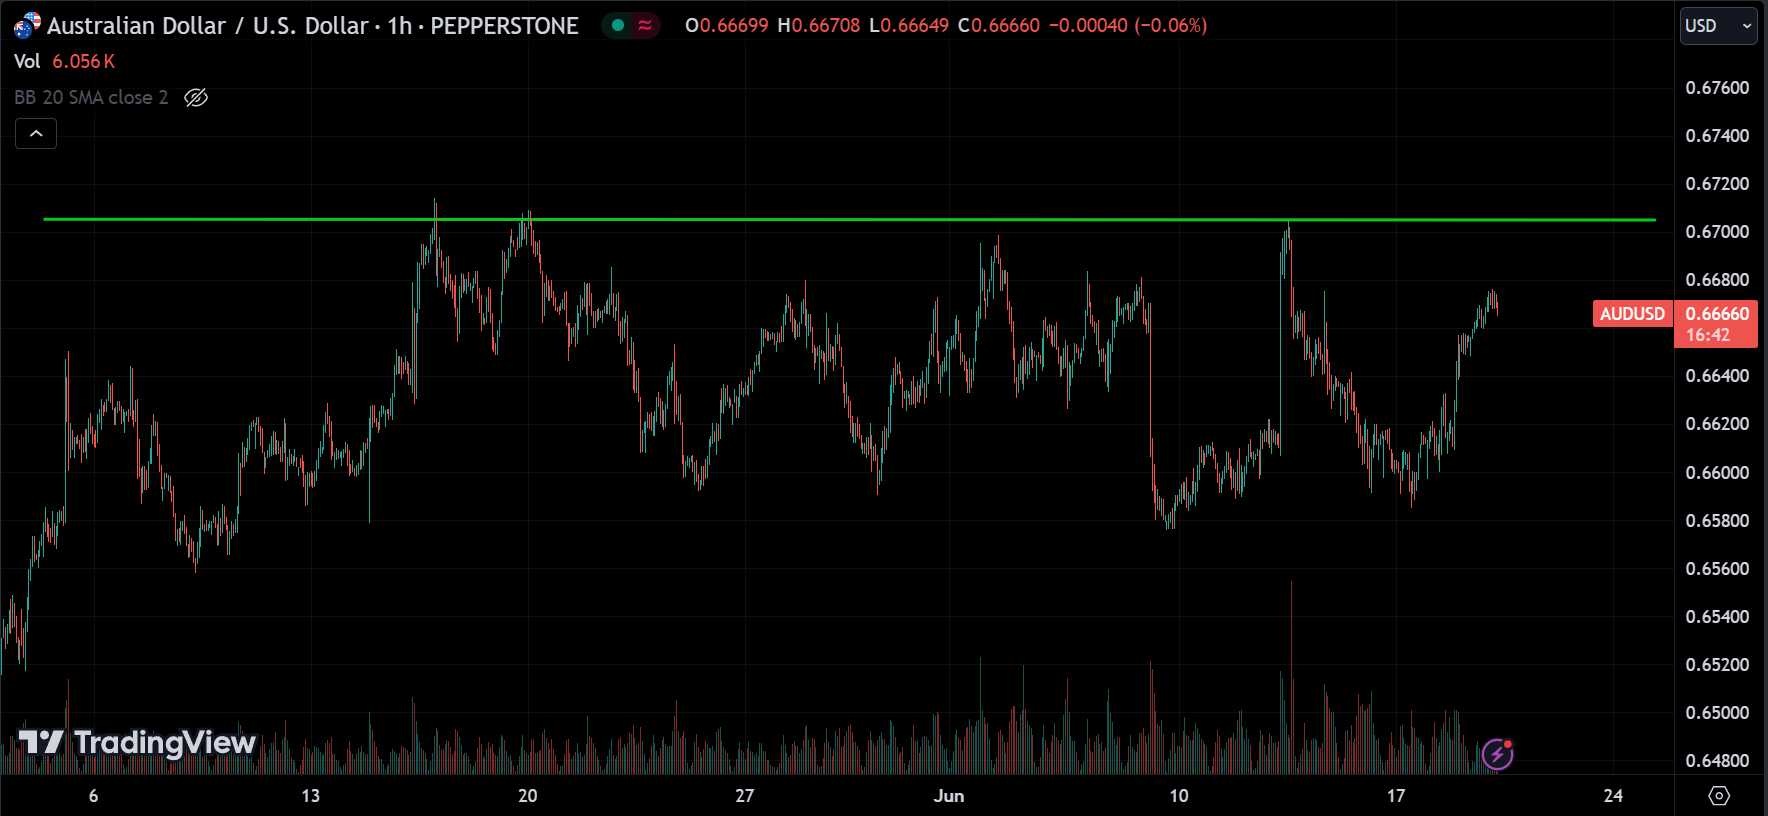
Identification: Support and resistance levels are key price levels where the asset’s price tends to stop and reverse direction. Support is a level where the price tends to find a floor, preventing it from falling further. Resistance, on the other hand, acts as a ceiling that the price struggles to break through. Identifying these levels is crucial for understanding where price reversals might occur.
Trading Strategy: Traders often use these levels to set entry and exit points. For example, a trader might buy near a support level, anticipating a bounce back up, or sell near a resistance level, expecting the price to drop. These levels also help in placing stop-loss orders just below support or above resistance to minimize risk.
Candlestick Patterns
Common Patterns: Candlestick patterns are specific formations created by the movement of prices within a given time period. Some well-known patterns include:
Doji: Indicates indecision in the market, where the opening and closing prices are nearly the same.
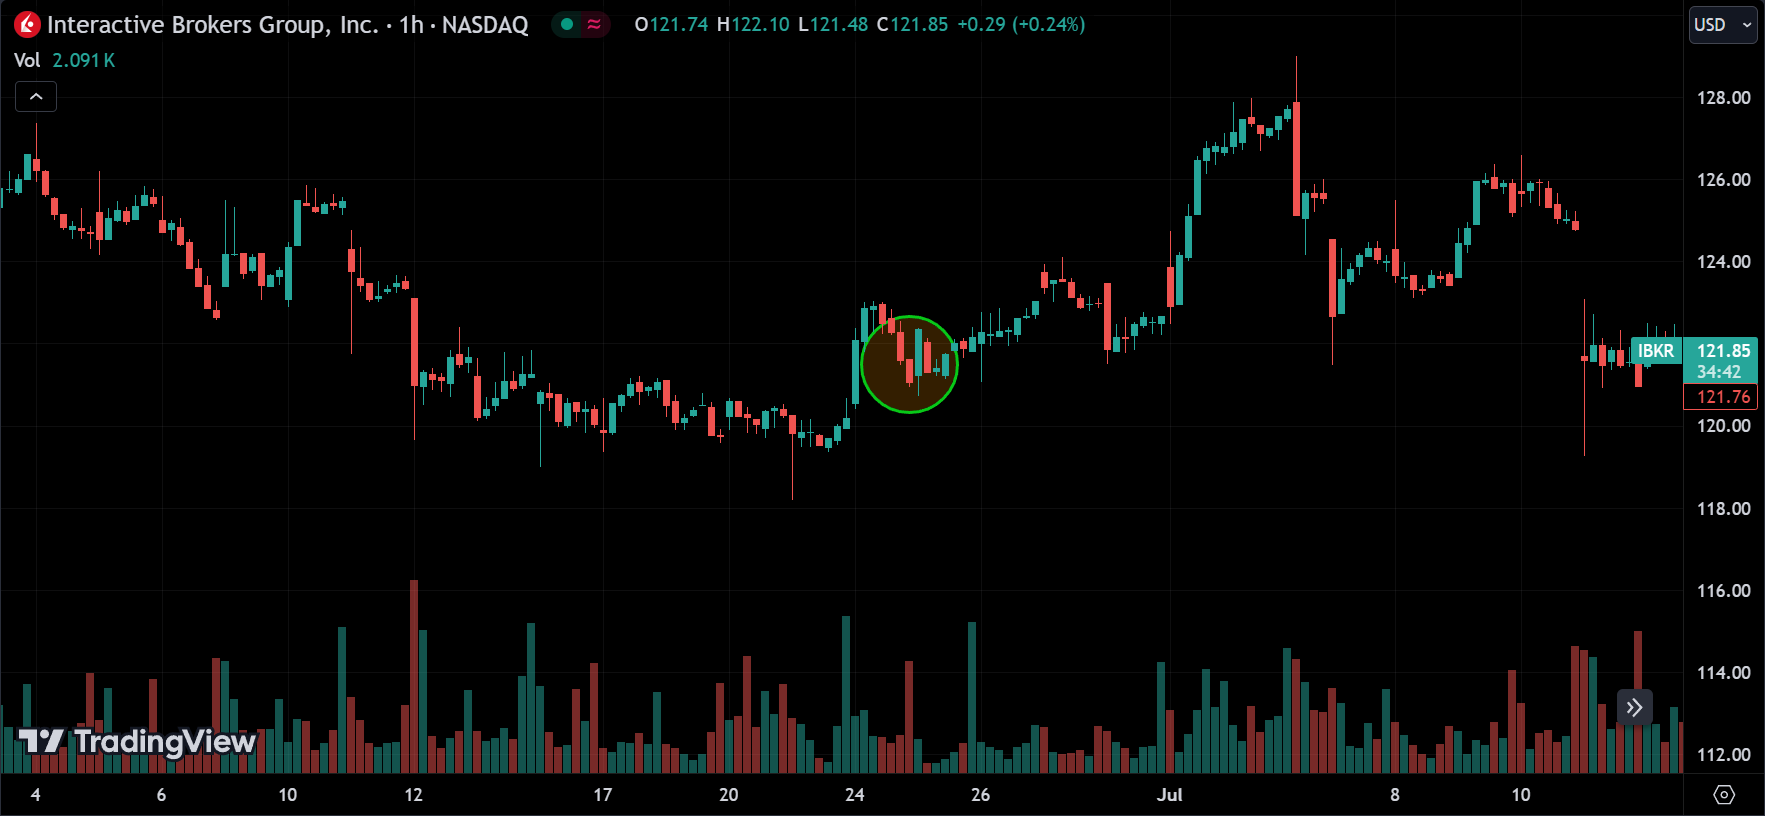
Engulfing Patterns: A strong reversal signal where a smaller candlestick is followed by a larger one that engulfs it, signaling a potential change in trend.
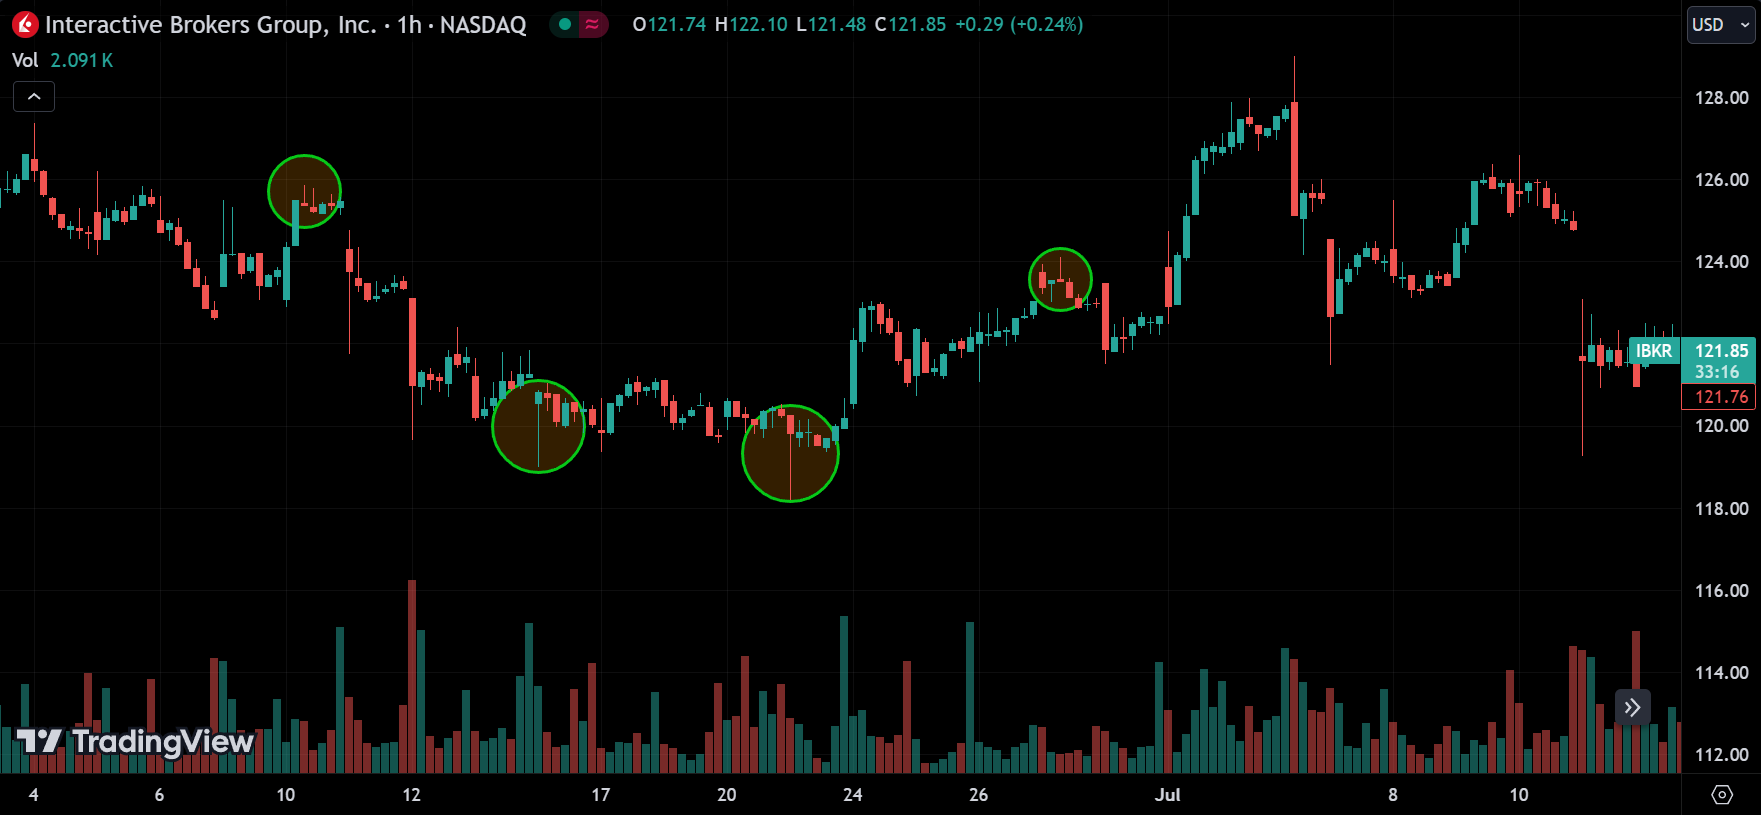
Pin Bars: Also known as a “hammer” or “shooting star” depending on its position, this pattern shows a sharp reversal after a strong price move.
Market Behavior: By recognizing these patterns, traders can predict potential market movements. For instance, an engulfing pattern at a support level might indicate a bullish reversal, while a doji at resistance could suggest a lack of momentum to continue the trend.
Trend Analysis
Trend Types: Understanding the overall market trend is crucial in price action trading. Trends are generally classified into three types:
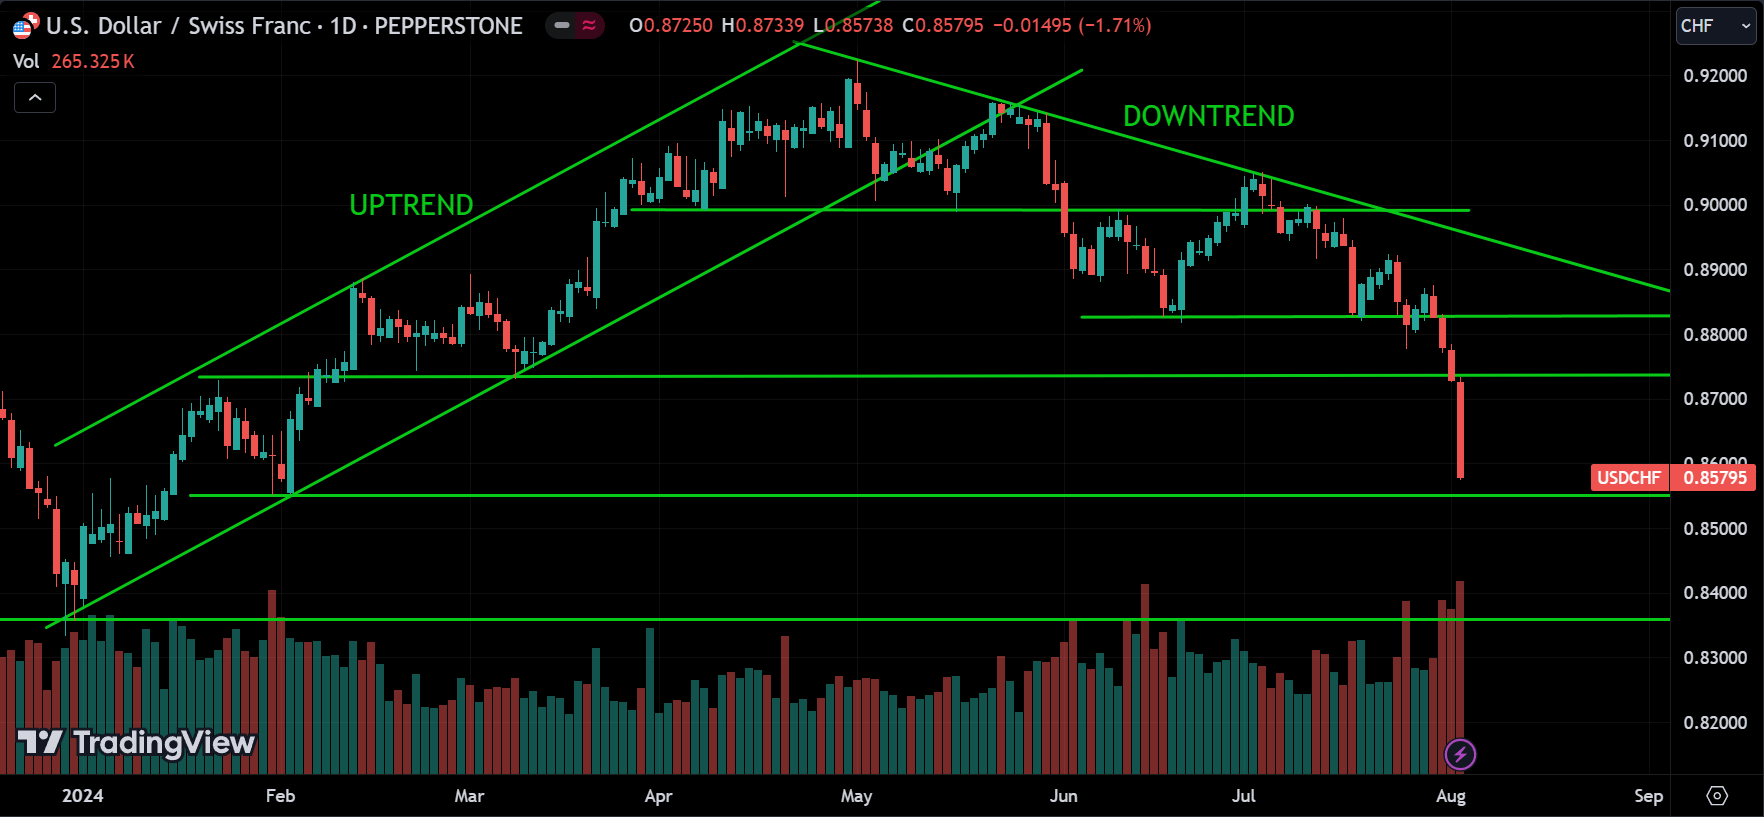
Uptrend: Characterized by higher highs and higher lows, indicating a rising market.
Downtrend: Defined by lower lows and lower highs, signaling a falling market.
Sideways Trend (Range-bound): The market moves horizontally, bouncing between a set support and resistance level without a clear direction.
Alignment: Aligning your trades with the prevailing trend increases the probability of success. For instance, in an uptrend, traders look for buying opportunities, whereas in a downtrend, they look for selling opportunities. Going against the trend can be risky and is generally less advisable unless a clear reversal signal is present.
Breakouts
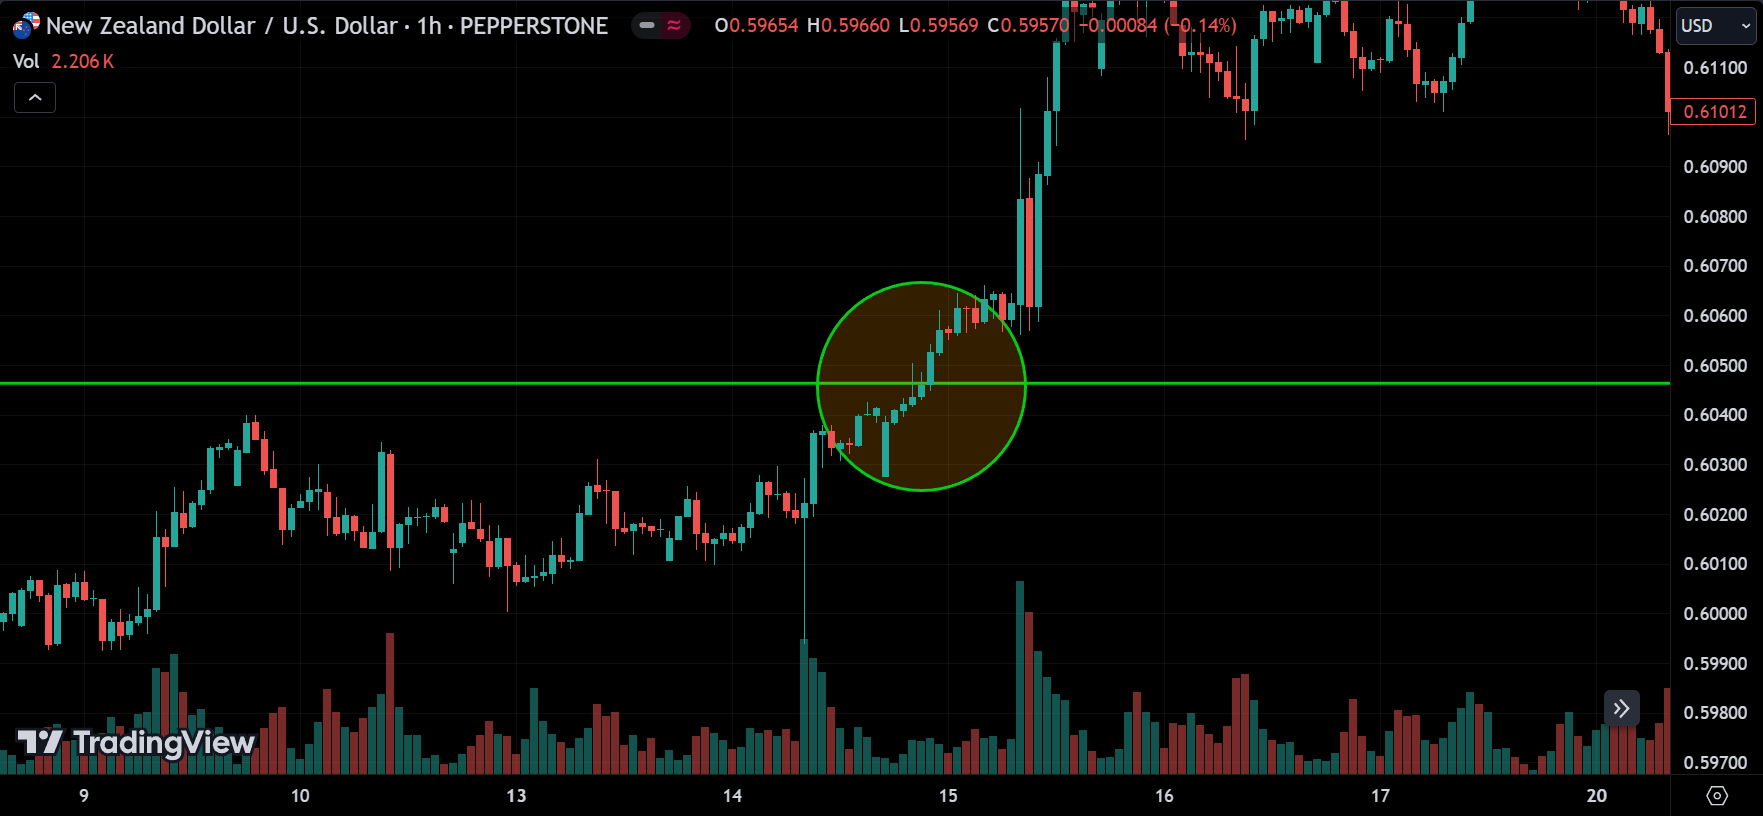
Identification: A breakout occurs when the price moves above resistance or below support, indicating a potential start of a new trend. Breakouts can provide significant trading opportunities as they often lead to strong price movements.
Fake Breakouts: However, not all breakouts are genuine. Fake breakouts happen when the price temporarily moves beyond a support or resistance level but then quickly reverses back. Traders must be cautious and look for confirmation before fully committing to a trade based on a breakout. This confirmation might come in the form of higher volume, a strong close above the breakout level, or a follow-through candlestick pattern.
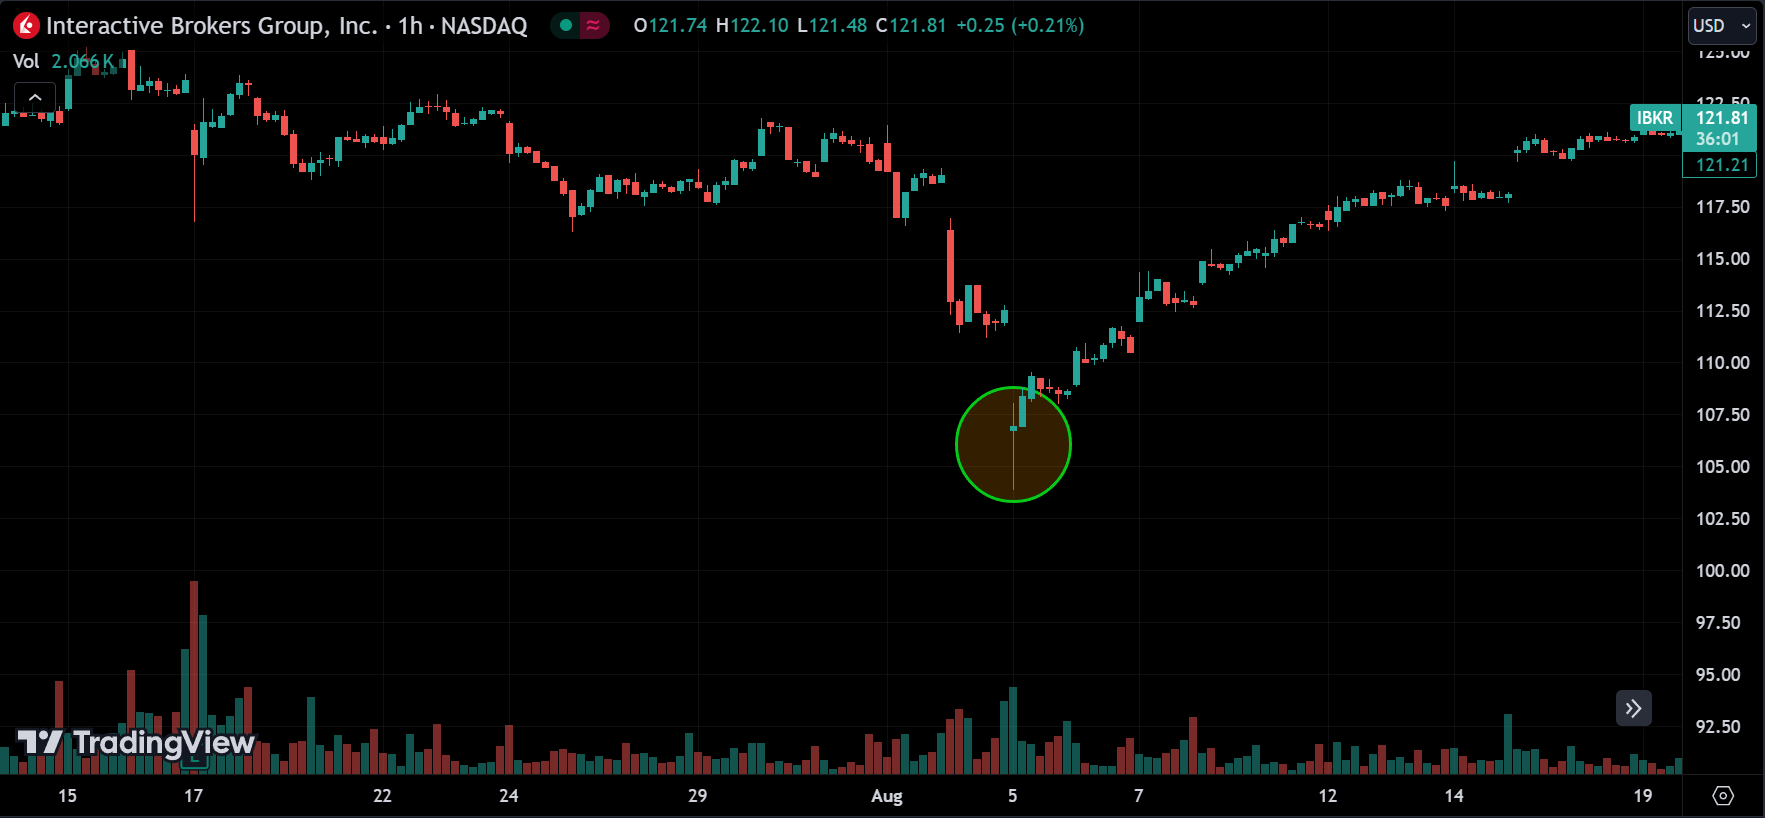
Reversals
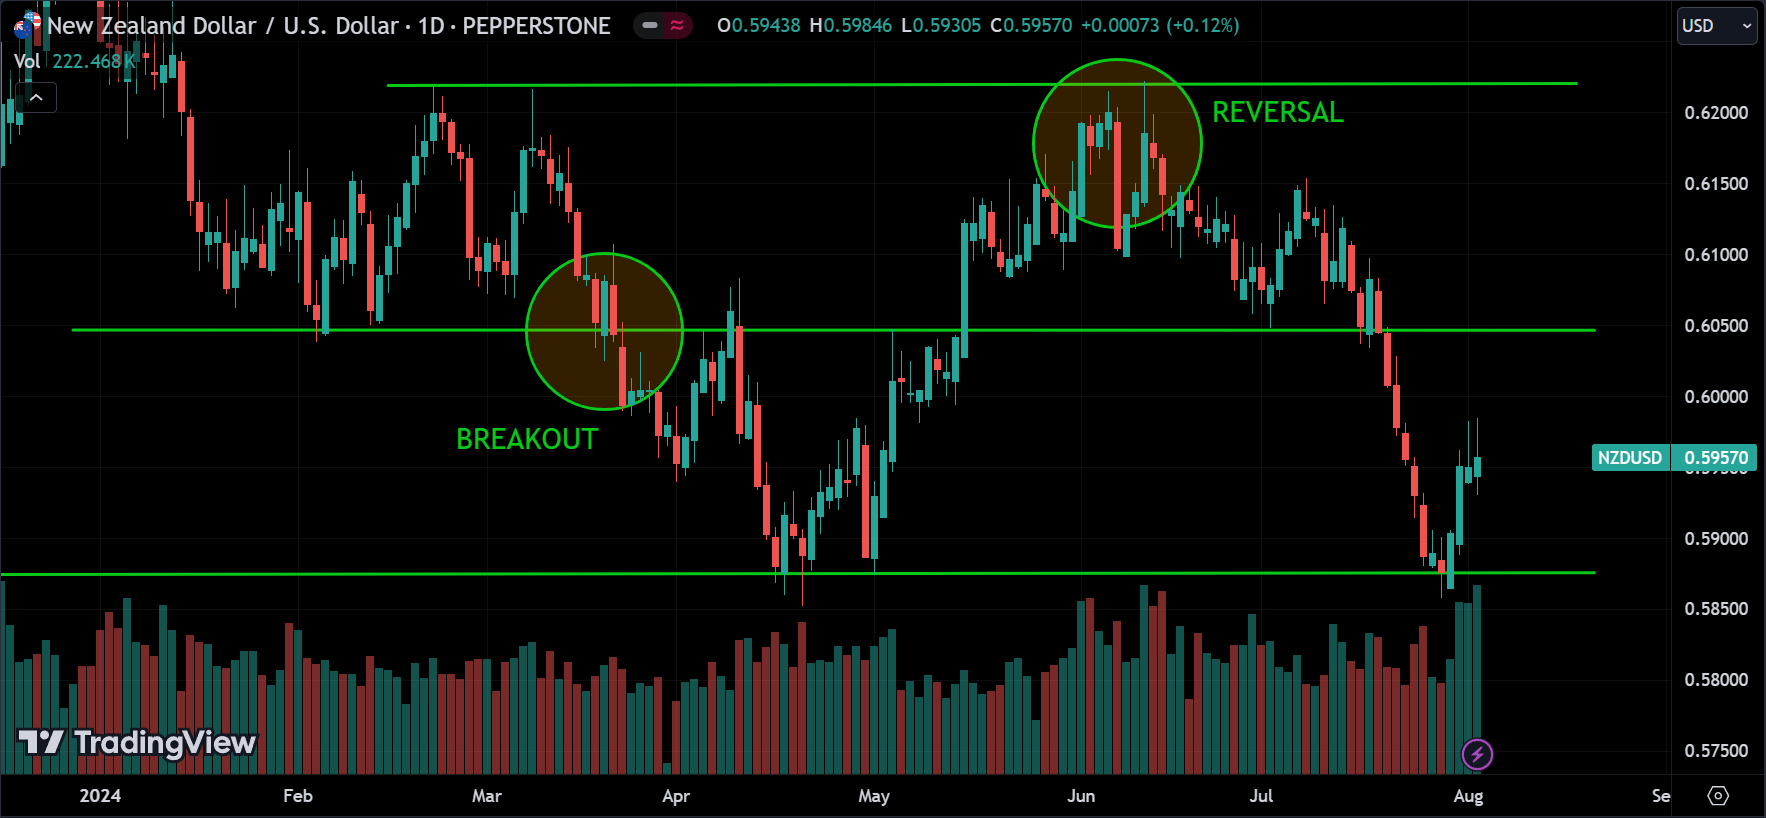
Identification: Reversals occur when the price changes direction after a sustained trend. A reversal from an uptrend to a downtrend, or vice versa, can signal the start of a new market phase. Traders often look for signs like candlestick patterns, divergence in momentum indicators, or significant breaks of trendlines to identify potential reversals.
Fake Reversals: Fake reversals, also known as whipsaws, can be tricky as the price might briefly reverse direction only to resume the original trend. This can trap traders into making premature decisions. To avoid falling into this trap, it’s important to wait for additional confirmation, such as a retest of the new trend direction or a break of a significant price level.
Corrections
Definition: A correction is a short-term pullback or decline in price during an overall trend. In an uptrend, a correction is a temporary dip, while in a downtrend, it’s a temporary rise. Corrections are a natural part of market movements and often occur when the market becomes overbought or oversold.
Trading Strategy: Corrections can offer opportunities to enter a trade in the direction of the prevailing trend at a better price. For example, in an uptrend, a trader might wait for a correction to buy at a lower price before the trend resumes. It’s important to differentiate between a correction and a reversal; the former is temporary, while the latter signals a change in the trend direction.
Managing Risk: During corrections, traders should be cautious and ensure their stop-loss levels are appropriately set. This helps avoid getting stopped out by a short-term price movement before the trend continues.
Price action trading emphasizes understanding market psychology and reacting to price changes without heavily relying on technical indicators. By focusing on price, traders gain insights into the supply and demand dynamics at play, enabling them to make informed decisions based on real-time market data.
Tips for Becoming a Better Analyst
Improving your analytical skills is crucial for better trading outcomes. Here are some tips, based on experience, to help you become a more proficient analyst:
1. Continuous Learning
Stay Updated: Regularly keep up with financial news, market reports, and relevant publications. Understanding the latest market developments helps you stay informed and make better trading decisions.
Educational Resources: Take advantage of online courses, webinars, and tutorials to deepen your knowledge. Focus on resources that enhance your understanding of market behavior and trading strategies.
2. Technical Analysis
Candlestick and Line Charts: From experience, these two chart types are all you need. Candlestick charts give you detailed insights into market sentiment and potential reversals, while line charts provide a clear view of the overall price trend. Mastering these charts allows you to interpret price action effectively without needing more complex tools.
3. Fundamental Analysis Awareness
Understand the Basics: While you don’t need to perform fundamental analysis yourself, it’s important to understand how it’s done. This includes knowing how to interpret financial statements and key economic indicators.
Be Aware of Changes: Keep an eye on changes in the market or economy that could impact fundamental analysis. Understanding these changes allows you to anticipate how they might influence traders’ decisions and market movements.
4. Practice Discipline
Trading Plan: Develop a detailed trading plan that outlines your goals, risk tolerance, and strategies. Stick to this plan to maintain consistency in your trading approach.
Emotion Management: Avoid letting emotions drive your trading decisions. Instead, rely on the data and analysis you’ve done. Keeping a cool head is essential for long-term success.
5. Review and Adapt
Trade Review: Regularly review your trades to learn from both successes and mistakes. This self-analysis is key to improving your performance over time.
Strategy Adjustment: Be prepared to adjust your strategies based on your trade reviews and changing market conditions. Flexibility and continuous improvement are vital in the ever-changing trading environment.
Conclusion
Using our market analysis articles can significantly enhance your trading and investment decisions. By understanding economic events, staying informed about market trends, employing the top-down approach, and mastering price action trading, you can become a more effective and successful analyst. Keep learning, stay disciplined, and continually adapt your strategies to stay ahead in the dynamic world of trading. With these tools and insights, you’ll be well-equipped to navigate the complexities of the market and make informed, strategic decisions that can lead to better trading outcomes.