In the world of trading, protecting your capital is arguably the single most important priority. The financial markets offer countless opportunities to grow your wealth, but every opportunity comes with risk. Whether you’re a seasoned professional trading multi-million-dollar portfolios or a part-time trader working with a few thousand dollars in your account, risk management is crucial to achieving long-term success. One of the key concepts in evaluating and managing risk is known as Maximum Drawdown.
This article will dive deeply into the concept of Maximum Drawdown (often abbreviated as MDD), explaining what it is, why it matters, and how traders and investors can use it as part of a broader risk management strategy. If you’re interested in building a robust trading strategy, understanding how your portfolio or trading system might react under stress, or simply preserving your hard-earned capital, read on. We’ll cover everything you need to know about Maximum Drawdown, from basic definitions to advanced techniques for mitigating its effects.
By the end of this article, you’ll have a clear understanding of how to measure, monitor, and manage drawdowns, helping you make better-informed decisions to protect your capital and optimize your returns.
Table of Contents
What Is Maximum Drawdown?
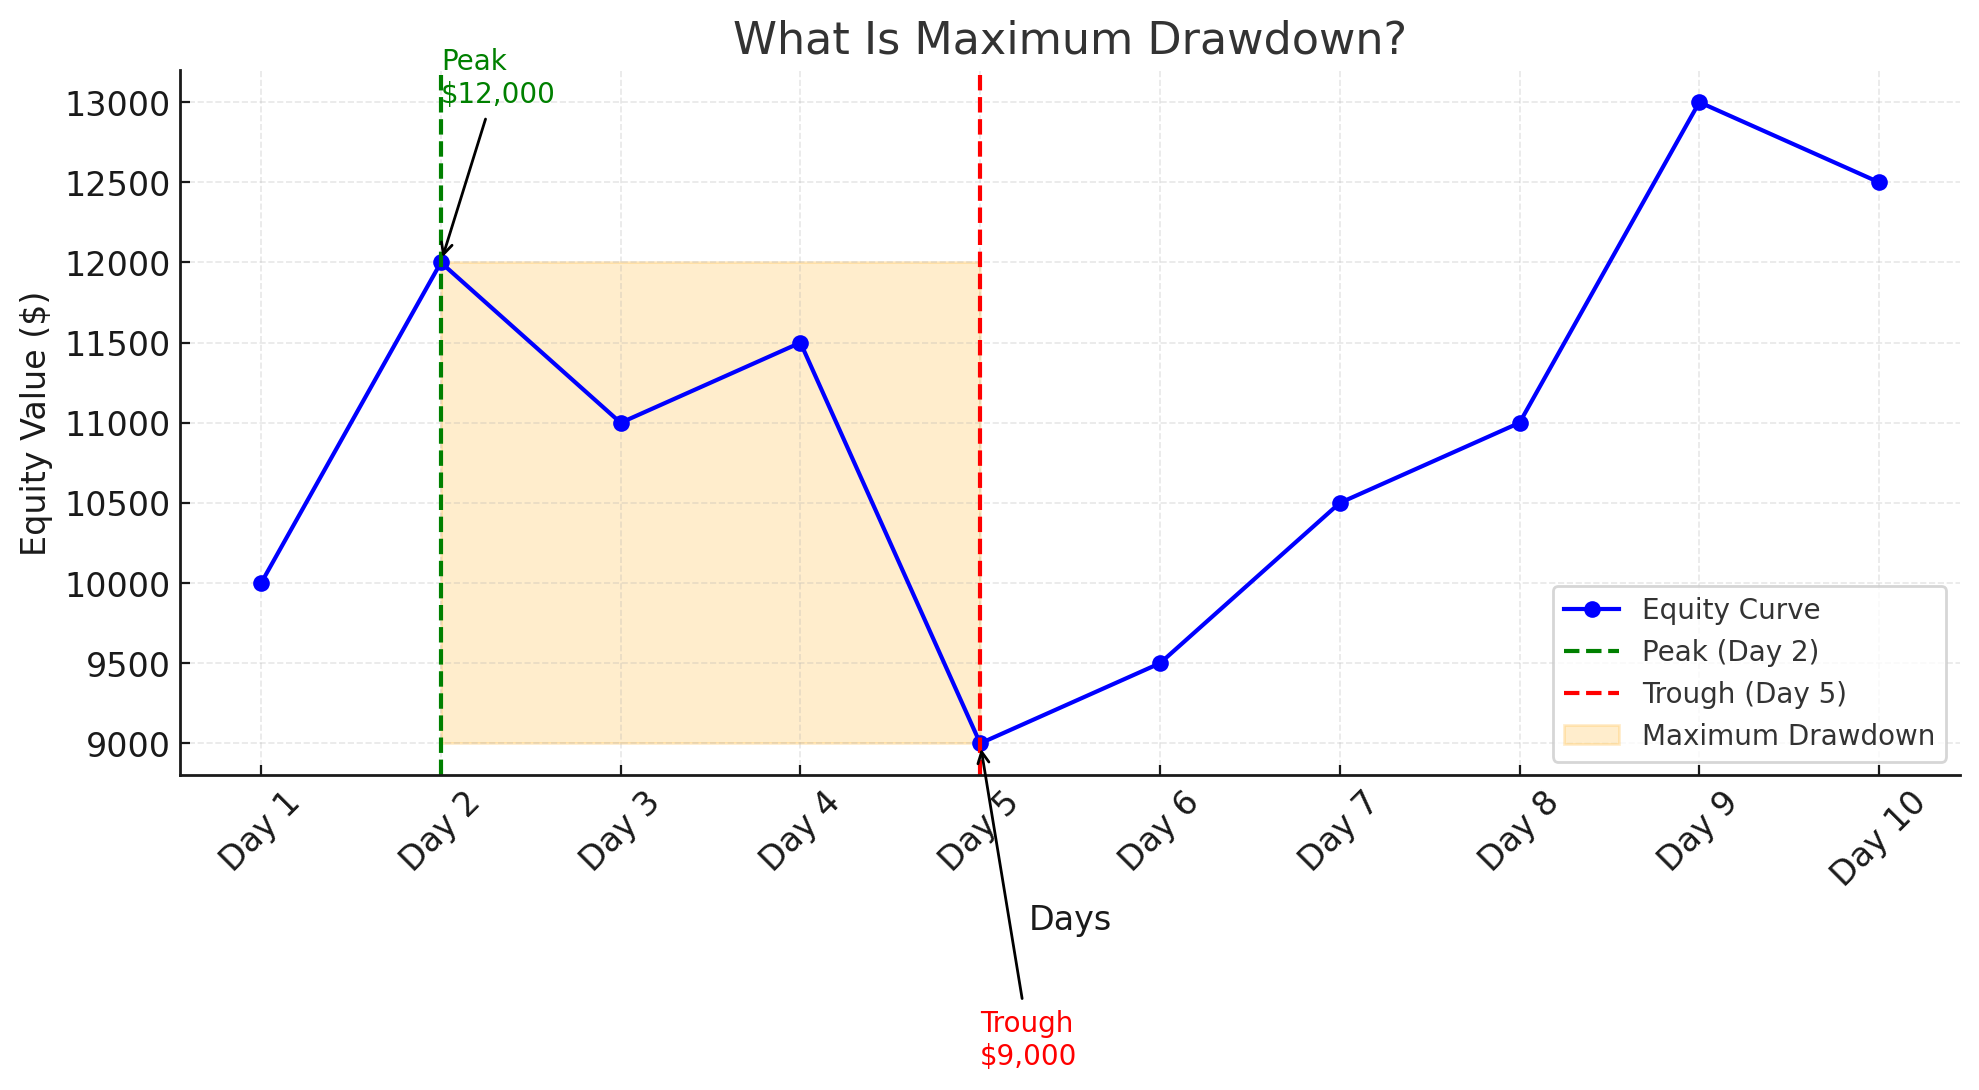
Maximum Drawdown is the largest observed loss from a peak to a trough of an investment portfolio, trading account, or other financial instrument, before a new peak is reached. In other words, it measures the worst-case percentage decline from your highest historical equity value to a subsequent lowest point during a specific time period.
Consider you begin trading with $100,000 in your account. Over the next few months, your account grows to $120,000. Soon after, the market experiences a downturn, and your account drops to $90,000. The drawdown during this period is $30,000 (from the peak of $120,000 to $90,000). Your Maximum Drawdown is the percentage loss relative to the peak, so in this case, it’s 25% ($30,000 / $120,000).
Key Points to Understand
- MDD measures downside risk: It is specifically focused on potential losses, providing a worst-case scenario for how much an investor could lose over a particular period.
- Peak-to-trough decline: It focuses on the largest decline from any historical high to a subsequent low.
- Dynamic metric: Maximum Drawdown can change as your portfolio’s value changes. A new peak or a new trough can alter the maximum drawdown.
For traders, Maximum Drawdown is an essential metric because it gives a snapshot of how volatile and risky a strategy might be. This metric helps quantify the psychological and financial stress you might endure when the market moves against you.
Why Does Maximum Drawdown Matter?
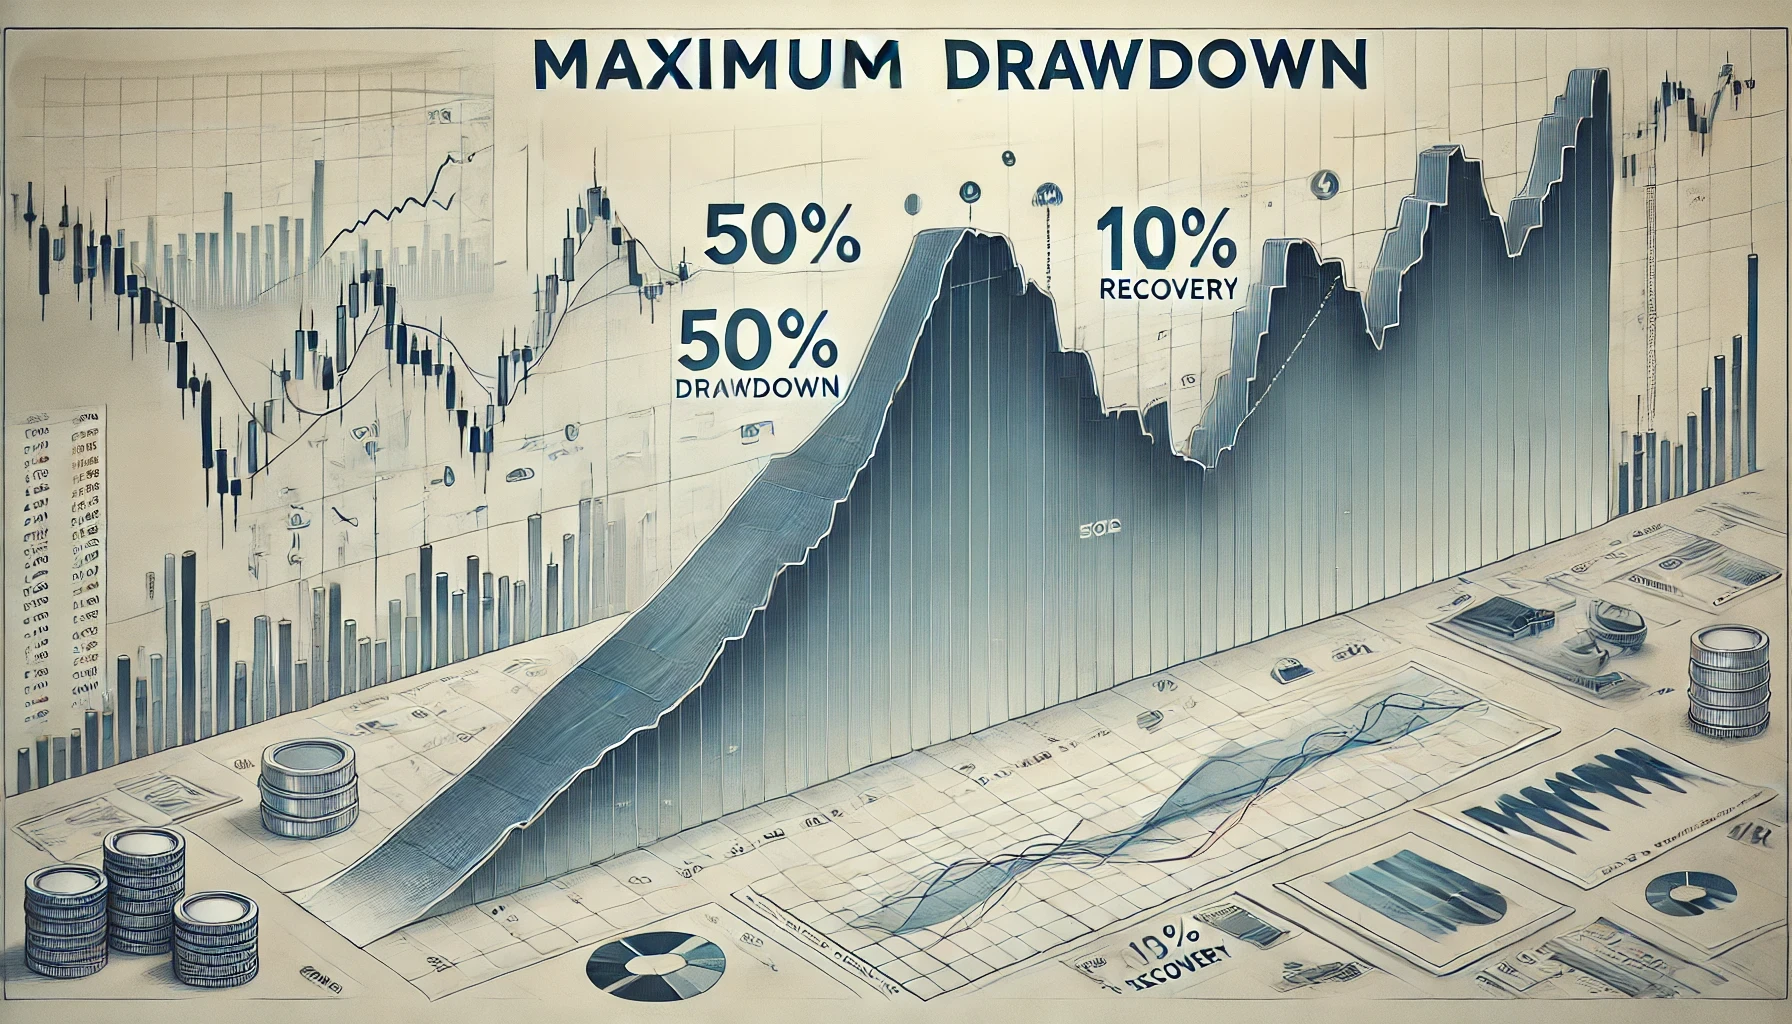
Maximum Drawdown is far more than just a number. It can deeply influence your risk management strategies, trading psychology, and even your ability to stick to a given trading plan in the face of adverse market conditions.
- Capital Preservation: Capital preservation is the foundation of successful trading. A high Maximum Drawdown implies greater risk to your capital. The bigger the drawdown, the harder it is to recover. For example, if you lose 50% of your capital, you need a 100% return just to get back to break-even.
- Psychological Impact: Large drawdowns often trigger emotional responses such as fear, anxiety, and panic. These emotions can cause traders to abandon sound strategies at the worst possible time. Understanding your potential for drawdowns beforehand can help set realistic expectations and foster greater discipline.
- Comparison of Trading Strategies: Maximum Drawdown is one of the core metrics—along with metrics like Sharpe Ratio, Sortino Ratio, and Win Rate—that traders use to compare different strategies. A strategy with a 20% annual return but a 50% drawdown can be riskier and more emotionally challenging than a strategy that yields a 10% return with only a 10% drawdown.
- Long-Term Sustainability: In trading and investing, survival is key. Strategies with high maximum drawdowns might produce spectacular short-term gains but can also wipe out your account in adverse conditions. By prioritizing low drawdowns, you maximize your chances of staying in the market long enough to benefit from long-term opportunities.
How to Calculate Maximum Drawdown
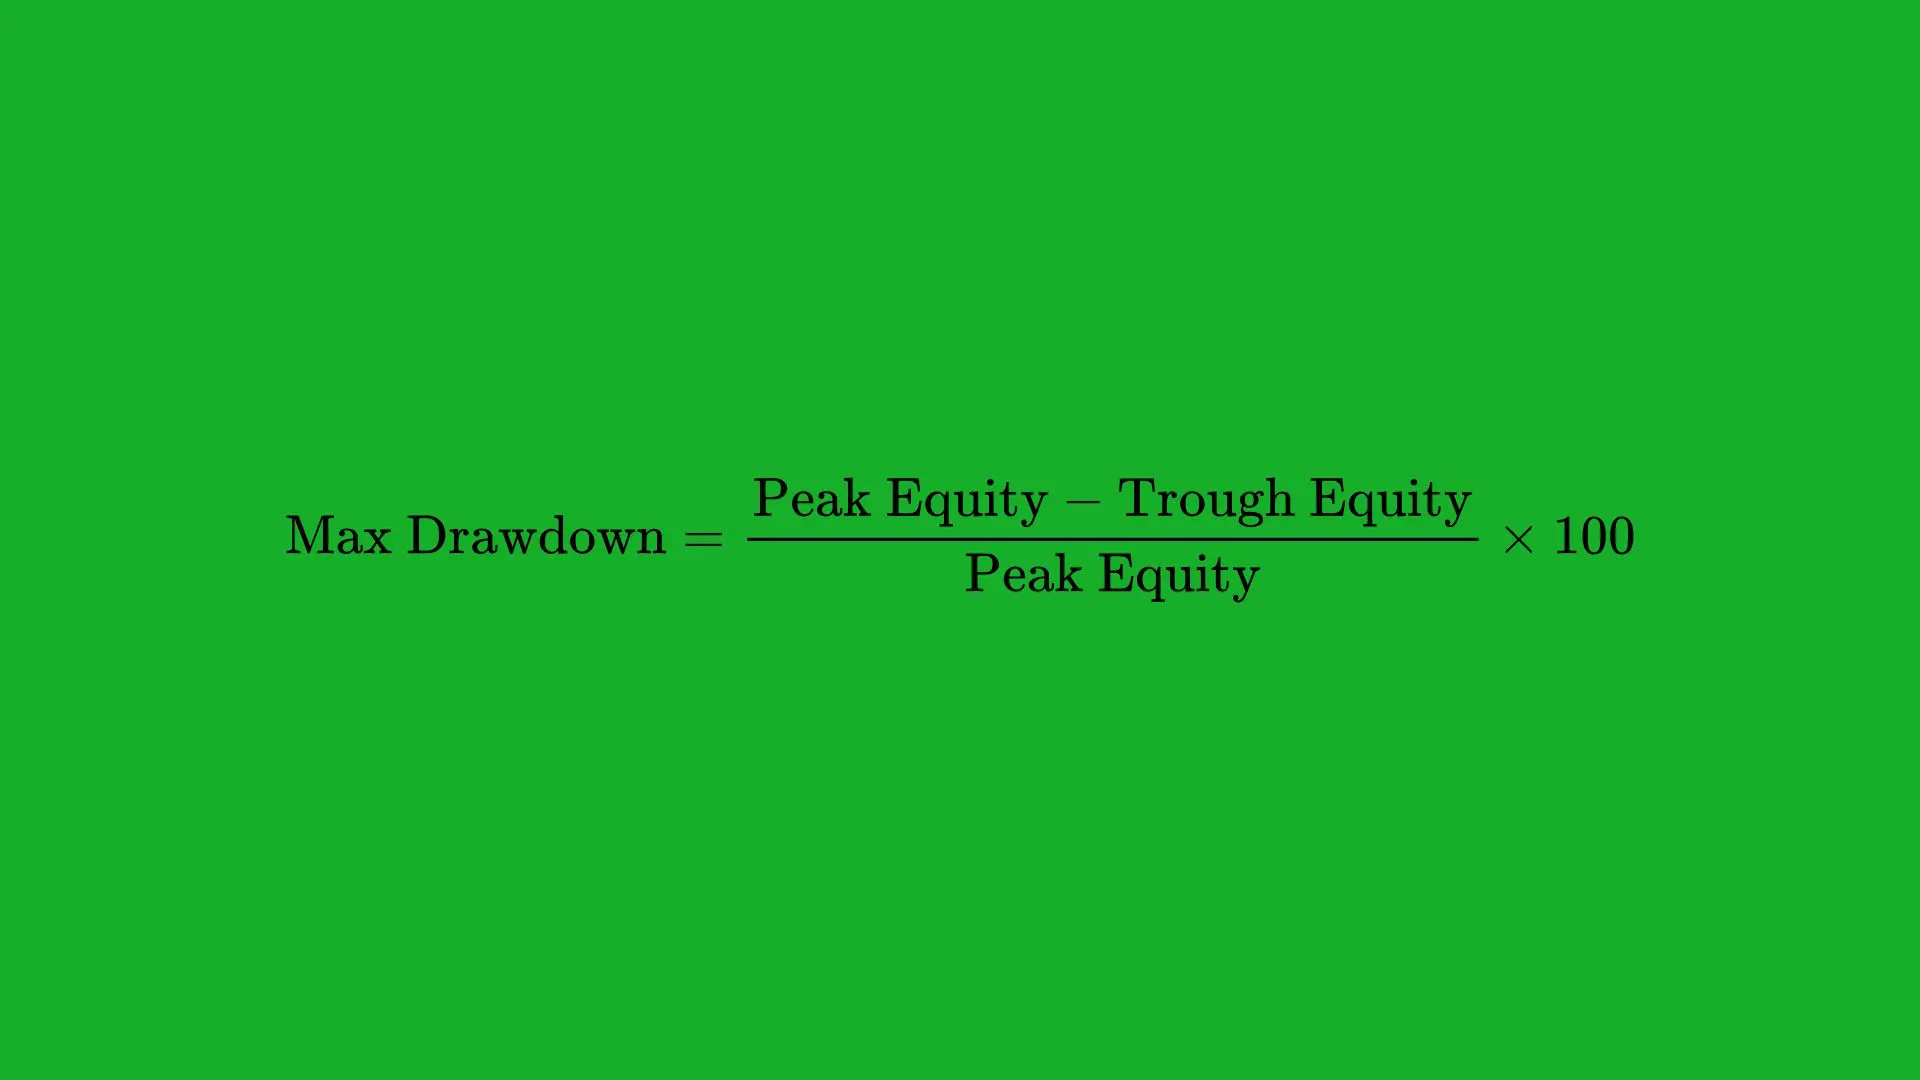
Calculating Maximum Drawdown is straightforward, but it requires historical data of your account balance or your strategy’s equity curve. The steps to identify and measure MDD usually follow this approach:
- Collect Historical Equity Data: Obtain the daily, weekly, or monthly equity values of your trading account or portfolio.
- Identify Peaks and Troughs: A peak is a local maximum in the equity curve, and a trough is a local minimum that follows the peak.
- Calculate Drawdowns from Each Peak to Trough: For each identified peak and subsequent trough, compute the drawdown percentage: Drawdown = ((Peak Value − Trough Value) / Peak Value) × 100%
- Find the Maximum Value (MDD): Out of all the drawdown values calculated, the largest number is the Maximum Drawdown.
For example, suppose your equity curve for a particular trading strategy over a month is:
- Day 1: $10,000
- Day 5: $12,000 (peak)
- Day 10: $11,000
- Day 15: $9,000 (trough)
- Day 20: $13,000 (new peak)
- From $12,000 down to $9,000, your drawdown is: ((12,000 − 9,000) / 12,000) × 100% = 25%
- The next peak is $13,000, so if the equity never goes below $9,000 in that series, your Maximum Drawdown remains 25%.
Granularity of Data
The time interval used (daily, weekly, monthly) will influence the result. A portfolio might have intraday fluctuations that do not appear in monthly data. Traders using highly leveraged or short-term strategies may prefer daily or even intraday calculations to get a more accurate picture of potential losses.
Factors That Influence Maximum Drawdown
Every trading account or portfolio has unique characteristics that affect drawdowns. Some of these factors can be controlled through risk management and strategy design, while others are inherent to market conditions.
1. Market Volatility
High market volatility means greater price swings, which can lead to larger drawdowns. During periods of turmoil—like financial crises, market crashes, or periods of aggressive speculation—drawdowns can increase dramatically for both diversified portfolios and single-asset traders.
- Example: The 2008 financial crisis saw major indexes like the S&P 500 plunge more than 50% from their peaks, resulting in significant drawdowns for investors.
2. Trading Strategy and Timeframes
A long-term investor focusing on steady growth may see fewer, smaller drawdowns compared to an aggressive day trader using high leverage. Your strategy, including frequency of trades and average holding period, directly impacts volatility and potential drawdowns.
- Short-Term Strategies: Often experience frequent, smaller gains or losses, but can also have sudden, severe drawdowns if leverage is used.
- Long-Term Strategies: Tend to have lower short-term volatility, but if the market takes a significant downturn, the drawdown can still be large if positions are not hedged or managed actively.
3. Leverage and Margin
Leverage amplifies both gains and losses. While it can turbo-charge returns, it significantly increases the risk of steep drawdowns.
- Example: Trading on margin with 4:1 leverage means a 10% move against you results in a 40% loss in your account. This can quickly compound and lead to margin calls, exacerbating the drawdown.
4. Position Sizing
How much capital you allocate to each position can dramatically affect drawdowns. If you over-allocate to a single trade or asset, a downturn in that position can result in hefty losses.
- Rule of Thumb: Many risk management guidelines suggest risking no more than 1-2% of your trading capital on any single trade. This approach helps contain potential losses to a manageable level.
5. Emotional and Psychological Factors
Fear, greed, and impatience can lead traders to deviate from their plans, often worsening drawdowns. For instance, panic selling near the trough of a drawdown locks in losses, whereas disciplined traders might ride out the storm and see the account recover.
- Example: A trader sees a 10% drawdown, panics, and closes all positions, only to watch the market reverse and rally in the subsequent days—missing out on potential recovery gains.
Common Mistakes Leading to Large Drawdowns
Recognizing common pitfalls can help traders avoid large and potentially catastrophic drawdowns. Below are some frequent errors:
- Over-Leveraging
Many traders use excessive leverage, hoping to amplify returns. While this can lead to quick profits, it can also result in margin calls and catastrophic account losses during market downturns. - Failing to Use Stop-Losses
Not placing stop-loss orders or using mental stops can lead to unchecked losses. Traders may “hope” the market will reverse instead of cutting their losses, leading to deep drawdowns. - Revenge Trading
After a losing streak, traders might increase position sizes or enter risky trades in an attempt to “win back” losses quickly. This emotional response often leads to even bigger losses. - Ignoring Correlation Risks
Holding multiple assets that move in tandem (positive correlation) can magnify drawdowns in a market slump. For example, a trader who invests in technology stocks exclusively will likely see a bigger drawdown if the tech sector dips significantly. - No Diversification
In many cases, traders or investors put all their eggs in one basket. Without diversification, the drawdown can be extreme if that single asset or strategy fails. - Poor Timing or Lack of Patience
Buying high and selling low is a trap for impulsive traders. Lack of patience can lead to entering trades too late in a rally or exiting too early in a recovery, both of which can inflate drawdowns.
By acknowledging these mistakes and taking measures to mitigate them, you stand a much better chance of keeping your drawdowns within acceptable limits.
Strategies to Manage and Mitigate Maximum Drawdown
Now that we understand what Maximum Drawdown is and why it matters, let’s explore the practical strategies you can adopt to limit drawdowns. Minimizing drawdowns isn’t just about peace of mind; it also ensures that your capital remains robust enough to capitalize on future trading opportunities.
1. Proper Risk Management
Risk management should be the foundation of any trading plan. It involves setting rules for how much you are willing to lose on each trade or each day, week, or month. The principle is to protect your capital first, ensuring longevity in the market.
- Risk Per Trade: A commonly recommended guideline is to risk no more than 1-2% of your account balance on any single trade. That means if you have a $50,000 account, you risk $500-$1,000 on each position.
- Max Daily/Weekly Loss Limits: Some traders set daily or weekly caps on losses. If you hit that limit, you stop trading to prevent impulsive decisions fueled by frustration or panic.
2. Position Sizing Techniques
Position sizing is one of the most effective ways to manage drawdowns. By carefully determining how large each trade should be relative to your overall capital, you control your exposure to risk.
Key Approaches to Position Sizing:
- Fixed Fractional Position Sizing: Risk a fixed percentage of your account balance on each trade. This is a dynamic approach since your position sizes shrink after losses and grow after wins.
- Fixed Dollar Position Sizing: Risk the same absolute amount (e.g., $500) on every trade, regardless of account balance changes.
- Volatility-Based Position Sizing: Adjust your position size according to the volatility of the instrument. Assets with higher volatility get smaller position sizes, while less volatile assets get larger position sizes.
Each method has its pros and cons, but the overarching goal remains the same: limit the potential loss so that you do not incur a devastating drawdown.
3. Stop-Loss Orders
A stop-loss order is a basic yet powerful tool that automatically closes your position if the market moves against you by a specified amount. Properly placing stop-loss orders can help you avoid emotionally driven decisions and large, unchecked losses.
- Example: If you buy a stock at $50 with a stop-loss order at $45, you’re risking $5 per share. If the price drops below $45, your broker automatically executes a sell order to close the position, limiting the loss.
Stop-loss placement requires balance. Setting it too tight can lead to frequent stop-outs on minor market noise. Setting it too wide can result in large losses.
4. Diversification
Diversification is a cornerstone of prudent portfolio management. It involves allocating your capital across various assets, sectors, or strategies that are not closely correlated. This approach ensures that a downturn in one area does not disproportionately impact your entire portfolio.
- Asset Classes: Stocks, bonds, commodities, forex, cryptocurrencies, and real estate.
- Geographic Regions: Domestic vs. international markets.
- Investment Styles: Growth vs. value, passive index funds vs. actively managed strategies.
By spreading out risk, you decrease the likelihood that a single market event will cause a major drawdown in your overall portfolio.
5. Hedging Strategies
Hedging involves taking offsetting positions to protect against adverse price movements. Common hedging tactics include options, futures contracts, or inverse ETFs. While hedging can limit upside potential, it provides a buffer against catastrophic drawdowns.
- Example: If you’re heavily invested in technology stocks, you could hedge by purchasing put options on a tech-heavy index. This way, if the tech sector falls, the gains from your put options could offset some of your losses in the underlying positions.
6. Systematic vs Discretionary Trading
Systematic trading involves following a well-defined set of rules for entries, exits, and risk management, often automated or semi-automated. In contrast, discretionary trading relies on the trader’s judgement and intuition. While discretionary traders can adapt more quickly to changing market conditions, systematic trading can help reduce emotional biases that lead to large drawdowns.
- Systematic Approach Example: A mechanical trend-following system might exit all positions if they drop below a 50-day moving average, thereby preventing large drawdowns when the trend reverses.
7. Regular Portfolio Rebalancing
Portfolio rebalancing ensures that your asset allocations remain aligned with your risk tolerance. Over time, certain positions may grow faster than others, increasing their weight in your portfolio. If you don’t rebalance, you might become overexposed to a single asset class or sector.
- Example: Suppose you aim for a 60/40 stock-to-bond allocation. If stocks rally significantly and reach 70% of your portfolio, rebalancing back to 60% can lock in gains and reduce the risk of a future drawdown should the stock market correct.
Using Maximum Drawdown in Risk Management and Performance Evaluation
Maximum Drawdown is not only a metric to be retrospectively calculated; it also serves as a guiding principle for real-time risk management and performance evaluation. Here’s how:
1. Comparing Strategies
When evaluating multiple trading strategies or portfolio managers, look at both their returns and their Maximum Drawdowns. A strategy that yields 15% annual returns with a 10% MDD might be preferable to one that yields 20% annual returns but has a 40% MDD. The latter strategy could cause substantial emotional stress and potential capital ruin if the drawdown is realized.
- Example Metrics for Comparison:
- Return on Investment (ROI)
- Sharpe Ratio (risk-adjusted returns)
- Sortino Ratio (downside-risk-adjusted returns)
- Maximum Drawdown (focus on capital protection)
2. Setting Risk Tolerances
Traders can use MDD as a reference point for risk tolerance. If your historical analysis shows that your strategy has a typical MDD of around 10%, but you realize you can’t emotionally handle anything above 5%, it’s time to either adjust the strategy or reduce leverage. Aligning your strategy’s drawdown profile with your personal risk tolerance is critical for long-term consistency.
3. Monitoring Drawdown in Real Time
Real-time monitoring of drawdowns helps you spot red flags and intervene before the damage becomes irreparable. Many traders and portfolio managers set drawdown alerts at certain levels—e.g., 5%, 10%, or 15%—which trigger re-evaluation of the current positions or hedging tactics.
- Example: You can program your trading software to send you an alert when your account dips 8% below its recent peak. You might then decide to reduce position sizes or tighten stops.
Real-World Examples of Maximum Drawdown
To better illustrate how Maximum Drawdown affects real-world trading and investing, let’s review some historical scenarios:
Example 1: Equity Market Crash
The 2008 Global Financial Crisis serves as a prime example. The S&P 500 peaked in October 2007, then plummeted by over 50% through March 2009. Investors heavily concentrated in equities saw drawdowns ranging from 40% to 60%. Even well-diversified portfolios experienced large drawdowns but generally to a lesser extent.
- Key Lesson: Diversification and defensive strategies (like holding bonds or cash) helped cushion some of the losses. Those who managed to keep their drawdowns smaller preserved more capital to reinvest when markets turned around.
Example 2: Individual Stock Drawdown
A single stock can go through dramatic drawdowns if the company faces scandals, regulatory scrutiny, or poor earnings. Take, for instance, Enron in 2001. In a matter of months, the stock went from over $80 to under $1. Investors who didn’t manage risk or diversify faced a nearly 100% drawdown in that position.
- Key Lesson: Relying on a single stock or sector is a gamble. Use position sizing and diversification to mitigate the risk of catastrophic drawdowns.
Example 3: Cryptocurrency Volatility
The cryptocurrency market is known for its extreme volatility. For example, Bitcoin has seen multiple drawdowns of over 80% in its short history. In late 2017, Bitcoin reached nearly $20,000 before plunging to around $3,000 in late 2018.
- Key Lesson: High volatility assets can deliver outsized gains, but they also come with the potential for severe drawdowns. Managing leverage and position sizes is crucial in these markets.
Tools and Techniques for Monitoring Maximum Drawdown
Monitoring your Maximum Drawdown doesn’t have to be a tedious, manual process. Numerous tools exist to help traders and investors keep track of their equity and manage drawdowns more effectively.
Trading Platforms and Software
Modern trading platforms like MetaTrader, NinjaTrader, TradeStation, and many brokerage-provided platforms offer real-time tracking of account equity. They often include built-in performance analytics or custom scripts/indicators that show drawdowns.
- Example: You can view an “Account Performance” tab to see your current drawdown, as well as historical drawdowns over various time frames.
Automated Alerts and Notifications
Set up automated alerts to inform you when your account dips a certain percentage below the most recent equity peak. This alert can be sent via email, SMS, or push notifications.
- Benefit: You’ll know immediately when your drawdown hits critical levels, allowing you to take decisive action, such as closing losing positions or adjusting stops.
Backtesting Your Strategy
Backtesting involves applying your trading strategy to historical data to see how it would have performed. This process is essential in understanding the potential drawdowns you might face.
- Data Quality: Ensure you use reliable, high-quality historical data.
- Realistic Assumptions: Account for slippage, transaction costs, and realistic fill prices.
- Look for Worst-Case Scenarios: Identify periods of high market volatility or black swan events.
By analyzing how your strategy would have performed in historical downturns, you gain insights into potential Maximum Drawdown, helping you refine your approach and prepare for adverse market conditions.
Putting It All Together: A Comprehensive Drawdown Management Plan

To effectively protect your capital, you need a comprehensive plan that integrates the lessons and strategies outlined throughout this article. Below is a step-by-step framework to help you develop and maintain a robust drawdown management plan:
- Define Your Risk Tolerance and Objectives
- Establish the maximum drawdown you can tolerate without violating your trading or investment objectives.
- Align the drawdown threshold with your psychological comfort level and financial goals.
- Design or Select a Trading Strategy with Acceptable Risk-Reward Profile
- Look for strategies that match your risk tolerance.
- Analyze historical performance metrics, including Maximum Drawdown, Sharpe Ratio, and Sortino Ratio.
- Implement Rigorous Risk Management Rules
- Position Sizing: Adopt fixed fractional, fixed dollar, or volatility-based methods that keep risk per trade at manageable levels.
- Stop-Loss Orders: Use strategically placed stop-losses to limit individual trade losses.
- Daily/Weekly Loss Limits: Cease trading if you reach a predefined loss threshold, preventing emotional decision-making.
- Diversify Your Portfolio
- Invest across multiple asset classes, sectors, and geographies.
- Avoid over-concentration in correlated assets.
- Employ Hedging Where Appropriate
- Use options, futures, or inverse ETFs to protect against adverse movements in critical holdings.
- Balance the cost of hedging (option premiums, reduced upside) against the benefit of drawdown protection.
- Monitor and Adjust in Real Time
- Use analytics and alerts to track current drawdown levels.
- Be prepared to scale back positions or tighten stops if your account hits certain drawdown thresholds.
- Regularly Review and Rebalance
- Periodically assess your strategy’s performance, especially after large market moves.
- Rebalance your holdings to maintain your intended asset allocation and risk profile.
- Psychological Preparedness
- Understand that drawdowns are inevitable in trading.
- Develop a mindset that accepts temporary losses as part of the process, reducing the likelihood of panic-driven decisions.
- Continuous Learning and Adaptation
- Markets evolve. Strategies that work in one environment may falter in another.
- Keep learning, testing, and refining your approach to stay ahead of changing market conditions.
By following these steps, you create a robust safeguard against catastrophic losses. This integrated plan enhances your ability to stay disciplined, maintain emotional composure, and ultimately succeed over the long haul.
Conclusion
Maximum Drawdown stands as one of the most crucial metrics in trading and investing because it captures the essence of risk—how much you can lose from your highest point. While traders often focus on achieving high returns, the reality is that surviving in the markets for the long term is as much about avoiding large drawdowns as it is about securing profitable trades.
In this in-depth article, we’ve walked through the definition of Maximum Drawdown, why it’s important, and how to calculate it. We examined the various factors that can contribute to large drawdowns—such as high leverage, poor position sizing, and psychological missteps—and looked at both common mistakes and proven strategies to mitigate risk. From the critical role of proper risk management and diversification, to the value of systematic trading and hedging strategies, you now have a comprehensive toolkit for safeguarding your capital.
To recap the key takeaways:
- Drawdowns Are Inevitable: Every trader and investor experiences drawdowns. The key is to limit their magnitude.
- Risk Management Is Paramount: Through disciplined position sizing, appropriate stop-loss levels, and portfolio diversification, you can keep your downside in check.
- Psychology Matters: Emotions can amplify losses. Establishing clear rules and following them reduces the risk of panic selling or revenge trading.
- Use Maximum Drawdown as a Guiding Metric: Regularly monitoring drawdowns helps you stay within your risk tolerance and maintain trading discipline.
Incorporating a Maximum Drawdown framework into your risk management plan elevates you from a speculative gambler to a strategic trader. By keeping your losses under control, you enhance the stability of your trading performance and the likelihood that you’ll be around to profit from future market opportunities.
Remember that no single metric or strategy guarantees success. Markets are dynamic, and what works today may not work next year. Nonetheless, if you keep a sharp eye on your drawdowns and continually refine your approaches to controlling and mitigating risk, you’ll be well-positioned to protect your capital, preserve your psychological well-being, and prosper in the ever-evolving world of trading.
