The momentum stock trading strategy is a widely-used approach in the stock market that focuses on capitalizing on short-term price trends. The core idea behind this strategy is to leverage stocks exhibiting strong price movements—whether upward or downward—over a defined period. Traders employing this strategy aim to buy high and sell higher when momentum is positive or short sell at lower prices and cover even lower when momentum is negative. This approach can be particularly attractive to beginners as it offers relatively clear entry and exit signals and aligns with the classic trading adage, “the trend is your friend.”
At its essence, the momentum stock trading strategy is grounded in the behavioral finance concept that trends often persist longer than what might seem rational. Traders who can identify and ride these trends effectively have the potential to achieve consistent profits in both bullish (rising) and bearish (falling) market conditions. However, mastering this strategy requires a disciplined approach, robust risk management, and a deep understanding of market psychology.
In this comprehensive article, you will discover:
- What the momentum stock trading strategy is and why it might be an excellent choice for beginners.
- Key concepts that drive momentum in the stock market, such as price action, volume, and market sentiment.
- Essential technical tools and indicators for identifying momentum and optimizing trade timing.
- A straightforward, beginner-friendly momentum stock trading strategy that you can adopt and tailor to your needs.
- Step-by-step guidelines on executing momentum-based trades, complete with practical examples.
- Common pitfalls to watch out for and strategies to avoid them, ensuring more consistent gains.
- Additional tips to enhance your trading discipline and refine your strategy.
By the end of this guide, you will have a thorough understanding of how to design and implement a simple yet effective momentum stock trading strategy that can potentially lead to steady, consistent gains in the stock market. Let’s get started!
Table of Contents
What Is Momentum Trading?
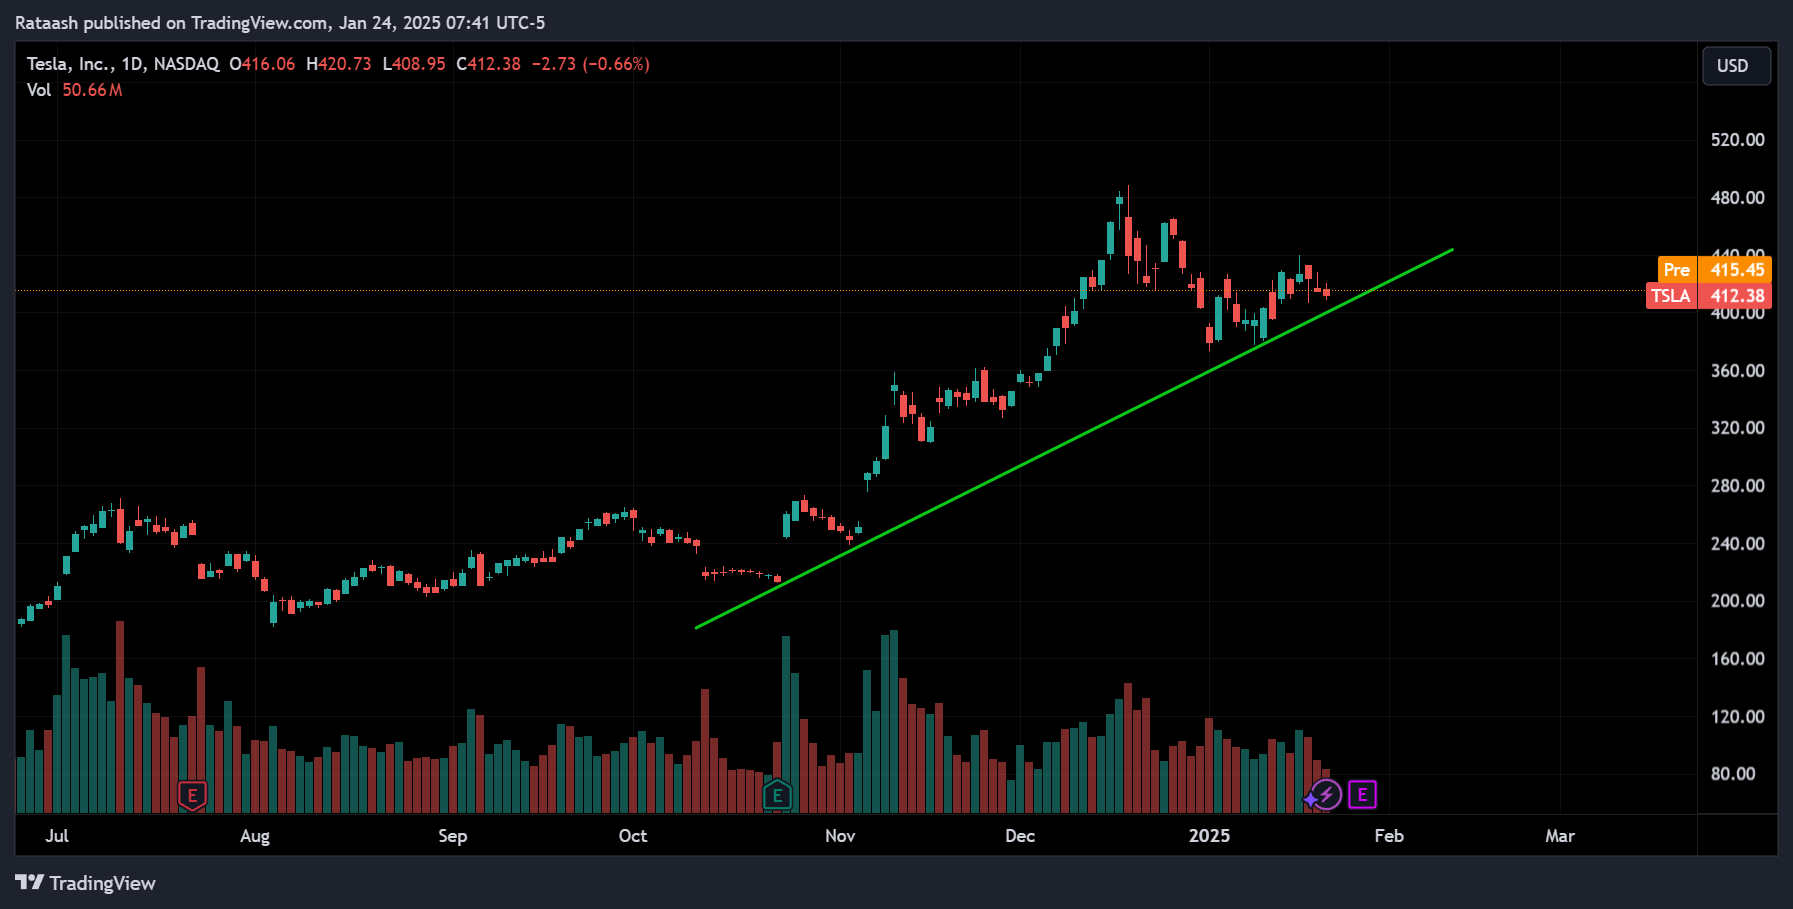
Momentum trading is a style of trading that involves buying or selling stocks based on their recent price trends. Rather than focusing heavily on the intrinsic value of a stock or the company’s fundamentals, momentum traders concentrate on price action and market trends. The core premise is that a stock that has shown an upward price movement is more likely to continue climbing in the short term, and one that is falling is likely to continue its descent for a period.
Key Characteristics of Momentum Trading
- Short to Medium-Term Focus
Momentum traders typically hold positions anywhere from a few minutes to a few weeks, depending on the intensity of the price trend and the trader’s objectives. - Rapid Decision-Making
Because momentum-based opportunities can unfold quickly, momentum traders need to make swift decisions. This can be appealing for those who enjoy an active, engaged trading style. - High Liquidity
Momentum traders tend to focus on stocks with higher trading volumes. Liquidity helps ensure they can enter and exit positions quickly at desired prices. - Technical Analysis Heavy
While fundamentals can play a role in identifying promising stocks over a longer horizon, momentum trading primarily relies on technical indicators and chart patterns to time entries and exits.
Psychological Aspect of Momentum
An important aspect of momentum trading is understanding how market participants—individual investors, institutional traders, and algorithms—react to price changes. Human psychology often leads people to jump into a rising market out of greed or panic sell during a falling market. This behavior can intensify trends, thereby creating opportunities for momentum traders to capitalize on continuing price movements.
Why Momentum Trading Might Be Ideal for Beginners

For a newcomer to trading, navigating the complexities of the stock market can feel daunting. Many beginners dive into strategies that are either too complicated or too reliant on difficult-to-interpret fundamental data. Momentum trading, in contrast, offers a relatively straightforward framework:
- Clear Signals: Momentum-based setups often provide visible patterns—like breakouts or volume surges—that help traders identify potential trades without being bogged down by excessive complexity.
- Less Emphasis on Deep Fundamental Analysis: While it’s always beneficial to understand a company’s fundamentals, momentum trading places a greater weight on price action and market psychology. This frees beginners from having to wade through lengthy financial reports early on.
- Better Risk/Reward Profiles: When done right, momentum trading can offer clearly defined stop-loss levels and profit targets. This clarity can help beginners develop solid risk management practices from the outset.
- Adaptable Across Different Timeframes: Momentum strategies can be used for day trading, swing trading, or even position trading (holding for weeks). This flexibility lets beginners experiment with different styles and find what suits their schedules and temperaments best.
- Teaches Discipline and Emotional Control: Momentum trading helps cultivate discipline because it punishes hesitation and poor risk management. Learning to cut losses quickly and ride winning trades are invaluable lessons for traders of all skill levels.
Fundamental Concepts of Momentum Trading
Before you start jumping in and out of momentum trades, it’s essential to understand the foundational concepts that drive price movements in the stock market. These concepts will serve as the building blocks for your strategy and help you interpret price action more accurately.
1. Price Action
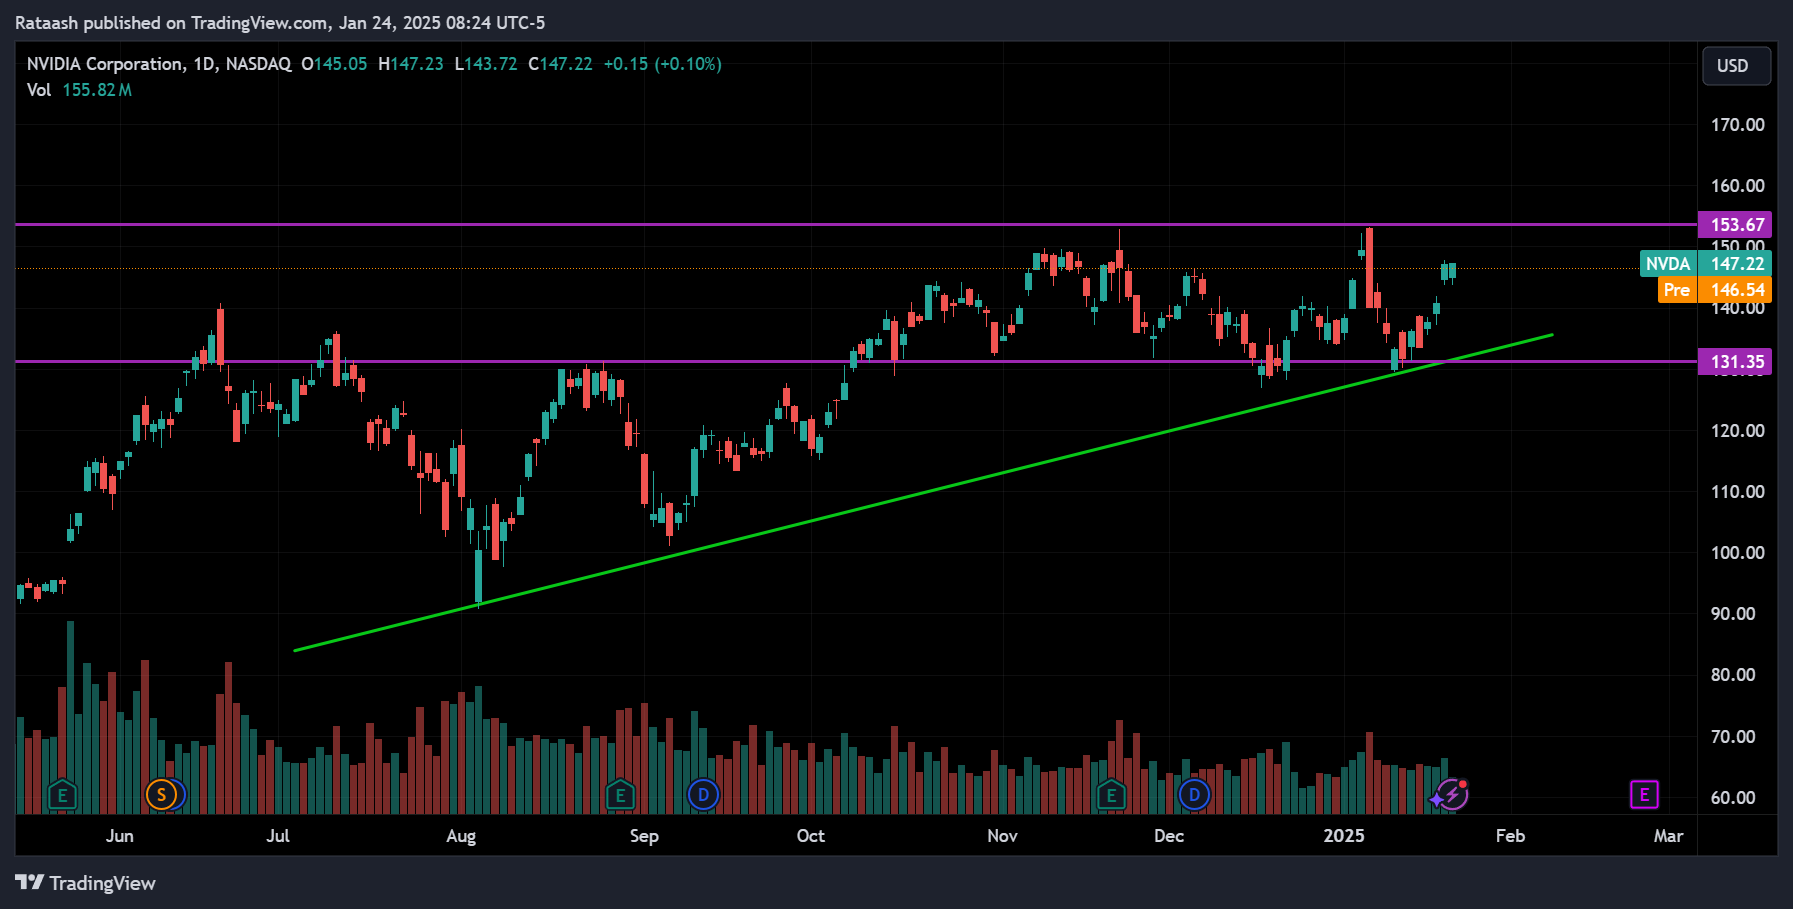
Price action is the heart of technical analysis. It involves analyzing historical price movements to predict future behavior. Momentum traders pay close attention to:
- Trend Lines: Visual representations that connect price lows (in an uptrend) or highs (in a downtrend).
- Support and Resistance Levels: Price points at which stocks historically tend to rebound (support) or get rejected (resistance).
- Breakouts and Breakdowns: Occur when the price moves above a resistance level or below a support level with strong volume.
By focusing on price action, momentum traders look for instances where demand significantly outweighs supply (bullish momentum) or supply overwhelms demand (bearish momentum).
2. Volume
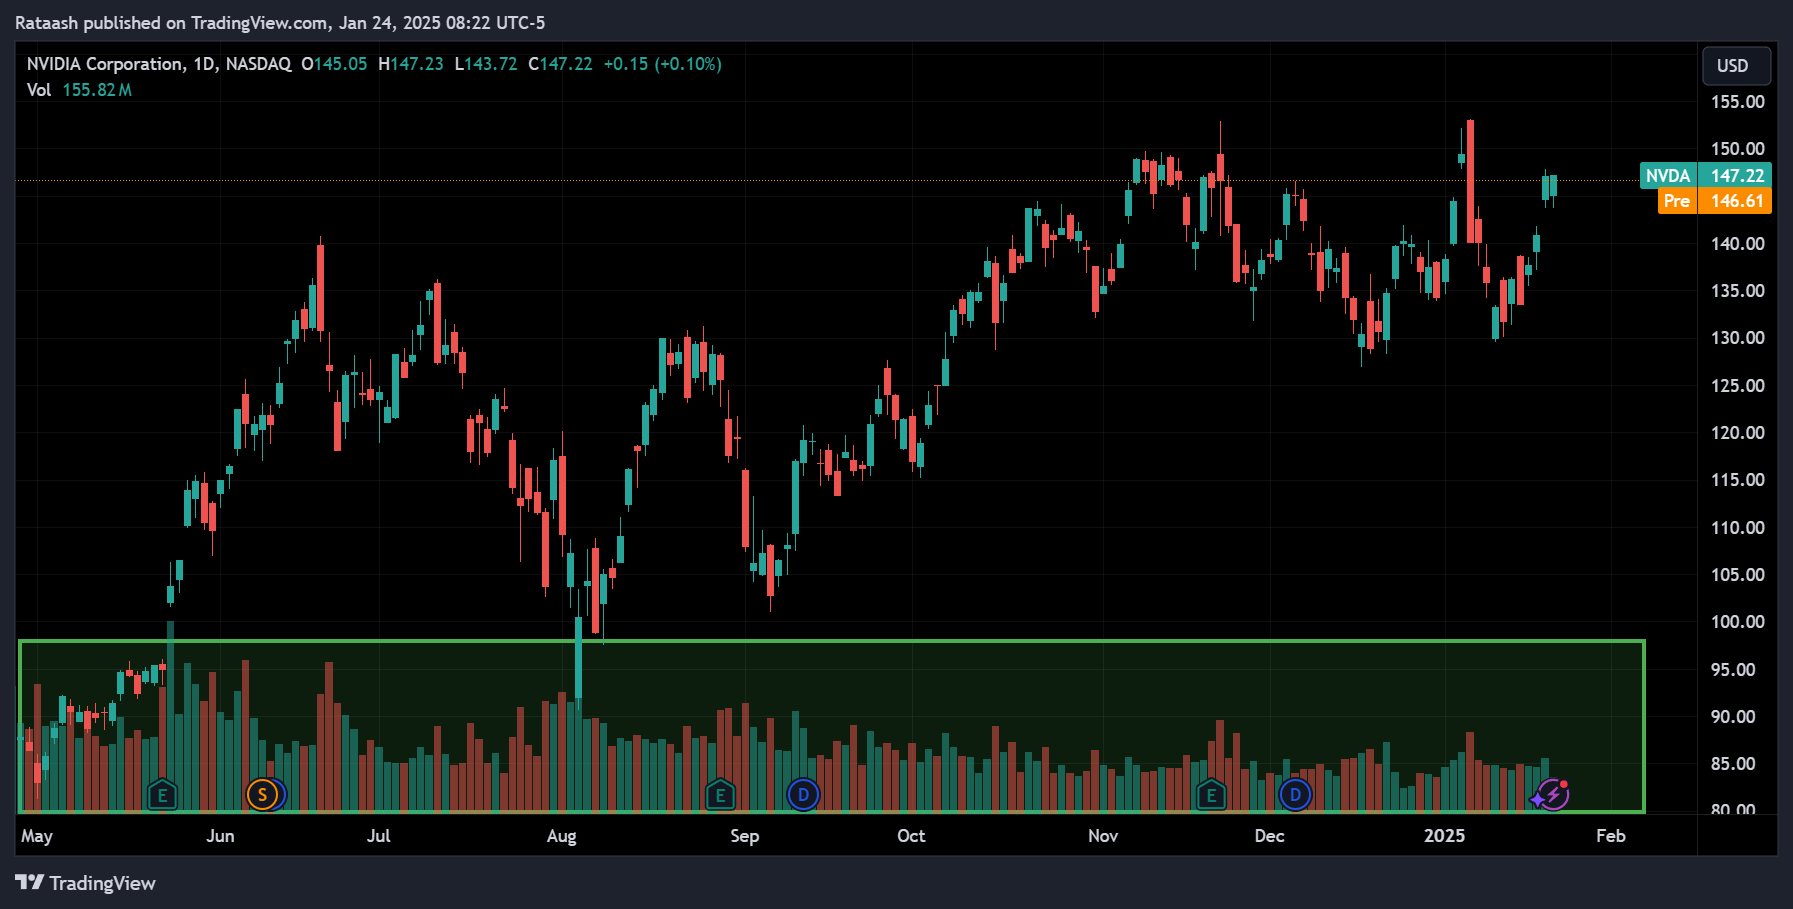
Volume reflects how many shares of a stock are traded over a specific period. Rising volume typically indicates that more participants are trading the stock, and thus the momentum could be stronger. Conversely, falling volume might suggest dwindling interest or a potential slowing of the trend.
Why Volume Matters in Momentum Trading
- Validates breakouts: A breakout that occurs on high volume is more likely to succeed.
- Confirms reversals: A spike in volume during a price reversal may confirm a significant shift in market sentiment.
- Shows conviction: Large institutional traders often move the market with heavy volume, and momentum traders aim to “follow the big money.”
3. Trend
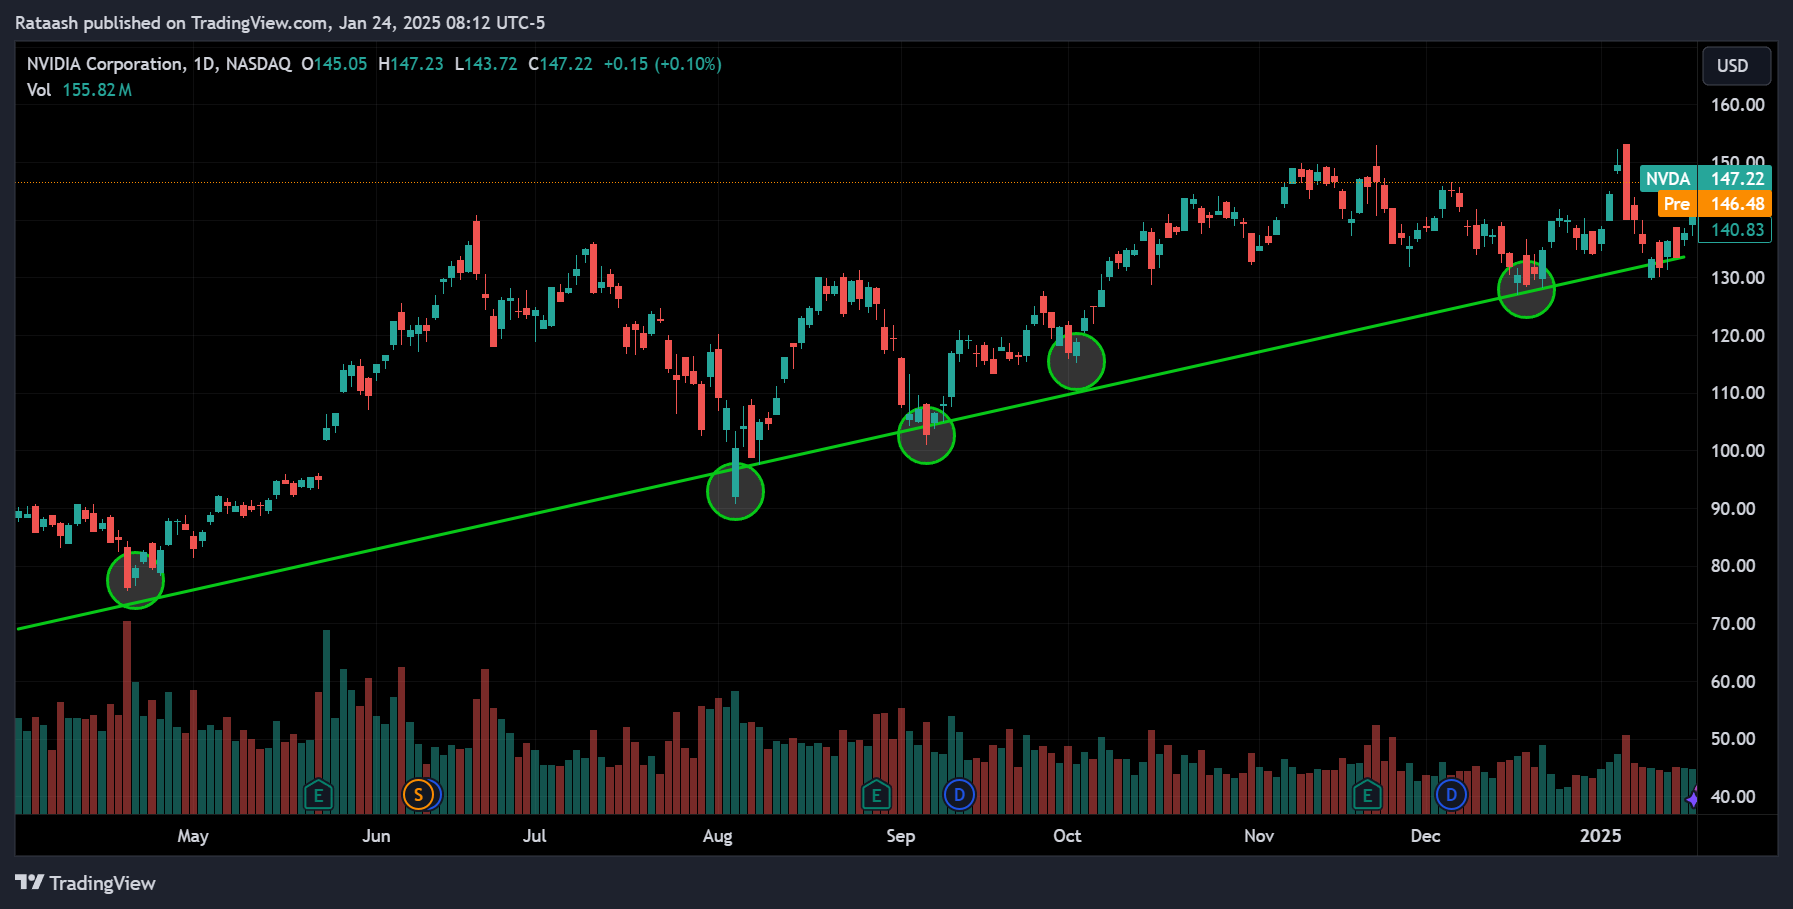
The concept of trend is fundamental in momentum trading. A stock in an uptrend usually exhibits higher highs and higher lows, while a stock in a downtrend shows lower highs and lower lows. Sideways or range-bound conditions indicate that neither buyers nor sellers are dominating.
Momentum traders look to jump aboard when the trend picks up speed. The challenge is differentiating a mere temporary price fluctuation from a genuine momentum shift. This is where technical indicators can provide additional confirmation.
4. Market Sentiment

Market sentiment reflects the overall attitude of traders and investors toward a particular stock or the market as a whole. Positive sentiment can drive prices upward, while negative sentiment can spark sell-offs. Some factors that affect market sentiment include:
- News and Earnings Reports: Positive earnings or favorable news can attract buyers and push prices higher, creating momentum opportunities.
- Economic Data: Macroeconomic indicators like GDP growth, inflation, and employment rates can influence overall market mood.
- Social Media and Analyst Ratings: In today’s digital age, viral social media posts or high-profile analyst upgrades/downgrades can have a pronounced effect on a stock’s short-term price movement.
While market sentiment can be more challenging to quantify than price or volume, staying informed about broader market conditions and news can help you gauge when a momentum shift might begin—or end.
Tools and Indicators for Momentum Trading
Momentum traders rely heavily on technical analysis tools to identify potential trading opportunities and time their entries and exits. Below are some of the most common and effective tools for a beginner-friendly momentum strategy.
1. Charting Platforms
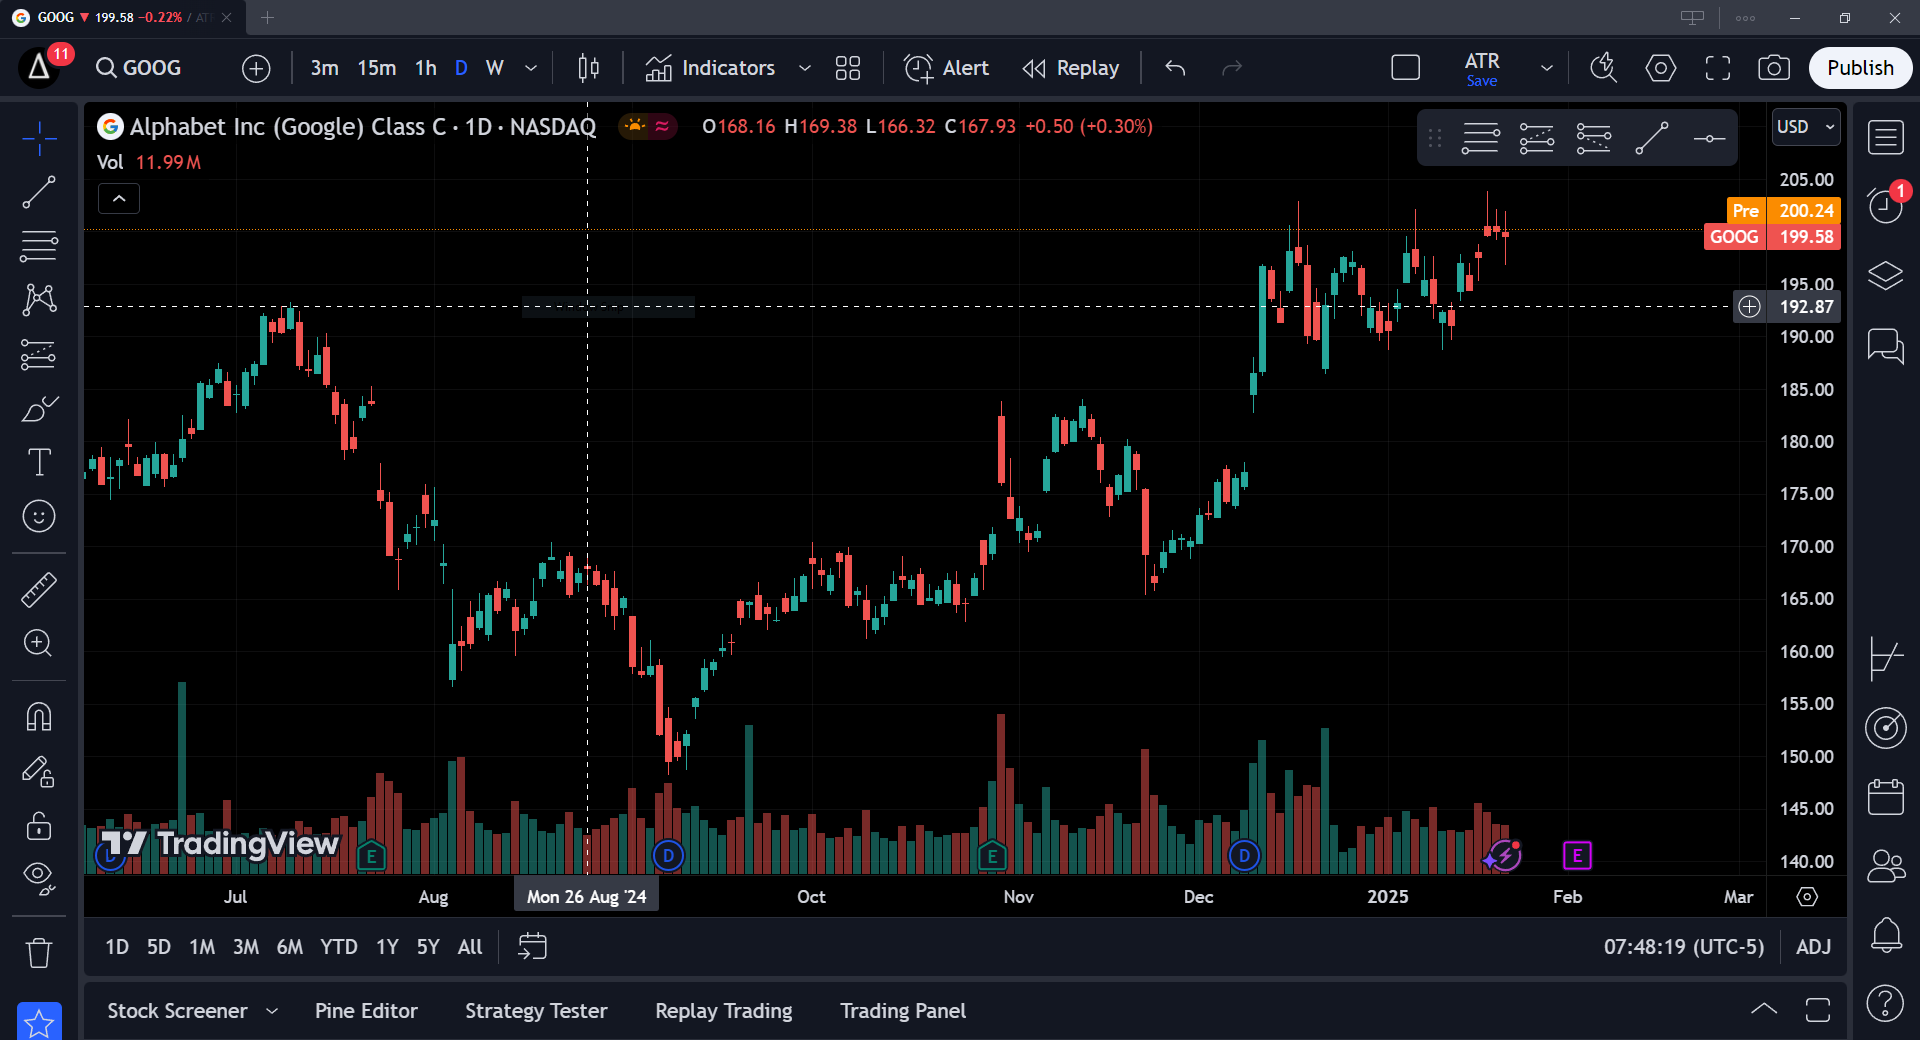
Before diving into specific indicators, ensure you have a reliable charting platform. Popular options include:
- TradingView: Offers a user-friendly interface, abundant technical indicators, and a robust community that shares trading ideas.
- MetaTrader: Commonly used for Forex but also supports stocks and commodities. It provides various technical indicators out of the box.
- Broker-Provided Platforms: Many brokerage firms offer free, built-in charting tools. While they might be more limited in functionality, they are often enough for basic momentum strategies.
When picking a platform, prioritize real-time data, customizable timeframes, and the ability to overlay multiple indicators.
2. Moving Averages (MA)
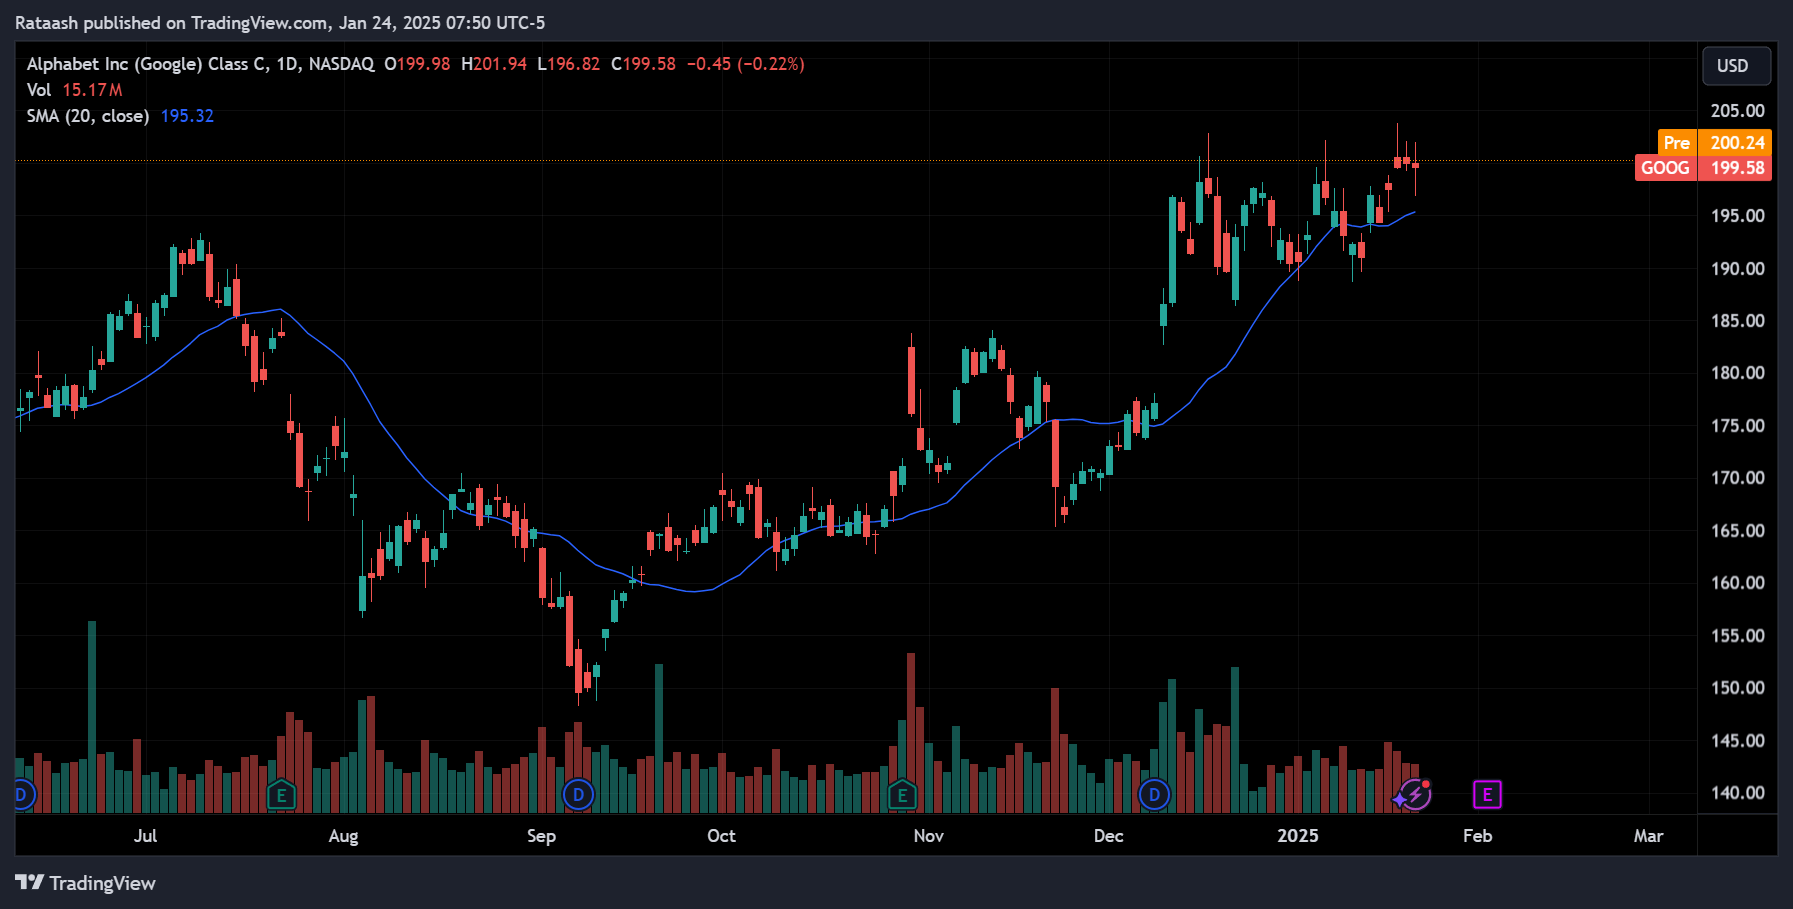
Moving Averages smooth out price data by calculating an average of past prices over a specific period. They help traders identify trends more clearly and offer potential signals for entry or exit.
- Simple Moving Average (SMA): The arithmetic mean of the closing prices over a set number of days (e.g., 20-day SMA or 50-day SMA).
- Exponential Moving Average (EMA): Assigns more weight to recent prices, making it more responsive to sudden price changes.
How to Use in Momentum Trading
- Crossover Strategies: A bullish signal may occur when a shorter-term MA (e.g., 20-day) crosses above a longer-term MA (e.g., 50-day). A bearish signal may happen when it crosses below.
- Trend Confirmation: If the price remains above the moving average for an extended period and the MA is trending upward, it indicates bullish momentum (and vice versa).
3. Relative Strength Index (RSI)
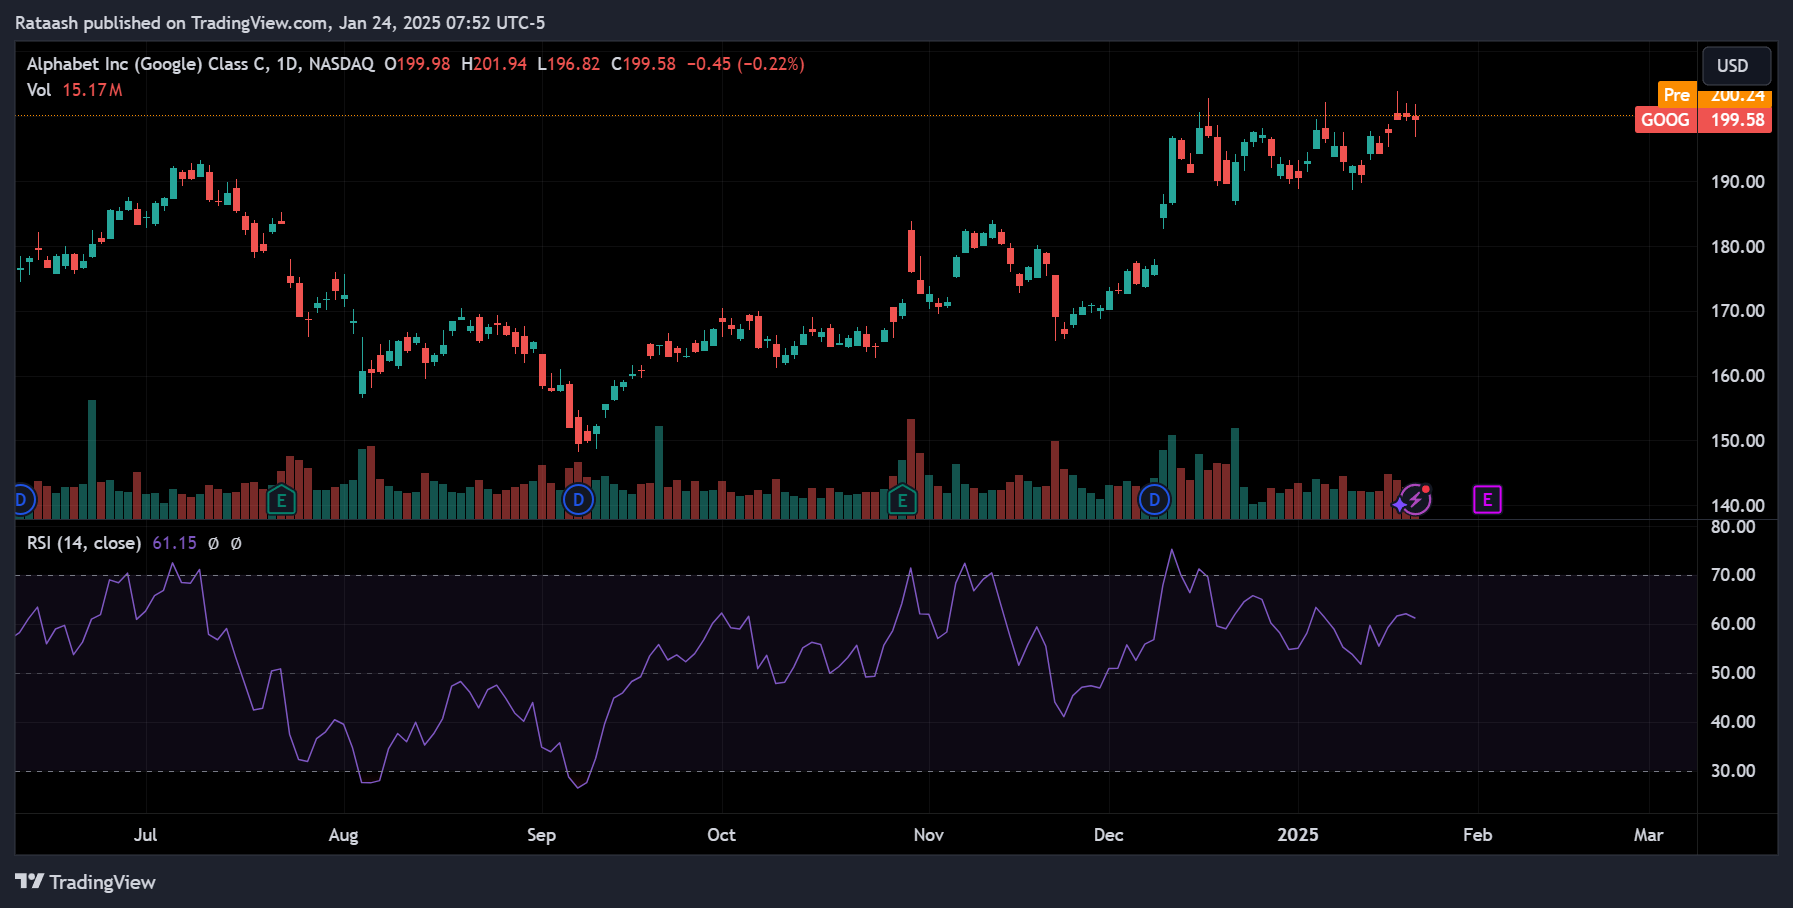
RSI is a momentum oscillator that measures the speed and change of price movements. It ranges from 0 to 100 and is commonly used to identify overbought (>70) or oversold (<30) conditions.
- Momentum Signal: When RSI moves from below 30 to above 30, it suggests a growing bullish momentum. Similarly, dropping from above 70 to below 70 may indicate a pause or reversal in a bullish trend.
- Divergence: Occurs when the price makes a new high (or low) but the RSI fails to do so. This can signal that momentum is weakening, potentially indicating a trend reversal.
4. Moving Average Convergence Divergence (MACD)
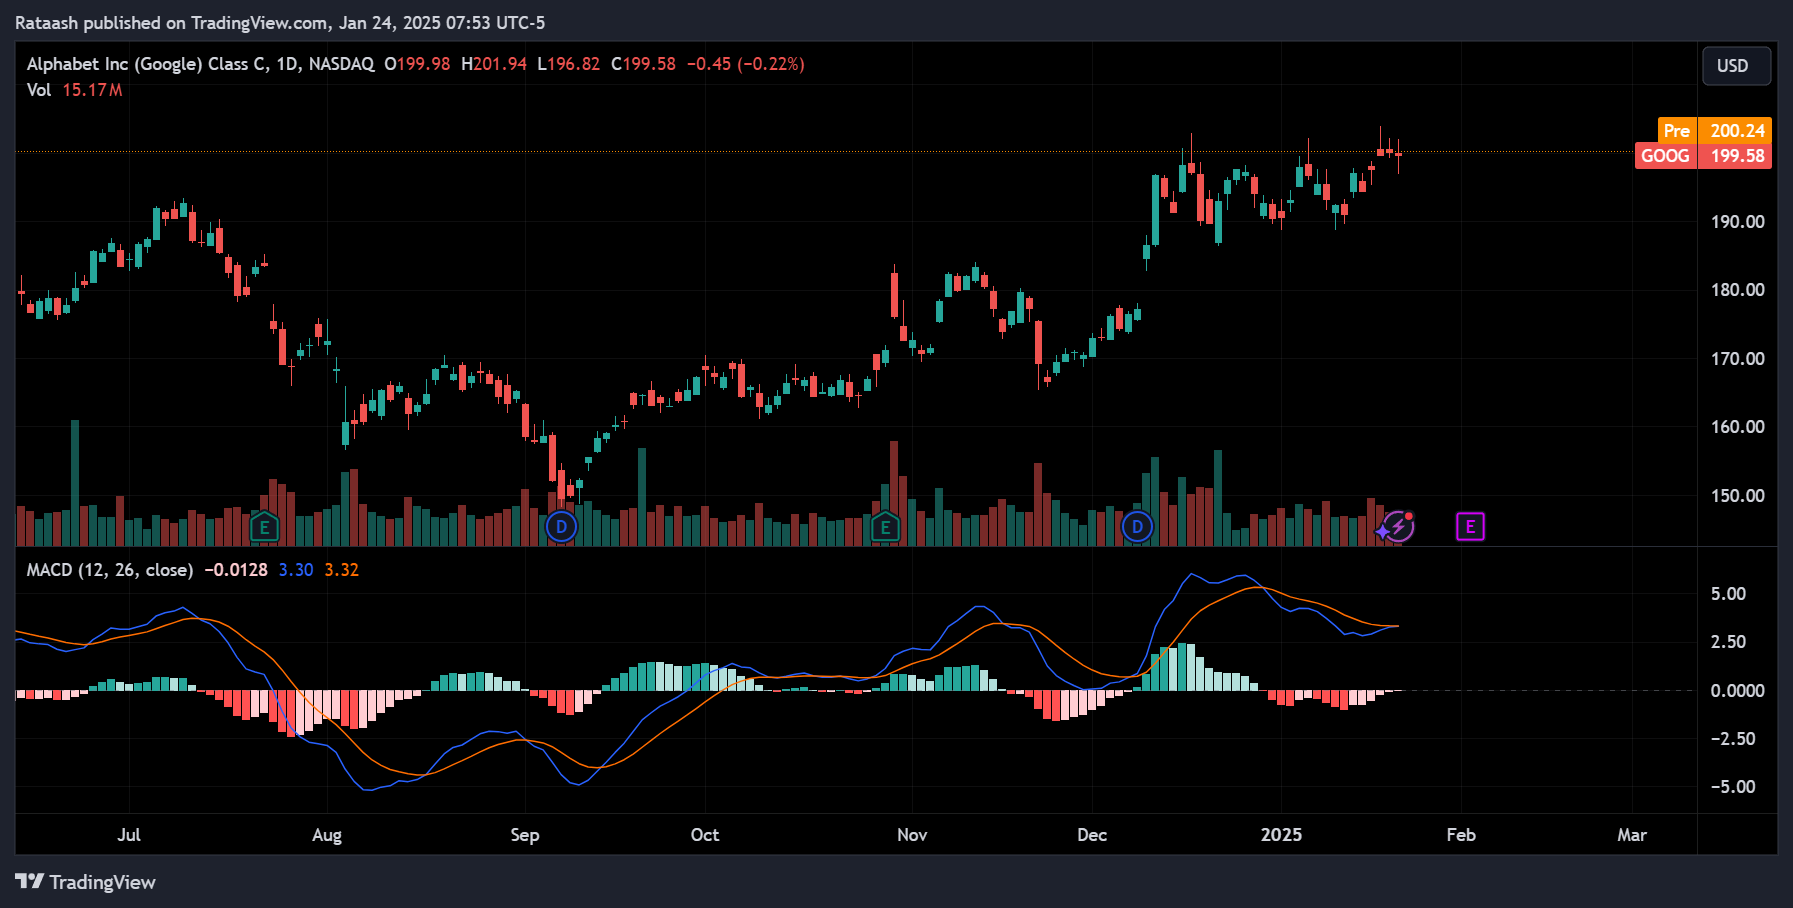
MACD is another popular technical indicator used to spot changes in momentum. It consists of two lines:
- MACD Line: Computed as the difference between two EMAs (usually 12-day EMA and 26-day EMA).
- Signal Line: A 9-day EMA of the MACD line.
A bullish crossover occurs when the MACD line crosses above the signal line, suggesting increasing upward momentum. Conversely, a bearish crossover happens when the MACD line crosses below the signal line.
5. Volume Indicators
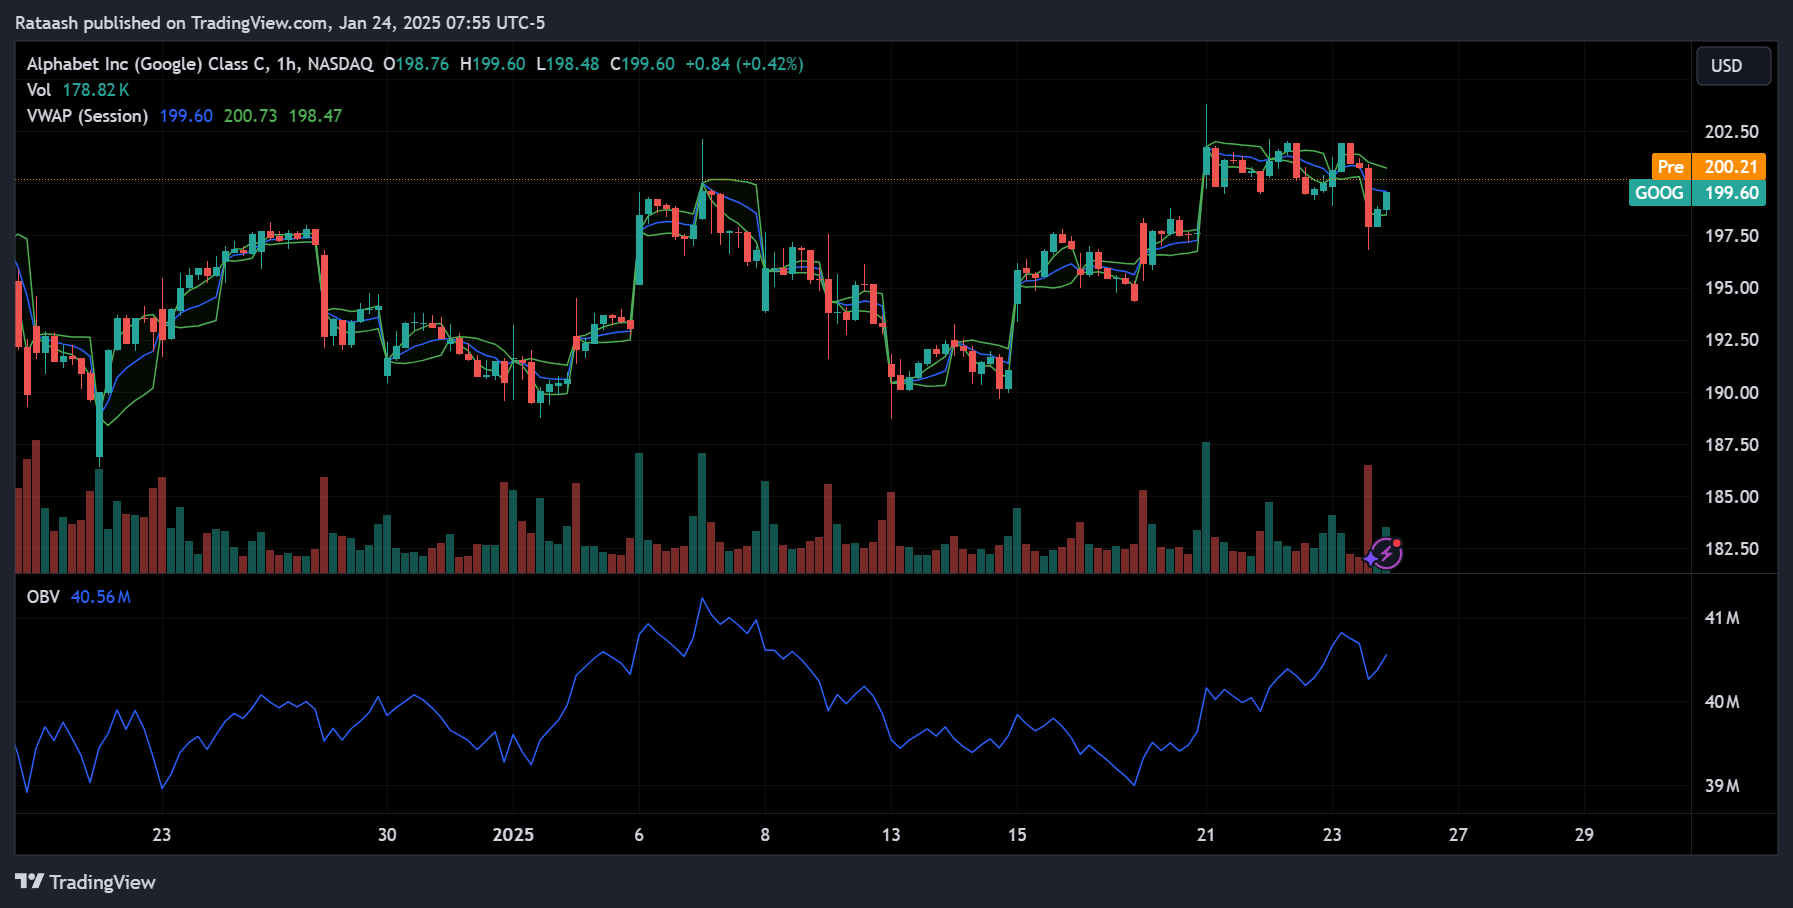
While raw volume data is crucial, additional volume-based indicators can offer deeper insights:
- On-Balance Volume (OBV): Tracks the cumulative buying and selling pressure by adding volume on up days and subtracting volume on down days.
- Volume Weighted Average Price (VWAP): Commonly used by day traders to gauge the average price weighted by volume.
Momentum traders often watch for volume spikes in conjunction with price breakouts, as these signals can confirm genuine momentum and reduce the likelihood of false breakouts.
6. Breakout Patterns and Candlestick Analysis
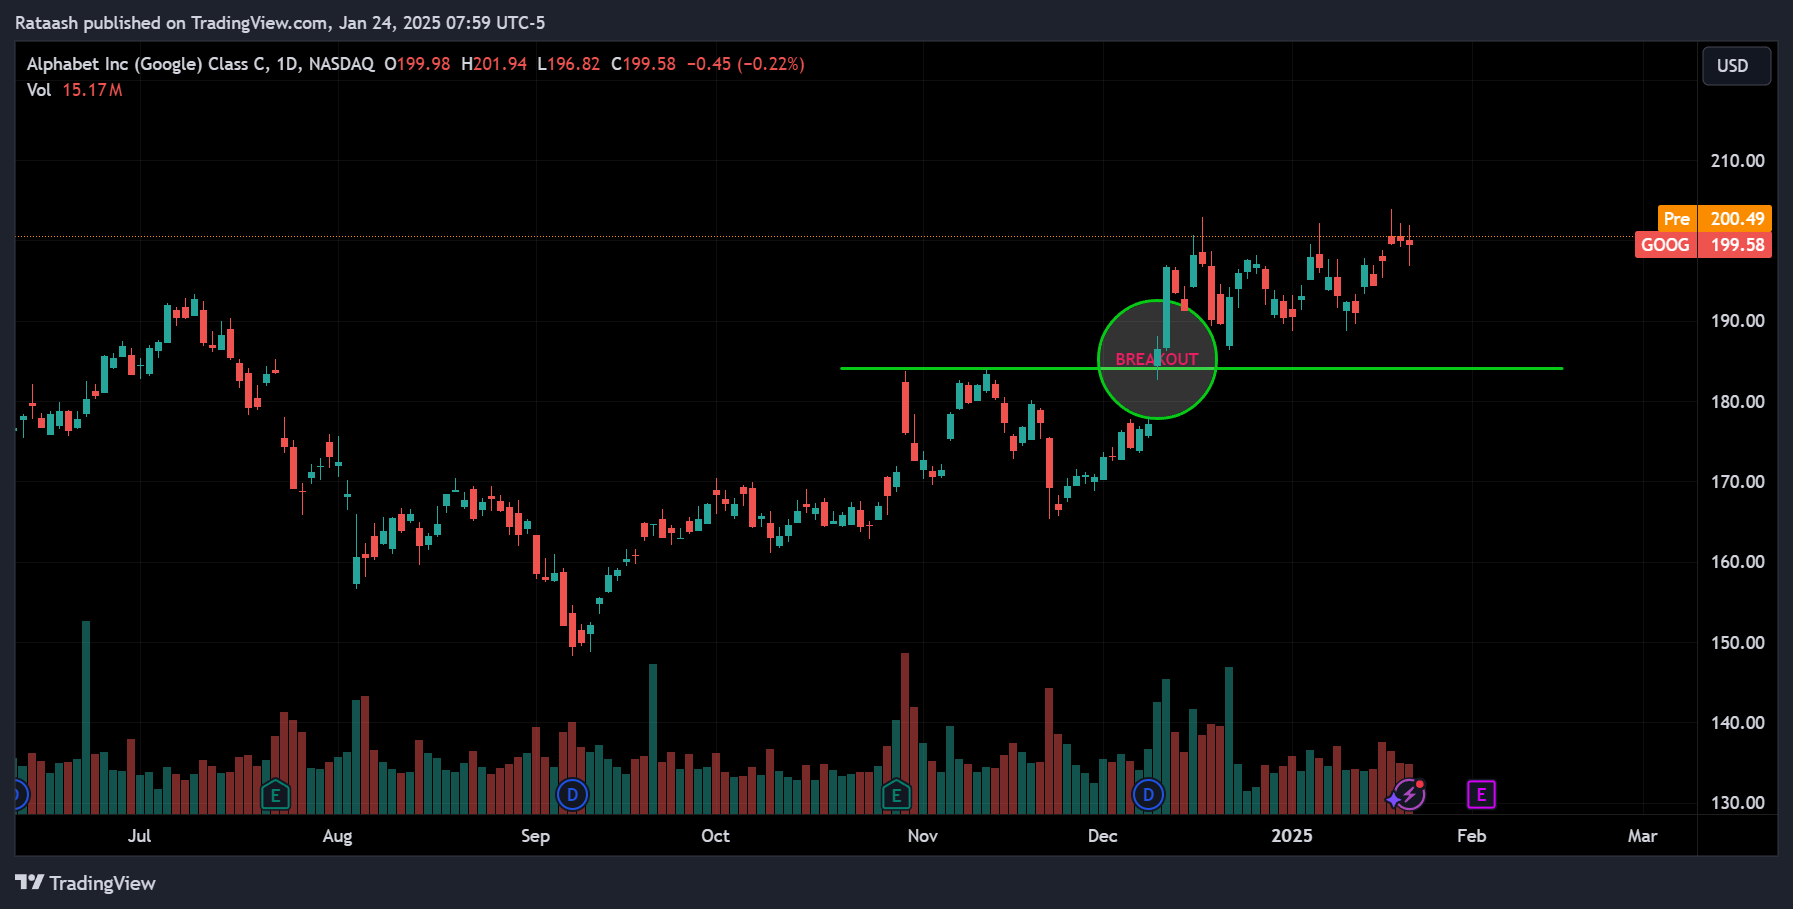
Candlestick charts can offer nuanced insights into intraday price movements. Some candlestick patterns, such as bullish engulfing, morning star, or breakout candles above resistance levels, can strengthen a momentum signal.
- Breakout Candle: A long candlestick pushing through a previous resistance with higher-than-average volume often suggests strong momentum.
- Engulfing Patterns: A bullish engulfing occurs when a green candle fully engulfs the previous red candle’s body, indicating the potential start of upward momentum.
7. Combining Indicators
It’s generally wise to use more than one indicator to confirm your momentum signals. For example, if you see a bullish crossover on the MACD around the same time the price breaks above a key moving average with elevated volume, it adds confluence to your trading decision. Confluence (multiple confirmations) can help filter out false signals and increase the probability of successful trades.
Crafting Your Momentum Trading Strategy

Having covered the basic concepts and key indicators, we can now piece everything together into a coherent momentum trading strategy tailored to beginners. Below is a framework that you can adapt based on your risk tolerance, time availability, and personal preferences.
1. Setting Clear Goals
Define what you want to achieve with your trading:
- Profit Targets: Are you aiming for a certain percentage gain per week or month?
- Drawdown Tolerance: How much are you willing to lose on any single trade or overall portfolio drawdown?
- Time Commitment: Can you monitor the market throughout the day, or do you only have time for end-of-day analysis?
Clarity on these questions will guide your choice of timeframe, position sizing, and overall strategy approach (day trading, swing trading, etc.).
2. Selecting the Right Stocks
Momentum traders typically focus on:
- Stocks with High Relative Volume: Look for stocks trading at least double or triple their average daily volume. This is often where momentum ignites.
- Trending Sectors: If technology stocks are in a strong bullish phase, that sector may provide more momentum opportunities compared to languishing sectors.
- Catalyst-Based Stocks: Earnings reports, mergers, analyst upgrades, or breaking news can spark strong momentum moves.
You can use stock screeners (e.g., Finviz, TradingView’s built-in screener, or your broker’s scanning tool) to filter stocks by volume, price change percentage, and sector performance. This step narrows your watchlist to stocks with the highest potential for momentum-based moves.
3. Identifying Entry Points
Once you’ve shortlisted potential candidates, look for a clear signal to enter a trade:
- Breakout Above Resistance: If a stock breaks above a recent high or a well-defined resistance level with increased volume, it may signal the start of a strong momentum run.
- Indicator Confirmation: Use tools such as RSI, MACD, or Moving Averages to confirm that the stock’s momentum is increasing.
- Price Patterns: Patterns like cup-and-handle, ascending triangles, or a simple pullback to a rising EMA can offer low-risk entry points for momentum continuation.
Example: Let’s say a stock has been forming a base around $50, and historical price action shows resistance around $55. If the stock suddenly breaks above $55, accompanied by a large green candlestick and a volume spike, that can serve as your entry trigger.
4. Setting Stop Loss and Take Profit Levels
Risk management is paramount. The best traders are not necessarily those who pick the most winners, but those who lose the least when trades go against them.
- Stop Loss Placement: Typically placed below a recent swing low, a key moving average, or a support level. If the price dips below this point, it’s a sign the momentum may be fading or reversing.
- Position Sizing: Determine the number of shares to buy based on your risk per trade (e.g., 1% of your account). If your stop loss is set 2% below your entry price, you can adjust your position size to align with your risk tolerance.
- Profit Targets: Set an initial profit target or use a trailing stop strategy to lock in gains as the stock moves in your favor. Some traders scale out of their positions at predetermined milestones (e.g., halfway out at +5% gain, and the rest at +10%).
5. Monitoring and Adjusting Positions
After entering a trade, momentum traders need to remain attentive. Price can move rapidly, and prompt reactions can mean the difference between a large gain or a missed opportunity:
- Watch for Reversals: A sudden drop in volume or bearish candlestick patterns (like shooting stars) could warn of an impending momentum reversal.
- Adjust Stop Loss: If the stock moves strongly in your favor, consider raising your stop loss to lock in profits (a “trailing stop”).
- Assess Overall Market Conditions: If the broader market turns sharply bearish, your bullish momentum trade could falter, even if the stock itself is strong.
6. Risk Management and Emotional Control
Beyond placing stop losses, your ability to control emotions—especially fear and greed—is crucial:
- Avoid Overtrading: Stick to your trading plan and avoid chasing random price spikes.
- Manage Position Size: Never risk more than you can afford to lose. Consistent gains are built over time, and risking too much can lead to large drawdowns.
- Maintain a Trading Journal: Document each trade, including entry and exit points, reasons for taking the trade, and lessons learned. Over time, this record will help refine your strategy and improve discipline.
Step-by-Step Example: Executing a Momentum Trade

Let’s walk through a hypothetical scenario illustrating how you might apply a beginner-friendly momentum strategy from start to finish.
Step 1: Screening for Potential Stocks
Suppose you run a stock screener at the market open to look for stocks with:
- At least 2x average daily volume in the pre-market or first hour of trading.
- Price up by 5% or more compared to the previous close.
- Belonging to a strong sector (e.g., technology or biotech if they are currently in favor).
The screener highlights a stock—XYZ—which is trading at $40, up 6% from yesterday’s close of $37.50. Pre-market volume is already higher than average, and the technology sector has been rallying.
Step 2: Checking the Price and Volume
On a 5-minute or 15-minute chart, you notice:
- Price has consistently made higher lows and higher highs since the market open.
- Volume bars are above the moving average volume line, suggesting strong participation.
This indicates bullish momentum could be underway.
Step 3: Using Indicators
- Moving Averages (MAs): The 20-day EMA is sloping upward, and the stock is trading above the 50-day SMA, reinforcing a bullish trend.
- MACD: The MACD line has recently crossed above the signal line, and both lines are in positive territory.
- RSI: Currently around 65, which is below the 70 overbought level but above 50, suggesting moderate bullish momentum with some room to go higher.
Step 4: Placing a Trade
- Entry Point: You decide to enter at $40.20, slightly above the last consolidation area, to confirm the stock’s upward momentum.
- Stop Loss: You set your stop loss at $38.75, just below a recent pivot low and near the 20-day EMA. If the price falls below this level, it would indicate momentum is failing.
- Position Size: Assuming your maximum risk per trade is $200 and your stop loss is at $1.45 below your entry (40.20 – 38.75), you’d buy approximately 138 shares ($200 / $1.45).
Step 5: Managing the Trade
- Immediate Reaction: After you enter, the price moves to $41.50 within an hour on higher volume. This confirms strong momentum.
- Adjusting Stop Loss: You might move your stop loss up to break-even ($40.20) or a bit higher to lock in partial gains.
- Watching Indicators: Check if volume remains robust and whether the RSI or MACD start signaling any divergences.
Step 6: Exiting the Trade
- Profit Target or Trailing Stop: Let’s say your first profit target is $43.00, a clear resistance level from the daily chart. Once the stock nears $43, you sell half your position, securing partial gains.
- Final Exit: If the stock breaks above $43 with continued volume, you may hold the remaining shares until you see a significant sign of reversal or your trailing stop is triggered.
In this example, XYZ climbs to $45 over the next few days, allowing you to exit the remainder of your position at a higher price. This trade exemplifies a basic momentum strategy—enter on clear bullish signals, manage risk carefully, and exit either at a predetermined target or when the trend shows definitive signs of reversing.
Common Pitfalls and How to Avoid Them
While momentum trading offers exciting opportunities, it comes with pitfalls that can trap unprepared traders. Below are some frequent mistakes and strategies to help you steer clear.
- Overtrading
- Problem: Jumping into multiple trades without a solid setup or trading plan can quickly erode your capital.
- Solution: Be selective. Only trade when your predefined criteria are met.
- Emotional Trading
- Problem: Making impulsive decisions based on fear or greed often leads to chasing breakouts too late or holding losers too long.
- Solution: Develop a strict trading plan with rules for entries, exits, and risk management. Adhere to these rules regardless of market excitement or anxiety.
- Poor Risk Management
- Problem: Failing to place a stop loss or using overly large position sizes can lead to catastrophic losses.
- Solution: Always determine your stop loss and position size before entering a trade. Aim to risk a small percentage of your trading capital on each trade (e.g., 1-2%).
- Lack of Discipline
- Problem: Inconsistency in following your strategy can lead to random results and hamper your ability to learn from mistakes.
- Solution: Keep a trading journal to record every trade’s rationale. Review your performance periodically to identify areas for improvement.
- Not Learning from Mistakes
- Problem: Repeating the same errors—like holding onto a losing trade—will eventually deplete your capital.
- Solution: Conduct post-trade analyses. Identify what went wrong or right, and incorporate insights into your future strategy.
Additional Tips for Consistent Gains
- Combine Fundamentals and Technicals: While momentum trading is largely technical, basic knowledge of a company’s fundamentals can help you avoid low-quality stocks that may abruptly lose momentum.
- Focus on Liquidity: Stocks that trade fewer than a couple hundred thousand shares a day can be riskier due to larger bid-ask spreads and potential slippage. Ensure the stocks you trade have sufficient liquidity.
- Stay Informed: Keep an eye on earnings calendars, economic releases, and market news. A sudden earnings miss or macroeconomic shock can drastically change sentiment and reverse momentum.
- Diversify Across Setups: Avoid putting all your capital into one single trade or a single type of setup. Experiment with different timeframes and stock sectors to reduce correlated risks.
- Use a Paper Trading or Demo Account: If you’re brand new, consider practicing with a paper trading account before risking real money. This lets you test and refine your strategy in real-market conditions without fear of financial loss.
- Maintain Realistic Expectations: Even the best momentum traders don’t capture every major move, and they do experience losses. The goal is to manage risk and maintain consistency, not to aim for a home run on every trade.
Conclusion
Momentum trading can be an excellent strategy for beginners seeking consistent gains in the stock market. By focusing on price action, volume, and trend—and by employing a handful of key technical indicators—you can better identify stocks with strong momentum and time your entries and exits more effectively. The beauty of momentum trading lies in its relatively straightforward framework, making it accessible to novices while still offering plenty of room for skill enhancement as you gain experience.
That said, discipline and risk management are non-negotiable if you want to achieve long-term success. Placing stop losses, sizing positions properly, and learning from each trade—win or lose—are the cornerstones of a sustainable trading career. Remember: momentum trading isn’t about chasing every fast-moving stock; it’s about identifying the right opportunities and managing them with precision.
By combining the concepts and techniques outlined in this article, you’ll be on your way to formulating a momentum strategy that aligns with your financial goals, risk tolerance, and lifestyle. Keep in mind that real mastery takes time, practice, and continuous learning. As you gain familiarity, you can refine your setup, experiment with different technical indicators, and further develop the confidence to trade in various market conditions.
Key Takeaways for Momentum Mastery:
- Understand core principles: price action, volume, trends, and sentiment.
- Use a reliable charting platform and technical indicators like Moving Averages, RSI, and MACD for confirmation.
- Implement a structured approach: scanning for high-volume stocks, waiting for clear breakouts or patterns, and setting precise entry/exit points.
- Rigorously manage risk with proper stop losses and position sizing.
- Maintain discipline and emotional control by sticking to your trading plan and learning from mistakes.
- Seek continuous improvement: keep a trading journal, review trades, and adjust your strategy as you gain experience.
If you follow these guidelines diligently, you will be well on your way to harnessing the power of momentum for consistent gains. Always remember that the market is constantly evolving, and staying adaptable—while maintaining a solid foundation in trading fundamentals—will serve you best in the long run.
Disclaimer: Trading stocks, particularly with leverage, carries inherent risks and may not be suitable for all investors. The examples and strategies discussed in this article are for educational purposes only and should not be construed as financial advice. Always conduct your own research and consult with a licensed financial advisor before making any trading decisions.

