Financial markets are shaped by a wide array of influences economic data, global events, liquidity dynamics, and shifting investor sentiment. Among the many methods traders employ to interpret and act on price behavior, one of the most fundamental distinctions is Momentum vs Mean Reversion. These two approaches represent contrasting beliefs about how prices continue or correct in financial markets.
- Momentum Trading posits that price trends tend to persist, particularly when fueled by strong volume and volatility. If a stock, currency pair, or commodity is moving decisively in one direction, momentum traders expect it to maintain its course until a clear reversal signal appears.
- Mean Reversion Trading, on the other hand, hinges on the concept that markets often overshoot and then snap back to a baseline or average. Traders who favor mean reversion capitalize on these extremes, betting that a steep climb or sharp drop will eventually stabilize and retrace.
In this in-depth article, we will dissect both the Momentum and Mean Reversion perspectives. We’ll explain their guiding principles, present key indicators, delve into entry and exit tactics, discuss risk management essentials, offer practical examples, and explore how automation can integrate these strategies. By the end, you’ll have a comprehensive grasp of how to effectively use either or both strategies in your own trading plan.
Table of Contents
Fundamentals of Trading Strategies

Before diving into the specifics of Momentum and Mean Reversion, it helps to frame the discussion with the basics of what makes a trading strategy. A trading strategy, at its core, consists of:
- Market Assumptions: The underlying belief or perspective about how prices behave. Momentum traders believe prices that are rising will continue to rise. Mean reversion traders believe that prices which deviate from the average will revert.
- Entry Conditions: Clear rules or signals used to identify when to enter a position (i.e., buy or sell short). These can be based on technical indicators, chart patterns, fundamentals, or a combination of factors.
- Exit Conditions: Specific rules for leaving a trade (taking profit or cutting losses). A strategy that does not properly define exit conditions can face significant risk.
- Risk Management: Methods to control potential losses. This often includes setting stop-loss levels, position sizing, and employing other tactics to protect capital.
- Time Frame: Some strategies focus on short-term (e.g., intraday) price movements, while others look at weekly or monthly trends. The concept of momentum or mean reversion can be applied across different time frames.
- Market Selection: Determining which markets or instruments to trade (e.g., stocks, forex, commodities, cryptocurrencies) is critical, as certain strategies work better in specific types of assets.
- Psychological Discipline: Even the best strategies fail if the trader cannot maintain discipline under stress or is prone to emotional decision-making. Managing fear and greed is essential.
Understanding these fundamentals sets the stage for how Momentum and Mean Reversion trading strategies form part of a broader market approach. Each strategy has its own way of implementing these fundamental elements.
Momentum Trading
Definition of Momentum Trading
Momentum trading is a strategy that capitalizes on the continuance of existing trends. In essence, momentum traders look for assets showing a strong movement—either upwards or downwards—and they aim to ride that trend until it shows signs of reversal or exhaustion.
Key tenets of momentum trading:
- Trend Following: Momentum traders do not try to predict if a trend will begin; they wait for a trend to establish itself, then jump in to capture the “middle portion” of the move.
- Volatility-Friendly: Momentum strategies often look for volatile markets or stocks where big swings in price can generate significant profit in a short span.
- Volume Confirmation: Momentum traders often check if volume is confirming the price move. A rising volume indicates solid institutional or retail participation, suggesting the trend is strong.
Momentum trading is common in markets that have significant liquidity and volatility—such as stocks, futures, and certain currency pairs—because you need strong price movement and enough volume to enter and exit positions efficiently.
Key Principles of Momentum Trading
- Trend Continuation: The underlying assumption is that a security that is moving strongly in one direction will keep moving in that direction until a certain catalyst halts it.
- Higher Highs and Higher Lows: In an uptrend, momentum traders want to see the price making successively higher highs and higher lows. In a downtrend, the pattern reverses (lower highs and lower lows).
- Confirmation Indicators: Momentum traders often look for confirmation signals—such as increasing volume or momentum oscillators (e.g., RSI, MACD)—to validate the strength of the trend.
- Stop-Loss Management: Because momentum can reverse quickly—especially if news or sentiment shifts—momentum traders tend to use tight stop-loss orders to protect accumulated gains.
- Short Holding Periods: While you can find momentum on larger time frames, many momentum traders prefer shorter time frames (e.g., intraday or swing trading) to exploit quick bursts of price activity.
Identifying Momentum Opportunities
Identifying potential momentum trades involves looking for a burst in price accompanied by certain market conditions. Here are some of the hallmark signals for spotting momentum:
- Breaking News: Positive (or negative) fundamental news can trigger a surge in demand (or supply), propelling a stock or currency pair. For example, a tech company that releases earnings far above expectations often sees a sharp price rally.
- Technical Breakouts: A clean breakout above a resistance level or below a support level with strong volume often signals a new wave of momentum in the direction of the breakout.
- High-Volume Surges: Volume spikes that coincide with strong price movement can be a big clue that a new trend is forming or an existing trend is strengthening.
- Relative Strength Comparisons: Traders sometimes compare a stock’s performance to its sector or the overall market. A stock that is outperforming the market over a sustained period may be demonstrating momentum.
- Crossovers on Technical Indicators: Some momentum traders look for crossovers of moving averages (e.g., the shorter-term 50-day moving average crossing above the longer-term 200-day moving average) as a signal of emerging trend strength.
Common Tools and Indicators for Momentum Trading
Momentum traders use a variety of technical tools to identify, enter, and exit trades:
- Moving Averages (MA):
- Simple Moving Average (SMA) or Exponential Moving Average (EMA) can act as dynamic support or resistance in a trending market.
- The slope of a moving average can also indicate momentum; a steep upward slope signals a strong uptrend.
- Moving Average Convergence Divergence (MACD):
- Measures the difference between two moving averages.
- Crosses above the signal line can indicate bullish momentum, while crosses below the signal line indicate bearish momentum.
- Relative Strength Index (RSI):
- Although typically used to detect overbought or oversold conditions, an RSI trending strongly above 50 can signal continued bullish momentum.
- Conversely, a strong move below 50 may indicate bearish momentum.
- Bollinger Bands:
- In a strong uptrend, price may “ride the upper band,” reflecting sustained momentum.
- However, Bollinger Bands are also used for mean reversion strategies. Momentum traders might use them to see if a breakout of the bands aligns with increased volatility.
- Average Directional Index (ADX):
- Helps measure the strength of a trend. A high ADX value (> 25 or 30) generally indicates a strong trend, which momentum traders can exploit.
- Volume Indicators (e.g., OBV – On Balance Volume):
- Rising OBV (On Balance Volume) along with price is often seen as a sign that the trend is backed by strong participation.
Entry and Exit Strategies
Momentum traders require specific rules to decide when to buy and when to sell. Some common entry/exit tactics include:
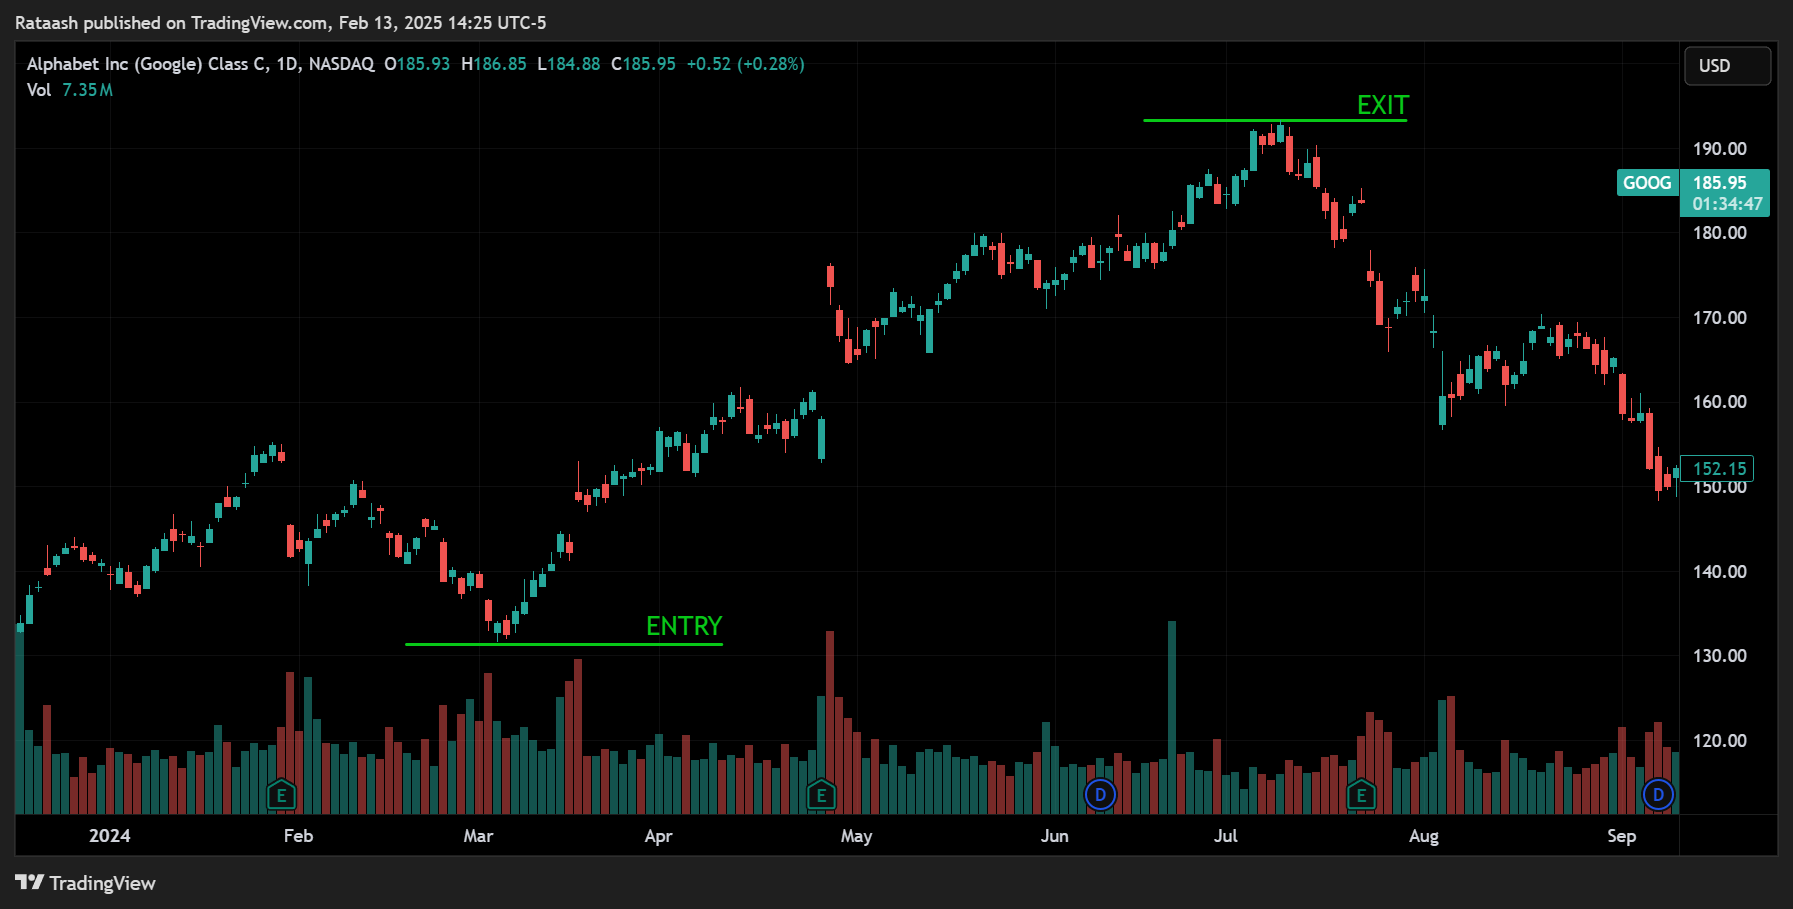
- Breakout Entry: Waiting for the price to break a key resistance level (in an uptrend) or support level (in a downtrend). A confirmed breakout with higher-than-average volume is often a green light to enter.
- Pullback Entry: Entering on a pullback to a shorter-term moving average (e.g., the 20-day or 50-day MA) in a well-established uptrend can offer a better risk/reward ratio.
- Trailing Stop Loss: Many momentum traders use a trailing stop loss—often placed below higher lows in an uptrend—to lock in gains as the price moves in their favor.
- Profit Targets and Scaling Out: Some traders set profit targets at key resistance levels or use technical indicators to determine when the trend may be losing steam, scaling out of the position in increments.
Example of Momentum Trading in Action
Scenario: A trader tracks a technology stock (XYZ Corp) that has been consolidating for a few weeks near a resistance zone at $100. Suddenly, the company releases groundbreaking news about a new partnership, and the stock price surges to $105 on much higher volume than usual.
- Identification: The trader sees this as a breakout above the $100 resistance with strong volume, suggesting new bullish momentum.
- Confirmation: Technical indicators like MACD cross bullishly, and the ADX rises above 25, signaling a strong trend could be forming.
- Entry: The trader waits for a brief pullback toward $103 (just to confirm the breakout is valid) and initiates a long position.
- Risk Management: The trader sets a stop loss slightly below the breakout level, say around $98, to limit downside risk if the stock falls back into its old range.
- Exit: If the momentum continues, the trader might trail the stop loss each time the stock forms a new short-term support, allowing the trade to run. If the trend weakens (e.g., MACD crosses below the signal line or volume tapers off significantly), the trader might exit the position.
In this example, the trader capitalizes on a strong upward move fueled by positive news and validated by volume and technical indicators. This is the essence of momentum trading—capturing the wave while it’s strong and exiting at the first signs of reversal.
Advantages and Disadvantages of Momentum Trading
Advantages
- Potential for Quick Profits: Momentum strategies thrive in volatile markets, enabling traders to make significant gains if they time entries and exits correctly.
- Clear Entry Signals: Breakouts and technical indicators often provide straightforward signals, reducing ambiguity in decision-making.
- Adaptable to Different Time Frames: You can implement momentum strategies on intraday, daily, or weekly charts.
- Can Capitalize on Big News: Fundamental catalysts, such as earnings reports, can lead to strong momentum moves quickly.
Disadvantages
- High Risk of Reversal: Momentum can vanish if underlying fundamentals or market sentiment suddenly shifts.
- Requires Active Monitoring: Traders must keep a close eye on positions; momentum can dissipate quickly.
- Whipsaw Moves: False breakouts or sudden reversals can occur, leading to rapid losses if stops are not in place.
- Emotional Stress: Riding a fast-moving trend can be stressful, especially when it experiences volatile pullbacks.
Mean Reversion Trading
Definition of Mean Reversion Trading
Mean Reversion Trading is based on the principle that asset prices and historical returns eventually move back towards their long-term average or mean. In other words, when price action deviates significantly from its average, mean reversion traders expect it to snap back to more “normal” levels.
The concept of mean reversion has its foundations in both statistical and behavioral finance. Statistically, extreme price movements (very high or very low) are less likely to continue trending in that extreme direction indefinitely. Behaviorally, traders may overreact to news, driving prices away from fair value, only for the market to correct itself once rational thinking returns.
Key Principles of Mean Reversion Trading
- Overbought and Oversold Conditions: Prices that go too high, too quickly are considered overbought, while prices that plunge rapidly may be oversold. Mean reversion traders seek to exploit these extremes by betting on a reversal.
- Reversion to the Mean: The “mean” can be a simple moving average, an equilibrium price, or a historical price range. The idea is that price eventually returns to this mean value.
- Contrarian Approach: Mean reversion traders are often contrarian, going against the prevailing market sentiment. They buy when others are selling aggressively and sell (or short) when others are buying exuberantly.
- Patience is Key: Waiting for the perfect overextended condition can require patience, as trending markets can stay in an overbought or oversold condition longer than one might expect.
- Tight Risk Control: Because mean reversion trading involves going against a strong trend, it’s crucial to use stop-loss orders or other risk-control measures in case the trend persists longer than anticipated.
Identifying Mean Reversion Opportunities
To find potential mean reversion trades, one typically looks for signs that a security is trading outside its normal range or “fair value.” Some typical scenarios include:
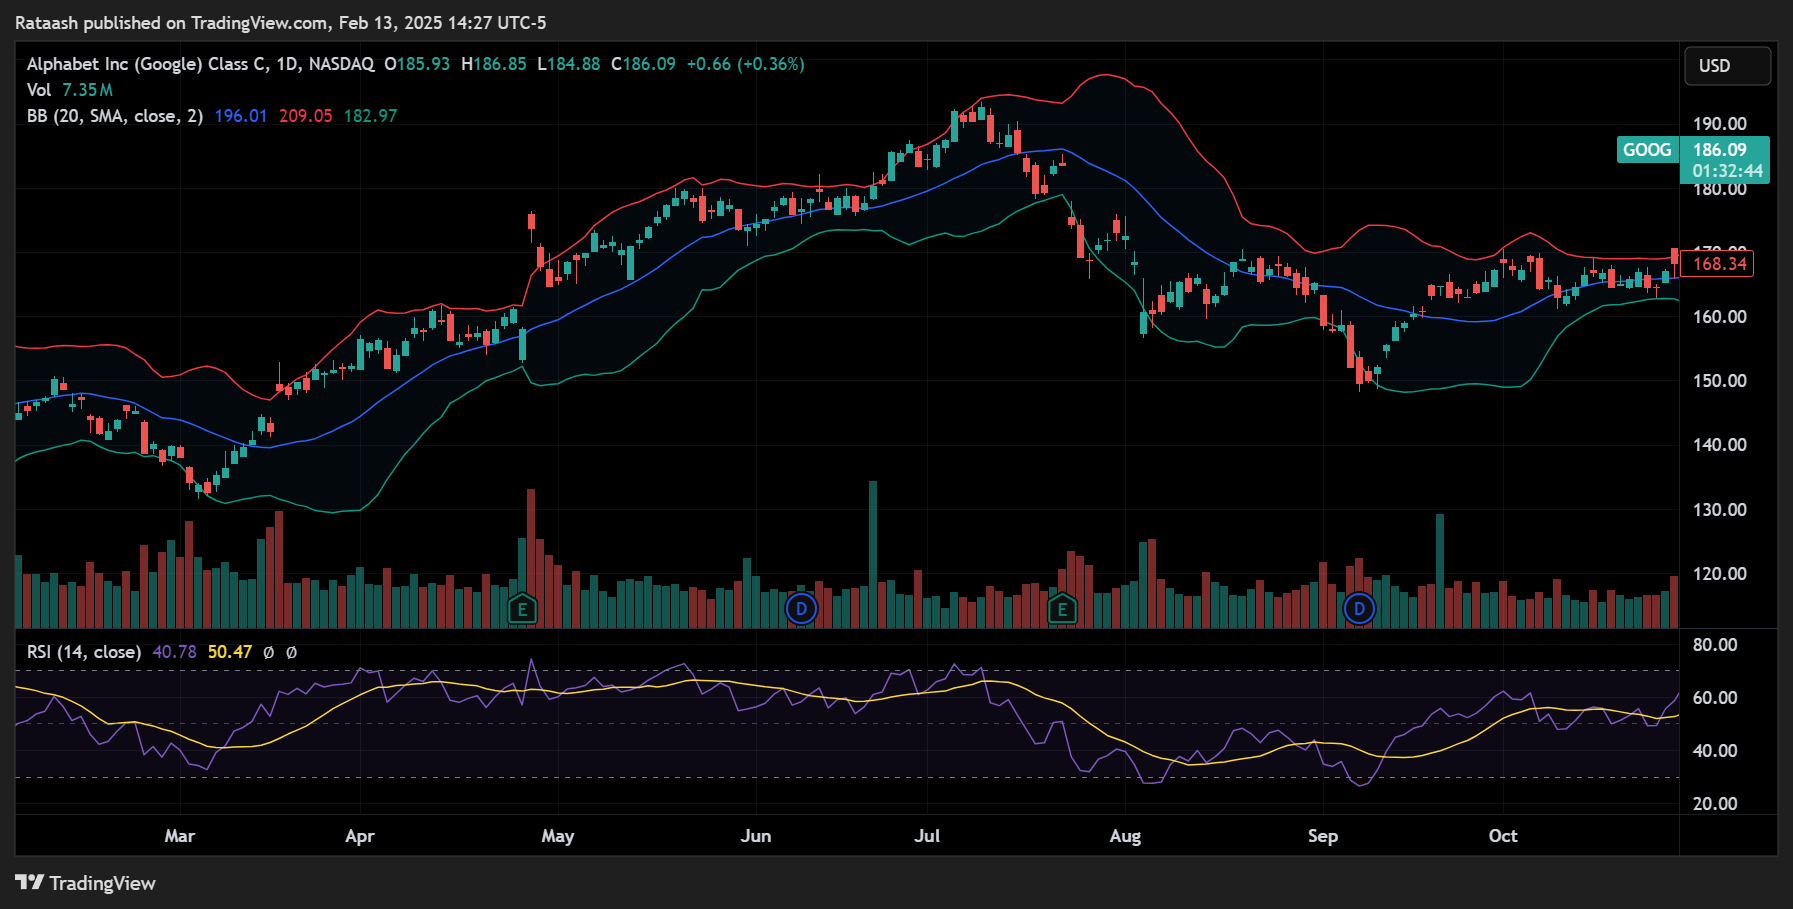
- Extreme RSI Values: An RSI above 70 often indicates overbought conditions, while below 30 indicates oversold conditions (though some traders use 80/20 or even 90/10 for more extreme readings).
- Bollinger Band “Reversions”: Prices extending beyond the upper or lower Bollinger Band suggest a possible reversion back to the middle band (the 20-day moving average, typically).
- Price Channels: Traders might use channels (e.g., Donchian channels or Keltner channels) and look for price to revert to the center of the channel after an extreme move.
- Moving Average Deviations: If a stock’s price strays too far from its longer-term moving average (e.g., 50-day or 200-day MA), mean reversion traders will anticipate a pullback or bounce toward the average.
- Volume Spikes and Exhaustion: A sudden spike in volume after a large price move may indicate a capitulation or exhaustion, after which prices may normalize.
Common Tools and Indicators for Mean Reversion Trading
- Relative Strength Index (RSI):
- RSI is a very popular indicator for mean reversion. Traders often look for RSI values in overbought (above 70 or 80) or oversold (below 30 or 20) territories, then wait for a crossover back into the middle range to confirm a potential reversal.
- Stochastic Oscillator:
- Measures the momentum of price. Readings above 80 often indicate overbought conditions, while readings below 20 can indicate oversold conditions.
- Bollinger Bands:
- When price closes outside the upper or lower band, it can signal a reversion trade, especially if confirmed by other indicators like volume or oscillator divergences.
- Commodity Channel Index (CCI):
- CCI readings above +100 indicate overbought conditions, while readings below -100 indicate oversold conditions. Traders look for the price to move back toward zero on the CCI line.
- MACD Divergences:
- Mean reversion traders watch for divergences between price and the MACD histogram or MACD lines, indicating the trend’s momentum may be weakening and a reversal is possible.
Entry and Exit Strategies
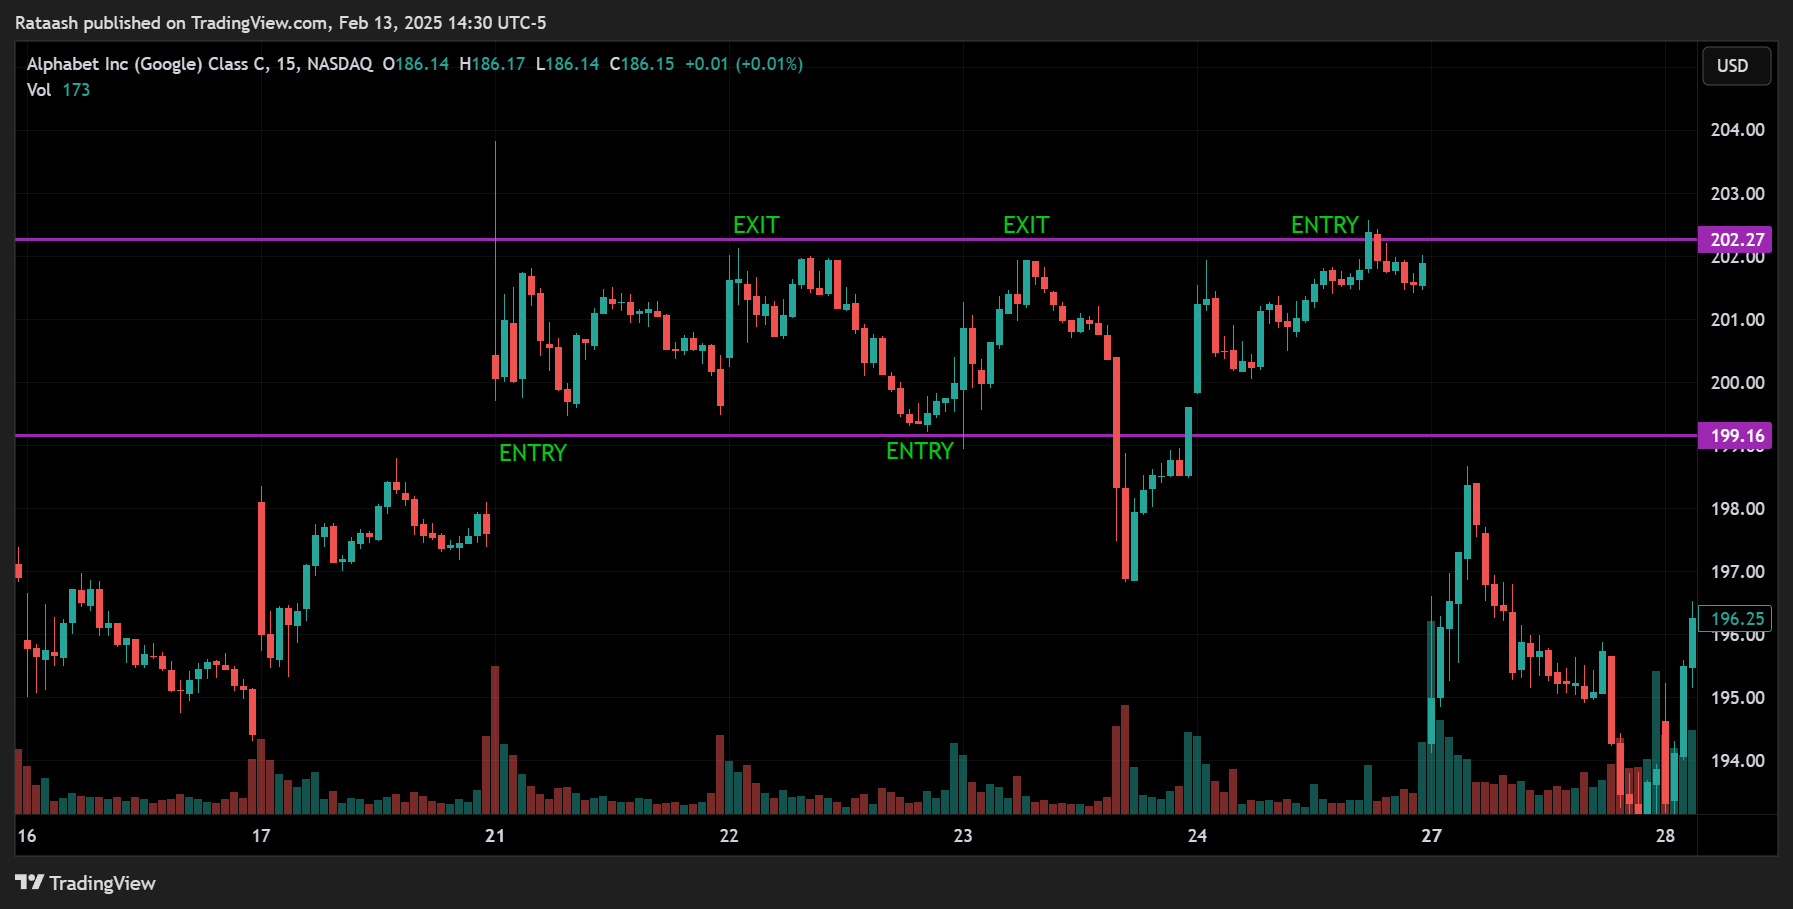
Mean reversion traders plan their entries around clear signs of “extreme” price behavior:
- Overbought Entry (for Short Positions):
- Wait for an RSI reading above 70 or 80 (or Stochastic above 80).
- Check if price is near or above the upper Bollinger Band or a similar boundary.
- Look for confirming signals (e.g., declining volume on continued price ascent) suggesting a lack of sustaining power.
- Initiate a short position when price begins to turn down or breaks a minor support level.
- Oversold Entry (for Long Positions):
- Wait for RSI below 30 or 20 (or Stochastic below 20).
- Check if price is near or below the lower Bollinger Band.
- Look for a bullish candlestick pattern (e.g., hammer or engulfing) combined with a volume spike that might indicate capitulation.
- Initiate a long position when price begins to bounce, ideally breaking a short-term resistance level.
- Exits:
- The typical profit target is the mean or average, such as the center Bollinger Band or a moving average.
- Alternatively, some traders wait for oscillators (RSI, Stochastic) to return to neutral territory (e.g., RSI around 50).
- Stop-Losses:
- Placed beyond the extreme that triggered the mean reversion trade. For example, if you shorted at the upper Bollinger Band, you might place your stop just above the recent swing high.
Example of Mean Reversion Trading in Action
Scenario: Consider the same tech stock (XYZ Corp). After a series of positive announcements, the stock rallies from $80 to $120 in a short period. The RSI climbs to 85, and the price repeatedly closes above the upper Bollinger Band for several consecutive days.
- Identification: A mean reversion trader notes that the stock seems overbought by technical standards and might be due for a pullback.
- Confirmation: The RSI is above 80, the stock has had multiple closes above the upper Bollinger Band, and volume has started to decline on subsequent up days, suggesting momentum might be fading.
- Entry: The trader waits for a bearish candlestick pattern (e.g., a shooting star or bearish engulfing candle) at $122. They initiate a short position at $120 once they see follow-through selling pressure.
- Stop-Loss: Placed just above the swing high at $125 in case the price continues upward and invalidates the overbought premise.
- Exit: The trader targets the 20-day moving average around $105 for profit. They may exit entirely when price approaches $105, or they might begin to scale out as price approaches the target.
This scenario illustrates how a mean reversion strategy aims to profit from the “snap back” toward more normalized price levels after an extreme move.
Advantages and Disadvantages of Mean Reversion Trading
Advantages
- High Win Rates: In many markets, especially ranging or sideways markets, mean reversion trades can be highly accurate because small oscillations around the average happen frequently.
- Predictable Targets: The “mean” often serves as a defined profit target, simplifying decision-making.
- Contrarian Edge: Going against the crowd can be profitable when most of the market chases extreme moves, but those moves eventually reverse.
- Less Reliance on Big Trends: Traders can profit from small reversions in less volatile markets.
Disadvantages
- Uncertain Timing: Asset prices can stay overbought or oversold for a long time, making it tricky to time entries correctly.
- Risk of Big Losses: If an asset is in a strong trend, mean reversion trades can accumulate losses as the trend continues to stretch.
- Requires Strict Discipline: A contrarian approach can be psychologically challenging, because you are trading against the prevailing momentum.
- False Signals: Indicators like RSI or Bollinger Bands can generate multiple signals in volatile markets, leading to whipsaws.
Contrasting Momentum and Mean Reversion

Momentum and Mean Reversion stand at opposite ends of the trading spectrum:
- Market Philosophy
- Momentum: “The trend is your friend.”
- Mean Reversion: “Prices revert to their average over time.”
- Entry Timing
- Momentum: Enters with the direction of recent price movement.
- Mean Reversion: Enters against the recent price movement, anticipating a reversal.
- Holding Period
- Momentum: Often shorter holding periods (especially for intraday or swing traders), but some momentum trends can last for weeks or months.
- Mean Reversion: Often shorter-term trades focusing on a snap back to a mean or middle range.
- Preferred Market Conditions
- Momentum: Thrives in trending markets with good volume and volatility.
- Mean Reversion: Thrives in choppy, range-bound markets or markets that exhibit frequent overbought/oversold conditions.
- Trade Frequency
- Momentum: Can be frequent if markets have many breakout opportunities, but each opportunity is typically more selective due to the need for strong volume and trend confirmation.
- Mean Reversion: Potentially more frequent trades, especially if markets oscillate around a mean regularly.
- Risk Profiles
- Momentum: Risk lies in sudden trend reversals or false breakouts. Traders often use trailing stops.
- Mean Reversion: Risk lies in an extended trend that shows no sign of reversing soon. Traders must have strict stop-loss rules.
Traders often choose a strategy that aligns with their personal risk tolerance, trading style, time availability, and market preferences. There is no universal “best” approach; it depends on the conditions and the trader’s skill in executing the strategy.
Risk Management in Momentum and Mean Reversion

No trading strategy is complete without robust risk management. Both momentum and mean reversion traders must manage their risk meticulously, but they do so under different assumptions:
- Position Sizing
- Momentum traders might risk a small percentage of their capital on each trade (e.g., 1-2%). If the trend is strong, they can add to winning positions (“pyramiding”) cautiously.
- Mean reversion traders also risk a small portion of capital per trade but might scale into positions as the price moves further from the mean, provided they have a clear maximum risk limit.
- Stop-Loss Placement
- Momentum: Stop-losses typically sit below the most recent swing low (in an uptrend) or swing high (in a downtrend), or below a key support level.
- Mean Reversion: Stop-losses are placed beyond the extreme that signaled the trade, ensuring if the trend continues, losses are contained.
- Trade Management
- Momentum: Uses trailing stops to lock in gains as the trade moves in favor. In trending environments, this can significantly reduce drawdowns.
- Mean Reversion: May use a limit order to exit near the mean or rely on a bounce to a specific moving average. Some might trail stops as the price moves closer to the mean.
- Volatility Considerations
- Momentum: High volatility can be beneficial but also risky if the market experiences whipsaws.
- Mean Reversion: In extreme volatility, prices can overshoot even further, increasing both the potential reward (more significant move back to the mean) and the risk (larger drawdowns before reversion).
- Hedging Techniques
- Both strategies can employ hedging, such as trading negatively correlated assets or using options to offset risk. For instance, a mean reversion trader who thinks a stock is overbought might also purchase a call option to limit upside risk if the stock continues rising.
Effective risk management is the cornerstone of consistent profitability. Even the most accurate strategy can face ruin if risk is not managed properly.
Trading Psychology and Discipline

Both momentum and mean reversion strategies require a disciplined, psychologically robust approach:
- Patience:
- Momentum traders need patience to wait for the right breakout. Jumping into every minor price move can lead to losses.
- Mean reversion traders must wait for truly extreme conditions; “forcing” a reversal in a trending market can be disastrous.
- Emotional Control:
- Momentum: Fear of missing out (FOMO) can push traders to chase price moves that are already extended. Fear of a pullback might also make traders exit too soon, missing the biggest portion of the move.
- Mean Reversion: The contrarian nature can be psychologically challenging. It’s hard to buy when the market is in freefall or short when the market is euphoric. Managing emotions is critical.
- Confidence in Your Strategy:
- Both approaches require confidence in the underlying logic. If you constantly second-guess your signals, you’ll likely exit trades prematurely or avoid entering potentially profitable setups.
- Avoiding Overtrading:
- Overtrading is a common pitfall that stems from trying to force trades where no valid setup exists. Following your trading plan and sticking to the signals helps mitigate this risk.
- Continuous Learning:
- Market conditions evolve. A strategy that worked in one environment might falter in another. Traders should review trades, adapt to new information, and refine their approaches over time.
Trading psychology is at least as important as technical or fundamental analysis. Emotions like greed, fear, hope, and regret can sabotage even the best trading strategy.
Algorithmic and Automated Approaches

With advancements in technology, many traders have turned to algorithmic (algo) trading or automated systems to execute either momentum or mean reversion strategies sometimes even combining both. Here’s how:
- Rule-Based Systems
- Traders can program entry and exit rules derived from momentum or mean reversion signals into their trading platforms. This removes emotional bias from trade execution.
- High-Frequency Trading (HFT)
- HFT firms often exploit ultra-short-term momentum or mean reversion patterns, relying on speed, co-location servers, and advanced order routing strategies.
- Quantitative Analysis
- Quants use statistical methods (e.g., pairs trading, regression analysis, machine learning) to identify mean reversion or momentum at scale across large baskets of instruments.
- Backtesting and Optimization
- Algorithmic traders backtest their ideas using historical data to see how a strategy (momentum or mean reversion) would have performed. They then optimize the parameters (like RSI thresholds, moving average lengths) to maximize risk-adjusted returns.
- Machine Learning Techniques
- Some advanced algos use neural networks or reinforcement learning to detect patterns of momentum or reversion. However, these systems require extensive data and careful feature engineering.
While algorithmic trading can remove the human error component, it introduces complexities like technological risk, overfitting in backtests, and the need for stable market data feeds.
Practical Real-World Use Cases
1. Stocks and Equities
- Momentum Example: Growth stocks like Tesla or small-cap biotech companies can show explosive moves on breakthrough announcements or earnings. Momentum traders often target these “hot” stocks for quick gains.
- Mean Reversion Example: Blue-chip stocks might get oversold on negative news and revert up once panic subsides. Mean reversion traders watch for RSI below 30, then buy for a bounce.
2. Forex (Currency) Markets
- Momentum Example: When a central bank shifts to a more hawkish monetary policy, a currency can show sustained momentum upward. Traders might use breakouts and moving average crossovers to ride the wave.
- Mean Reversion Example: Currency pairs often trade within established ranges. If EUR/USD spikes due to sudden news, mean reversion traders may fade the move expecting a return to the mean once the initial excitement dissipates.
3. Commodity Futures
- Momentum Example: Crude oil can experience strong momentum driven by geopolitical tensions or supply-demand imbalances. A breakout from a consolidating range can become a powerful uptrend or downtrend.
- Mean Reversion Example: If gold experiences a panic sell-off due to market sentiment shifts, a mean reversion trader might anticipate a rebound once investors return to gold as a safe haven.
4. Cryptocurrency
- Momentum Example: Cryptocurrencies like Bitcoin and Ethereum often have rapid price surges. Momentum traders can look for volume spikes, trend lines, and breakouts to ride major bull runs.
- Mean Reversion Example: Crypto is extremely volatile, so it often overshoots. Mean reversion traders might short after a parabolic run-up, betting on a subsequent correction, or buy dips in oversold conditions.
In practice, many traders specialize in either momentum or mean reversion for a specific asset class. Mastering one approach in a particular market can be more profitable than applying a broad but shallow approach to multiple markets.
Combining Momentum and Mean Reversion
Although momentum and mean reversion are often viewed as polar opposites, some traders successfully combine elements of both, depending on market conditions:
- Contextual Strategy:
- If the broader trend is strong, a trader might use momentum tactics to ride it. But within that trend, they might employ mean reversion entries for pullbacks.
- Multiple Time Frame Analysis:
- For instance, on a higher time frame (daily or weekly), the market may show a distinct uptrend (favoring momentum). But on a lower time frame (intraday), the price might oscillate (favoring mean reversion). Traders might combine both perspectives.
- Trigger-Based Switching:
- Some algorithmic strategies monitor market volatility. If volatility is high and the market is trending, they activate momentum rules. If volatility drops or price forms a range, they switch to mean reversion rules.
- Partial Exit Strategies:
- A trader could enter a position on a momentum breakout, then exit half the position at a quick profit target (mean reversion approach) and let the rest run with a trailing stop (momentum approach).
Combining the two styles can help traders adapt to changing market phases. However, it also adds complexity and requires a deep understanding of both strategies.
Conclusion
In financial markets, Momentum Trading and Mean Reversion Trading represent two fundamentally different approaches to profiting from price movements. They are both rooted in time-tested principles—either continuation of a trend (momentum) or reversion to a mean (contrarian). Each strategy has its own set of indicators, entry and exit rules, risk management protocols, and psychological demands.
- Momentum Trading
- Key Points: Follows strong trends, uses breakout signals and volume confirmations, benefits from volatility, requires tight stop-losses to protect gains.
- Best in: Trending or highly volatile markets.
- Mean Reversion Trading
- Key Points: Trades against overbought/oversold conditions, relies on oscillators and price extremes, aims to catch reversals to the average, needs disciplined stop-loss placement.
- Best in: Range-bound or oscillating markets.
Selecting the Right Strategy:
- Your choice depends on market conditions, time horizon, risk tolerance, and personal preference.
- Understanding how to correctly implement risk management, maintain emotional discipline, and adapt to changing market dynamics is crucial for success with either (or both) strategies.
Adapting Over Time:
- Markets go through cycles—sometimes trending, sometimes ranging. Astute traders learn to recognize these conditions and select or combine strategies accordingly.
- Automated or algorithmic trading can further refine these approaches, but human oversight remains vital to manage the unpredictable nature of financial markets.
Regardless of whether you choose momentum or mean reversion, consistency comes from diligent planning, backtesting, and disciplined execution. Experiment with both, backtest your ideas, and see which approach resonates with your trading goals and personality. In the end, successful trading is about finding a strategy you can execute reliably over the long run—and continuously refining it to stay ahead in the ever-evolving financial landscape.
Final Thoughts
Whether you are a new or experienced trader, the interplay of momentum and mean reversion shapes much of the price action observed in markets. By mastering these two pillars:
- You gain a deeper understanding of why prices move and how to position yourself to capitalize on these movements.
- You discover tools and indicators that can improve your timing and confidence.
- You learn the discipline required to protect your capital and let profitable trades run.
Approach each strategy with an open mind, apply risk management rigorously, and you will be well on your way to developing a robust, adaptable trading edge.
Recommended Next Steps and Resources:
- Paper Trading: Test momentum and mean reversion strategies in a simulated trading environment to gain experience without risking real money.
- Technical Analysis Books: Deepen your knowledge of chart patterns, indicators, and trend analysis.
- Online Courses and Webinars: Many professional traders share their approaches to momentum and mean reversion. Attend workshops or webinars to gain fresh insights.
- Community and Mentorship: Engage with trading communities or find a mentor who can provide feedback on your strategy execution and mindset.
- Keep a Trading Journal: Document every trade (setup, rationale, outcome) to refine your strategy over time.
By systematically learning, practicing, and refining your momentum or mean reversion strategies, you can build a skill set capable of adapting to a variety of market conditions, ultimately improving your probability of long-term trading success.