The Moving Average Stock Trading Strategy is one of the most widely used and effective techniques for identifying trends and optimizing trade entries and exits. Moving averages, whether the Simple Moving Average (SMA) or the Exponential Moving Average (EMA), help traders and investors smooth out price fluctuations, making it easier to recognize market trends while filtering out short-term noise.
In this in-depth guide, we will break down the core principles of moving averages, compare SMA and EMA, and show you how to leverage them to build a profitable trading strategy. You will learn how to:
- Interpret moving averages across different time horizons—short-term, medium-term, and long-term.
- Use crossover signals to pinpoint high-probability entry and exit points.
- Combine moving averages with other technical indicators to enhance accuracy.
- Implement risk management techniques to protect your trading capital.
By the end of this article, you will have a solid grasp of Moving Average Stock Trading Strategy and how to integrate it into your trading routine. Whether you are a beginner or an experienced trader, these insights will help you make well-informed trading decisions using SMA and EMA.
Table of Contents
What Are Moving Averages?
A moving average (MA) is a calculation used to analyze data points by creating a series of averages of different subsets of a complete data set. In trading, we typically use a security’s price (such as a stock’s closing price) over a specified number of periods (days, weeks, months, etc.). Essentially, moving averages “smooth out” price fluctuations, enabling traders to:
- Detect emerging trends more easily.
- Identify support and resistance levels.
- Generate entry and exit signals when different moving averages cross.
- Filter out short-term market noise to focus on the broader price direction.
There are various types of moving averages, but the two most common—and the focus of this article—are the Simple Moving Average (SMA) and the Exponential Moving Average (EMA).
1. Simple Moving Average (SMA)
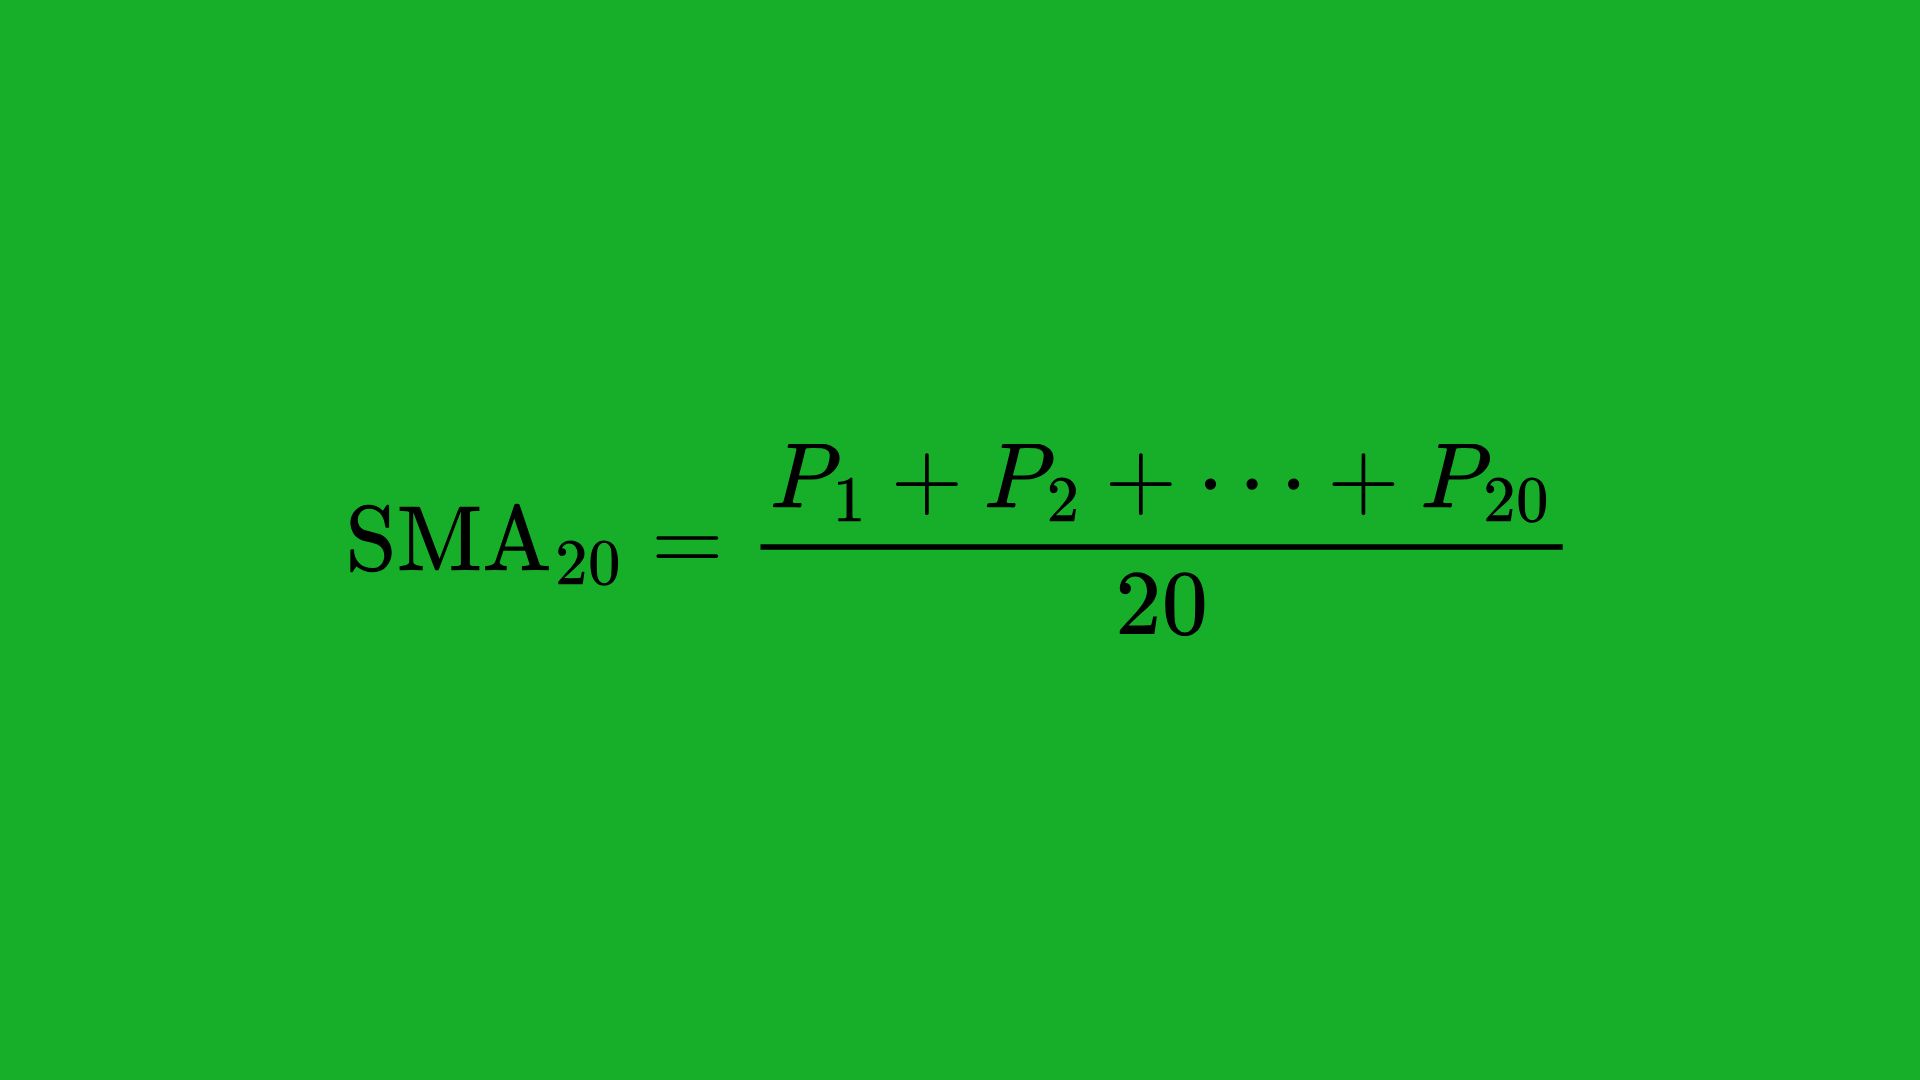
A Simple Moving Average takes the arithmetic mean of a given set of prices over a specific number of periods. For instance, a 20-day SMA adds the closing prices of the last 20 trading days and divides by 20.
If you have closing prices for 20 days (P1, P2, …, P20), the 20-day SMA is:
Characteristics
- Easy to calculate and simple to understand.
- Gives equal weight to each period in the calculation.
- Slower to react to sudden price changes compared to more advanced moving averages, because “older” prices in the data set carry the same weight as more recent prices.
Common Applications
- Trend Identification: Traders commonly plot a 50-day SMA or 200-day SMA on a stock chart to identify medium- or long-term price trends.
- Support and Resistance: A SMA can act as a dynamic support or resistance. For example, a stock might repeatedly bounce off its 50-day SMA when in an uptrend.
- Crossovers: When a shorter-period SMA crosses above a longer-period SMA, it can signal a bullish shift. Conversely, the opposite cross can signal a bearish shift.
2. Exponential Moving Average (EMA)
An Exponential Moving Average (EMA) is a variation of the simple moving average that gives more weight to recent price data. This helps the EMA respond more quickly to new price changes than the SMA. The EMA is calculated by applying a multiplier to the most recent price, and so on, diminishing the weight as you move further back in time.
The formula for the multiplier for the EMA over N periods is:
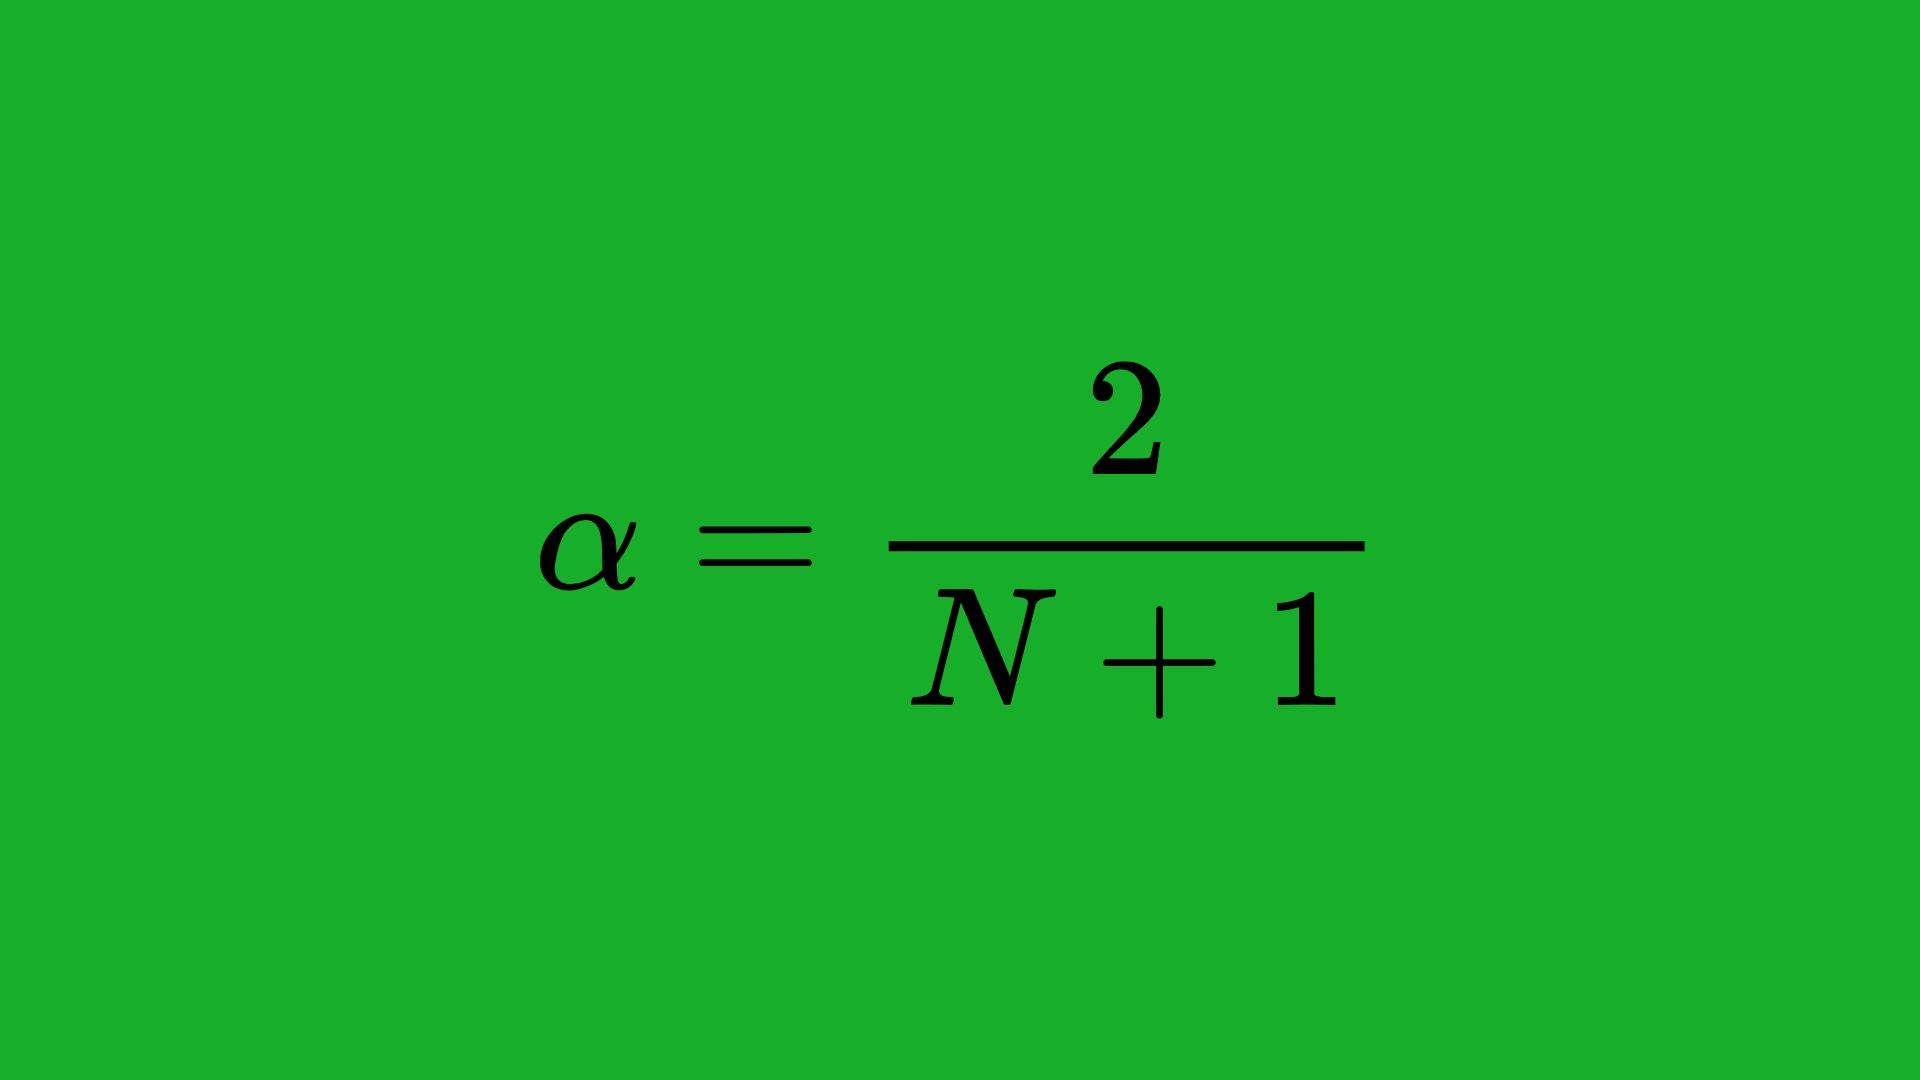
So each day’s EMA is:
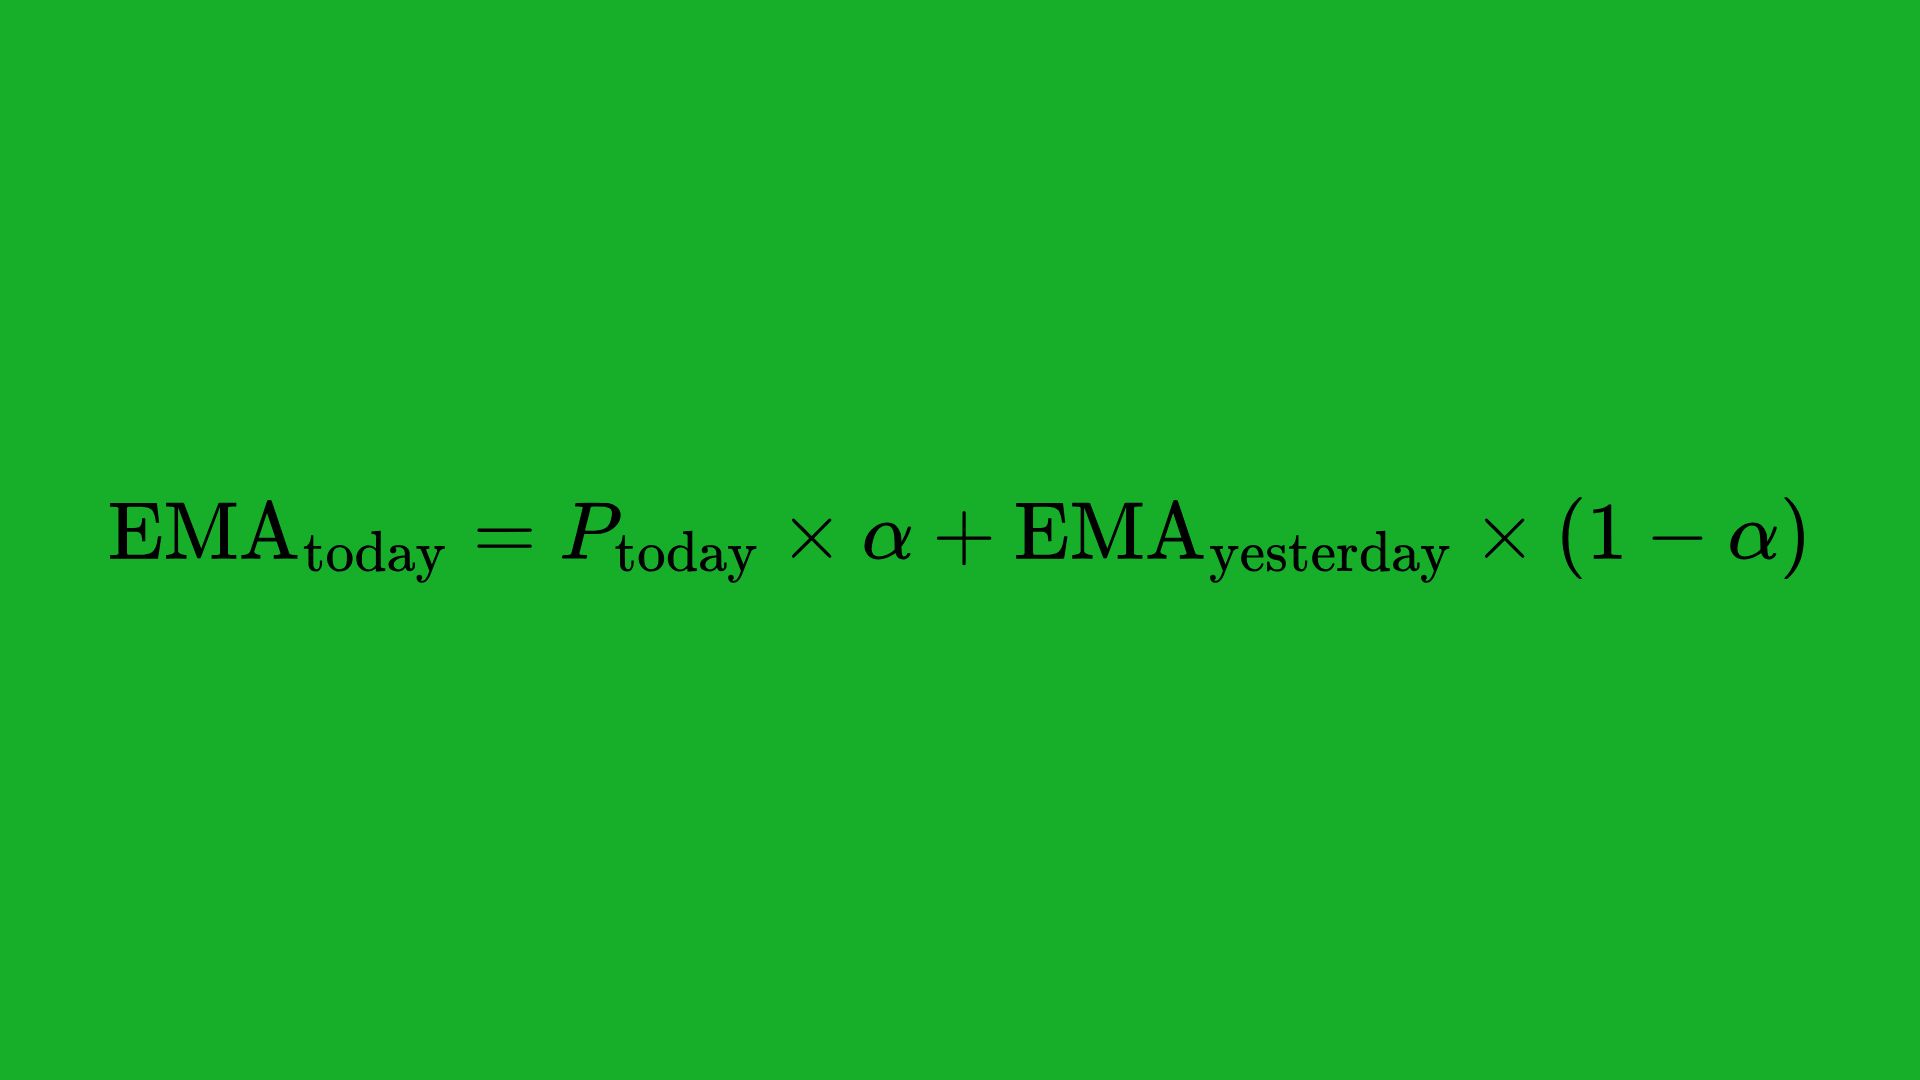
Where Ptoday is today’s price, and α is the smoothing constant.
Characteristics
- More responsive to price changes than the SMA.
- Generally better for short-term trading or swing trading where rapid shifts in momentum can matter significantly.
- Offers a “tighter” curve to price action, allowing it to signal potential trend reversals earlier than the SMA.
Common Applications
- Shorter-Time Trend Analysis: Traders often use EMAs (like 9-day, 12-day, or 20-day) for quick trend changes.
- Momentum Trading: Because EMAs are more reactive, day traders and scalpers commonly rely on EMA crossovers for swift entry and exit signals.
- Confluence with SMA: EMAs are frequently plotted alongside SMAs to combine the stability of the SMA with the reactivity of the EMA.
Why Use Moving Averages in Stock Trading?
Moving averages serve as a foundational building block in technical analysis. Their simplicity, combined with their ability to clarify the dominant price trend, makes them a go-to tool for many traders. Below are some key reasons why using moving averages (SMA & EMA) can be incredibly effective:
- Trend-Following: The bedrock principle of many trading strategies is identifying the primary trend. Moving averages help traders see, at a glance, whether the market is trending up, down, or moving sideways.
- Signal Generation: When two moving averages cross (for instance, a shorter SMA or EMA crossing above a longer one), it often signals a change in trend or momentum. These crossovers are easy to spot on a chart, making them beginner-friendly while still valuable for experts.
- Risk Management: Placing stop-loss orders near or below (in an uptrend) a key moving average can be a prudent method of limiting losses if the price unexpectedly reverses.
- Versatility: Regardless of your trading style—day trading, swing trading, or long-term investing—there’s a way to tailor moving averages to suit your approach. Shorter periods (like 10, 20) make sense for intraday or short-term trading, while longer periods (like 50, 100, or 200) benefit position traders or investors.
- Statistical Relevance: Moving averages have stood the test of time across a variety of markets (stocks, Forex, commodities). Although not foolproof, they often act as self-fulfilling prophecies because so many market participants follow them.
Understanding why moving averages are so widely used gives us a foundation. Next, let’s delve into some key elements of a moving average strategy to further refine your trading framework.
Key Elements of a Moving Average Strategy
To create a successful trading strategy using SMAs and EMAs, you need to consider several core elements that determine the effectiveness of your approach. These elements help shape your signals, your interpretation of market conditions, and your risk management practices.
1. Time Frame Selection
Short-Term (e.g., 5, 10, 20 periods)
- Suitable for day traders, scalpers, or those seeking quick trades.
- Highly responsive to current price action.
- More false signals are possible because short-term prices can be volatile.
Medium-Term (e.g., 50 periods)
- Often used by swing traders looking to capture multi-day or multi-week moves.
- Strike a balance between too many whipsaws in short-term periods and the slower response of long-term periods.
Long-Term (e.g., 100, 200 periods)
- Favored by position traders and long-term investors.
- Smoother curves reduce volatility and help identify the core market trend.
- Less frequent entry and exit signals, but these signals often carry more weight.
Choosing the Right Time Frame
- Your personal trading style and schedule significantly impact which time frames you choose.
- If you plan on monitoring the market multiple times a day, shorter time frames might work best.
- If you prefer a more hands-off approach, medium- or long-term MAs could be more appropriate.
2. Moving Average Crossover Signals
One of the most straightforward ways to build a moving average strategy is by looking for crossover signals. A crossover happens when a shorter-term MA crosses above or below a longer-term MA.
- Golden Cross: Occurs when a short-term MA (e.g., 50-day) crosses above a long-term MA (e.g., 200-day). This is traditionally considered a strong bullish signal, suggesting an uptrend may be starting.
- Death Cross: Occurs when a short-term MA crosses below a long-term MA, indicative of a potential bearish turn.
Although they may sound dramatic, the golden cross and death cross simply reflect a shift in price momentum. Many traders use these signals for entry and exit, but it’s important to remember crossovers can lag price action because moving averages are derived from past prices.
3. Trend Identification
Uptrend
- Price consistently trades above a particular moving average (e.g., the 50-day SMA).
- The moving average itself slopes upward, reflecting rising prices.
- A series of higher highs and higher lows forms on the price chart.
Downtrend
- Price consistently trades below a moving average.
- The moving average slopes downward.
- A series of lower highs and lower lows forms.
Sideways or Range-Bound
- Price oscillates around a flat or nearly flat moving average.
- Little to no trend, with price contained between support and resistance levels.
- Range-trading strategies (e.g., mean reversion) can be more appropriate in these conditions, rather than trend-following.
4. Stop-Loss and Take-Profit Levels
No trading strategy is complete without proper risk management. Stop-losses and take-profit levels (or “targets”) help you manage your capital responsibly:
- Stop-Loss Placement
- Placing a stop-loss below the moving average in an uptrend (or above the moving average in a downtrend) can be a wise way to limit losses.
- You might also use the average true range (ATR) to determine how far below the MA to set your stop-loss, accounting for market volatility.
- Take-Profit Placement
- It’s possible to close a portion of your trade once the price moves a certain distance away from the MA.
- Some traders trail their stop-loss along a moving average, locking in gains as the trend continues.
- Risk-to-Reward Ratio
- Ensuring your potential reward outweighs your risk (commonly aiming for a 2:1 or 3:1 ratio) is essential. Moving averages can be your guide, helping you determine realistic exit levels aligned with the trend’s momentum.
Building a Strategy Using SMA & EMA
Now that you’re familiar with the core elements, let’s dive into the step-by-step process of constructing a trading strategy using both SMA and EMA. While there is no “one-size-fits-all,” the framework below will help you outline a robust approach tailored to your preferences.
1. Choosing the Right Periods for SMA and EMA
Rule of Thumb
- For short-term trading, you might use a 10-day EMA and a 20-day SMA.
- For medium-term trading, consider a 20-day EMA and a 50-day SMA.
- For long-term trading or position trades, a 50-day EMA and a 200-day SMA is a classic pairing.
Why Pair SMA and EMA?
- The SMA offers a smoother, broader perspective on the trend.
- The EMA reacts faster to recent price changes, helping you identify early shifts in market dynamics.
By observing how these two lines move relative to each other (i.e., looking for crossovers or divergences), you gain deeper insights into the market’s momentum.
2. Identifying Long vs Short Signals
Long Signal
- Occurs when the faster-moving average (often the EMA) crosses above the slower-moving average (often the SMA).
- You may confirm this signal by observing increased volume, a positive market environment, or alignment with other indicators like RSI or MACD.
Short Signal
- Occurs when the faster-moving average crosses below the slower-moving average.
- As with a long signal, additional confirmation is recommended before entering a short position.
Confirmation
- Waiting for the crossover to “settle” can reduce false entries. Sometimes, a brief spike can make the EMA cross the SMA, only to reverse immediately.
- Check candlestick patterns, volume spikes, or other indicators (like the MACD histogram crossing the zero line) to confirm the trend shift.
3. Incorporating Risk Management
An excellent strategy must also address risk. Consider the following tactics:
- Position Sizing
- Never risk more than you can afford to lose. A common rule is risking 1-2% of your account per trade.
- This allows you to survive a series of losing trades without blowing up your account.
- Stop-Loss Placement
- Place stop-loss orders based on the volatility of the stock and your chosen moving averages.
- For example, you could set your stop-loss slightly below (e.g., 1% or 2% below) a trending EMA if you’re in a long position.
- Take-Profit and Trailing Stops
- Define profit targets beforehand. Some traders prefer using a fixed reward-to-risk ratio, while others trail their stop-loss along a moving average.
- A trailing stop-loss that follows the EMA upward (in a long trade) can lock in profits as the market moves in your favor.
4. Using Complementary Indicators
While moving averages can be powerful on their own, combining them with additional indicators can improve your win rate and reduce false signals. Indicators such as MACD, RSI, or even Volume can add vital context to price behavior. We’ll explore these more thoroughly in later section.
5. Backtesting and Forward Testing
Before you risk real capital, it’s crucial to test your moving average strategy:
- Backtesting
- Use historical price data to see how your chosen SMA-EMA crossover signals would have performed.
- Record metrics like winning percentage, average gain/loss, maximum drawdown, and profit factor.
- Forward Testing (Paper Trading)
- After successful backtesting, practice on a demo account or paper trading platform.
- This helps you gain confidence in your strategy before trading with real money and also reveals any real-time issues not visible in backtesting.
- Continuous Optimization
- Periodically revisit your strategy’s parameters (e.g., the length of your moving averages) to adapt to changing market conditions.
- Warning: Avoid over-optimizing. Tweaking too many parameters to fit past data can make your strategy less effective in the future (known as curve-fitting).
By diligently following these steps—time frame selection, identifying signals, incorporating risk management, adding confirming indicators, and thorough testing—you’ll create a more resilient moving average trading plan.
Detailed Examples and Case Studies
Examples are a powerful way to truly understand how a moving average strategy unfolds. Below are three scenarios catering to different time horizons—short-term, medium-term, and long-term. Each example demonstrates how to integrate both SMA and EMA, interpret signals, and manage trades from entry to exit.
1. Short-Term Strategy Example (SMA 20 & EMA 10)
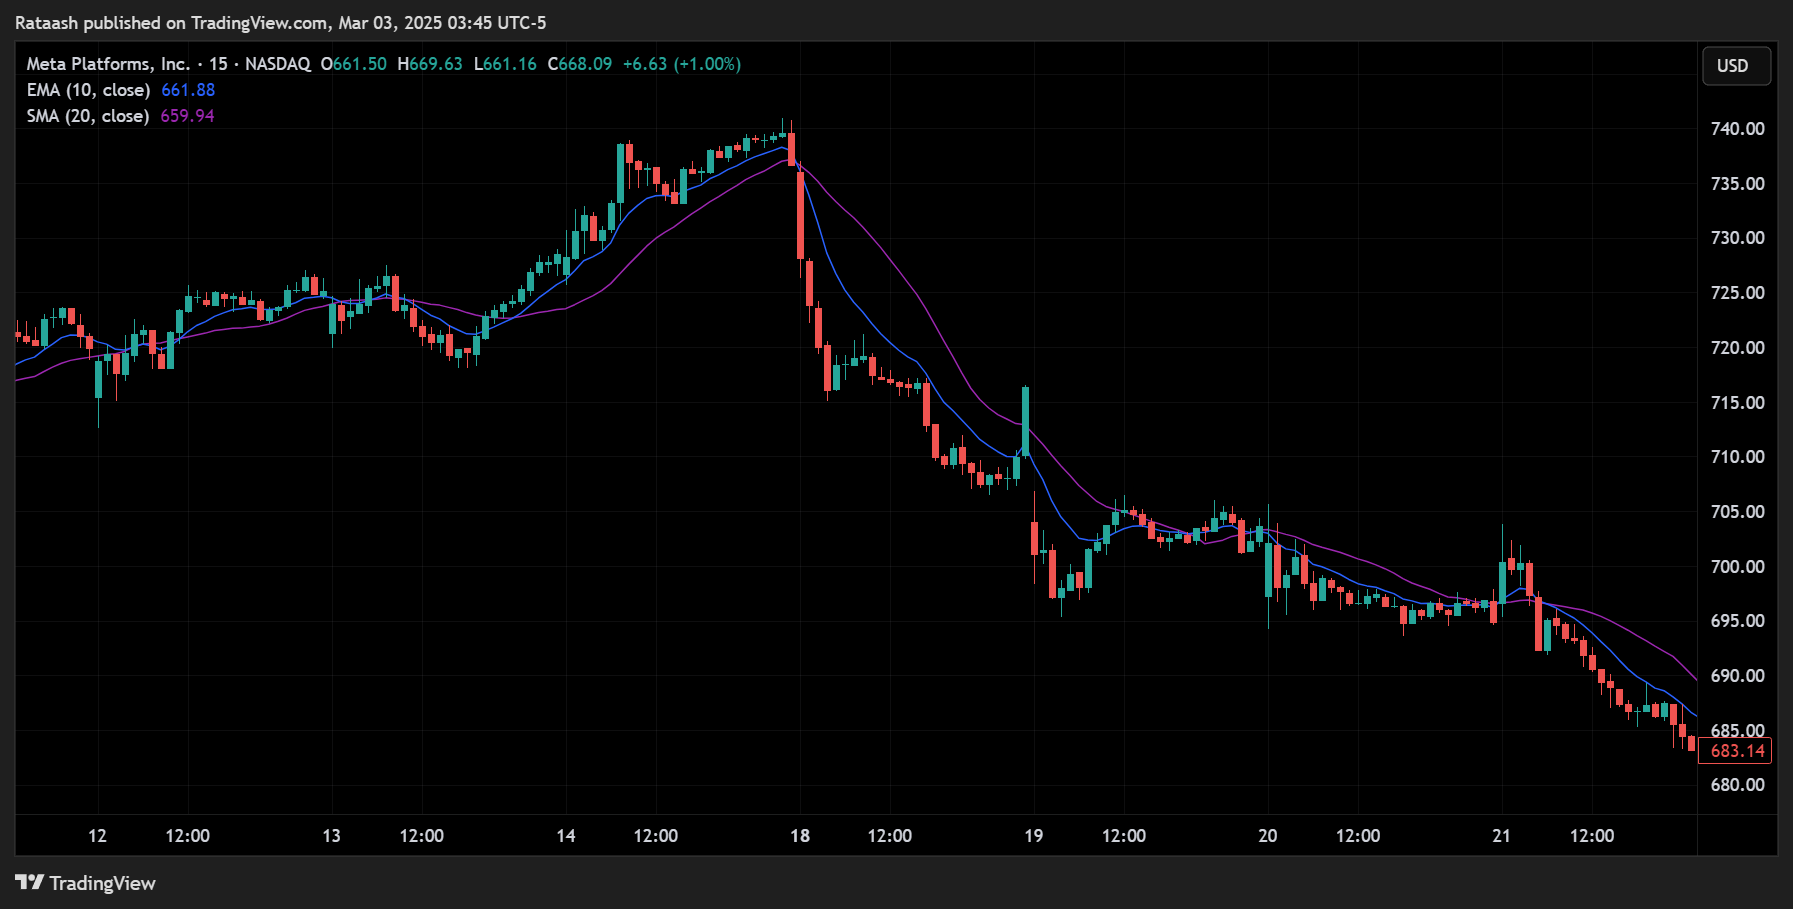
Setup
- SMA 20 and EMA 10 on a daily chart (suitable for short-term or swing trades).
- Objective: Capitalize on quick momentum shifts over days to a couple of weeks.
Entry Criteria
- Bullish Crossover: EMA 10 crosses above SMA 20.
- Volume Confirmation: Look for above-average trading volume on the breakout day.
- Price Action Check: Ideally, the stock is forming higher highs and higher lows.
Trade Example
- Suppose a stock in an uptrend dips slightly, causing the EMA 10 to go below the SMA 20. A week later, the stock gains strength, and the EMA 10 crosses back above the SMA 20. This event indicates renewed momentum.
- You decide to buy at the close of the crossover day or the next day’s open, anticipating continued upward movement.
Stop-Loss Placement
- Place a stop-loss just below the SMA 20 line. Alternatively, use a percentage-based stop, say 2-3% below your entry, if you want a hard stop.
Take-Profit Strategy
- You might close half of the position once the price moves a certain percentage above your entry (e.g., 2:1 reward-to-risk ratio).
- For the remaining shares, you can trail your stop using the EMA 10. If the price breaks below the EMA 10 for more than a day or two, you exit the rest of the position.
Outcome
- This strategy offers multiple trades each month, capturing short bursts of momentum.
- The key is strict risk management, because rapid price fluctuations can whipsaw traders.
2. Medium-Term Strategy Example (SMA 50 & EMA 20)
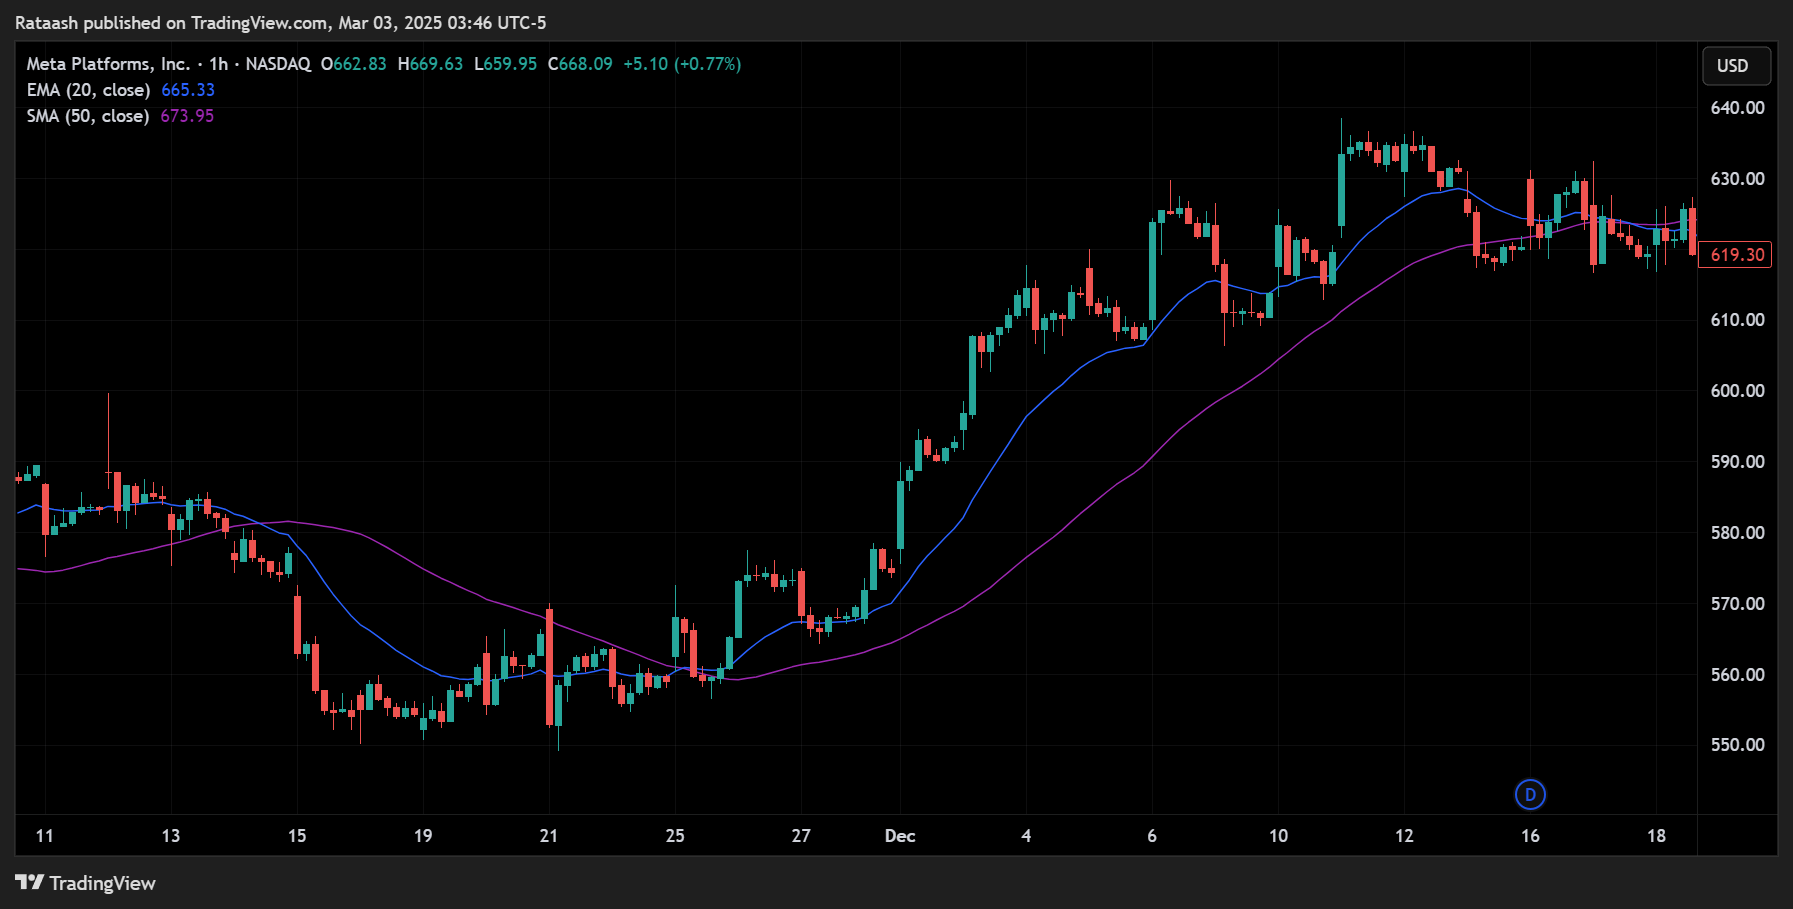
Setup
- SMA 50 and EMA 20 on a daily chart (popular for swing traders or those who hold positions for a few weeks to a couple of months).
Entry Criteria
- Golden Cross: EMA 20 crosses above SMA 50.
- Trend Confirmation: SMA 50 is sloping upward, indicating a broader uptrend.
- Price above Both Averages: Ensures the stock is likely in an uptrend.
Trade Example
- After a market correction, a quality tech stock starts to rebound. As the price recovers, the 20-day EMA (which had dropped below the 50-day SMA) crosses above it.
- You enter a long position once you see a daily candle closing well above both the 20-day EMA and the 50-day SMA, aligning with increased volume.
Stop-Loss Placement
- Set an initial stop-loss below the 50-day SMA or use the last swing low as a reference point.
- This ensures you’re giving the trade enough “breathing room” while containing your downside risk.
Profit Target and Exit
- A typical method is to exit a portion of your position once the price moves a set multiple of your risk.
- If you want to hold for a longer run, you could wait until the EMA 20 crosses back below the SMA 50, which signals a potential end of the medium-term uptrend.
Outcome
- This strategy generates fewer signals than short-term methods, but those signals often capture more substantial trend moves.
- Fewer trades also means you might reduce the impact of trading fees and slippage.
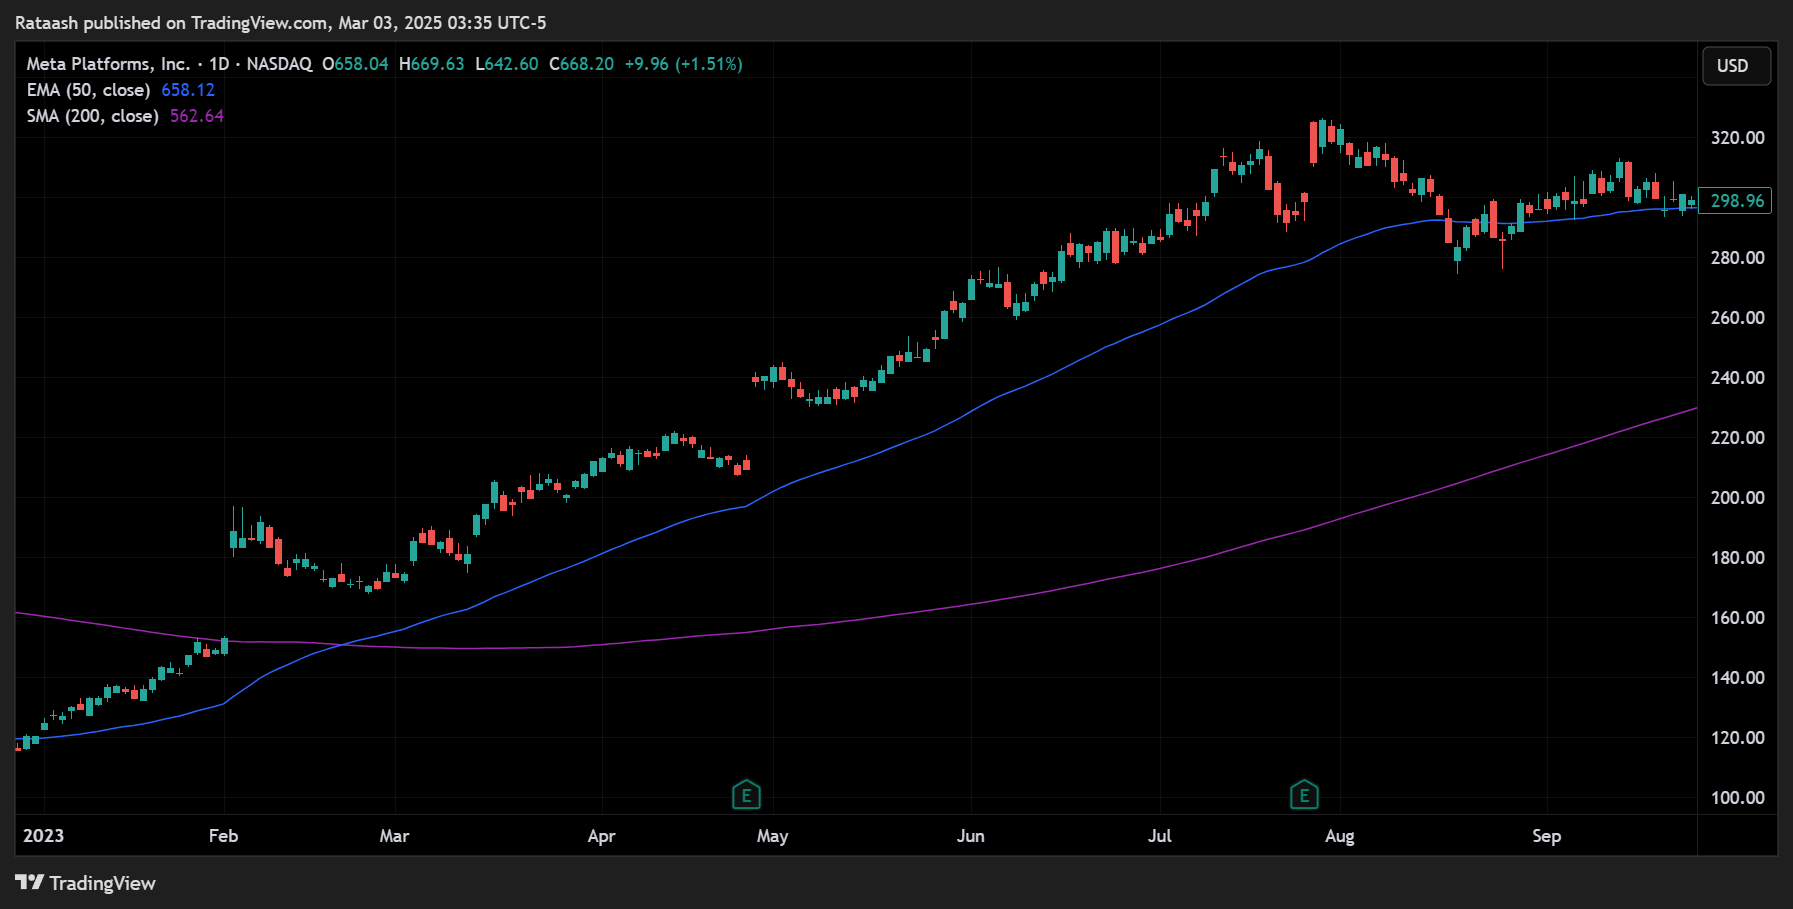
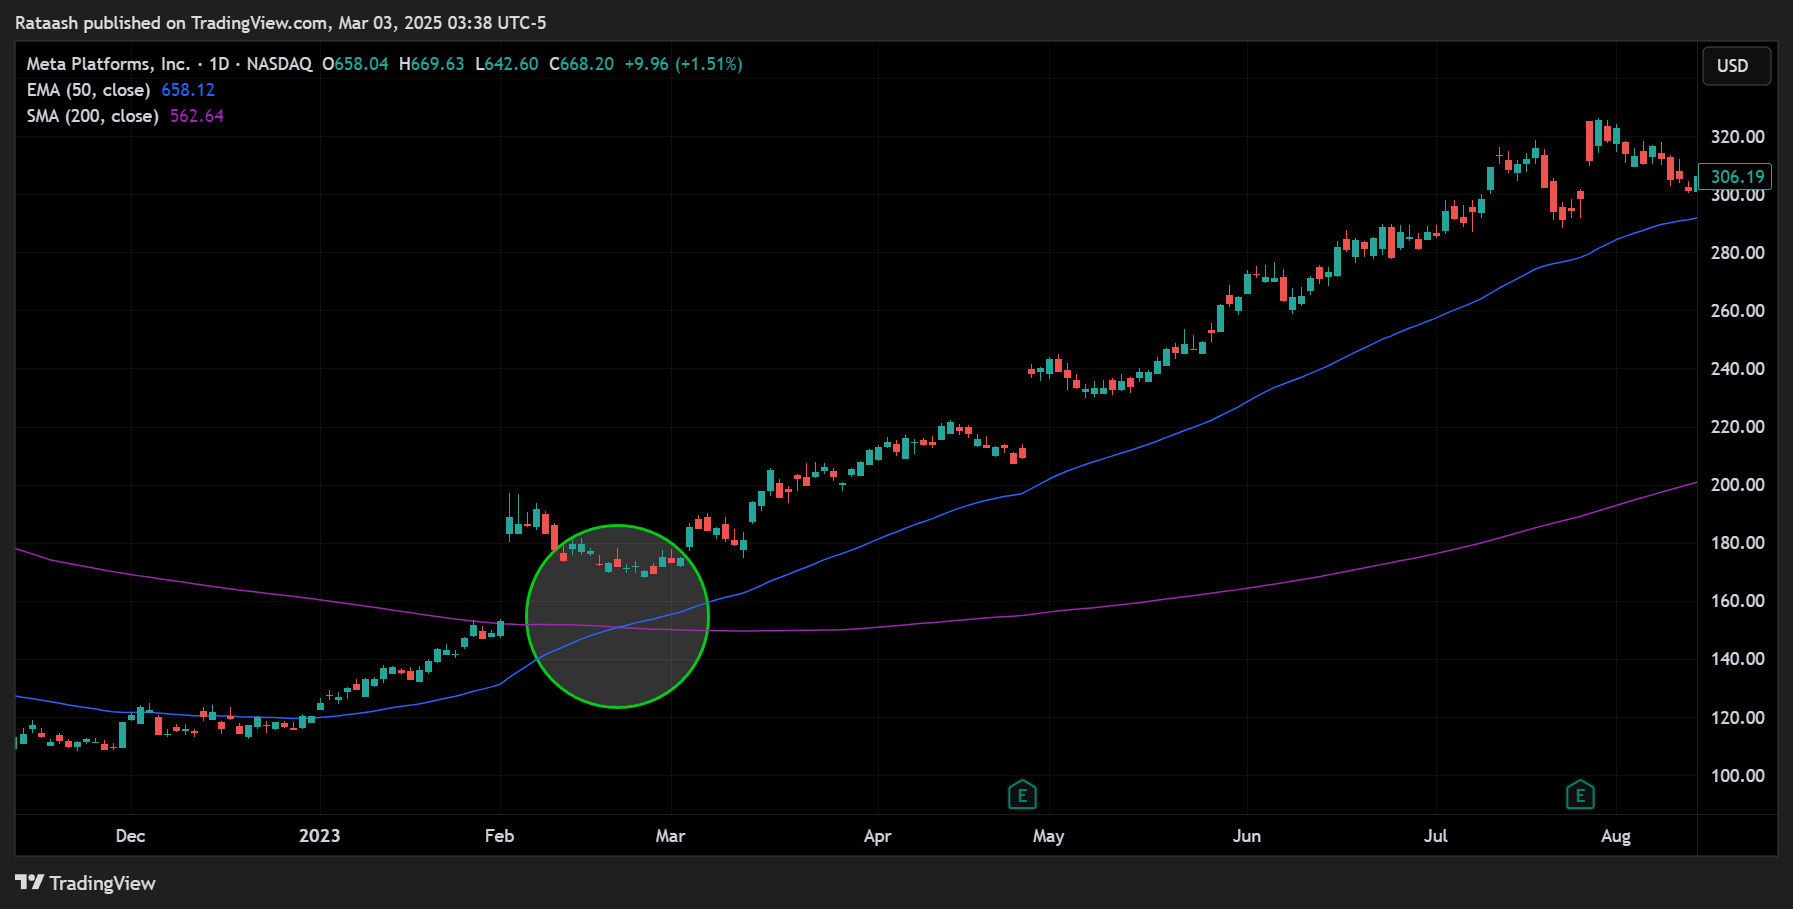
3. Long-Term Strategy Example (SMA 200 & EMA 50)
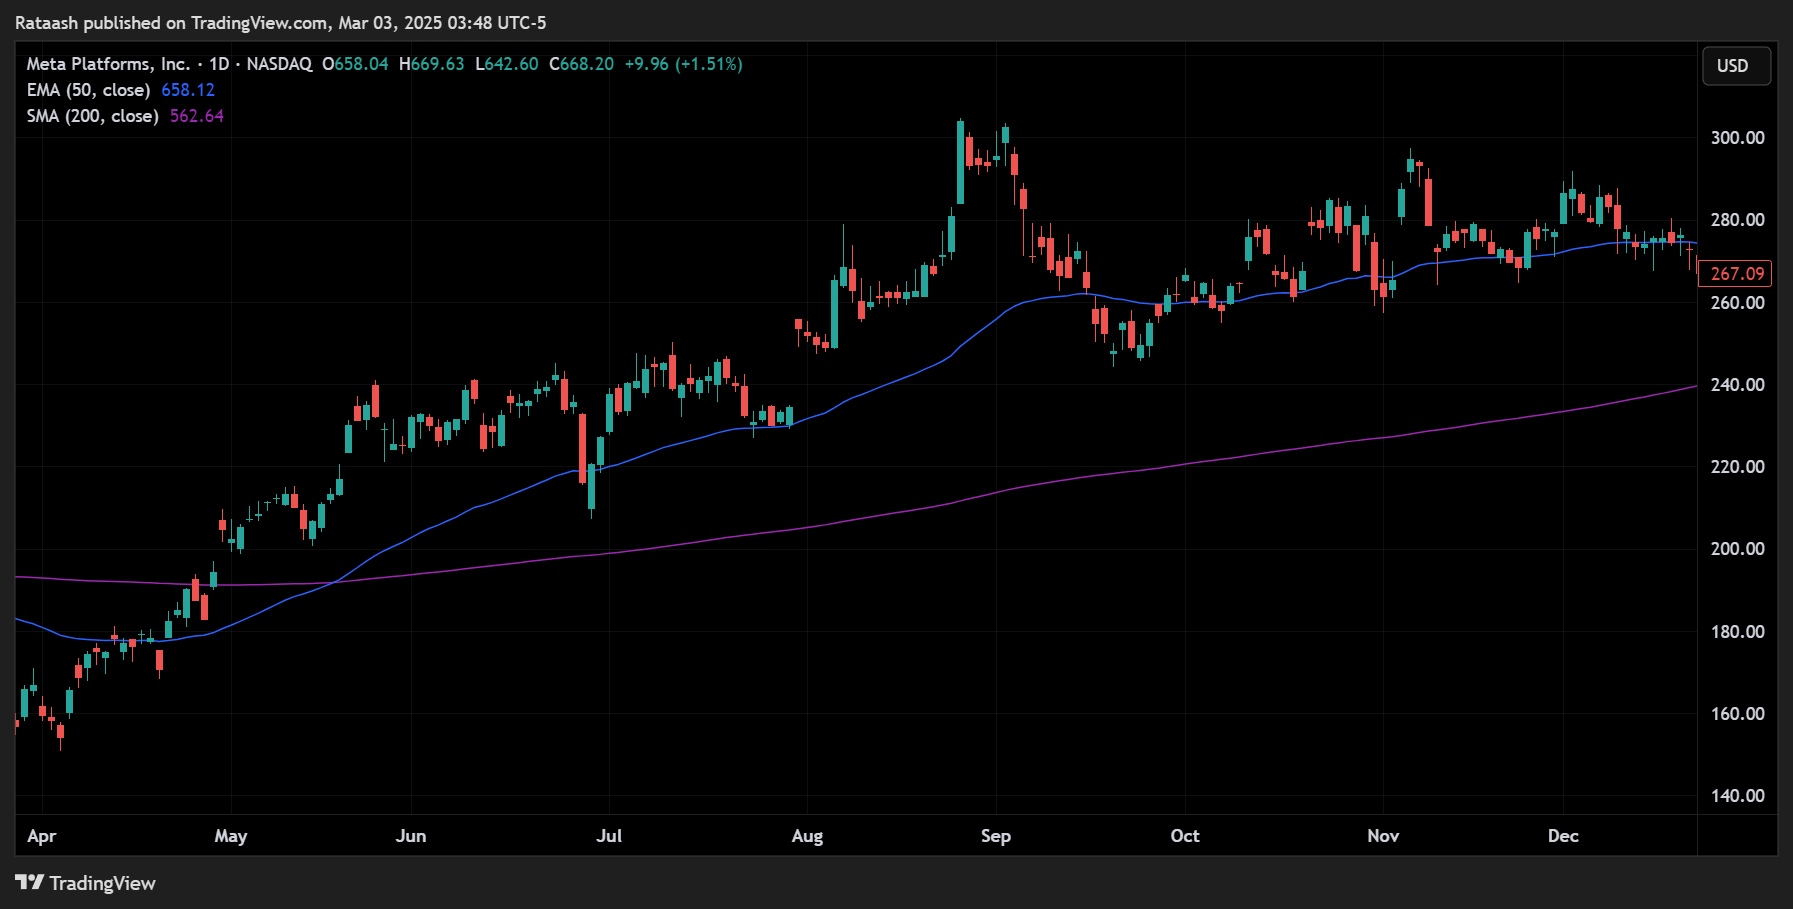
Setup
- SMA 200 and EMA 50 on a daily or weekly chart (designed for position traders and long-term investors).
Entry Criteria
- Golden Cross: EMA 50 crosses above SMA 200.
- Overall Market Health: Ensure broad market indices (e.g., S&P 500) are also in an uptrend or stabilizing.
- Fundamental Check: Long-term traders often incorporate fundamental metrics like earnings growth or revenue trends.
Trade Example
- Consider a large-cap stock that has traded below its 200-day SMA for several months. Eventually, the broader market recovers, and the stock starts rising. Over time, its 50-day EMA crosses above the 200-day SMA, signaling a sustained change in trend.
- You open a long position, expecting a multi-month or multi-year appreciation in value.
Stop-Loss Placement
- Because this is a long-term play, stops are usually placed significantly below the 200-day SMA or at a major support level.
- Your risk per trade should still be reasonable, perhaps around 1-2% of your portfolio.
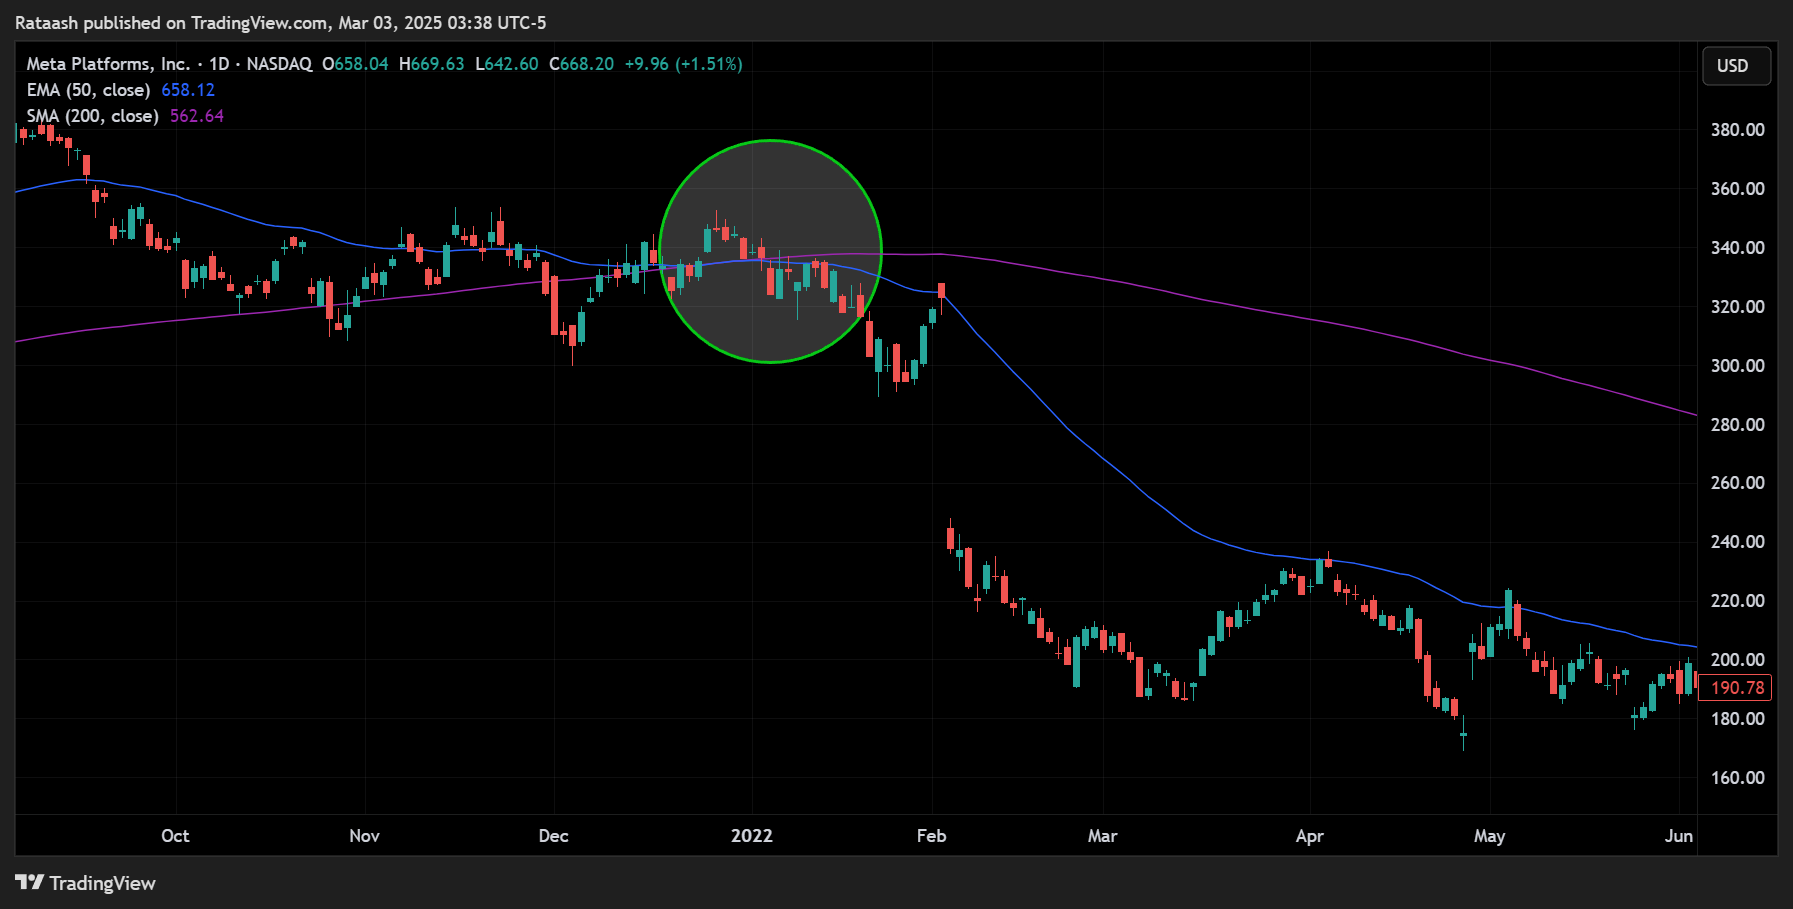
Exit Criteria
- Many long-term traders hold until the 50-day EMA again falls below the 200-day SMA (a “death cross”), or until a fundamental shift occurs that undermines the stock’s growth outlook.
- Some will also scale out of positions if the price rises dramatically in a short time, banking partial profits and letting the remainder run.
Outcome
- This approach yields few signals but can capture large market moves if you are patient.
- Suited for investors who prefer low-maintenance trading and can stomach larger short-term fluctuations.
Combining Moving Averages With Other Indicators
Moving averages are powerful, but no single indicator can paint the complete picture. Enhancing your strategy with complementary tools often leads to higher accuracy and confidence in your trades. Below are some popular indicators and how they pair well with SMA and EMA.
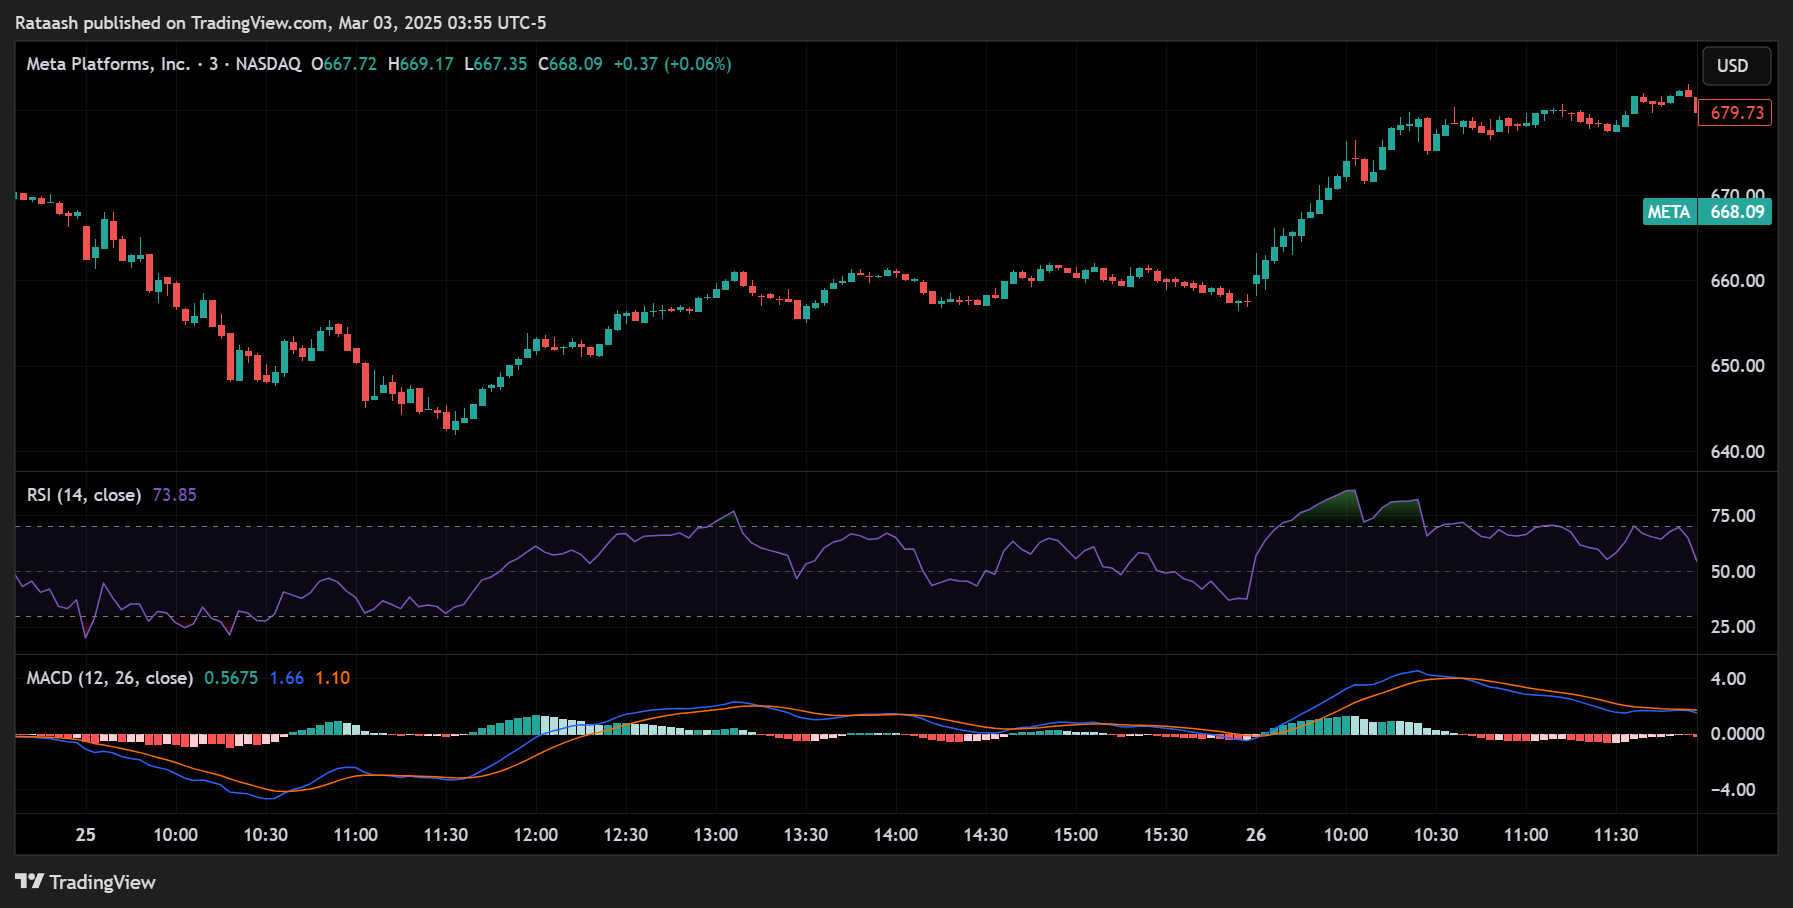
1. Moving Averages + RSI
Relative Strength Index (RSI) is a momentum oscillator that measures the speed and magnitude of price changes. It ranges from 0 to 100 and typically, readings above 70 indicate overbought conditions, while readings below 30 indicate oversold conditions.
- Overbought Confirmation: If the RSI is above 70 while a short-term MA crosses below a longer-term MA, it could signal a strong potential for a downside correction.
- Oversold Confirmation: An RSI reading below 30 accompanied by a bullish crossover of EMAs/SMAs might reinforce a turnaround, indicating a good entry point.
Example:
- Wait for a bullish crossover between EMA 10 and SMA 20.
- Ensure RSI has come out of oversold territory (e.g., climbing from below 30 to above 30).
- This combination can provide a timely entry with reduced likelihood of false signals.
2. Moving Averages + MACD
The Moving Average Convergence Divergence (MACD) indicator itself is based on EMA calculations. It consists of two lines:
- The MACD line (difference between two EMAs, typically 12 and 26).
- The Signal line (an EMA of the MACD line, often set to 9 periods).
- Bullish Confirmation: When your shorter-term EMA crosses above your longer-term SMA, check if the MACD line also crosses above the signal line.
- Bearish Confirmation: A short-term MA crossing below a long-term MA might be validated if the MACD line crosses below the signal line and moves into negative territory.
Example:
- You see a golden cross between the 20-day EMA and 50-day SMA.
- Around the same time, the MACD line crosses above its signal line near or above the zero line.
- Such a confluence increases the probability that this crossover indicates a genuine shift to a bullish trend.
3. Moving Averages + Volume Profile
Volume Profile shows how much volume has been traded at specific price levels. When integrated with moving averages:
- High Volume Nodes: These areas represent prices where many shares have exchanged hands, often acting as support or resistance.
- If a bullish crossover occurs above a high-volume node, it could mean strong backing for a continued uptrend.
- Conversely, a crossover below a high-volume node might represent a robust bearish signal.
Example:
- A 50-day SMA is trending upward, but the price is consolidating at a known high-volume area.
- If the 20-day EMA crosses above the 50-day SMA at the same time the price breaks above the high-volume area on decent trading volume, it’s a strong bullish signal.
Common Pitfalls and How to Avoid Them
While moving averages are straightforward, there are several traps and errors that traders frequently encounter. By being aware of these pitfalls, you can take steps to avoid them or at least mitigate their impact on your trading.
- Lagging Nature of Moving Averages
- Pitfall: Entering a position too late in the trend because moving averages only reflect past prices.
- Solution: Combine moving averages with additional indicators (e.g., MACD or RSI) or price action techniques (e.g., candlestick patterns) to get an earlier read.
- Whipsaws in Choppy Markets
- Pitfall: Multiple crossover signals in a sideways market, leading to losses.
- Solution: Identify range-bound conditions and avoid crossover-based strategies unless the market shows a clear trend.
- Overcomplicating the Chart
- Pitfall: Using too many MAs of different lengths, cluttering the chart and confusing signals.
- Solution: Stick to one or two moving averages (like EMA and SMA). Only use additional lines when they add specific value or clarity.
- Inadequate Stop Placement
- Pitfall: Setting stops too tight or too wide, leading to premature exits or catastrophic losses.
- Solution: Use a volatility-based method (e.g., ATR) or place stops near logical technical levels like the SMA or EMA line.
- Emotional Trading
- Pitfall: Ignoring signals from your strategy due to fear or greed.
- Solution: Predefine your trading plan and follow it. Use journaling and data-driven approaches to maintain discipline.
- Lack of Market Context
- Pitfall: Blindly following MA crossovers without regard for larger market trends, news, or fundamentals.
- Solution: Always consider the broader market environment. Confirm signals with macroeconomic data or fundamental analysis when necessary.
By systematically addressing these issues—through thorough testing, discipline, and risk management—you’ll avoid many of the mistakes that derail less-prepared traders.
Psychological Factors in Trading
Even if you have a perfect moving average strategy, your success relies heavily on your mindset and emotional control. Trader psychology plays a massive role in how well you execute a plan.
- Fear of Missing Out (FOMO)
- Occurs when a trader chases a price that’s already spiked far above the moving average.
- Counter by developing patience and waiting for the price to align with your signals.
- Fear of Losing
- Can cause traders to exit trades prematurely or set extremely tight stop-losses.
- Manage by accepting that small losses are part of trading. Focus on maintaining a consistent edge over many trades.
- Overconfidence
- Stringing together a few wins might cause some traders to increase position sizes recklessly.
- Maintain discipline and stick to your risk management rules regardless of recent wins.
- Analysis Paralysis
- Piling on numerous indicators can lead to indecision.
- Keep it simple. Focus on the core elements of your strategy (MAs, one or two confirming tools, and risk management).
Maintaining the right mindset often requires consistent self-assessment, trading journals, and a supportive community or mentor who can provide feedback.
Advantages and Disadvantages of Moving Average Strategies
To ensure you’re fully informed, here’s a quick look at the pros and cons of using SMA and EMA in your trading strategy.
Advantages
- Simplicity: Straightforward to calculate and interpret, suitable for beginners.
- Trend Clarity: Helps filter noise, making trend directions more evident.
- Versatility: Applicable across various markets and time frames.
- Widely Followed: Market participants around the globe use MAs, making certain support/resistance levels more reliable.
- Easily Combined: Can be paired with other indicators for stronger signals.
Disadvantages
- Lagging Indicator: By definition, MAs use historical data, so signals come after price movement has started.
- False Signals in Ranging Markets: Prone to whipsaws when there is no clear trend.
- Not a Standalone Solution: Relying solely on MAs can overlook essential market factors like news, volume spikes, or macroeconomic data.
- Requires Discipline: Emotional trading can override valid signals, leading to inconsistent results.
By weighing these pros and cons, you can determine if a moving average strategy aligns with your trading style, risk tolerance, and market outlook.
Final Thoughts
Moving averages—whether Simple (SMA) or Exponential (EMA)—are among the most tried-and-true components of technical analysis. They provide clarity in chaotic markets, highlight crucial momentum shifts, and establish dynamic levels of support or resistance. More importantly, they form a flexible foundation on which you can build a comprehensive trading strategy.
To reiterate the key steps in your moving average journey:
- Choose Appropriate Time Frames: Align the MA periods with your trading style (short-term, medium-term, or long-term).
- Identify Crossover Signals: Pinpoint when a faster MA (often EMA) crosses a slower MA (often SMA).
- Incorporate Risk Management: Define stop-losses and take-profit levels that protect and grow your capital.
- Add Confirming Indicators: Reinforce your signals with RSI, MACD, Volume Profile, or other tools.
- Thoroughly Test: Backtest your approach historically, then forward test in a demo or paper trading environment.
Combine the technical edge provided by moving averages with the emotional discipline required of all successful traders. Consistency and patience, more than any individual strategy, often make the difference between losing money and turning a profit in the stock market.