In the world of investing and trading, risk-adjusted performance metrics play a pivotal role in helping investors evaluate how well a portfolio or strategy compensates for the risks taken. Two of the most common metrics you’ll encounter are the Sharpe Ratio and the Sortino Ratio. Both seek to measure the returns you earn relative to the risk you endure, but they do so in different ways. Understanding these differences is not just a matter of academic interest—it can fundamentally change how you assess, manage, and optimize your portfolio.
In this in-depth article, we’ll compare Sortino Ratio vs Sharpe Ratio, explore the nuances of downside risk, and examine why focusing on downside risk could be critical for many investors and traders. We will dive deeply into the formulas, interpretations, use cases, advantages, and limitations of each metric. By the end of this article, you should have a comprehensive understanding of how each ratio works, when to use them, and why emphasizing downside risk is often a game-changer in portfolio and risk management.
Understanding Risk-Adjusted Performance Metrics

Before we delve into the specifics of the Sharpe Ratio and Sortino Ratio, it’s crucial to lay the groundwork by understanding what risk-adjusted performance metrics actually are. In simple terms, risk-adjusted metrics attempt to show how much return an investor earns for every unit of risk taken.
Why do we need risk-adjusted performance metrics?
A portfolio might generate high returns, but if it does so by taking on excessive risk, those returns may not be sustainable or might expose the investor to dramatic drawdowns. Risk-adjusted performance metrics aim to balance the desire for returns with the need to protect capital.
Common types of risk
- Volatility risk: The extent to which returns fluctuate around their average over a specific period.
- Downside risk: The risk of returns falling below a certain threshold or “minimum acceptable return” (MAR).
- Systemic risk: Risks inherent in the entire financial market or system, influenced by macroeconomic factors.
- Idiosyncratic risk: Risks that are unique to a specific company, sector, or strategy.
Both the Sharpe Ratio and the Sortino Ratio aim to measure how effectively a portfolio manager or strategy is earning returns relative to risk. However, the primary difference lies in how each metric defines and treats the concept of risk. Understanding these differences can help you fine-tune your investment decisions and align them with your risk tolerance.
Overview of the Sharpe Ratio

Developed by Nobel laureate William F. Sharpe, the Sharpe Ratio is one of the most widely used risk-adjusted performance metrics in the investment community. It’s often considered the “standard” or “foundation” for comparing different portfolios, mutual funds, hedge funds, ETFs, and trading strategies.
Key Points
- The Sharpe Ratio uses total volatility (standard deviation) as the measure of risk.
- It compares the excess return of an asset (or portfolio) over the risk-free rate to the asset’s volatility.
Because the Sharpe Ratio looks at total volatility, it treats upside and downside fluctuations equally. This can be a point of contention for some investors who argue that upside volatility (when your returns are better than expected) shouldn’t necessarily be penalized the same way as downside volatility (when your returns fall below expectations).
Sharpe Ratio Formula
Formally, the Sharpe Ratio is expressed as:
Sharpe Ratio = (Rp − Rf) / σp
Where:
- Rp = the average return of the portfolio (or investment)
- Rf = the risk-free rate (often the yield on short-term government bonds such as 3-month T-bills)
- σp = the standard deviation of the portfolio’s excess returns (i.e., the standard deviation of Rp − Rf)
Interpretation of Components
- Rp − Rf : This is the excess return of the portfolio over the return that one could earn by investing in a virtually risk-free asset, typically short-term government debt.
- σp : This indicates how much the portfolio’s returns fluctuate around its mean. A higher standard deviation means higher volatility and, hence, higher risk.
Interpretation and Practical Example
A higher Sharpe Ratio generally indicates a better risk-adjusted return, meaning you are getting more excess return per unit of risk. Conversely, a lower or negative Sharpe Ratio suggests the strategy may be undercompensating for the risk taken.
Let’s consider a practical example:
- Scenario: You have a portfolio that yields an average annual return of 10%.
- Risk-free rate: 2% (based on short-term Treasury bills).
- Standard deviation of the portfolio: 8%.
Using the Sharpe Ratio formula:
Sharpe Ratio = (10% − 2%) / 8% = (8% / 8%) = 1.0
An SR of 1.0 indicates that for every 1% of volatility (risk), you’re earning 1% of excess return above the risk-free rate. While some investors aim for ratios above 1.0 or even 2.0, the Sharpe Ratio’s acceptability threshold can vary depending on the market conditions and asset classes.
Strengths and Limitations of the Sharpe Ratio
The Sharpe Ratio is extremely popular, but it is not without its drawbacks.
Strengths
- Simplicity: The formula is straightforward and easy to interpret, making it a go-to metric for initial comparisons of risk-adjusted performance.
- Benchmarking: The Sharpe Ratio’s reliance on the risk-free rate makes it easy to see whether an investment is outperforming a baseline of “no risk.”
- Universally recognized: Its widespread use means that many funds and managers publish Sharpe Ratios, allowing quick cross-comparisons.
Limitations
- Penalizes upside and downside volatility equally: This is the biggest critique. The Sharpe Ratio does not distinguish between “good” volatility (returns above the mean) and “bad” volatility (returns below the mean).
- Susceptible to manipulation: Changing the measurement period or using annualized figures in a particular way can inflate or deflate the Sharpe Ratio.
- Assumes returns are normally distributed: Many real-world returns exhibit skewness and kurtosis that are not captured by a simple standard deviation.
Introducing the Sortino Ratio
The Sortino Ratio was developed as an improvement to the Sharpe Ratio, particularly to address the way in which the Sharpe Ratio treats all volatility equally. Named after Frank A. Sortino, this metric focuses exclusively on downside volatility—the portion of overall volatility that investors generally want to minimize or avoid.
Key Points
- The Sortino Ratio uses downside deviation (rather than total standard deviation) to measure risk.
- It distinguishes between positive (above the chosen minimum acceptable return) and negative (below the chosen minimum acceptable return) fluctuations.
By isolating downside deviations, the Sortino Ratio can arguably provide a more accurate picture of how effectively a strategy or portfolio manages negative returns. Many risk-averse investors find this approach intuitive, because it penalizes returns that fall below a specific threshold (which could be the risk-free rate or a custom “target return”).
Sortino Ratio Formula
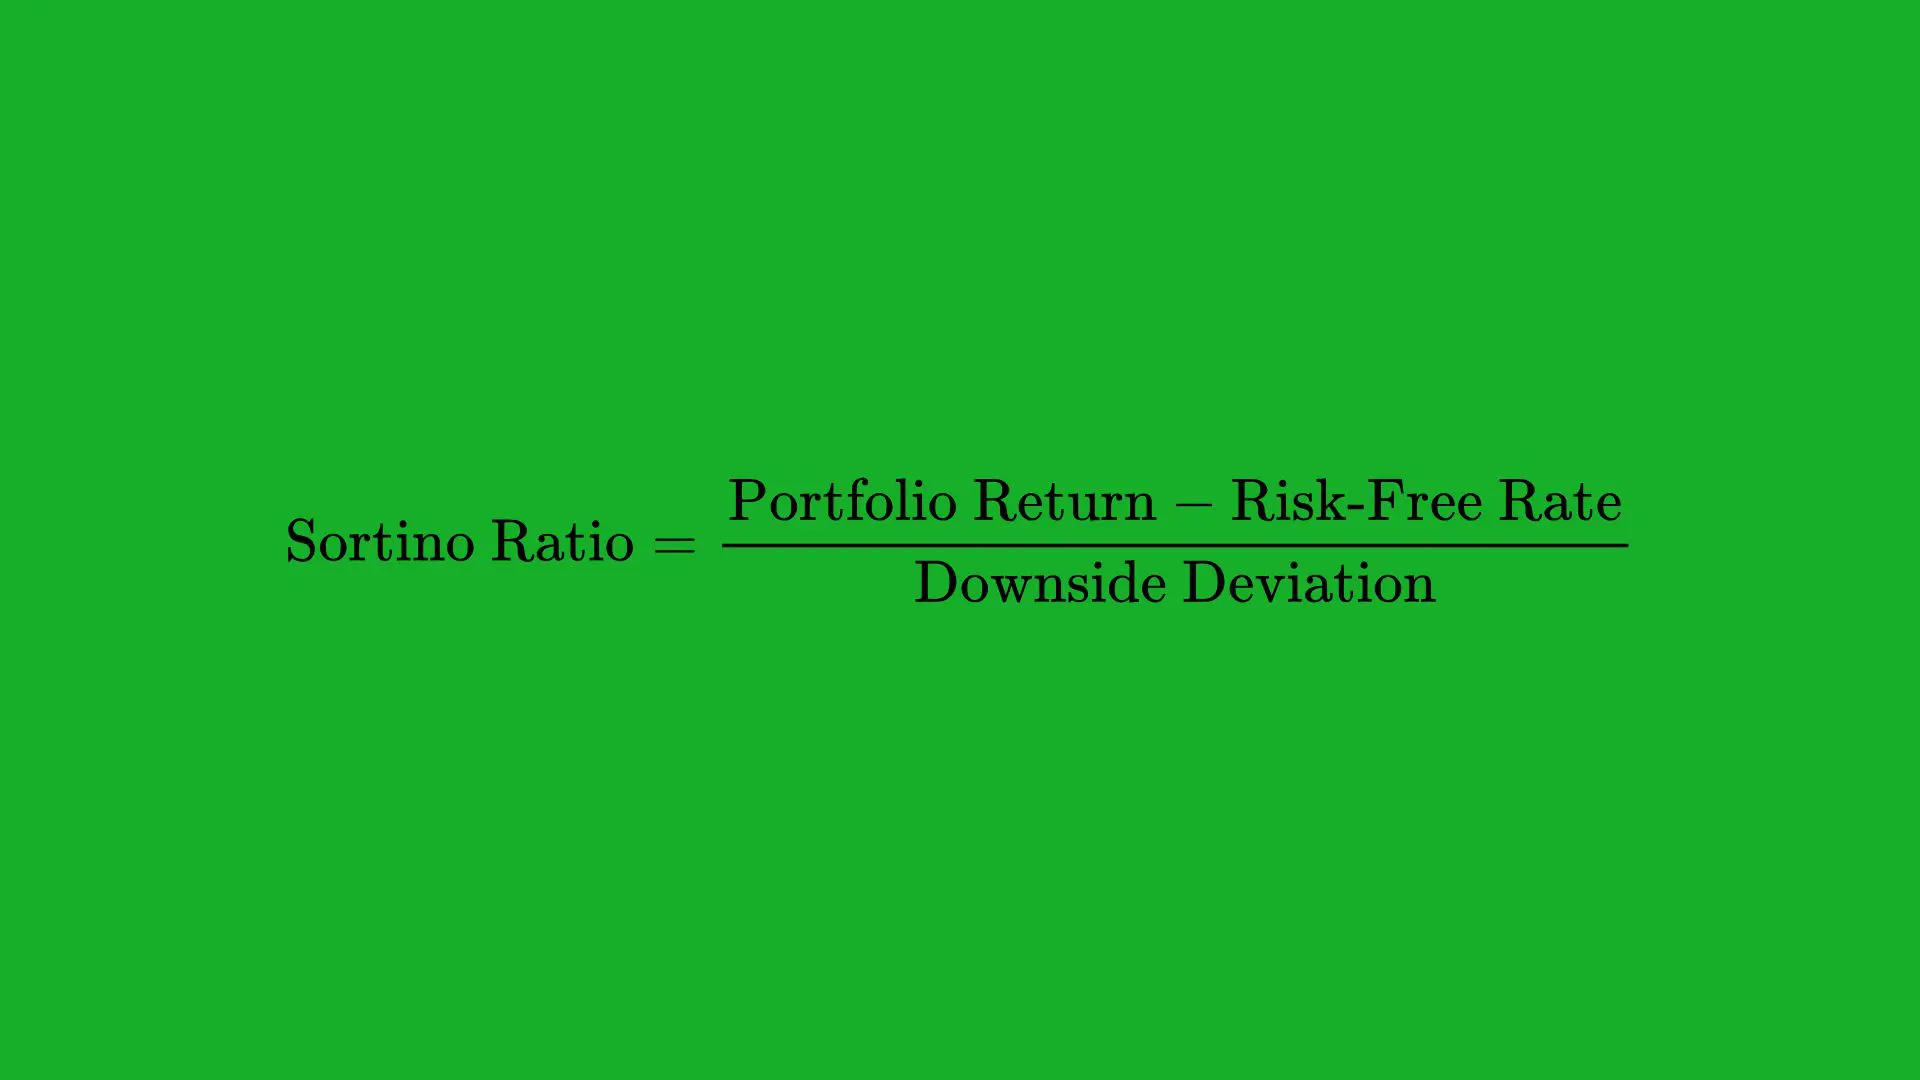
The general formula for the Sortino Ratio is:
Sortino Ratio = (Rp − RMAR) / Downside Deviation
Where:
- Rp = the average return of the portfolio (or investment)
- RMAR = the minimum acceptable return (MAR), which could be the risk-free rate, zero, or another chosen threshold
- Downside Deviation = the standard deviation of returns that fall below Rmar
Breaking Down the Components
- RMAR: In many cases, this is set to the risk-free rate, but it can also be a specific target return or a certain hurdle rate a manager is aiming to beat.
- Downside Deviation: This is calculated by taking all the returns that fall below the MAR and computing their variance (and then the square root for standard deviation). Technically, it’s the square root of the average squared deviations from the MAR for negative returns only.
Interpretation and Practical Example
A higher Sortino Ratio indicates that you are earning more excess return (above the MAR) per unit of negative volatility. This metric is especially useful if you believe that negative returns are the primary concern and that upside volatility can be tolerated or even welcomed.
Let’s look at a practical example:
- Scenario: A portfolio yields an average annual return of 12%.
- MAR: 3% (instead of 2% risk-free rate, we assume we want to outperform 3%).
- Downside deviation: 7% (computed by focusing on returns below 3%).
Sortino Ratio = 12% − 3% / 7% = 9% / 7% ≈ 1.29
In this example, the portfolio generates about 1.29% of excess return (over the 3% threshold) for every 1% of downside risk. By focusing only on the downside deviations, you get an arguably clearer picture of how the portfolio performs in unfavorable market conditions.
Strengths and Limitations of the Sortino Ratio
Strengths
- Focus on downside risk: Many investors only worry about negative returns, so a metric that isolates negative volatility can be more aligned with real-world concerns.
- More refined risk measurement: By using downside deviation, the ratio offers a more targeted measurement of risk, one that often resonates better with risk-averse investors.
- Customizable MAR: You can pick a minimum acceptable return that is unique to your financial goals, whether that’s 0%, a risk-free rate, or a specific hurdle rate.
Limitations
- Choice of MAR: The results can vary significantly depending on what you choose as your minimum acceptable return. This introduces subjectivity.
- Less common: While growing in popularity, the Sortino Ratio isn’t as universally reported as the Sharpe Ratio, making quick comparisons with other strategies more difficult.
- Requires more data manipulation: Calculating downside deviation is a bit more involved than calculating total standard deviation, especially if you’re doing it manually.
Downside Risk: Why It Matters
For many investors—particularly those close to retirement, those with large amounts of capital to protect, or those who simply have low risk tolerance—downside risk can be the most critical factor in evaluating an investment strategy. Here are some reasons why focusing on downside risk is pivotal:
- Capital preservation: When your investment capital diminishes beyond a certain threshold, the effort required to recover lost ground grows exponentially (the concept of drawdowns and the “mathematics of losses”).
- Psychological comfort: Many investors find losses far more painful than missing out on gains. Behavioral economics shows that people exhibit “loss aversion,” where the pain of losing a dollar is greater than the pleasure of gaining a dollar.
- Retirement portfolios: Investors in the decumulation phase (i.e., those who are withdrawing assets for income, such as retirees) need to limit drawdowns because major losses can devastate the longevity of their portfolios.
- Regulatory and institutional concerns: Some institutions have mandates that limit downside risk (e.g., endowments, foundations, or pension funds), making metrics like the Sortino Ratio particularly relevant.
By zeroing in on downside risk, the Sortino Ratio addresses these concerns more explicitly than the Sharpe Ratio does, since it highlights how a portfolio performs in its worst periods.
Sortino Ratio vs Sharpe Ratio: Key Differences
While both ratios measure risk-adjusted returns, they do so differently. Here’s a concise overview of the key differences:
| Factor | Sharpe Ratio | Sortino Ratio |
|---|---|---|
| Risk Measure | Total volatility (standard deviation) | Downside volatility (downside deviation) |
| Focus | Overall volatility (up and down) | Negative or downside risk only |
| Threshold | Risk-free rate | MAR (can be risk-free rate, 0%, or other custom rate) |
| Penalizes | All volatility equally (upside = downside) | Only returns that fall below the chosen threshold |
| Interpretation | How much excess return is earned per unit of total volatility | How much excess return is earned per unit of negative volatility |
Importance: For a stable, conservative strategy—especially one aiming to avoid large drawdowns—the Sortino Ratio is often considered superior. However, for a more general, broad-based comparison across many different types of strategies, the Sharpe Ratio remains the standard.
When to Use the Sortino Ratio vs the Sharpe Ratio
It’s not always a question of which ratio is universally “better.” Instead, it often depends on the context and the investor’s goals.
When to favor the Sharpe Ratio
- Comparing multiple managers or funds: If you want a quick, universal snapshot of how one manager’s risk-adjusted performance compares to another, the Sharpe Ratio is often published and easy to use.
- Early-stage screening: For initial vetting of different funds or strategies, the Sharpe Ratio can provide a baseline measure.
- Benchmarking against the market: The Sharpe Ratio offers a straightforward way to see if an investment is providing returns commensurate with or exceeding the overall market’s risk profile.
When to favor the Sortino Ratio
- If avoiding downside is paramount: For risk-averse investors, retirees, or endowments worried about capital preservation, the Sortino Ratio provides a clearer measure of performance in down markets.
- Strategies with asymmetric return profiles: Certain hedge fund or options-based strategies, where upside and downside volatilities are not symmetrical, might be better analyzed using a measure that focuses on downside deviations.
- Customized performance hurdles: If you have a specific return target in mind (e.g., “I must earn at least 5% to meet my liabilities”), using that target as the MAR in the Sortino Ratio can give you an exact measure of how well a strategy meets that need.
Practical Applications and Examples
To really see the difference between these two metrics in action, let’s consider a side-by-side example involving two hypothetical funds: Fund A and Fund B.
Hypothetical Return Profiles
- Fund A
- Average annual return: 15%
- Risk-free rate: 2%
- Standard deviation: 12%
- Downside deviation (below 2%): 9%
- Fund B
- Average annual return: 12%
- Risk-free rate: 2%
- Standard deviation: 8%
- Downside deviation (below 2%): 6%
Sharpe Ratios
Sharpe Ratio (Fund A)
(15% − 2% ) / 12% = 13% / 12% ≈ 1.08
Sharpe Ratio (Fund B)
(12% − 2%) / 8% = 10% / 8% = 1.25
From the Sharpe Ratio perspective, Fund B has a higher ratio (1.25) compared to Fund A (1.08), implying Fund B offers better risk-adjusted returns when considering total volatility.
Sortino Ratios
Sortino Ratio (Fund A)
(15% − 2%) / 9% = 13% / 9% ≈ 1.44
Sortino Ratio (Fund B)
(12% − 2%) / 6% = 10% / 6% ≈ 1.67
Fund B still shows a higher Sortino Ratio (1.67) compared to Fund A (1.44). In this example, both ratios suggest that Fund B has better risk-adjusted performance, regardless of how risk is defined. However, imagine if Fund A’s returns were more skewed toward upside volatility, such that the standard deviation was high but the downside deviation was not as high. The Sortino Ratio might then make Fund A look relatively more attractive than the Sharpe Ratio does.
Integrating the Sortino Ratio into a Risk Management Strategy

Integrating the Sortino Ratio into a broader risk management strategy involves several steps:
- Define your minimum acceptable return (MAR)
- This could be the risk-free rate, a required rate of return to meet liabilities, or a personal target based on your goals.
- Keep in mind that changing this threshold will alter the ratio significantly.
- Monitor the ratio over time
- A single snapshot of the Sortino Ratio might not give you the full picture. Track how the ratio changes across different market environments.
- Look at both short-term and long-term Sortino Ratios to see how the strategy performs in various conditions (e.g., bull markets, bear markets, high-volatility periods).
- Use alongside other metrics
- The Sortino Ratio should not be the sole criterion for making investment decisions. Combine it with the Sharpe Ratio, maximum drawdown, Value-at-Risk (VaR), or conditional VaR to get a holistic view of risk and return.
- Assess strategy changes
- If a strategy experiences more downside risk than anticipated, you might need to adjust your asset allocation, add hedges, or diversify further to improve the Sortino Ratio.
By focusing on downside deviation, you essentially optimize your portfolio to minimize severe losses while still aiming for strong upside potential.
Comparisons with Other Risk Measures
While the Sharpe Ratio and Sortino Ratio are two of the most prominent risk-adjusted metrics, there are other ratios worth noting.
1. Treynor Ratio
Definition: The Treynor Ratio uses beta (a measure of systematic risk relative to a benchmark such as the S&P 500) instead of standard deviation.
Formula:
Treynor Ratio = (Rp − Rf) / βp
Use Case: This metric is helpful for investors who want to measure how well a portfolio manager navigates market risk (systematic risk) rather than total volatility.
2. Calmar Ratio
Definition: The Calmar Ratio compares annualized rate of return with the maximum drawdown over the same period.
Formula:
Calmar Ratio = Annualized Return / Maximum Drawdown
Use Case: Particularly popular with hedge funds and commodities trading advisors, the Calmar Ratio emphasizes drawdown risk—how bad the worst peak-to-trough decline can get.
While these ratios offer different lenses on risk, the Sortino Ratio remains one of the best metrics if your primary concern is avoiding or minimizing downside volatility.
Implementation in Different Asset Classes

Both the Sharpe and Sortino Ratios can be applied across a broad range of asset classes. However, their interpretations and typical values can differ, influenced by factors like liquidity, historical volatility, and market structure.
Stocks and Equity Portfolios
- High volatility, potential for significant drawdowns
Stocks, particularly smaller-cap equities, can experience large swings. - Industry-specific factors
Tech stocks vs. utility stocks can have markedly different risk profiles. - Downside focus
During market downturns, stocks can lose value rapidly, making the Sortino Ratio quite relevant for measuring how well an equity portfolio protects against downside risk.
Bonds and Fixed Income
- Generally lower volatility
Bonds, especially government bonds, often have lower volatility but also lower returns. - Interest rate risk
Changes in interest rates can affect bond prices significantly. - Relevance of the Sortino Ratio
For investors seeking stable income, focusing on downside risk (e.g., risk of capital erosion) is critical, making the Sortino Ratio a valuable tool.
Hedge Funds and Alternative Investments
- Asymmetric payoff structures
Many hedge funds use options or derivatives to generate returns. These instruments can have skewed return distributions, where standard deviation might not be the best risk measure. - High emphasis on downside protection
Hedge funds often tout their ability to preserve capital in down markets. The Sortino Ratio is frequently used in this space to showcase performance in bear markets or volatile conditions.
Cryptocurrencies and Digital Assets
- Extremely high volatility
Bitcoin and other cryptocurrencies can experience double-digit percentage moves in a single day. - Market immaturity
The crypto market is still developing, with unique market structures and significant regulatory uncertainty. - Need for tailored risk metrics
Given the extreme volatility, the Sortino Ratio can highlight how effectively a crypto-focused strategy navigates steep drops. Nevertheless, the Sharpe Ratio remains a benchmark for quick cross-asset comparisons.
Limitations and Common Pitfalls
No metric is perfect. Both the Sharpe Ratio and the Sortino Ratio come with limitations you should be aware of:
- Reliance on historical data
- Both metrics assume past performance is an indication of future risk. Market conditions can change, rendering historical metrics less predictive.
- Pitfall: Overfitting to historical data can lead to a false sense of security.
- Skewness and kurtosis
- Real-world returns can have fat tails (kurtosis) and asymmetrical distributions (skewness). Using standard or downside deviation may not capture the full picture of tail risks.
- Pitfall: Black Swan events can decimate a portfolio despite a high risk-adjusted metric.
- Time period sensitivity
- Both ratios can vary dramatically depending on the time period used. A good performance stretch can inflate the ratio, while a market downturn can deflate it.
- Pitfall: Cherry-picking timeframes may present a misleadingly optimistic or pessimistic ratio.
- Influence of outliers
- Extreme positive or negative returns in a small sample can skew the standard or downside deviation, affecting the ratio.
- Pitfall: A single outlier event can dominate the calculation, especially for short time frames.
- Subjectivity of the MAR (for the Sortino Ratio)
- Picking a higher MAR will reduce the Sortino Ratio, picking a lower MAR will boost it.
- Pitfall: Investors or fund managers may choose a MAR that flatters the ratio.
- Overemphasis on a single metric
- Neither the Sharpe Ratio nor the Sortino Ratio can fully encapsulate the complexities of risk.
- Pitfall: Relying solely on these metrics can neglect factors like liquidity risk, counterparty risk, or correlation risk.
These pitfalls underscore the importance of using multiple metrics in tandem, understanding the construction of each metric, and maintaining a healthy degree of skepticism when comparing published ratios.
Conclusion
The choice between the Sharpe Ratio and the Sortino Ratio boils down to what kind of volatility you’re most concerned about. If you believe that any kind of volatility—whether up or down—represents a risk to be measured and managed, the Sharpe Ratio remains a robust and universal benchmark. However, if negative returns are your primary worry, and you’re more tolerant of upside fluctuations, the Sortino Ratio offers a more nuanced view.
Emphasizing downside risk is particularly crucial for:
- Investors nearing or in retirement, where capital preservation is paramount.
- Highly risk-averse investors seeking to avoid large drawdowns.
- Strategies (like certain hedge funds) that focus on consistent, stable returns rather than capturing the full upside of bull markets.
Ultimately, savvy investors and traders use both metrics—and often many more—to form a holistic picture of performance and risk. A portfolio that boasts a solid Sharpe Ratio but has a mediocre Sortino Ratio might be taking on substantial downside risk. Conversely, a portfolio with a strong Sortino Ratio but a middling Sharpe Ratio may be too conservative, missing out on potentially profitable upside. Balancing these considerations is key to developing a strategy aligned with your financial goals, risk tolerance, and market outlook.
Frequently Asked Questions (FAQs)
1. Which metric is more widely used in the industry: Sharpe or Sortino?
The Sharpe Ratio is more widely used and reported, primarily due to its simplicity and historical dominance. However, the Sortino Ratio is growing in popularity, especially among those who prioritize downside protection.
2. Can the Sortino Ratio be negative?
Yes, the Sortino Ratio can be negative if the portfolio’s return RpR_p is lower than the MAR. A negative ratio indicates that you are not meeting your required minimum acceptable return.
3. How do I choose a Minimum Acceptable Return (MAR) for the Sortino Ratio?
The MAR can be:
- The risk-free rate (common in academic settings).
- Zero (especially if your goal is simply not to lose money).
- A specific target return (e.g., 5%, 7%, or 10%) depending on your financial goals.
4. What time frame should I use for calculating these ratios?
Time frame selection depends on investment horizon and market context:
- Long-term investors might look at 3-, 5-, or 10-year metrics.
- Traders might focus on shorter time frames (e.g., monthly or quarterly).
- Using multiple time frames can provide a more complete picture.
5. Is a higher Sharpe or Sortino Ratio always better?
Generally, yes—a higher ratio indicates better risk-adjusted returns. However, context matters. Some investors might be comfortable with a lower ratio if it aligns with other strategic goals, like liquidity or diversification.
6. How can these metrics be misused?
Common ways include:
- Cherry-picking time frames to inflate returns or downplay volatility.
- Ignoring distribution assumptions (i.e., data may not be normally distributed).
- Choosing an inappropriate MAR to artificially boost the Sortino Ratio.
7. Should I use both metrics together?
Yes. The Sharpe Ratio provides a broad overview of risk-adjusted returns (treating all volatility equally), while the Sortino Ratio zeroes in on downside risk. Using both can provide more insight into how a strategy performs under different market conditions.
8. How do leverage and derivatives affect these ratios?
Leverage and derivatives can amplify both returns and risk. While the ratios still apply, extreme returns can skew volatility calculations. It’s especially important to look beyond these ratios and understand the specific risk exposures when leverage or complex derivatives are involved.
9. Do professional fund managers publish their Sortino Ratios?
It depends. Many do publish their Sortino Ratios, especially if they manage low-volatility or downside-protected strategies. However, the Sharpe Ratio is more standard and thus more commonly reported across the industry.
10. Are there any automated tools or software to calculate these ratios?
Yes, many portfolio analysis platforms (e.g., Morningstar, Portfolio Visualizer, various hedge fund or CTA software) automatically calculate both the Sharpe and Sortino Ratios. You can also compute them in Excel or Python using libraries like pandas and numpy.
Final Thoughts
The Sortino Ratio vs. Sharpe Ratio debate is not an either/or proposition. Instead, these metrics should be viewed as complementary tools within your investment toolbox. By understanding how each ratio defines “risk,” you can choose the metric (or combination of metrics) that best aligns with your investment philosophy, goals, and tolerance for drawdowns.
Remember, focusing on downside risk can be a critical strategy for many investors, particularly when capital preservation is a priority. Whether you’re managing a retirement account, running a hedge fund, or simply looking to navigate volatile markets, the Sortino Ratio gives you an edge in identifying strategies that excel in minimizing downside losses while still providing competitive returns. Meanwhile, the Sharpe Ratio remains a universally accepted standard for quick and broad comparisons across diverse portfolios and asset classes.
Incorporating both ratios into your risk management approach will help you strike the right balance between capturing upside potential and protecting your portfolio from steep drawdowns—an essential consideration for long-term investment success.