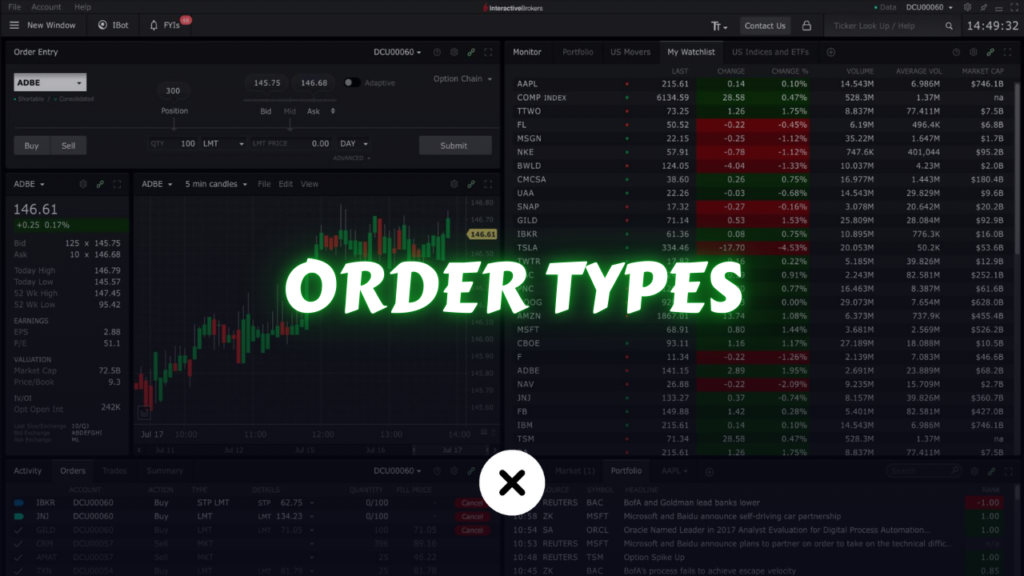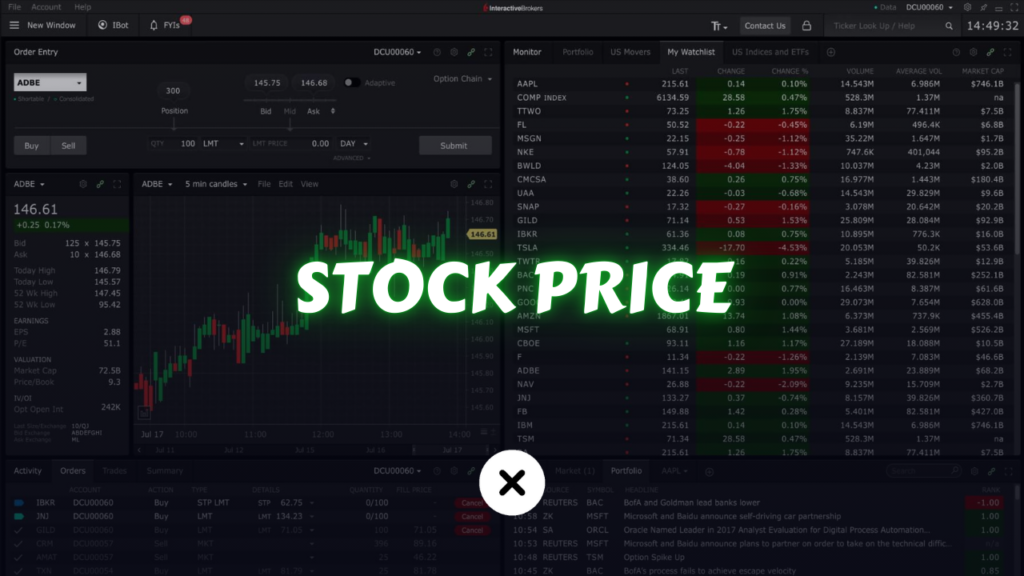
In the vast and ever-evolving world of the stock market, finding winning stocks may sometimes seem like searching for a needle in a haystack. With thousands of publicly listed companies, each having its own set of financial metrics, market sentiments, and unique business stories, it can feel overwhelming. Enter the concept of stock screening—an essential tool that provides structure, focus, and clarity to your investment strategy. This in-depth guide will walk you through everything you need to know about stock screening, including what it is, why it’s important, how to set up your own screening criteria, and how to interpret results like a pro.
This article is designed to be your ultimate resource for mastering stock screening, with clear examples and detailed explanations of every necessary topic. By the end, you’ll have the confidence to dive into the stock market, discover potential winning stocks, and refine your investment strategy to suit your financial goals. Let’s begin.
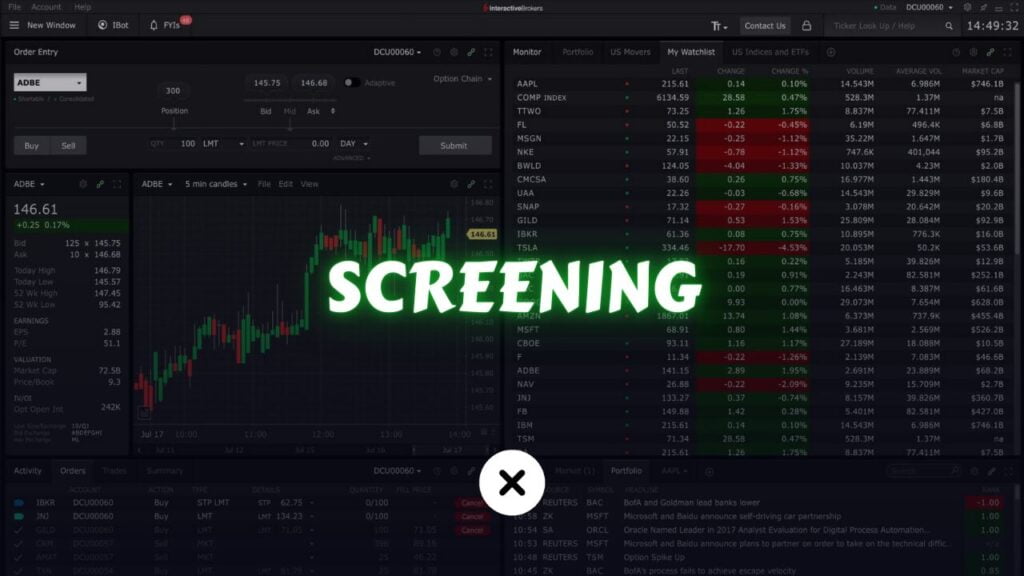
Understanding Stock Screening
Stock screening is the process of filtering stocks based on certain predefined criteria to find potential investment opportunities. Think of it as using a sieve to separate the stocks that meet your chosen parameters (like a low Price-to-Earnings (P/E) ratio or a high Return on Equity (ROE)) from the thousands of stocks that might not be as appealing for your particular strategy.
Stock screening typically involves:
- Using tools or platforms known as stock screeners (websites, software, or even Excel spreadsheets).
- Setting up criteria or filters based on financial metrics, industry, market capitalization, volatility, etc.
- Generating a shortlist of stocks for further analysis or immediate investment decisions.
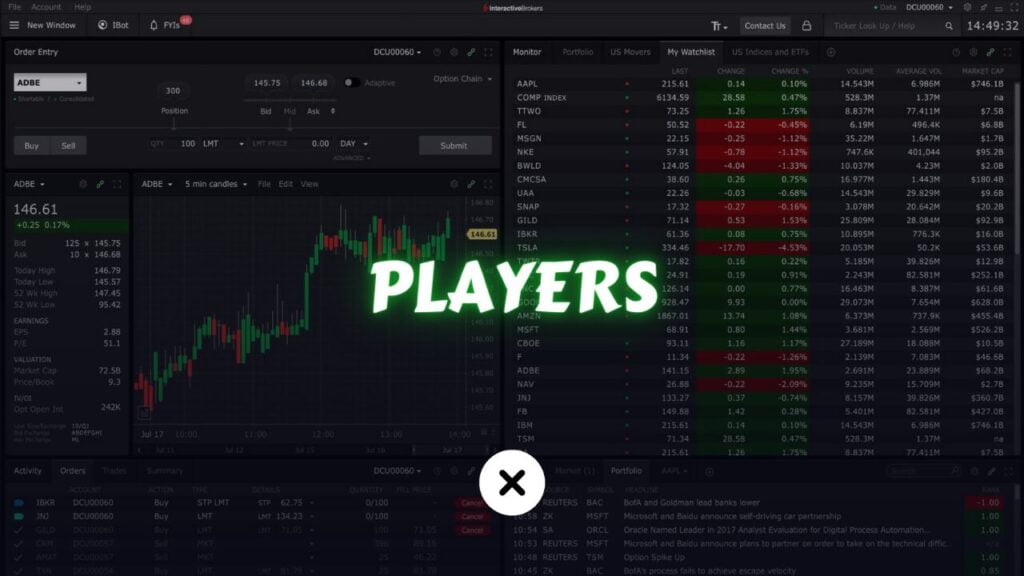
By narrowing the playing field, you can devote your time to analyzing the most relevant stocks and avoid the noise of the entire market.
Why Stock Screening Is Important
Investors use stock screening to gain an edge in the market by focusing on stocks that match their investment goals and risk tolerance. Below are the core reasons why stock screening should be an integral part of your investing process:
- Efficiency and Time-Saving
Researching every stock in the market is practically impossible. Screening helps you quickly eliminate stocks that don’t meet your minimum standards—thus saving you precious time. - Focus on Quality
By setting specific criteria, you’re homing in on stocks that meet your definition of “quality.” Whether you prioritize strong fundamentals, robust earnings, or rapid growth, your screening tool will extract only those that fit. - Risk Management
Screening criteria can incorporate risk-based metrics (like the debt-to-equity ratio or volatility measures), allowing you to exclude high-risk stocks if that doesn’t align with your goals. - Consistency and Discipline
An automated screener keeps you disciplined. Instead of making impulsive decisions based on emotion or market hype, you’re basing your decisions on data-driven filters. - Customization
You can tailor your screening to different strategies (value, growth, momentum, dividend, etc.) or combine multiple filters for a hybrid approach. The level of customization ensures you remain aligned with your investing philosophy.
Using a stock screener doesn’t guarantee you’ll find the “perfect” stock—no investment tool does—but it undoubtedly makes your search more targeted, comprehensive, and meaningful.
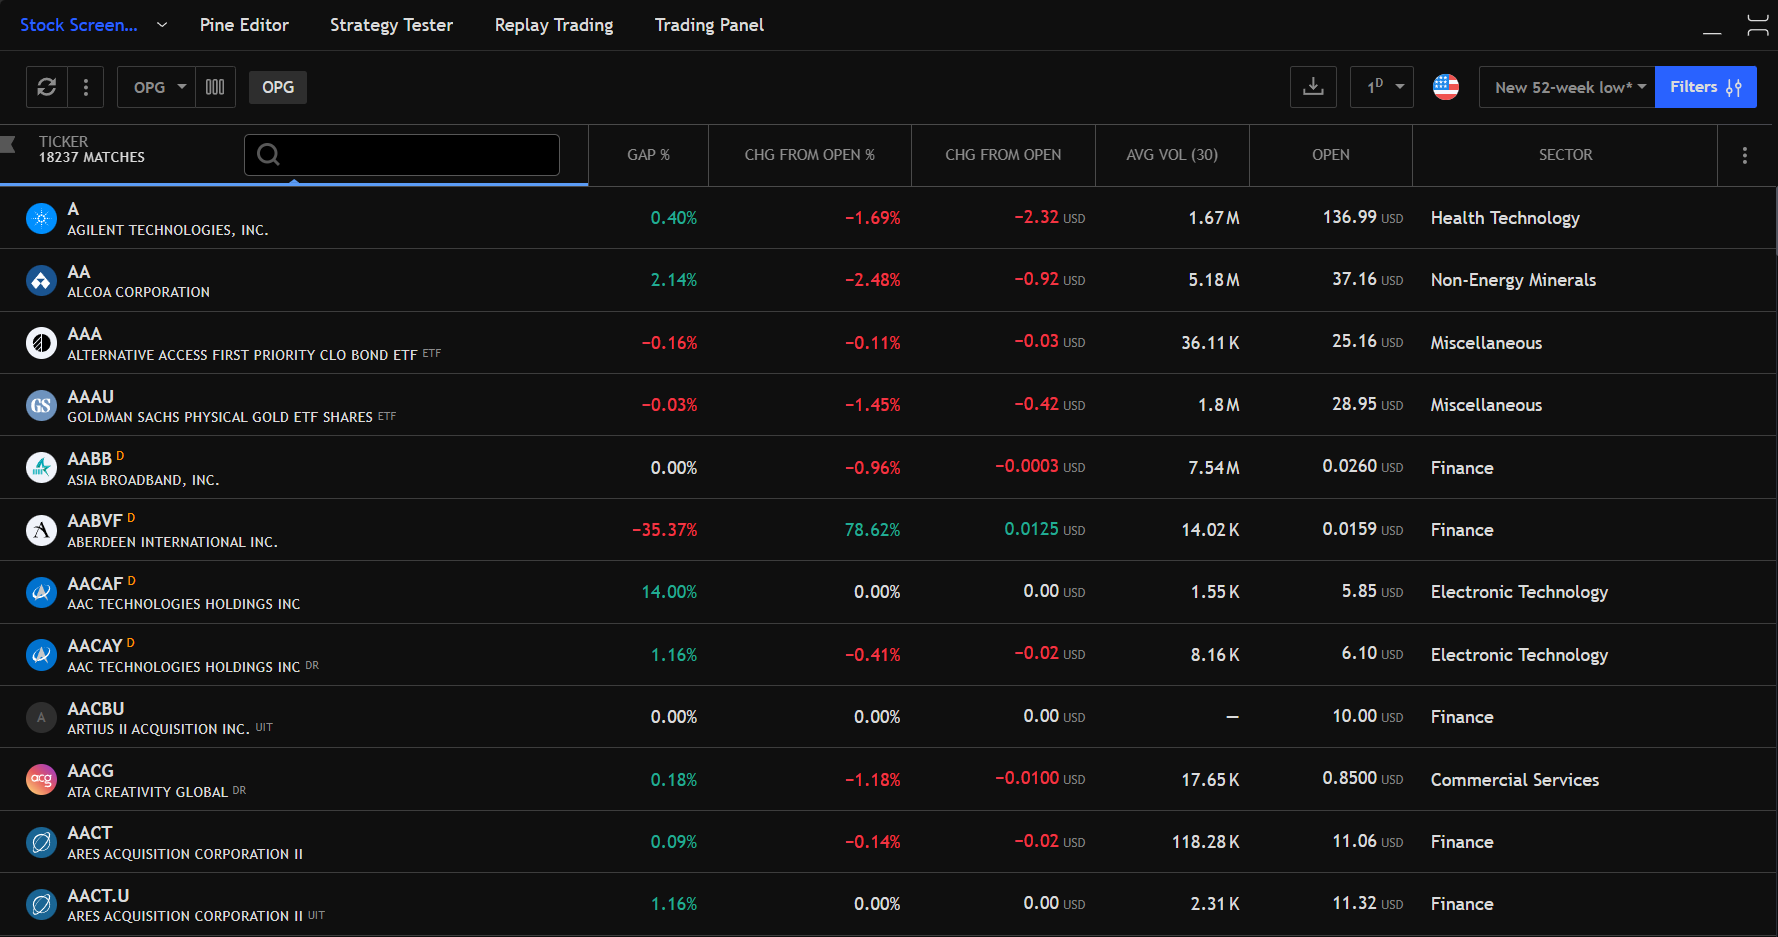
Key Components of a Stock Screener
A typical stock screener tool, whether free or subscription-based, has fundamental components that enable it to filter the universe of stocks. Understanding these components will help you make the most of whichever tool you choose:
- Database of Stocks
Stock screeners pull data from massive databases that track most, if not all, publicly traded companies on major exchanges. The size and quality of this database can vary depending on the screener’s coverage. - Filtering Criteria
This is where you enter your specific requirements (e.g., “P/E ratio < 20” or “Market Cap > $10B”). The screener’s engine will automatically sort through the entire database to find stocks matching these filters. - User Interface (UI) and User Experience (UX)
A good screener should be user-friendly, providing you with sliders, dropdown menus, or simple text fields to input your criteria. The UI should make it easy to adjust filters and view the filtered stocks. - Data Sources and Updates
Stock screener results are only as accurate as the data they rely on. The best screeners pull real-time or near real-time data from reliable sources. Others might rely on daily, weekly, or monthly updates. - Customization and Saved Screens
Many screeners allow you to save your customized filters (or “screens”) for future use or backtesting. This can save you from having to re-input metrics each time you want to run a similar query. - Additional Features
Some advanced screeners provide charting tools, analyst ratings, built-in calculators for intrinsic value, or educational resources on fundamental and technical analysis.
Understanding these components can help you select the right tool for your needs and ensure you’re making the most of its features.
Types of Stock Screening Methods
When it comes to screening for stocks, there are generally three broad categories of methodologies you can use: fundamental analysis screeners, technical analysis screeners, and hybrid screeners. Let’s examine each in detail.
Fundamental Analysis Screeners
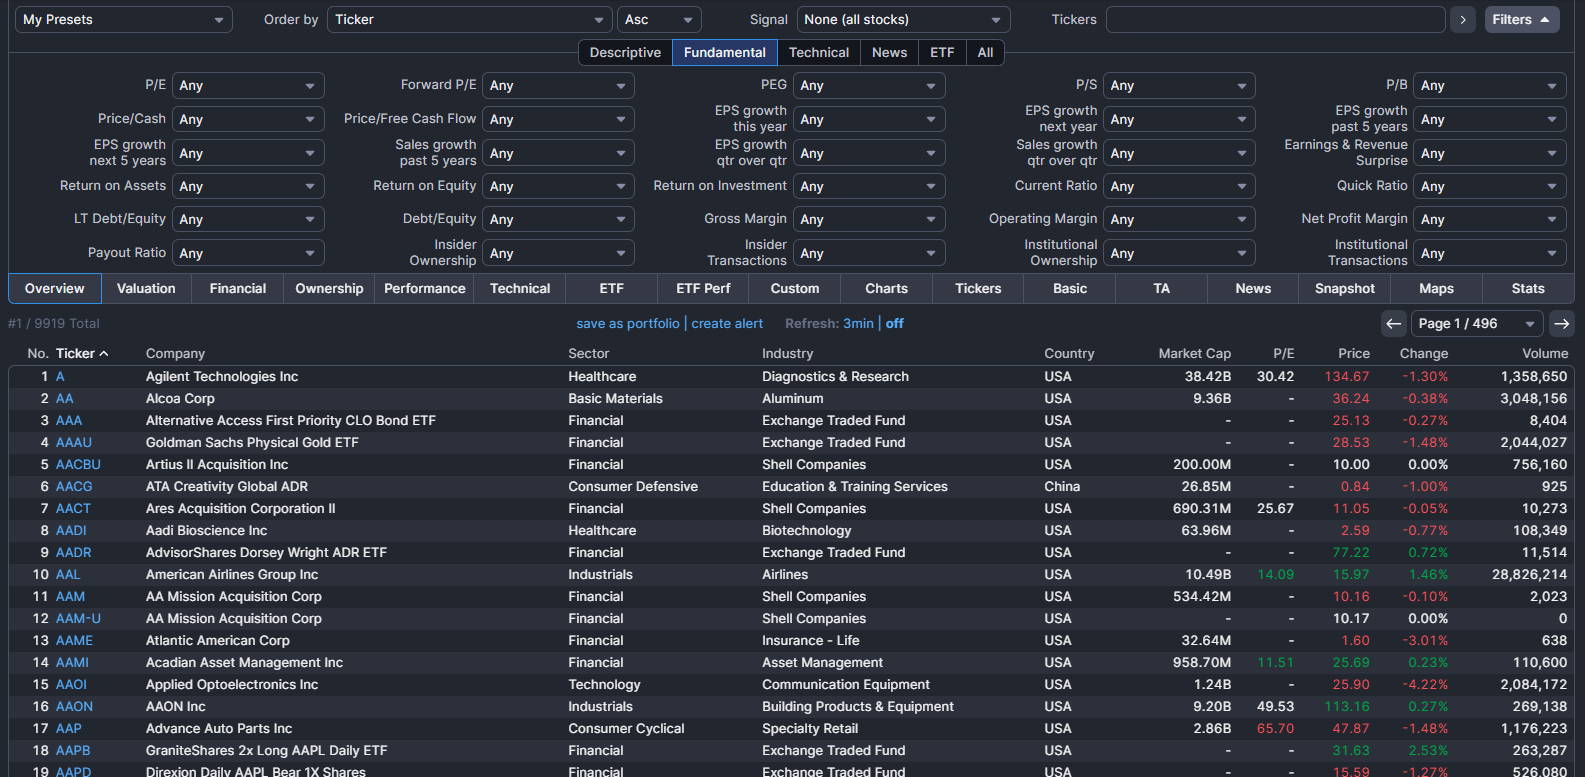
A fundamental analysis screener filters stocks based on financial health, profitability, and valuation. Here, metrics like P/E ratio, EPS growth, Return on Equity (ROE), and Debt-to-Equity ratio often come into play. Fundamental screeners help you find companies that align with specific fundamental qualities, such as strong earnings, low debt, or high profit margins.
- Who should use it?
Investors with a long-term focus looking to buy undervalued or high-growth companies. Value investors, for instance, might focus on low P/E ratios or strong free cash flow, while growth investors might look for high EPS growth rates. - Advantages
- Focuses on intrinsic business value.
- Ideal for buy-and-hold strategies and long-term stability.
- Helps in identifying fundamentally strong companies.
- Disadvantages
- Does not account for short-term price movements.
- Sometimes, changing market sentiment can keep undervalued stocks low for an extended period.
Technical Analysis Screeners
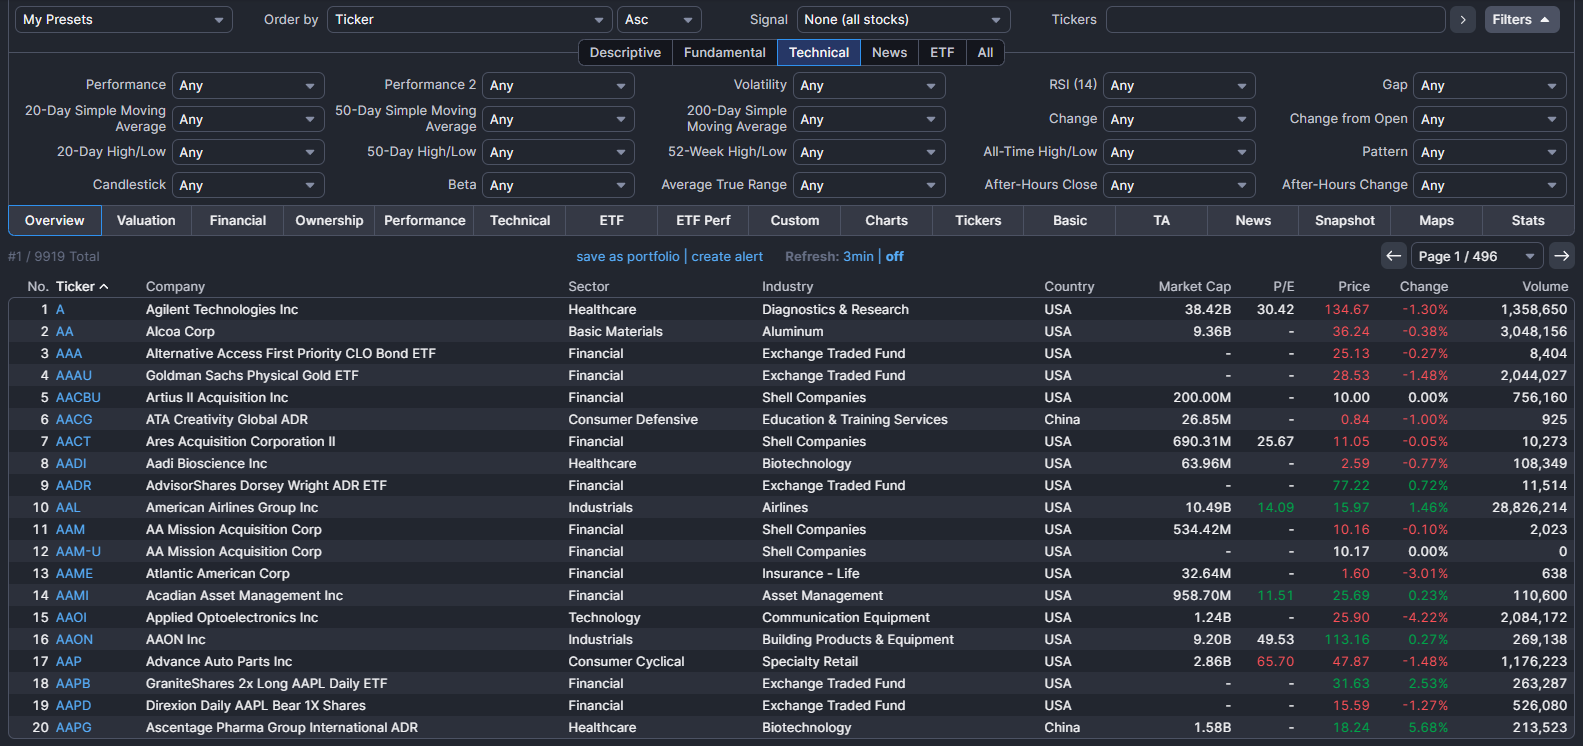
Technical analysis screeners focus on price action, volume, and chart patterns. Here, you might filter stocks based on moving averages (e.g., stocks currently trading above their 50-day moving average), Relative Strength Index (RSI), MACD crossovers, support/resistance levels, or other technical indicators.
- Who should use it?
Traders and short-term investors who believe that price trends and market psychology are reflected in a stock’s price and volume data. Momentum traders and swing traders often rely heavily on technical indicators. - Advantages
- Ideal for timing entries and exits in short- to medium-term trades.
- Quickly identifies trending or breakout stocks.
- Disadvantages
- Purely focuses on historical price and volume data.
- May overlook fundamental weaknesses or unsustainable company conditions.
Hybrid Screeners
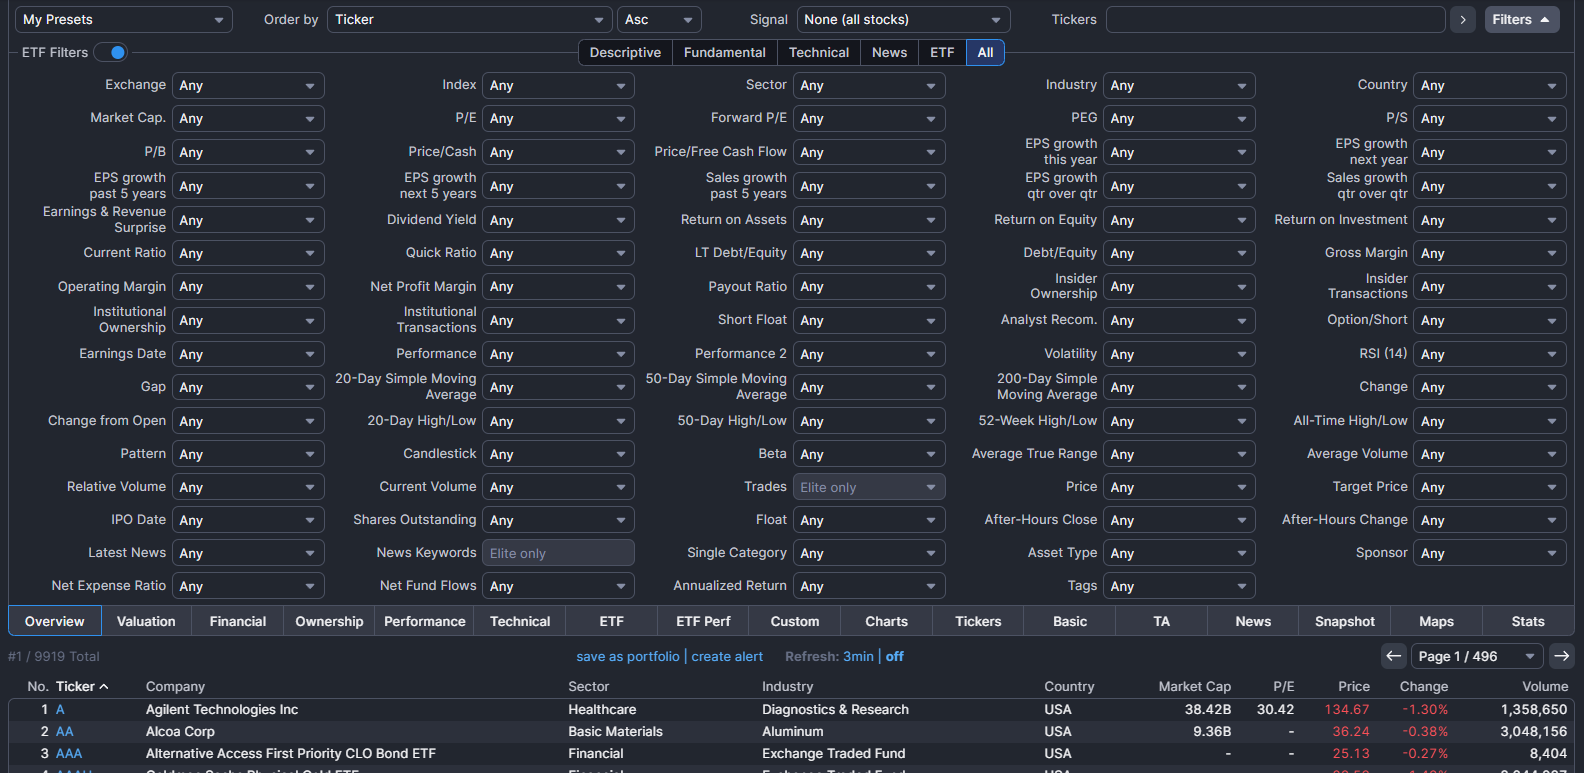
Hybrid screeners combine both fundamental and technical metrics. For example, you might look for stocks with low P/E ratios (fundamental) that are also trading above their 50-day moving average (technical). This approach can give a more holistic view of whether the stock is both fundamentally strong and currently performing well in the market.
- Who should use it?
Investors who want a comprehensive approach, balancing long-term metrics with short-term market signals. - Advantages
- Captures both the intrinsic value and market momentum.
- Can potentially reduce risk by ensuring that a stock is not only cheap or strong on paper but also showing positive price trends.
- Disadvantages
- Requires more complex analysis and understanding of both fundamental and technical factors.
- May reduce the pool of available stocks, sometimes leading to very few potential picks.
Essential Financial Metrics and Ratios
Regardless of which screening method you prefer, you’ll likely rely on core financial metrics to evaluate the attractiveness of a stock. Below are the must-know metrics and ratios for effective screening.
Earnings per Share (EPS)
Earnings per Share (EPS) is a company’s net income divided by the number of its outstanding shares. It gives you an idea of the profitability on a per-share basis.
Formula:
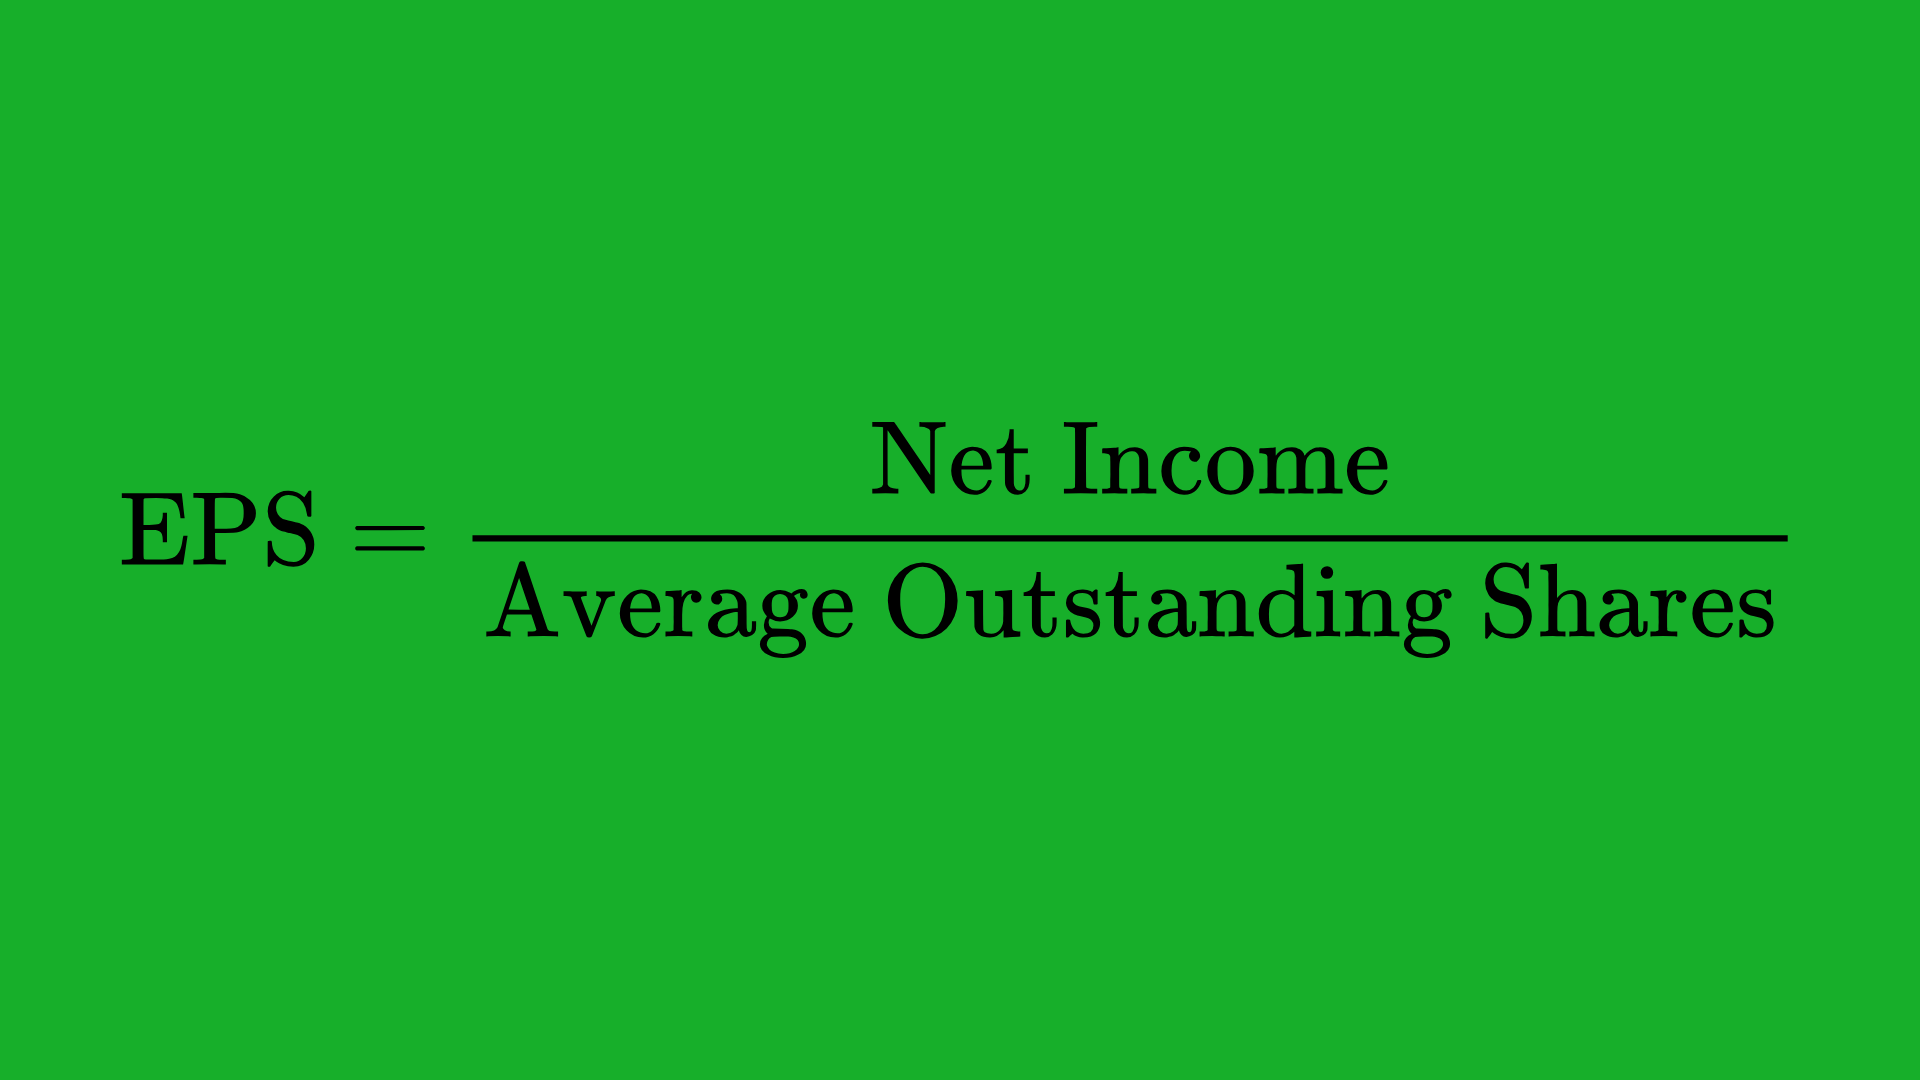
Why it matters:
The higher the EPS, the more profit the company is generating for each share. Consistent EPS growth over time often signals a company’s strong operating performance.
Price-to-Earnings (P/E) Ratio
The P/E ratio measures how much you pay (in terms of share price) for each dollar of earnings the company generates.
Formula:
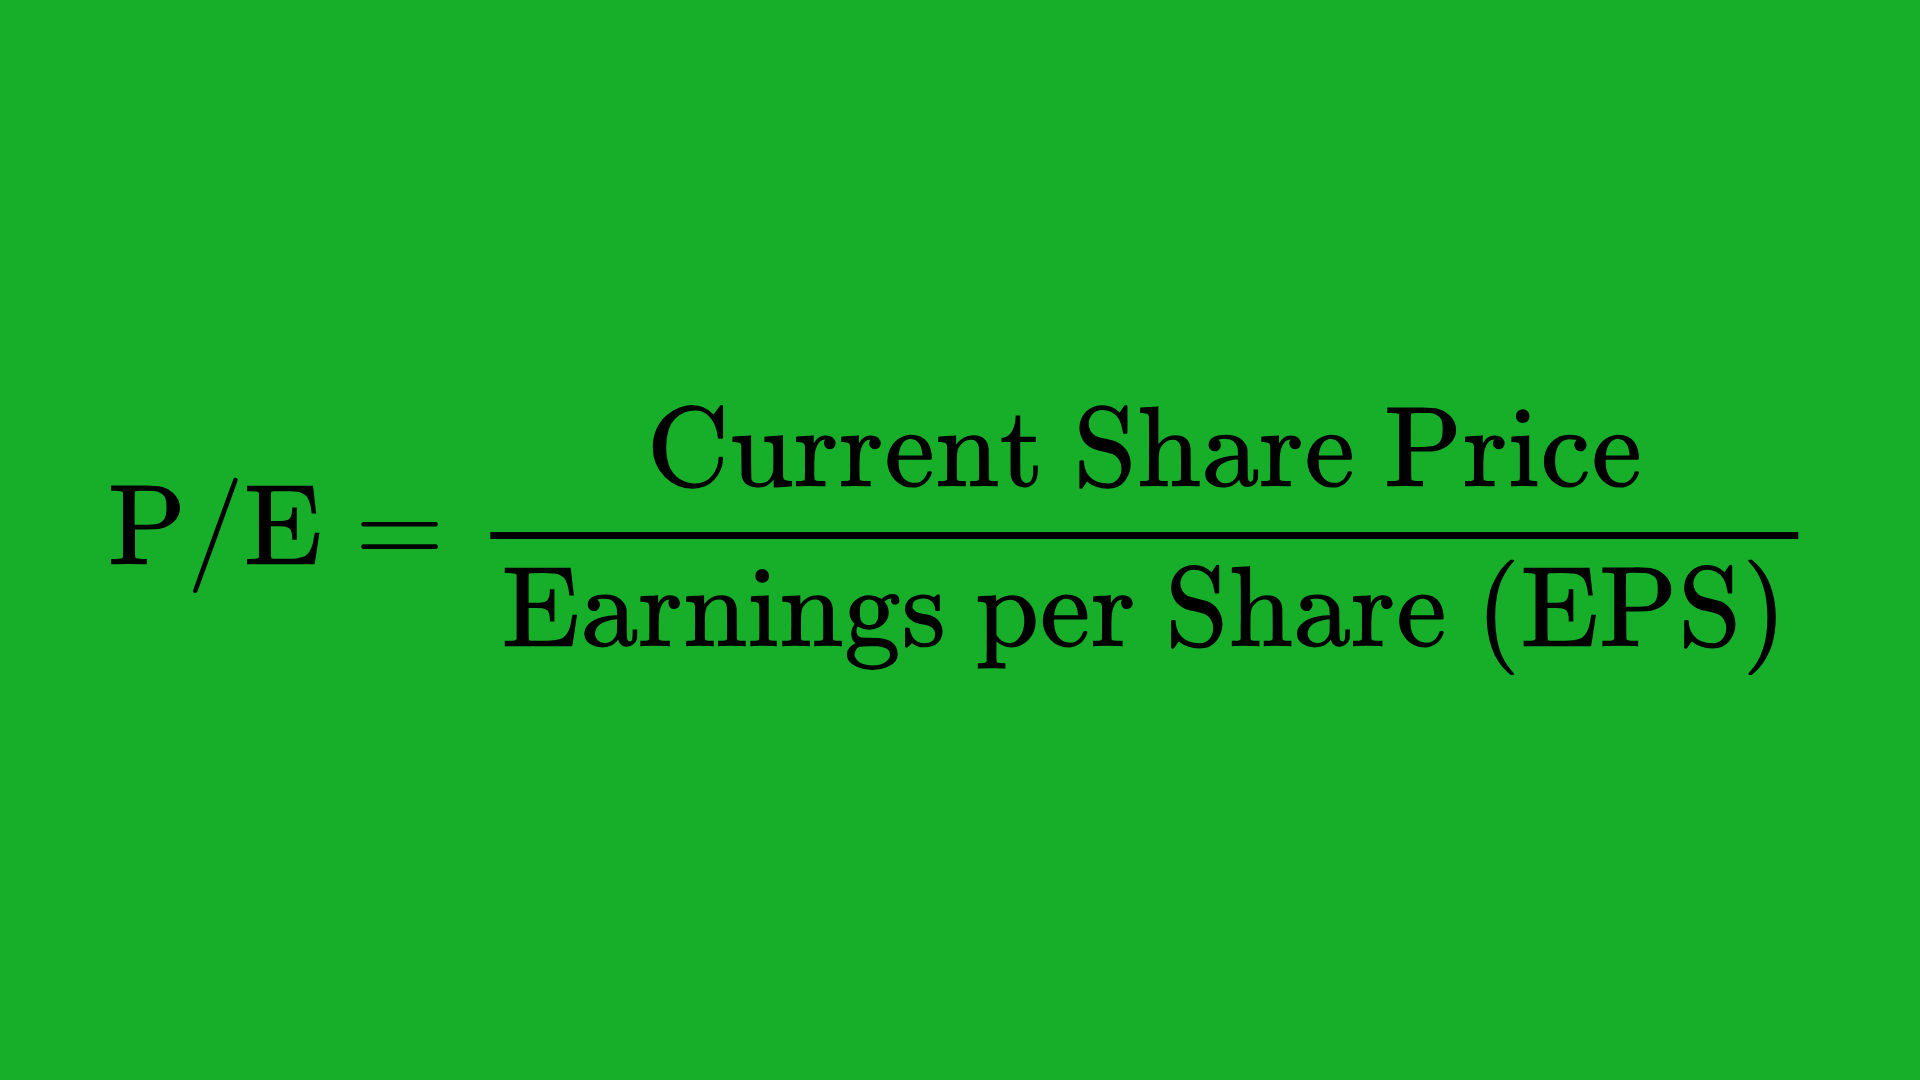
Interpretation:
A high P/E can mean the market expects strong future growth, but it could also mean the stock is overpriced. A low P/E can indicate a potential bargain—or a company with pessimistic growth prospects.
Return on Equity (ROE)
Return on Equity indicates how effectively a company’s management is using shareholders’ equity to generate profits.
Formula:
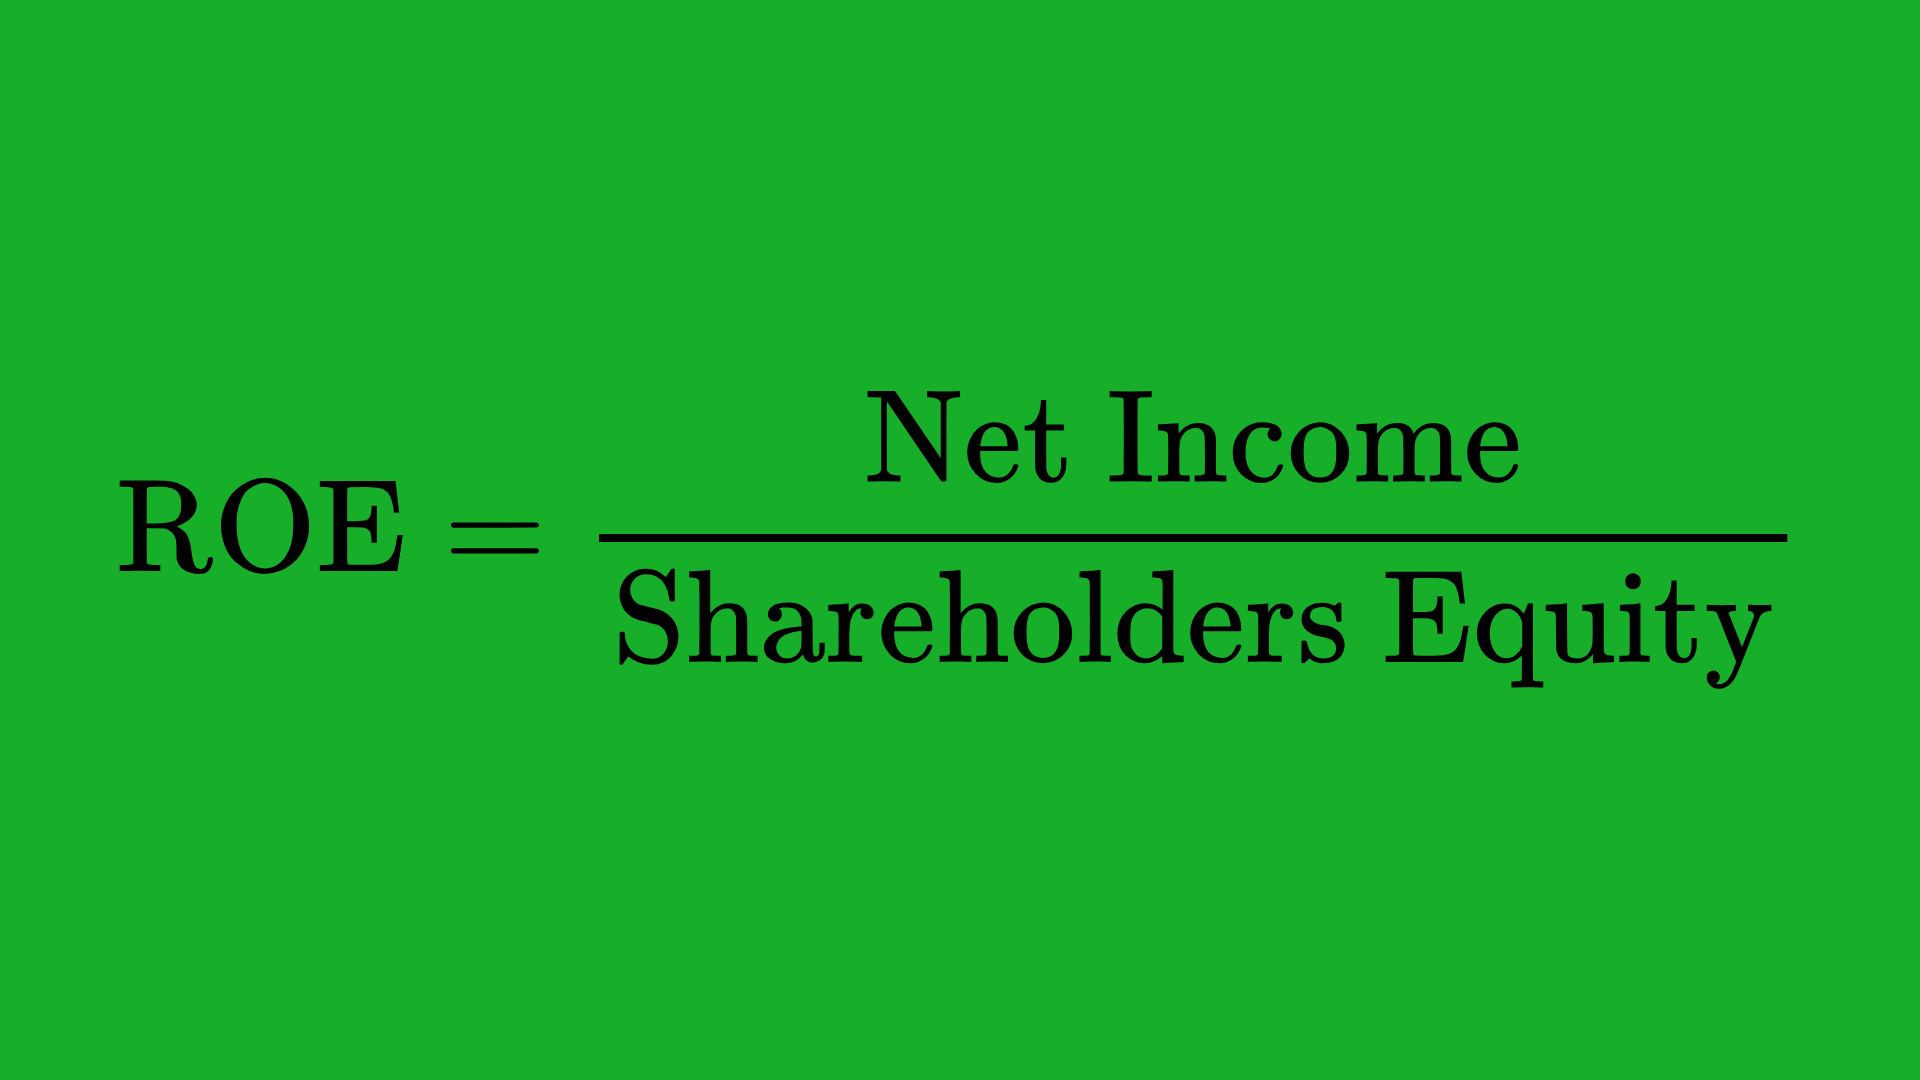
Significance:
A high ROE means the company is efficient at generating profits from the money shareholders have invested. It’s particularly useful when comparing companies in the same industry.
Debt-to-Equity (D/E) Ratio
Debt-to-Equity measures how much debt a company uses compared to its equity.
Formula:
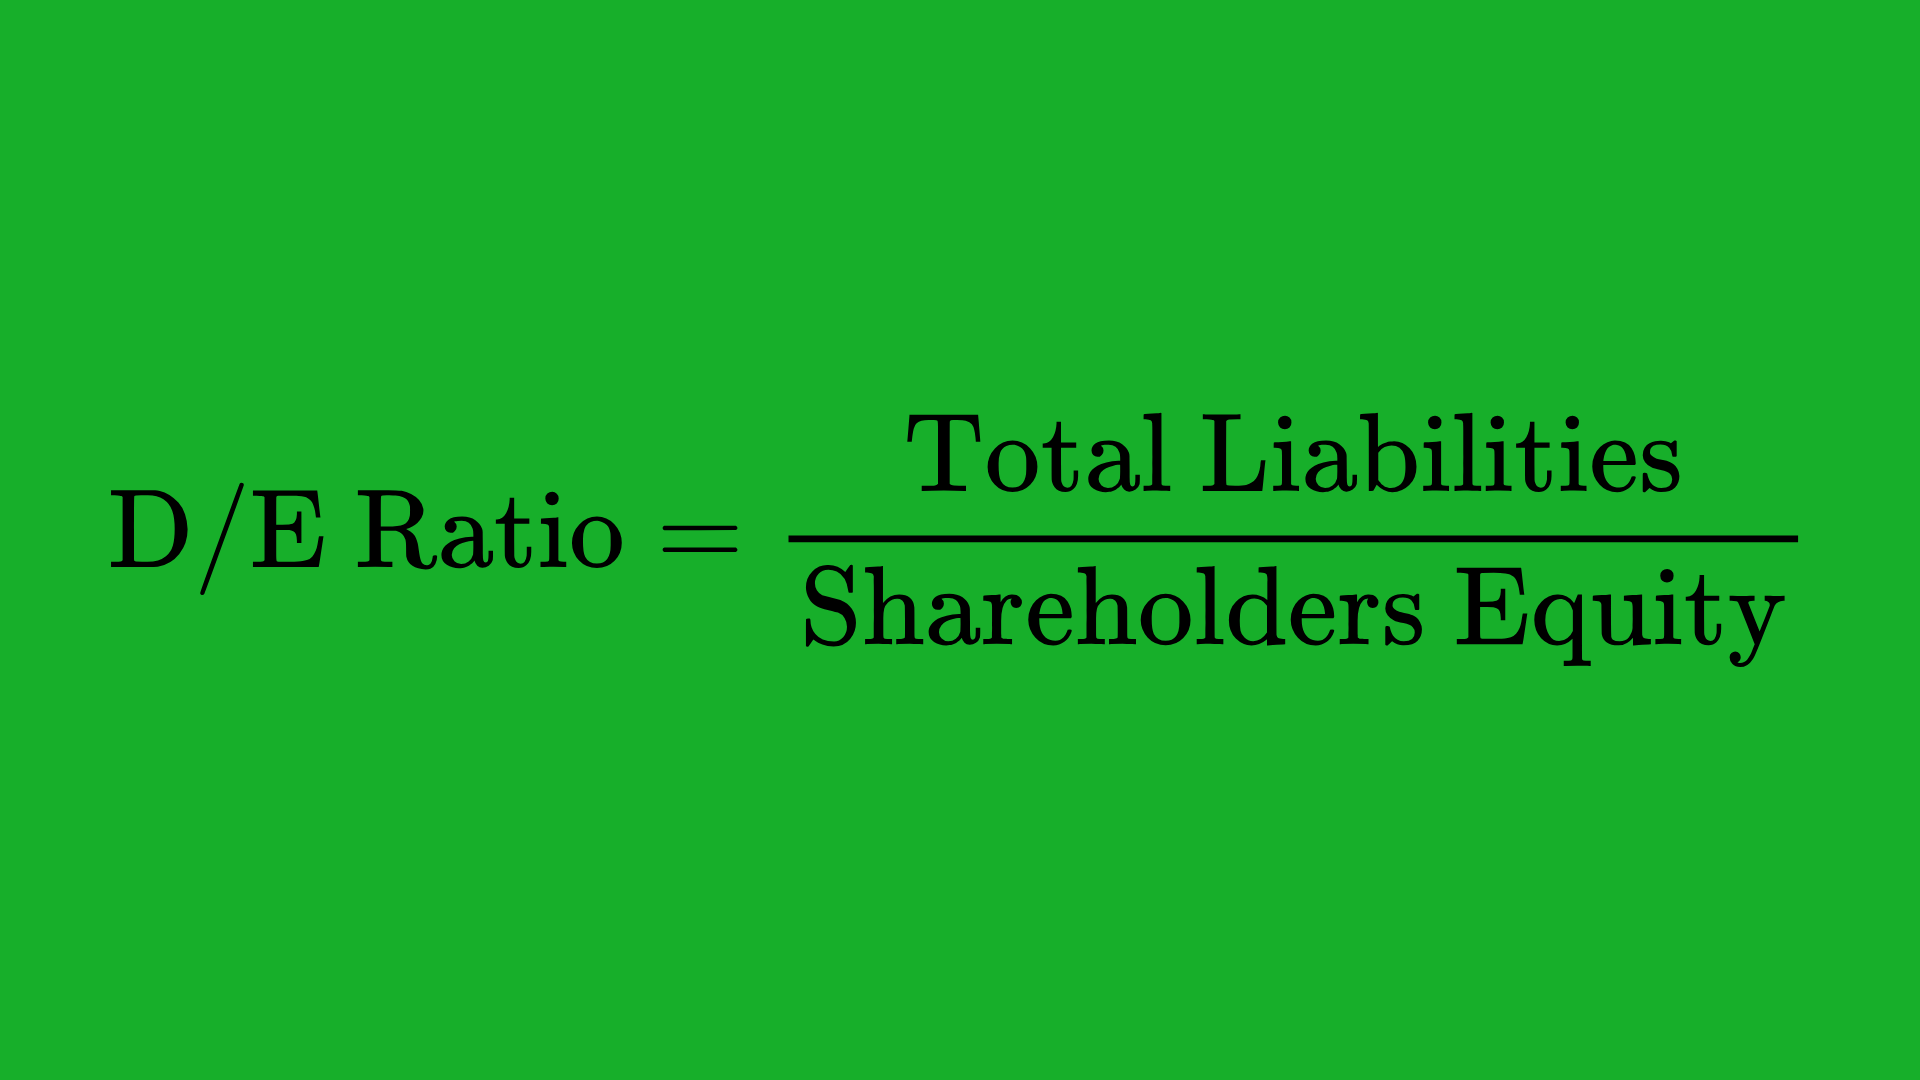
Implication:
A high D/E ratio can mean the company relies heavily on borrowed money, which could be risky in times of rising interest rates or declining revenues. A lower D/E often indicates a more conservative balance sheet.
Price-to-Book (P/B) Ratio
The P/B ratio compares a company’s market value to its book value (assets minus liabilities).
Formula:
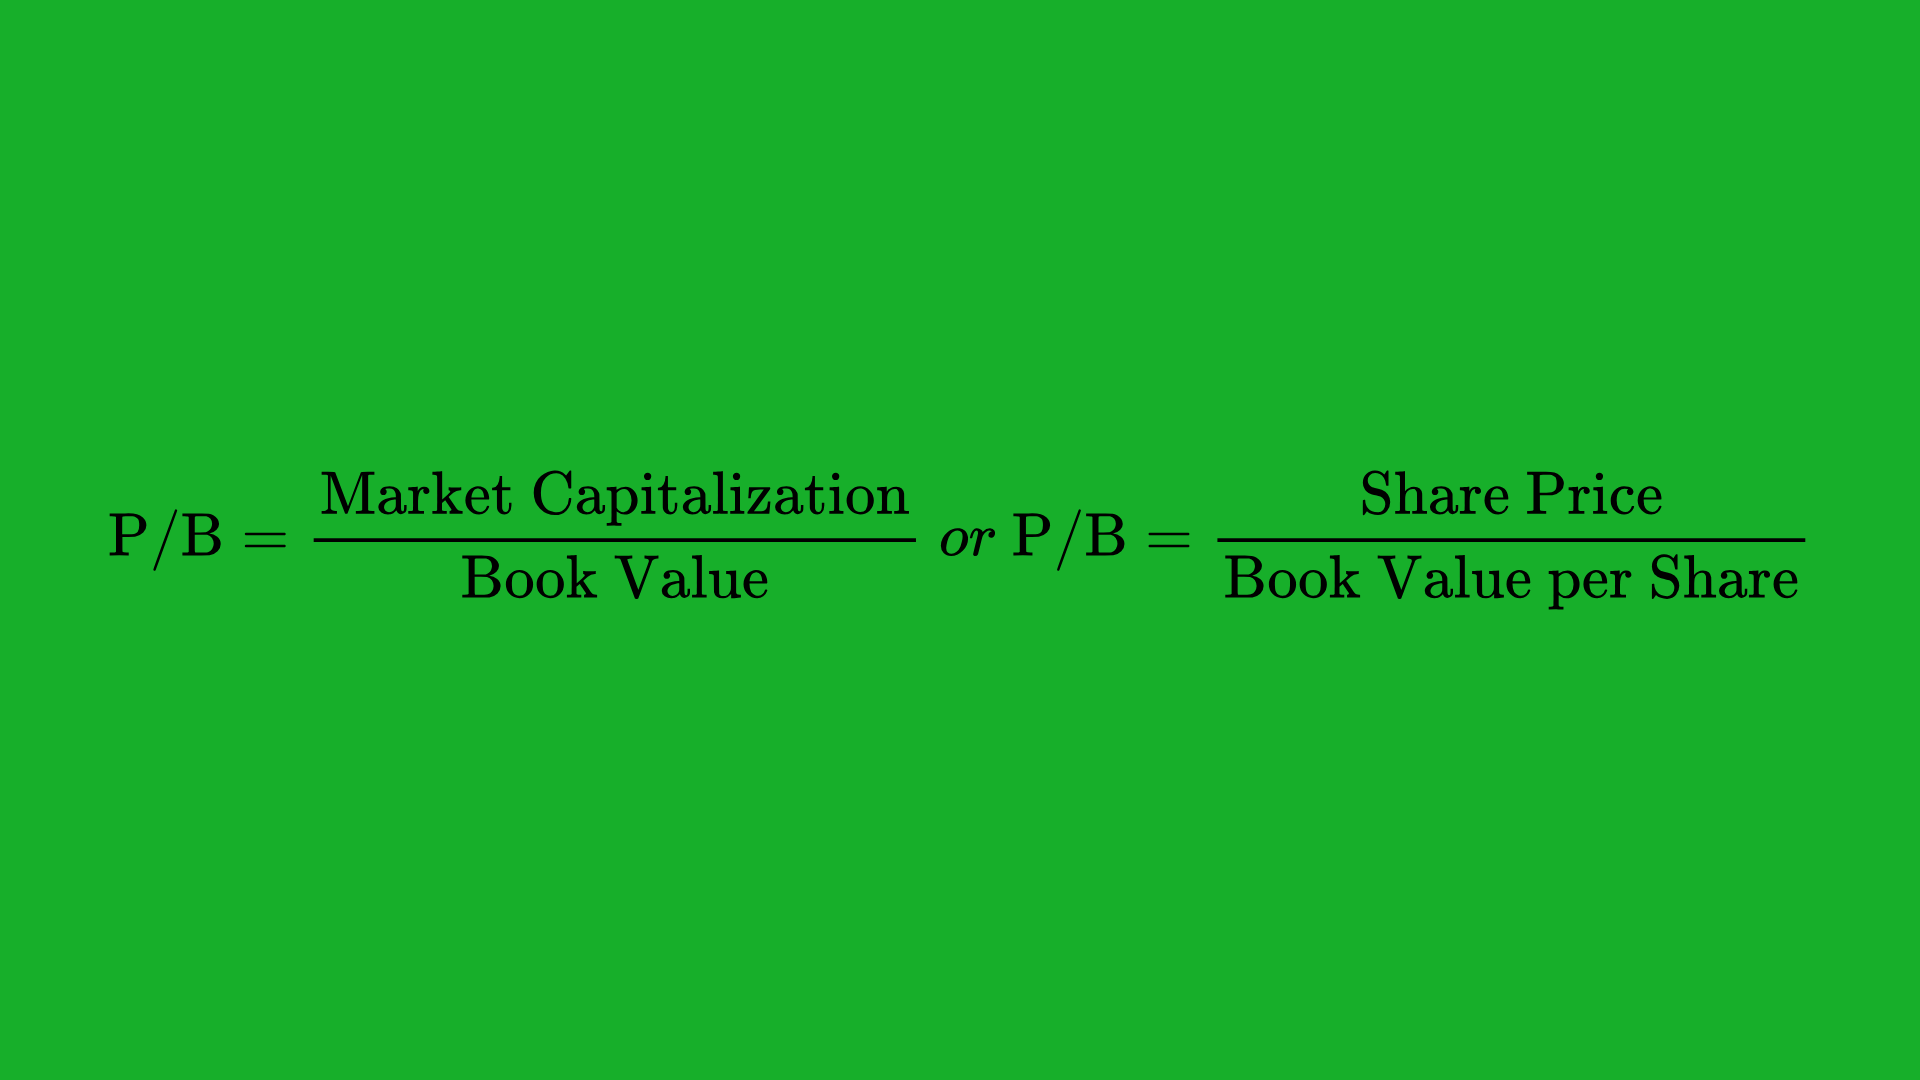
Usage:
A P/B ratio < 1 can indicate the stock may be trading below its intrinsic value. However, some industries naturally carry higher or lower P/B ratios, so context is key.
Dividend Yield
Dividend yield shows the percentage return a shareholder gets in the form of dividends relative to the current share price.
Formula:
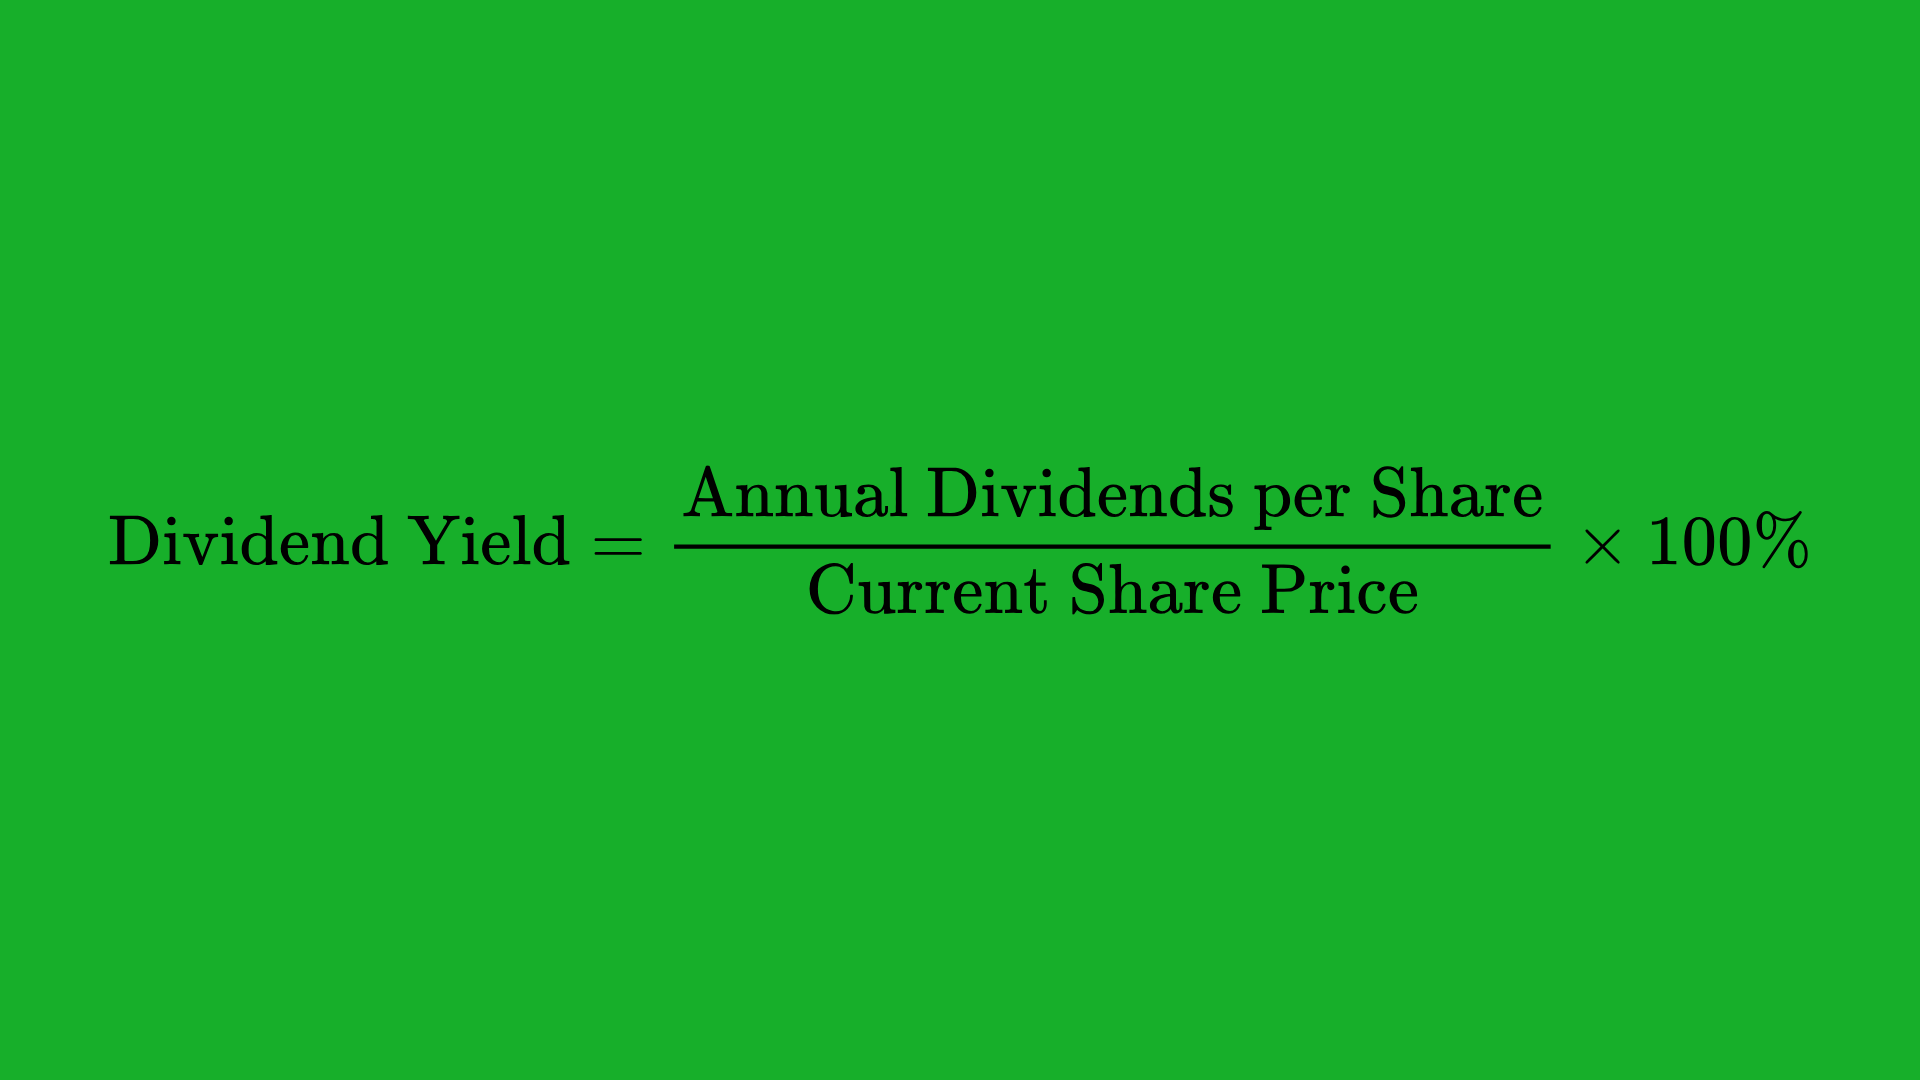
Why it matters:
Investors looking for steady income often prioritize stocks with high, stable dividend yields. However, an unusually high yield can be a red flag if it’s not sustainable.
Market Capitalization
Market capitalization (or “market cap”) represents the total value of a company’s outstanding shares:
Formula:
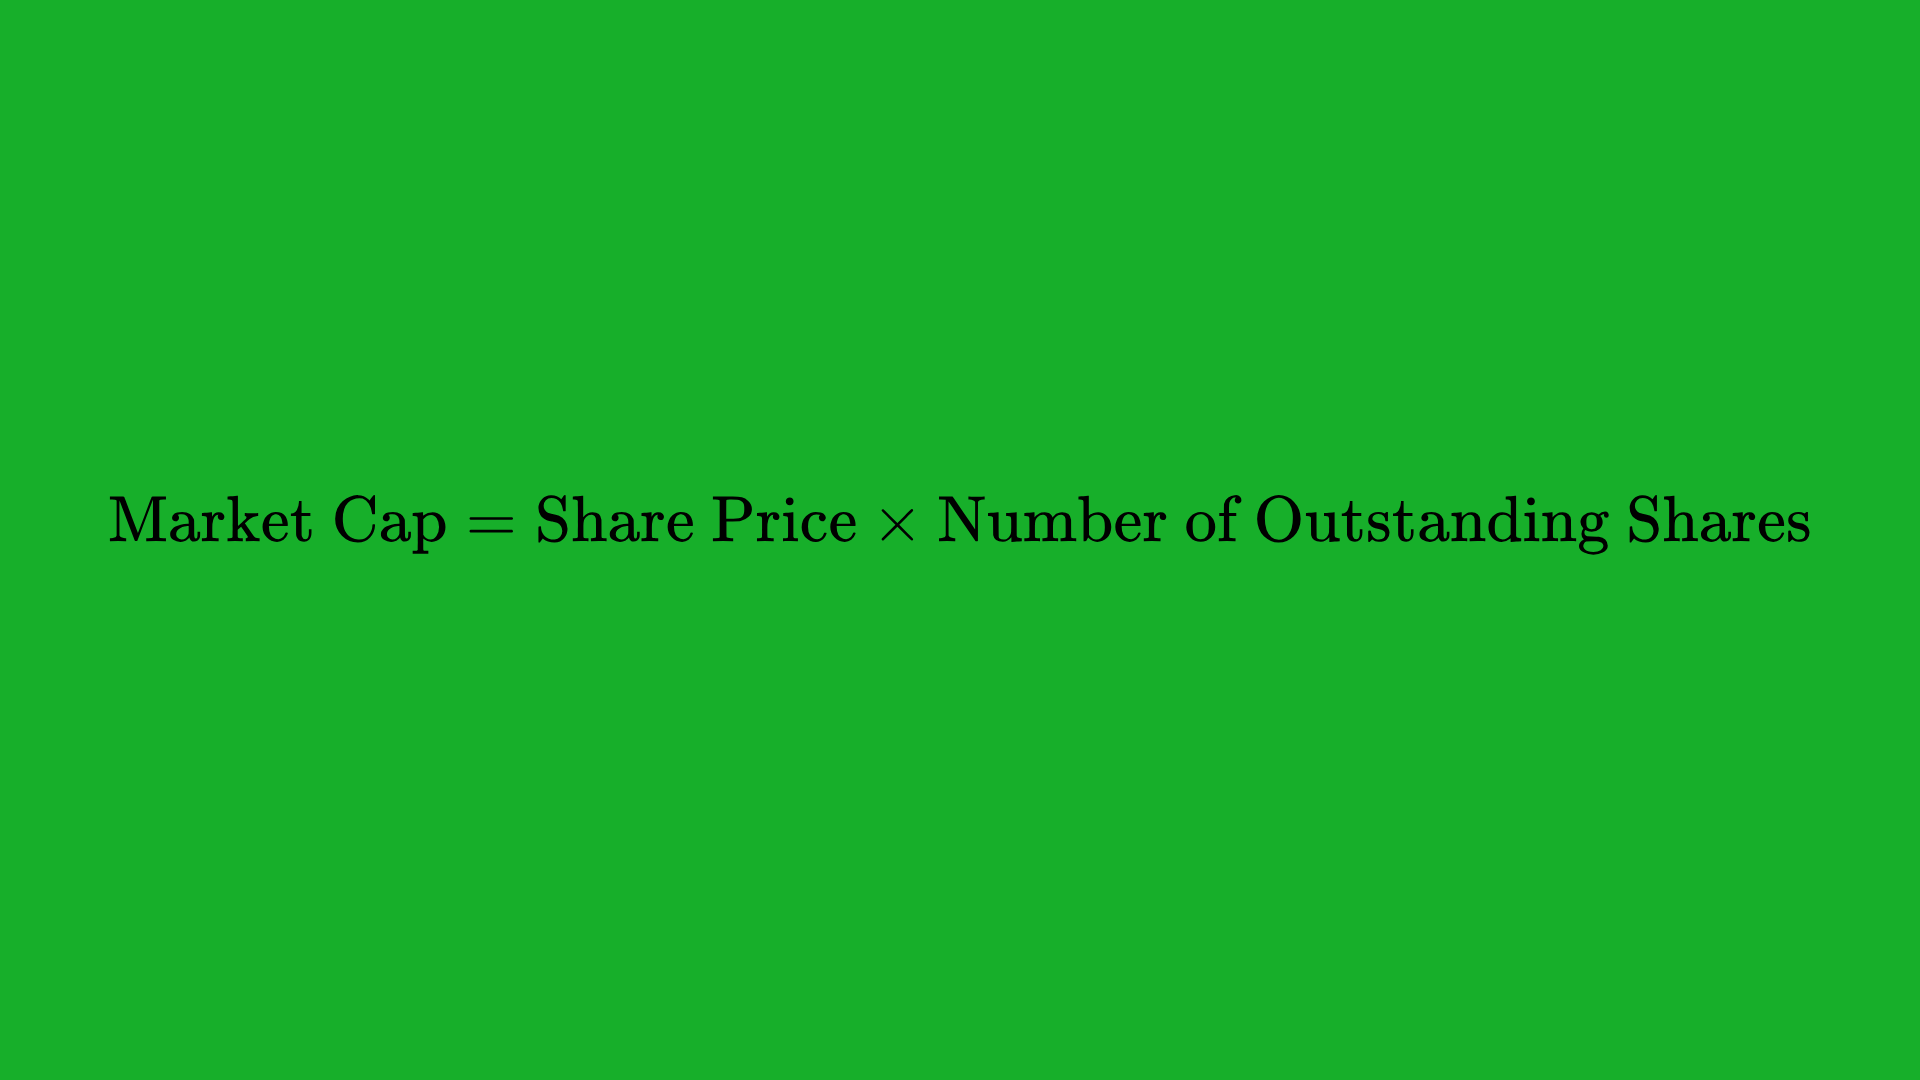
Investment style:
- Large-cap stocks ($10+ billion) are often considered more stable.
- Mid-cap stocks ($2–$10 billion) balance stability with growth potential.
- Small-cap stocks (<$2 billion) are riskier but may have higher growth prospects.
Advanced Metrics for Deeper Insights
For investors who want to go beyond the basics, several advanced metrics provide deeper insights into a company’s operational efficiency, profitability, and overall valuation.
PEG Ratio
The Price/Earnings to Growth (PEG) ratio enhances the classic P/E ratio by factoring in the expected earnings growth rate.
Formula:
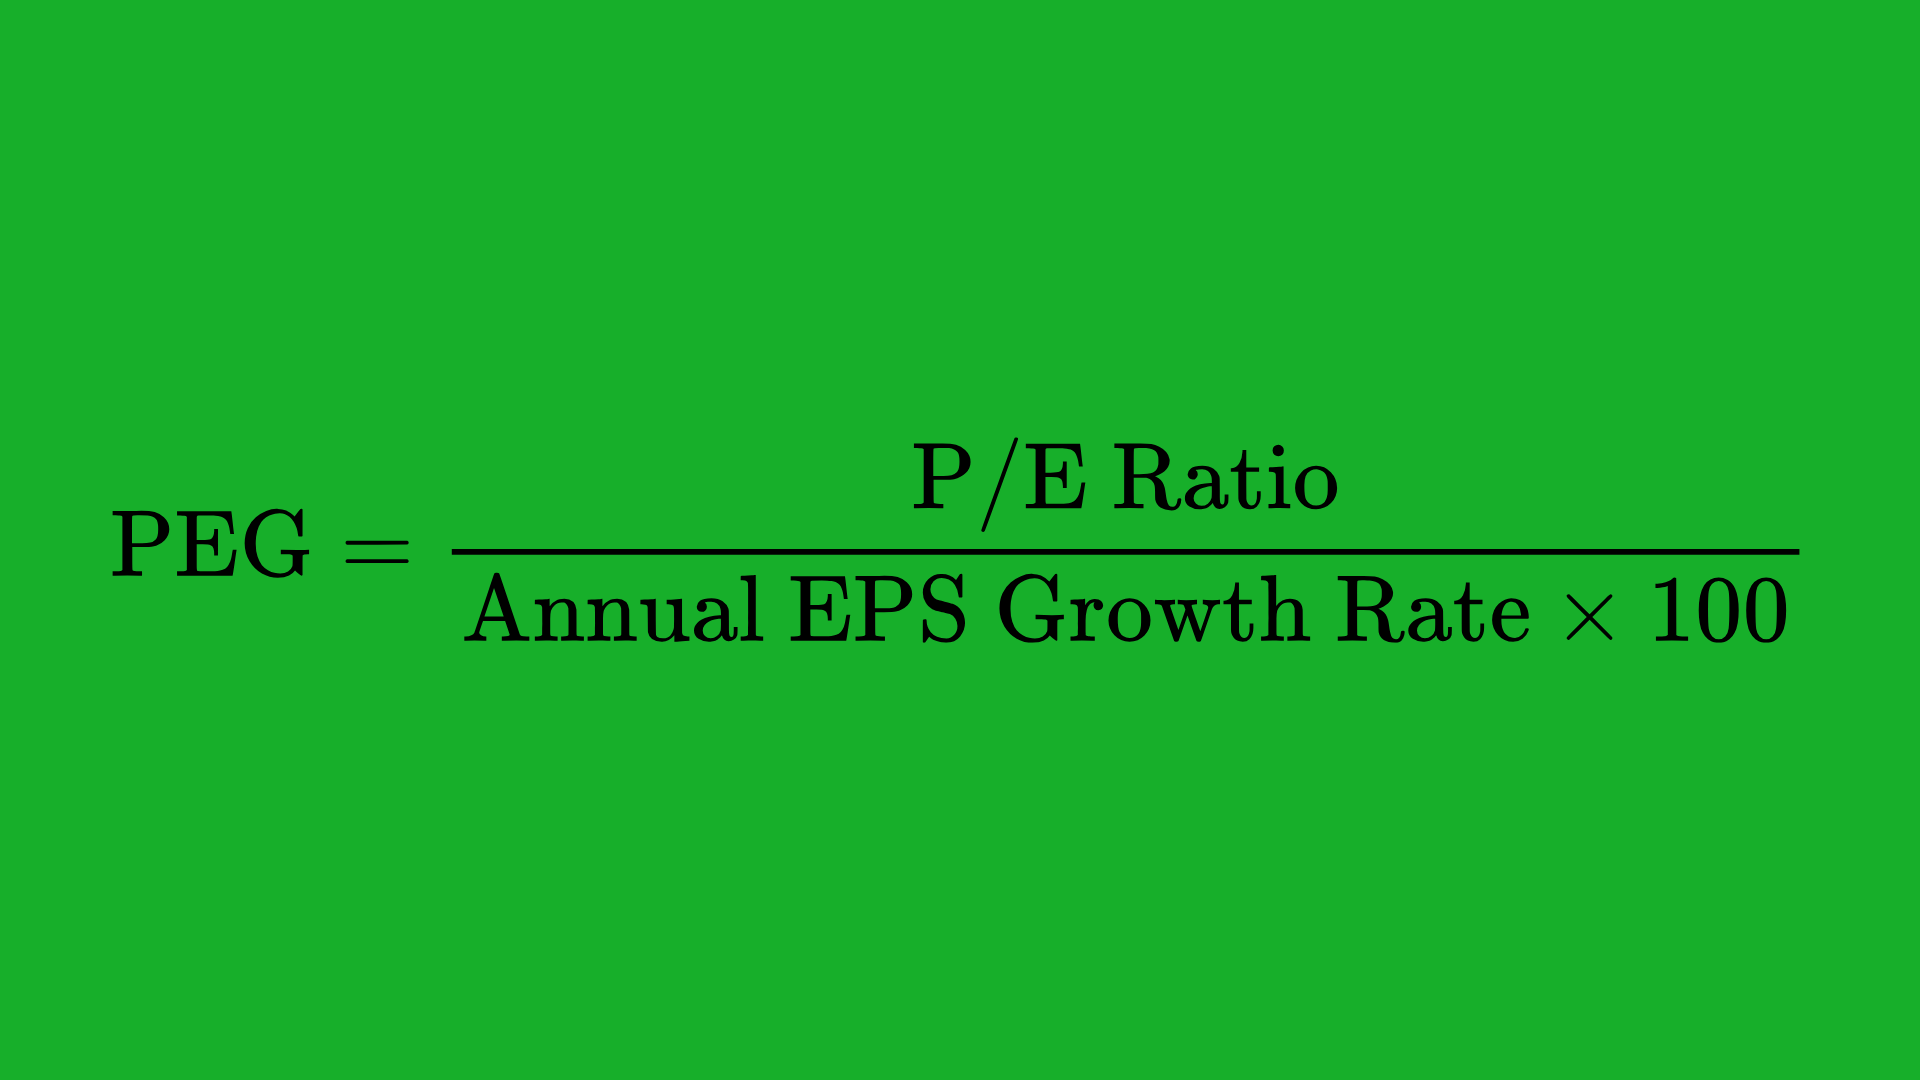
Interpretation:
- A PEG close to 1 is often seen as “fairly valued.”
- A PEG less than 1 might indicate undervaluation.
- A PEG above 1 could signal overvaluation, although some high-growth industries consistently have PEGs over 1.
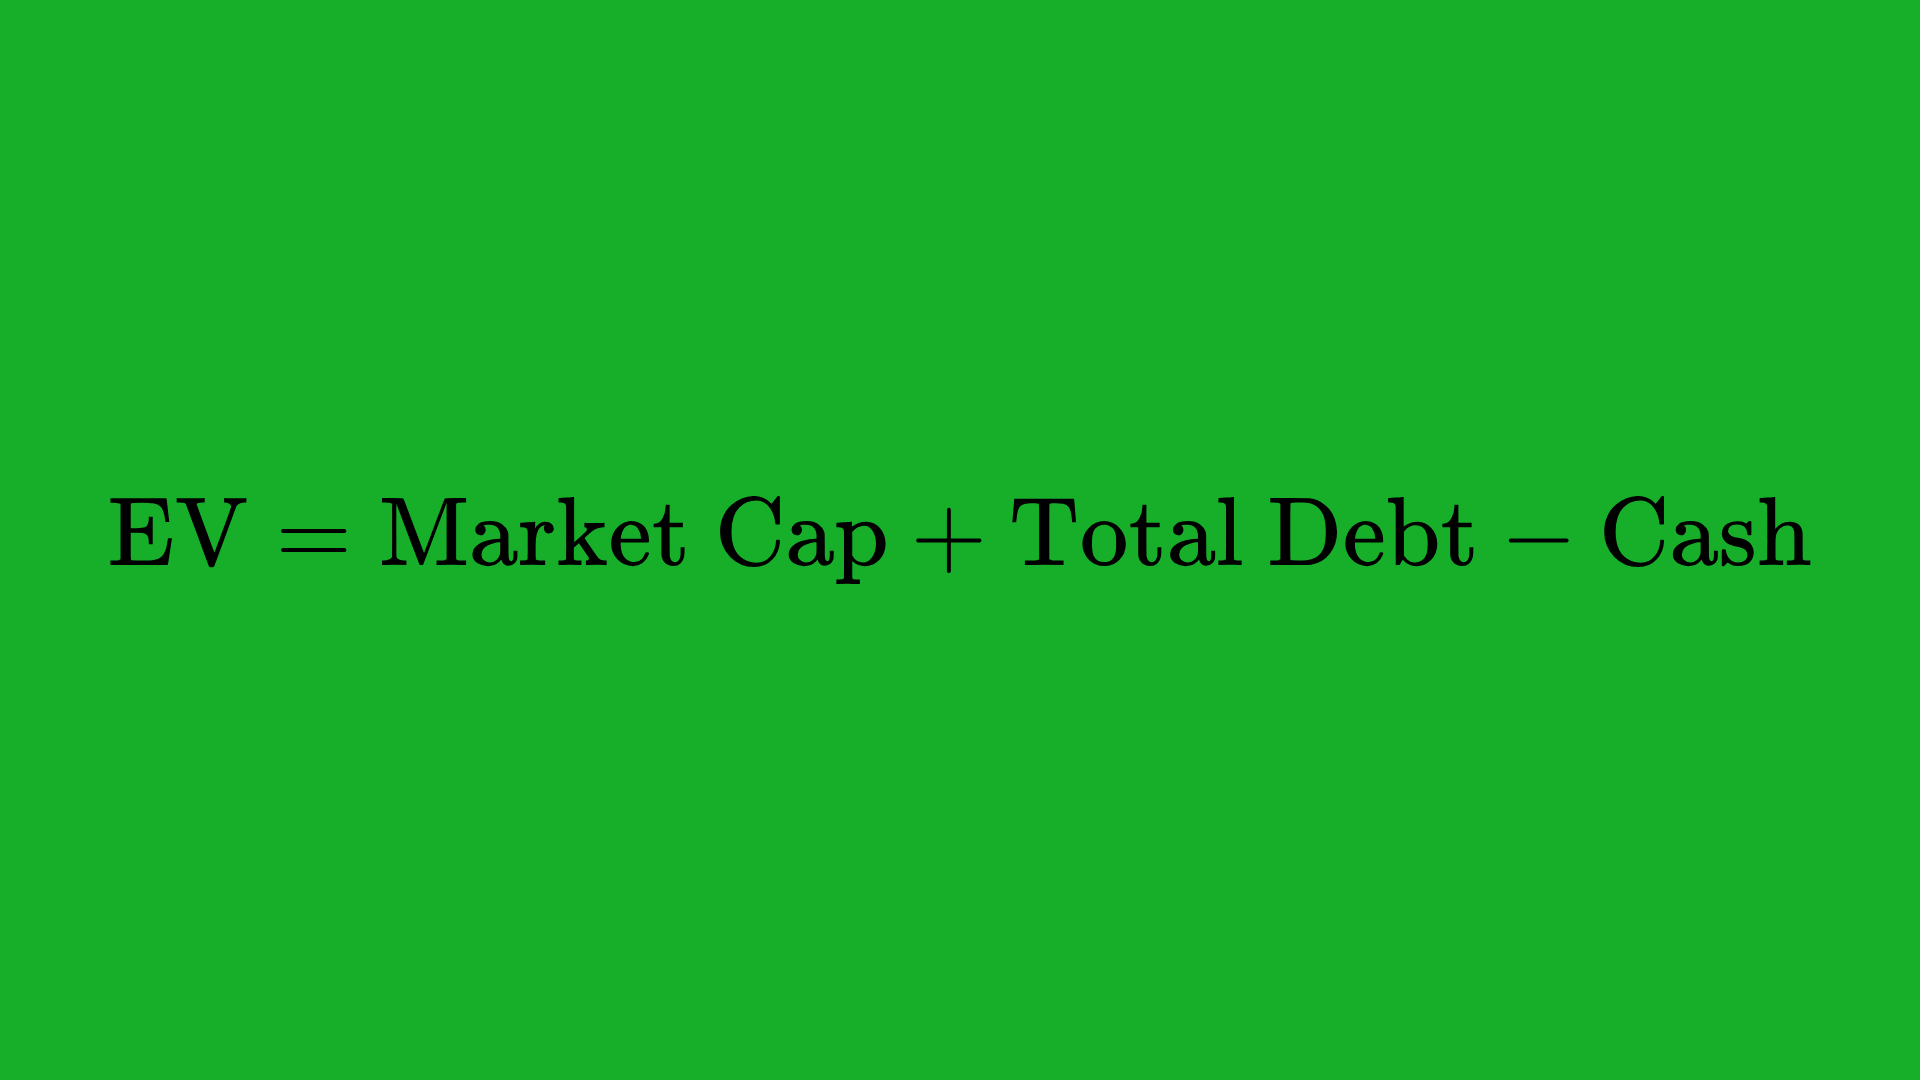
Enterprise Value (EV) and EV/EBITDA
Enterprise Value (EV) is a comprehensive measure of a company’s total value, including market capitalization, debt, and cash.
Formula:
EV/EBITDA ratio:
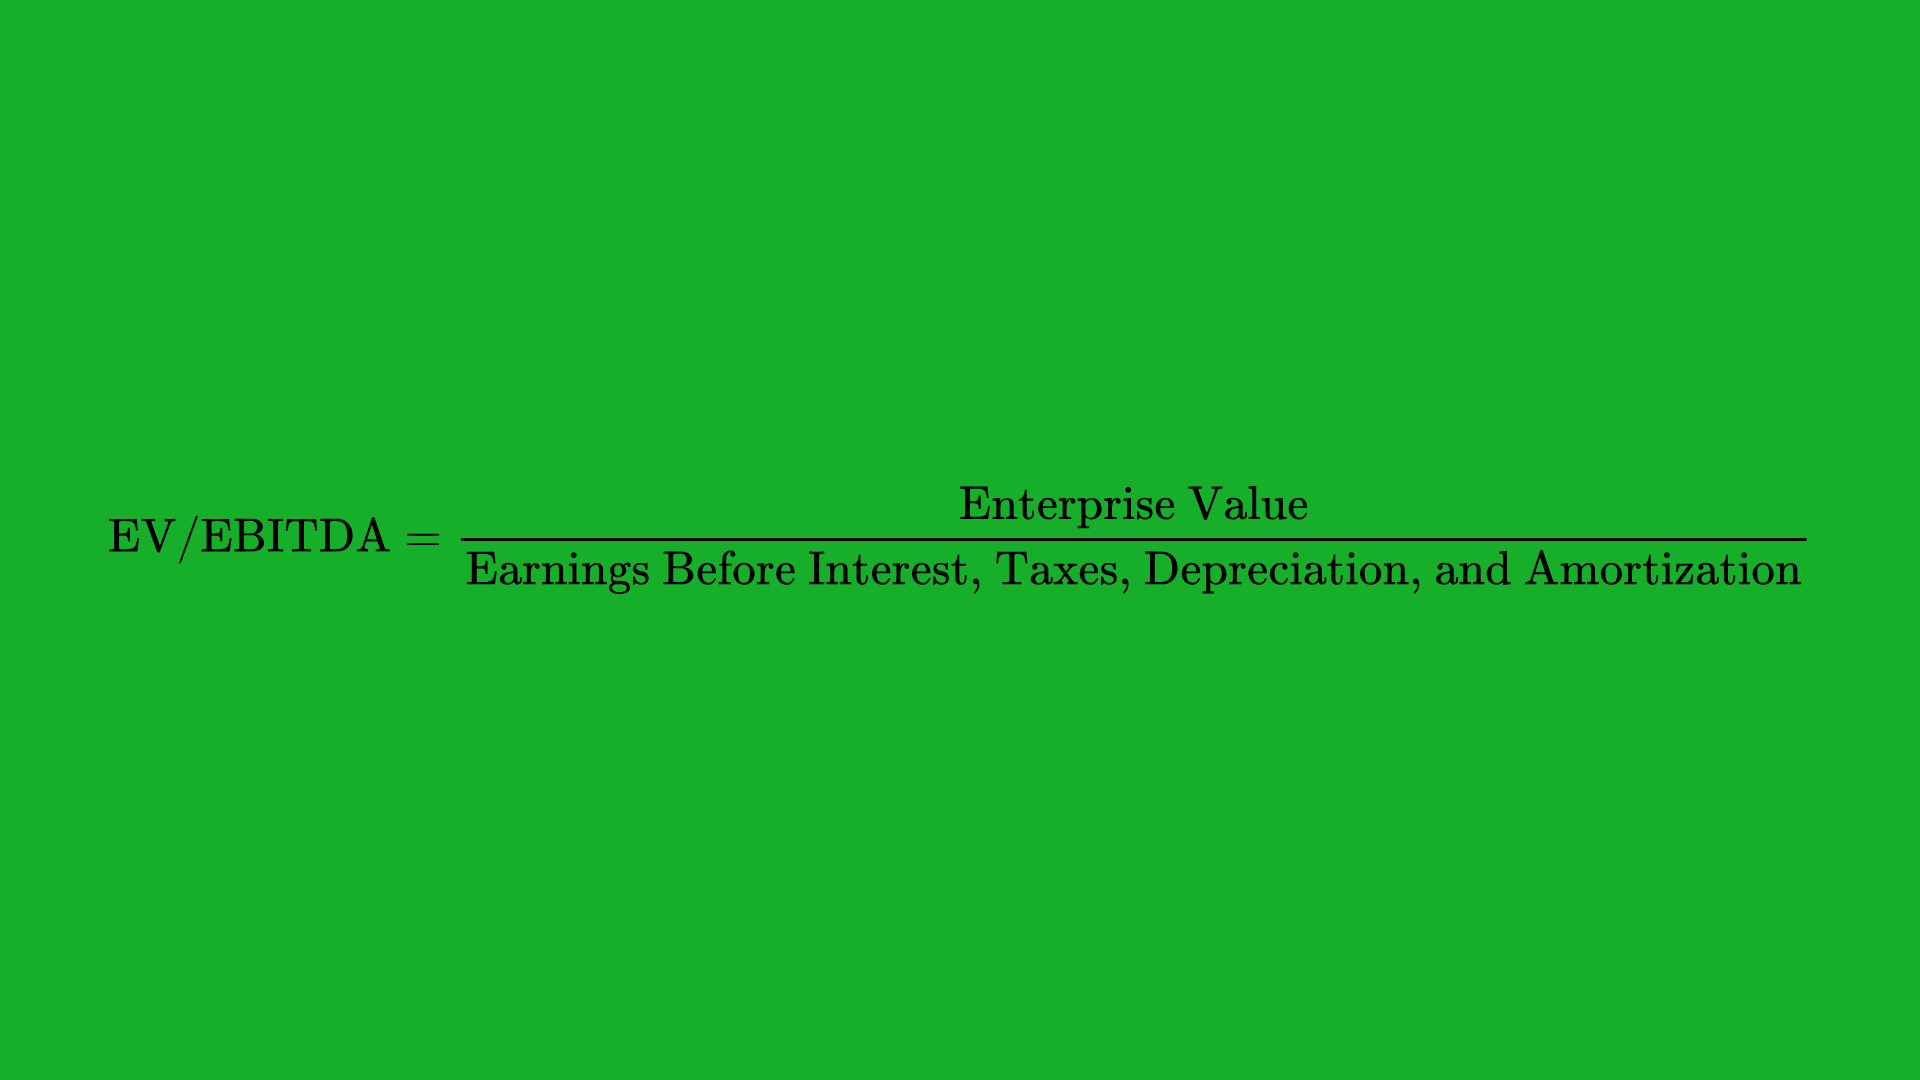
Why it’s useful:
EV/EBITDA is often considered a better valuation metric than P/E because it adjusts for differences in capital structure and non-cash expenses.
Return on Invested Capital (ROIC)
Return on Invested Capital (ROIC) measures how well a company uses both debt and equity to generate profits.
Formula:
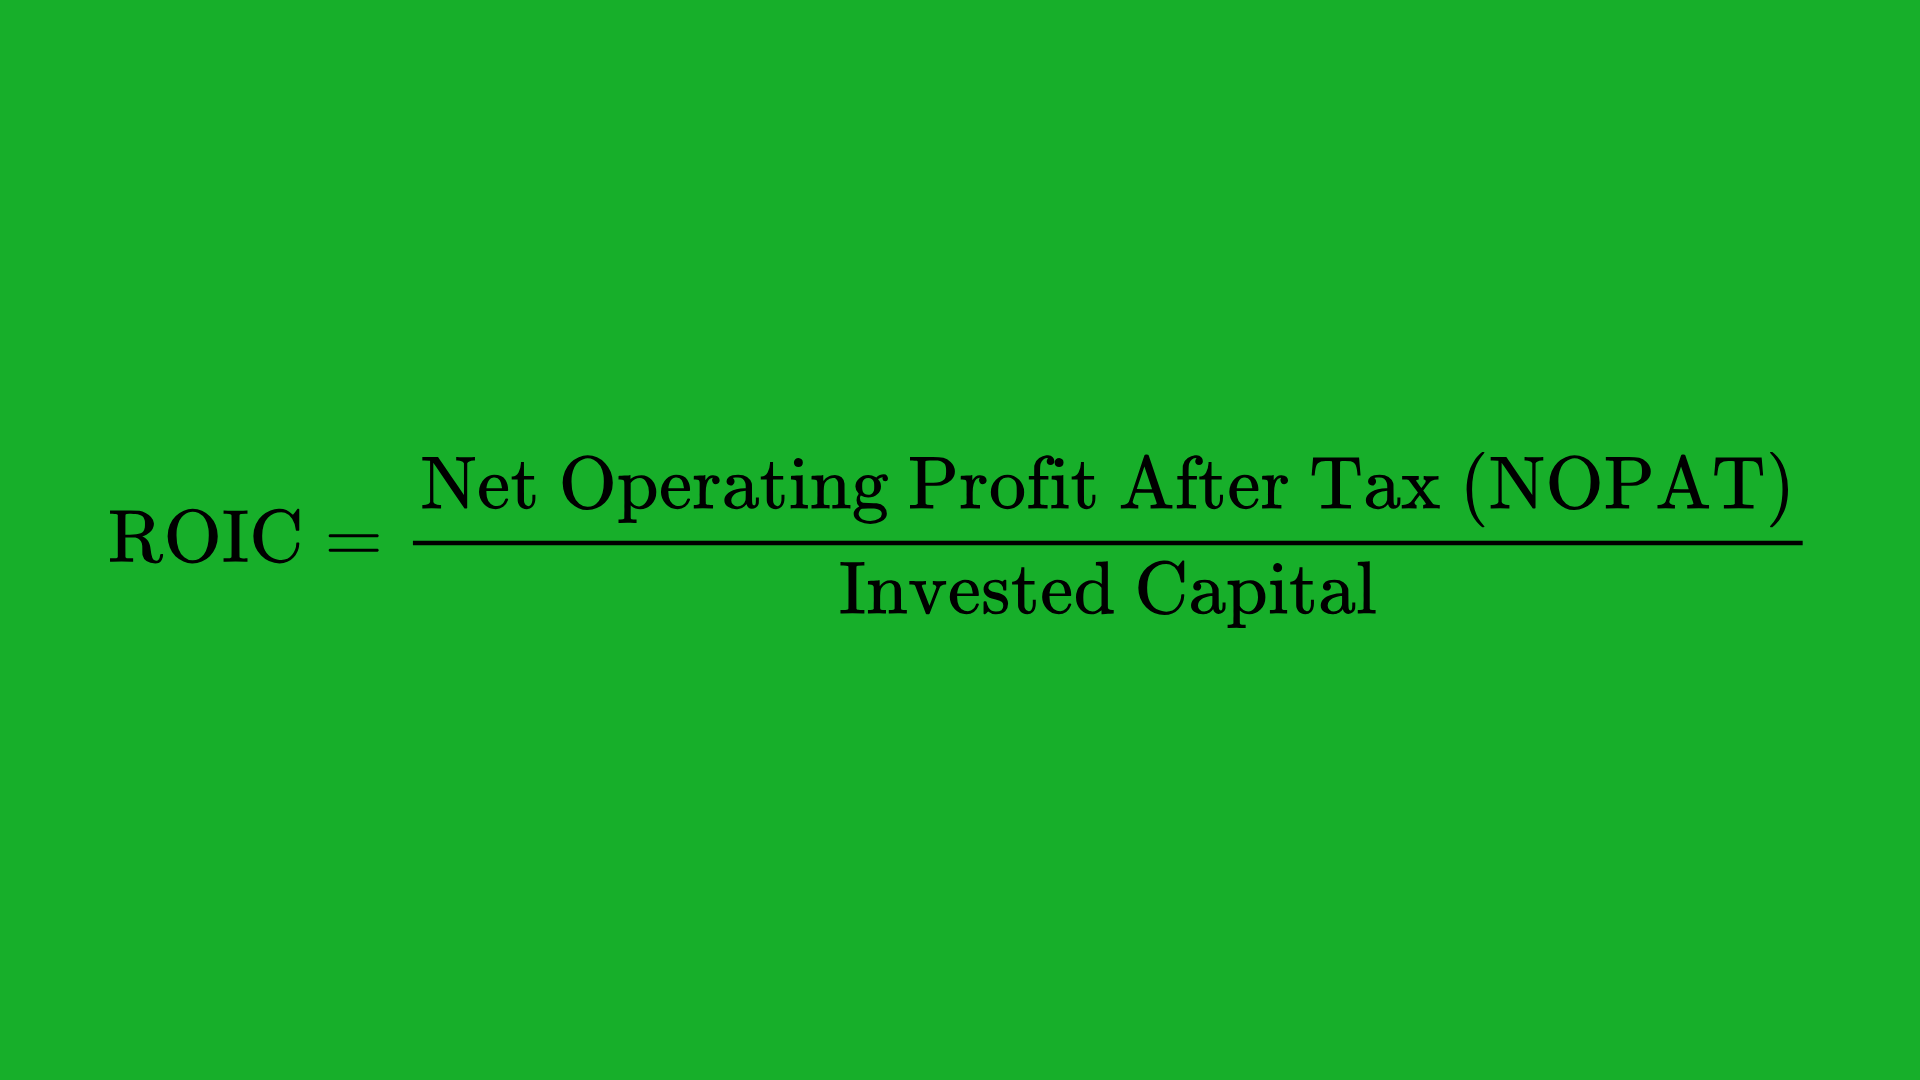
Practical use:
A high and consistently growing ROIC suggests strong management and an effective business model.
Free Cash Flow (FCF)
Free Cash Flow is the cash a company generates after accounting for capital expenditures (e.g., facilities, machinery).
Formula:

Importance:
FCF indicates the company’s ability to fund expansion, pay dividends, or reduce debt. Consistent positive FCF can be a strong sign of financial health.
EBITDA Margin
EBITDA Margin looks at a company’s profitability from its core operations before interest, taxes, depreciation, and amortization.
Formula:
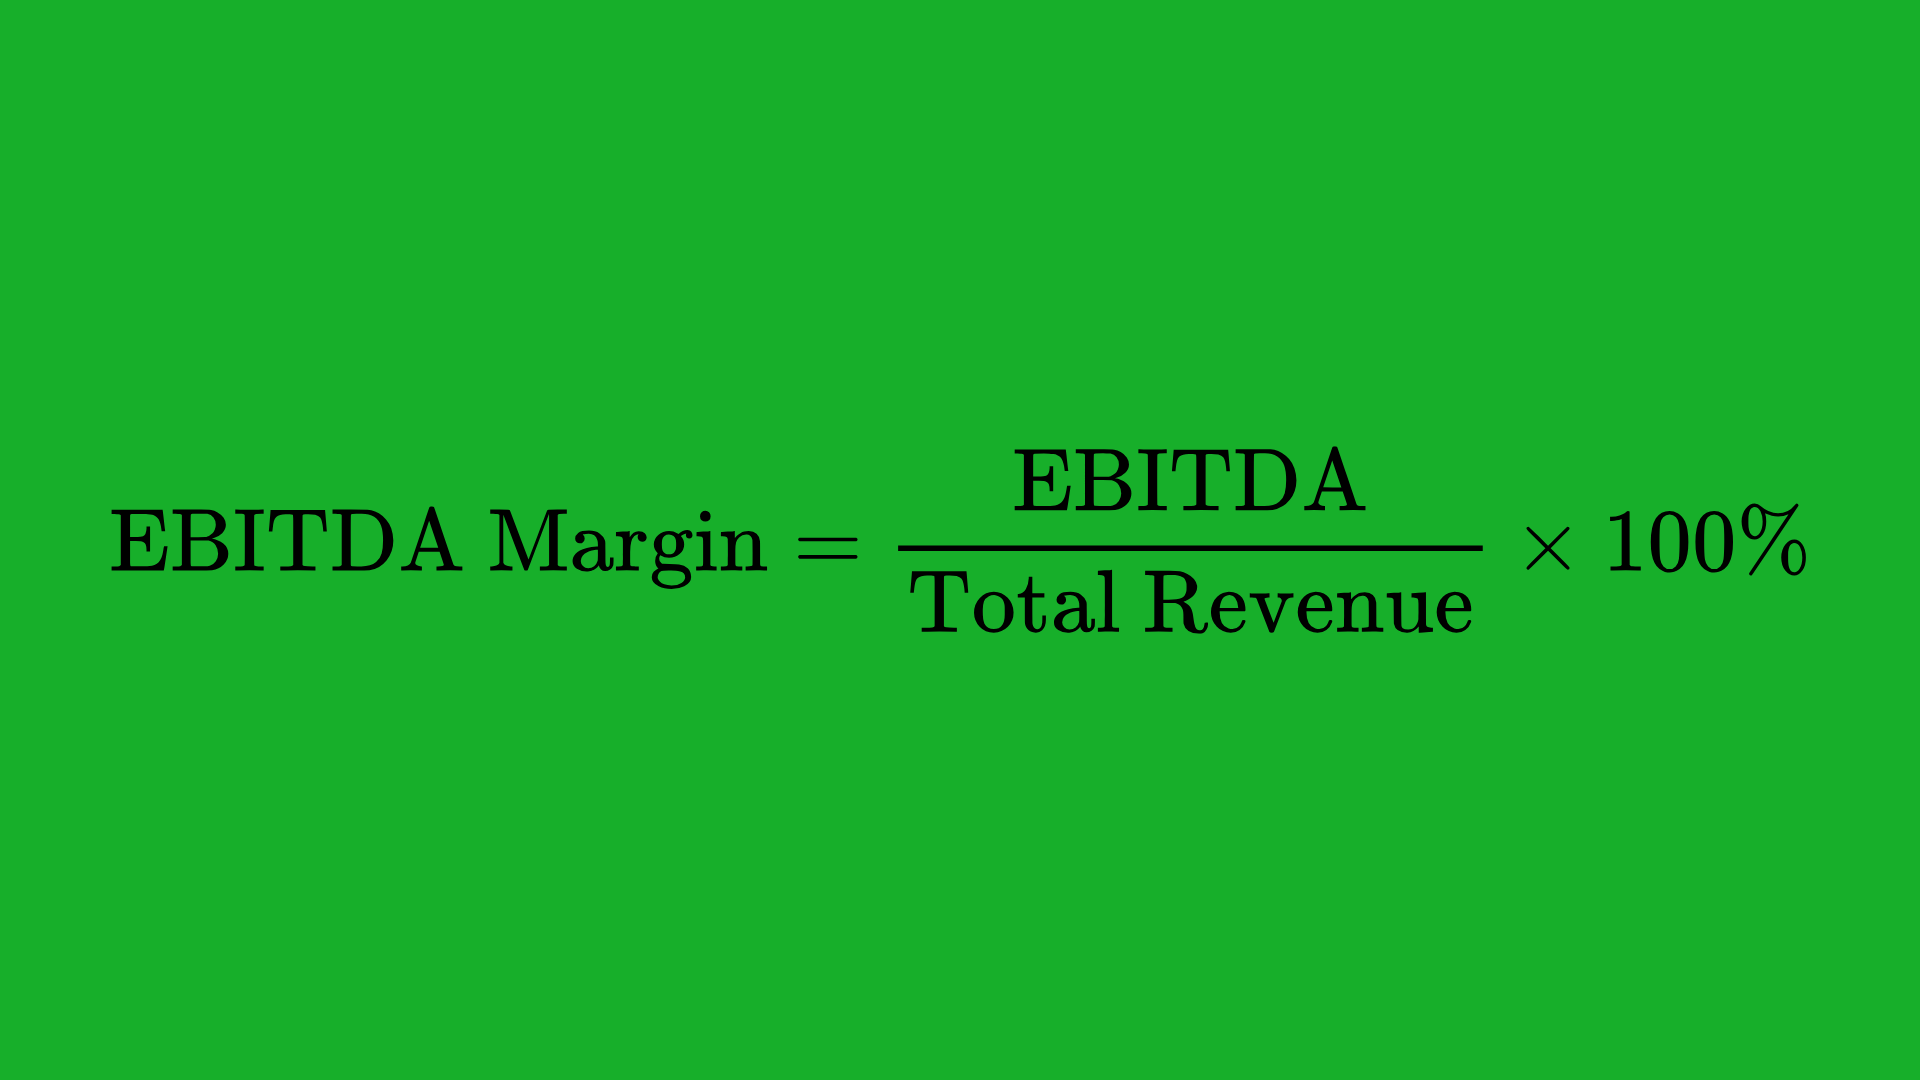
Why it matters:
It offers a cleaner view of operational performance by excluding non-operating expenses and non-cash charges. A higher EBITDA margin can signal efficient cost management.
Constructing Your Stock Screen: Step-by-Step
Now that you’re familiar with the key metrics, let’s walk through a step-by-step process of setting up a stock screen that could help pinpoint potential winners.
Defining Your Investment Goals
- Time Horizon
- Are you investing for long-term growth (5–10 years), or looking for short-term trades?
- Risk Tolerance
- How comfortable are you with volatility? This can affect your choice of market cap, sector, or leverage.
- Investment Style
- Do you prefer value, growth, momentum, or dividend investing—or a hybrid approach?
Your specific goals will shape the metrics you choose and the thresholds you set.
Choosing Appropriate Metrics
- Value Investors might focus on P/E, P/B, or EV/EBITDA.
- Growth Investors might emphasize EPS growth rate, PEG, or ROE.
- Dividend Investors will prioritize dividend yield, payout ratio, and FCF.
- Momentum Traders might look at RSI, MACD, or moving averages.
Pick a core set of metrics that align with your objectives.
Setting Parameter Ranges
For each chosen metric, set realistic ranges. For instance:
- P/E ratio could be < 20 for value seekers.
- ROE might be > 15% for growth investors.
- Dividend yield might be > 3% for income-focused.
- RSI could be < 30 for oversold conditions (momentum trades).
Make sure to use ranges that are appropriate for the current market conditions and your strategy.
Applying Sector and Industry Filters
If you have a sector preference (technology, healthcare, consumer goods, etc.) or want to avoid certain industries (like energy or cyclical stocks), apply those filters. This helps you focus on the industries you understand best or those with the most promising trends.
Popular Stock Screener Tools
Choosing the right stock screener tool can significantly influence the quality and reliability of your screening process. Below are some widely recognized options:
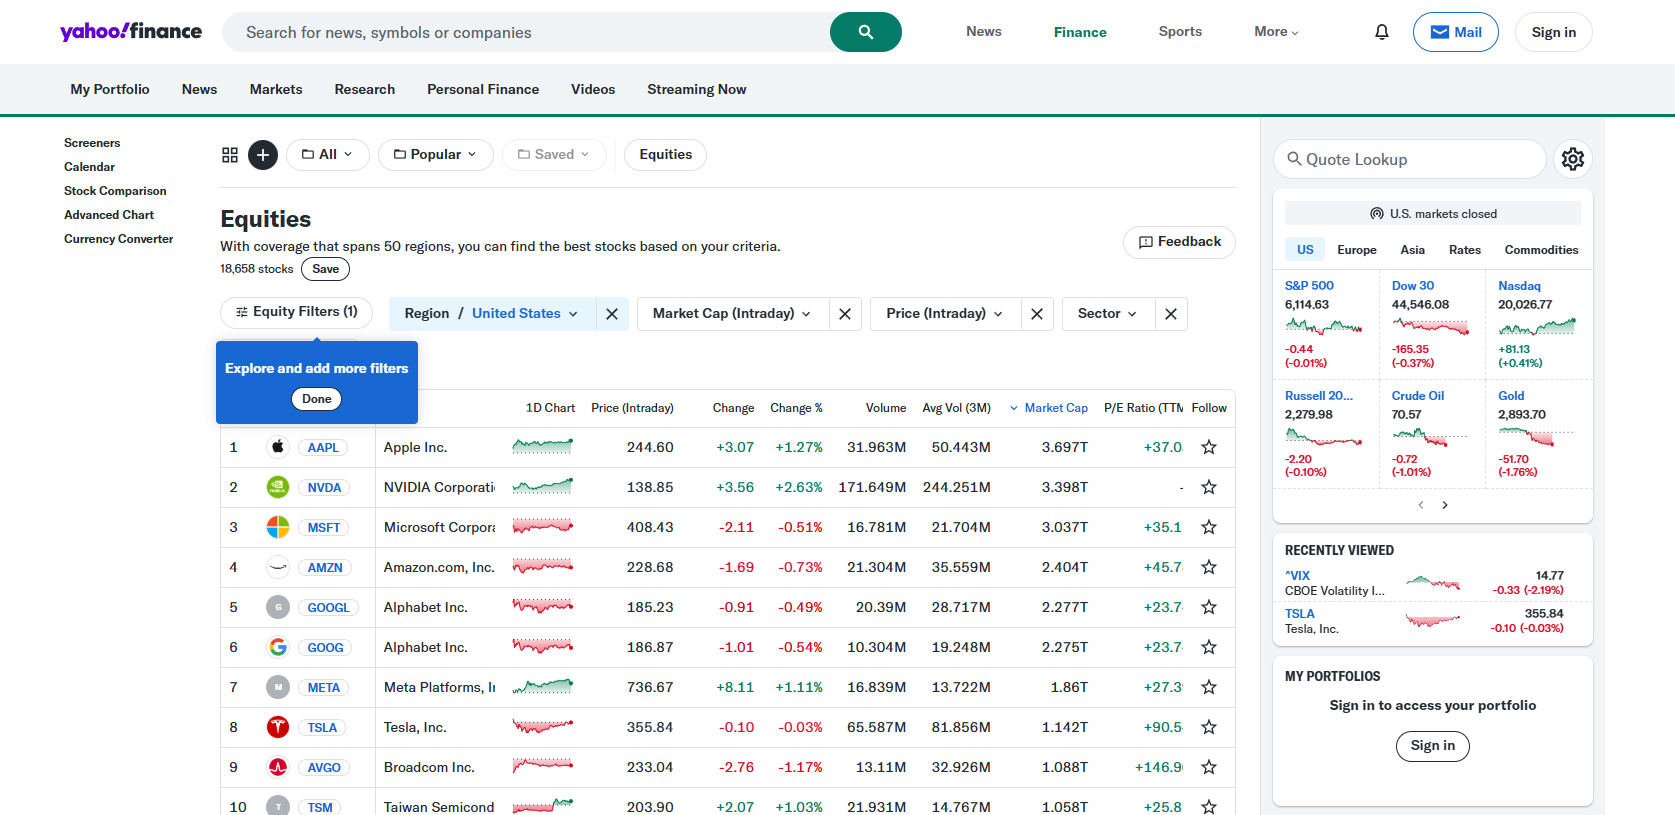
- Pros: Free, simple interface, covers global markets.
- Cons: Limited advanced screening features, data updates may not be real-time.

- Pros: Comprehensive filters, visual charts, heat maps, easy to use.
- Cons: Advanced features (like real-time data) require a paid subscription.
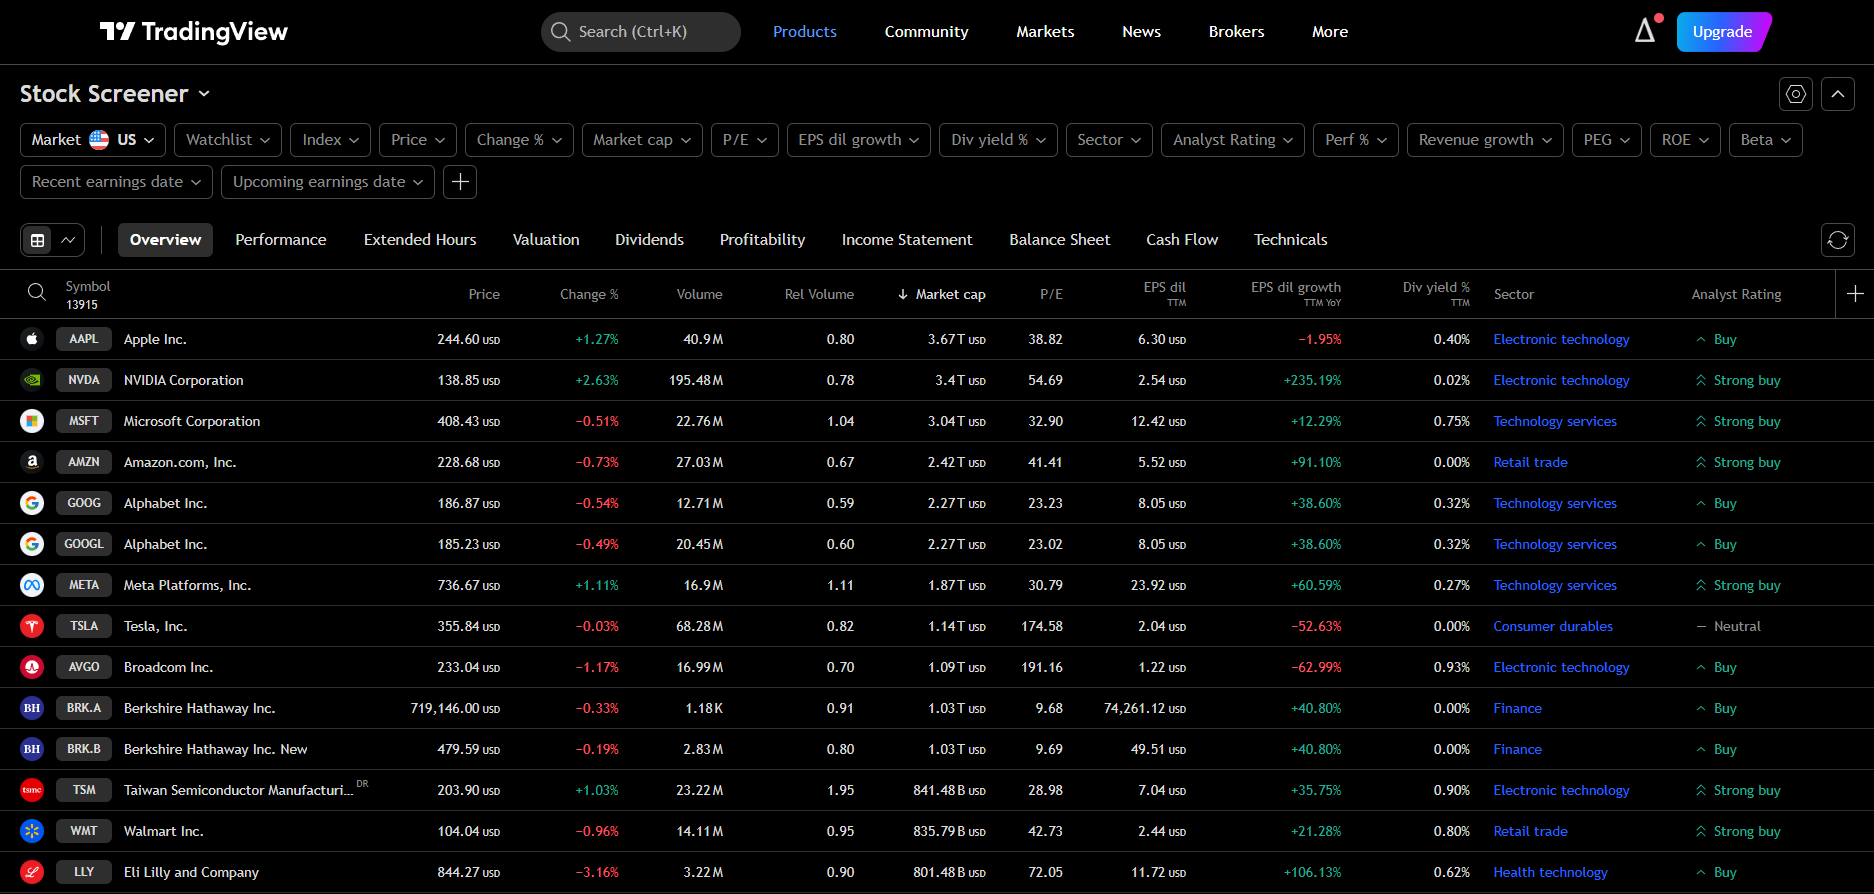
- Pros: Extensive charting tools, social community, custom scripting with Pine Script.
- Cons: The free plan has limitations on data and screeners.

- Pros: In-depth fundamental data, analyst reports, covers mutual funds and ETFs as well.
- Cons: Premium subscription required for advanced tools.
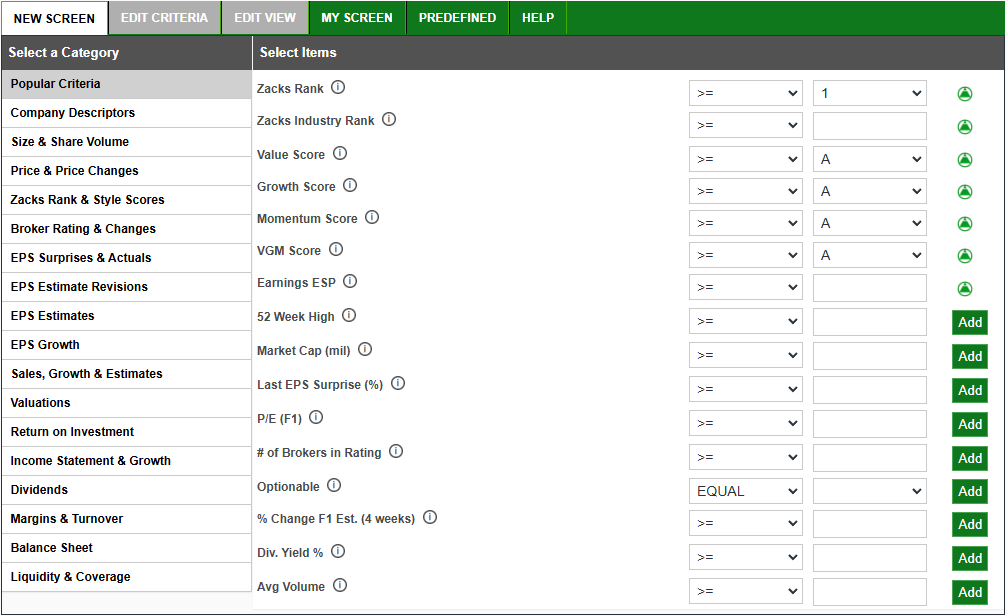
- Pros: Strong focus on EPS estimates and revisions, Zacks Rank system.
- Cons: Some advanced screeners are behind a paywall, primarily U.S.-focused.
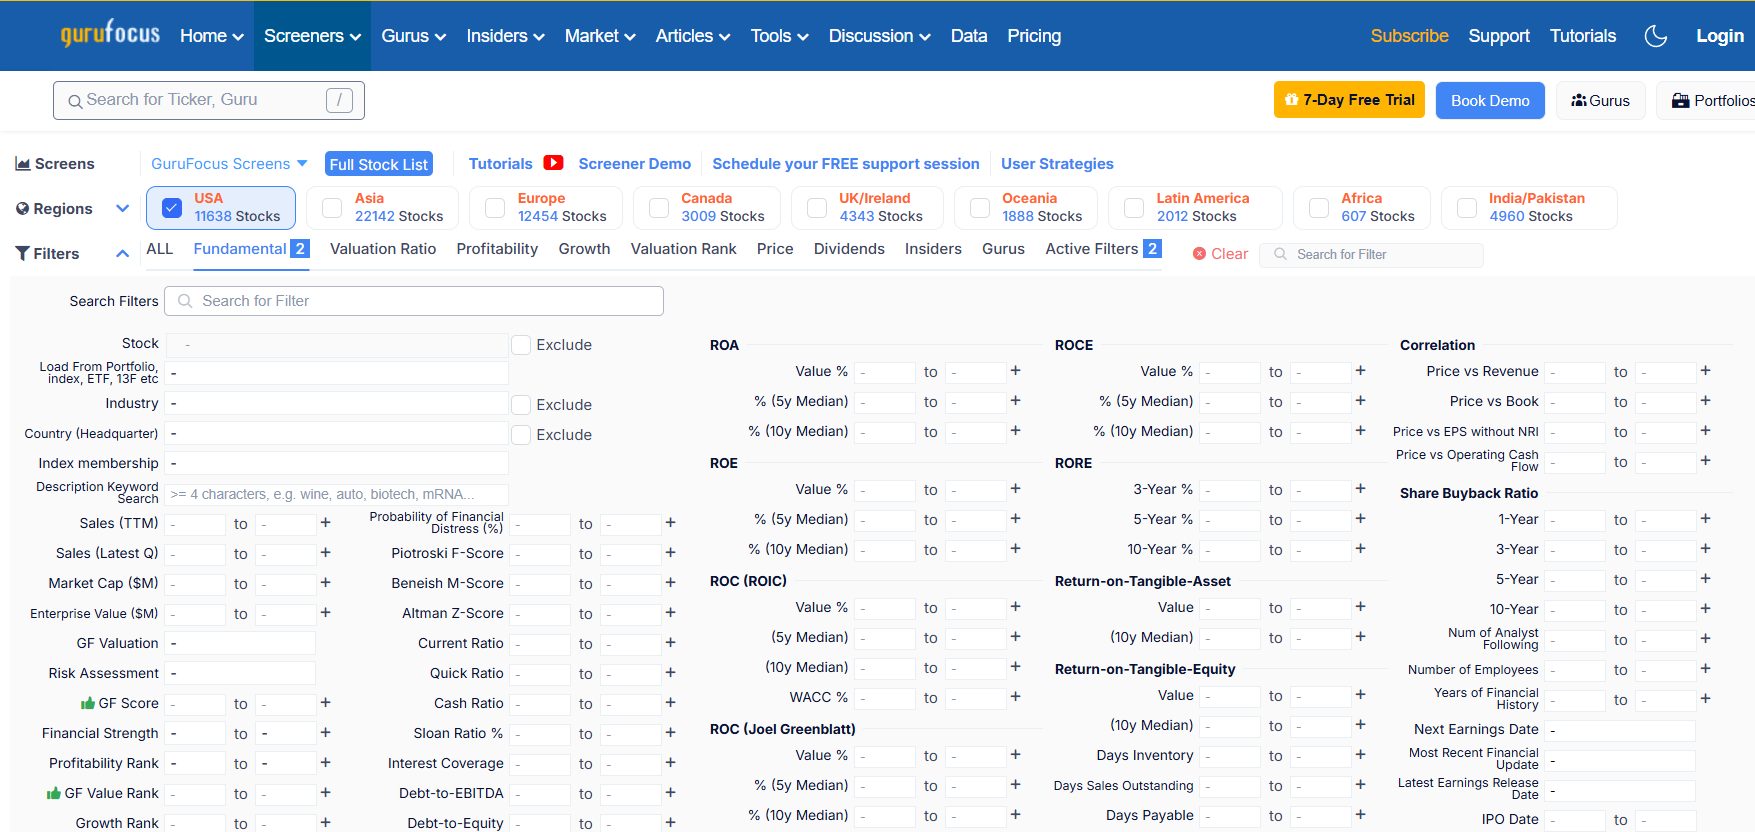
- Pros: Excellent data for fundamental analysis, insider trades tracking, advanced valuations.
- Cons: Expensive membership, might be too in-depth for beginners.
Each platform has a unique set of pros and cons. Test different screeners to find the one that best fits your investing style and budget.
Creating Effective Screens for Different Strategies
One of the main strengths of stock screening is that it can be tailored to virtually any investment style. Below are some sample screens you can build for value, growth, dividend, and momentum strategies.
Value Investing Screen
Objective: Find fundamentally strong companies trading below intrinsic value.
- Metrics:
- P/E < 15
- P/B < 2
- Debt-to-Equity < 0.5
- ROE > 10%
- Market Cap > $1B
- Rationale:
Low P/E and P/B suggest undervaluation. A modest debt load (D/E < 0.5) limits financial risk. An ROE above 10% ensures decent profitability.
Growth Investing Screen
Objective: Identify companies with strong earnings growth potential.
- Metrics:
- EPS Growth (5-year) > 15%
- Revenue Growth (5-year) > 15%
- PEG < 1.5
- ROE > 15%
- Rationale:
A focus on earnings and revenue growth indicates the company is expanding. A PEG < 1.5 suggests growth is not overly priced. ROE over 15% often indicates efficient use of equity.
Dividend Investing Screen
Objective: Locate companies with reliable dividend payouts.
- Metrics:
- Dividend Yield > 3%
- Dividend Payout Ratio < 60%
- Positive Free Cash Flow
- At least 5 consecutive years of dividend increases
- Rationale:
High yield must be sustainable, thus a conservative payout ratio (< 60%) is key. Positive free cash flow ensures the company can continue paying (and potentially increasing) dividends.
Momentum Investing Screen
Objective: Identify stocks with strong price momentum for short- to medium-term trades.
- Metrics:
- Price above 50-day and 200-day moving average
- RSI between 40 and 70 (avoid overbought or oversold extremes)
- Above-average trading volume in recent weeks
- Rationale:
This screen focuses on technical factors. The stock is already in an uptrend (above moving averages), has healthy volume (indicating interest), and an RSI that suggests more room to run.
Analyzing and Interpreting Screening Results

Even the most sophisticated screen will produce a list of stocks that still require further analysis. Screening is merely the first step—it narrows down your options. When looking at the resulting list:
- Validate the Fundamental/Technical Story
- If it’s a fundamental screen, read the company’s financial statements, check recent earnings calls, and consider analyst forecasts.
- If it’s a technical screen, review price charts and confirm trend patterns.
- Research Industry Trends
- Is the entire industry in an upcycle or facing regulatory hurdles? The broader context can affect the stock’s outlook.
- Check Recent News
- Major announcements (like mergers, lawsuits, product launches) could drastically change a company’s prospects.
- Assess Valuation in Context
- A low P/E is not always a “buy” signal—maybe the company is in decline. Similarly, a high P/E could be justified by future growth.
- Perform a SWOT Analysis
- Strengths: Competitive advantages, patents, brand recognition.
- Weaknesses: High debt load, outdated products.
- Opportunities: Expanding into new markets, innovative products.
- Threats: Competition, economic downturns, regulatory issues.
- Construct a Watchlist
- Add the most compelling stocks to a watchlist. Monitor them periodically or set price alerts for timely decision-making.
Practical Examples of Stock Screening
To illustrate how screening can be done in real-world situations, let’s explore a simplified example:
- Scenario: You are a value investor looking for a stable U.S. large-cap stock that might be undervalued.
- Criteria:
- Market Cap > $10B
- P/E < 15
- ROE > 12%
- Dividend Yield > 2%
- Debt-to-Equity < 0.8
- Platform: Using Finviz or Yahoo Finance, you input these filters.
- Shortlist: Suppose your screen returns a handful of companies—let’s say Company A, Company B, and Company C.
- Next Steps:
- Dive deeper: Check each company’s annual reports, look at competitive landscape, and review recent earnings calls.
- Compare: Evaluate if these stocks are indeed undervalued by checking their forward P/E, free cash flow trends, or any red flags in their balance sheet.
- Decide: Based on your findings, you might invest in one or multiple stocks on your shortlist or wait for further price corrections.
This process underscores how screening not only saves time but also provides a systematic foundation for deeper research.
Common Pitfalls and Mistakes to Avoid
While stock screening is an invaluable tool, it’s not a magic wand. There are common traps and pitfalls:
- Over-Reliance on a Single Metric
- Judging a company solely on P/E or dividend yield can lead to a distorted view. Always cross-check with other metrics.
- Using Outdated or Inaccurate Data
- Ensure the screener updates data frequently. Old data might lead to erroneous conclusions, especially in fast-moving markets.
- Setting Unrealistic Criteria
- Overly strict filters might eliminate all potential stocks. On the flip side, very loose criteria might give too many irrelevant options.
- Ignoring Macro and Sector Trends
- Screening for good fundamentals is not enough if the entire sector is in decline or the macroeconomic environment is unfavorable.
- Falling for “Value Traps”
- A low P/E or P/B might not be a bargain if the company’s fundamentals are deteriorating. Always do secondary research.
- Emotional or Impulse Buying
- Even if a stock passes all your screens, the final purchase should be calculated and based on thorough analysis.
- Lack of Diversification
- Don’t put all your capital into a single stock or industry, even if it shows up as a “winner” in your screen. Diversification is key for risk management.
Refining Your Stock Screener Over Time
A stock screener is not a static tool; it needs continuous refinement:
- Adapt to Market Cycles
- During bull markets, you might loosen valuation criteria because valuations rise across the board. In bear markets, you might be more stringent to find true bargains.
- Monitor Performance
- If a certain screen repeatedly yields stocks that underperform, examine why. Maybe your threshold for ROE is too low, or your approach to debt levels is too lax.
- Incorporate New Metrics
- As you gain experience, you might discover new ratios or indicators that suit your strategy. Experiment with them to see if they improve your screening results.
- Backtesting
- Some advanced screeners allow you to backtest your criteria against historical data. This can help validate or invalidate your approach over different market conditions.
- Stay Informed
- Keep up with market trends, economic indicators, and emerging financial metrics. Your screener should evolve as the market evolves.
Frequently Asked Questions (FAQs)
Q1: Are free stock screeners good enough for serious investors?
- Answer: Many free stock screeners (like Yahoo Finance, Finviz Basic) offer a robust set of features. However, advanced investors who need real-time data, custom metrics, or in-depth fundamental data might benefit from paid solutions. It ultimately depends on the complexity of your requirements.
Q2: How often should I run my stock screen?
- Answer: It varies based on your investment horizon and strategy. Long-term investors might run screens monthly or quarterly, while short-term traders could run them daily.
Q3: Can stock screening guarantee profits?
- Answer: No tool can guarantee profits. Stock screening is a filtering mechanism, not a crystal ball. It helps you spot potential opportunities faster but always requires further analysis and risk management.
Q4: How do I pick the right metrics for my screen?
- Answer: Consider your investment style (value, growth, momentum, etc.), time horizon, and risk tolerance. Choose metrics that align with these factors. For instance, value investors prioritize valuation metrics, while growth investors look at revenue and EPS growth.
Q5: Should I combine technical and fundamental filters?
- Answer: Combining both can give you a well-rounded view, ensuring the stock is not only fundamentally solid but also currently supported by market momentum. However, it requires a good grasp of both analysis methods.
Q6: What if my screen returns no results?
- Answer: This could mean your criteria are too strict or market conditions are not favorable for that particular strategy. You can relax your filters or focus on different sectors to see if that yields any potential candidates.
Q7: How can I keep my results organized?
- Answer: Most screener tools allow you to export data to Excel or Google Sheets. You can also create watchlists or use portfolio tracking apps. Staying organized helps in monitoring and evaluating your picks over time.
Final Thoughts
Stock screening is a cornerstone of any structured investment process. It helps you navigate the sea of stocks by focusing on what truly matters for your strategy—be it valuations, growth metrics, dividend yield, or momentum signals. While a screener filters out the noise and narrows down your list of potential winners, the final responsibility rests on you to delve deeper, interpret the context, and make informed decisions.
- Clarity of Goals: Always start with a clear definition of your investment objectives.
- Know Your Metrics: Familiarize yourself with key financial ratios and how they apply in different contexts.
- Utilize Tools: Take advantage of free or paid screeners, but understand their limitations and strengths.
- Refine Continually: Market conditions change, and so should your screening approach.
- Do the Homework: Screening is just step one; follow up with thorough research to confirm or reject your picks.
By combining discipline with data-driven filters, you can vastly improve your odds of finding winning stocks that fit your risk-reward profile. And over time, as you gain confidence and refine your methods, you’ll truly feel like a pro in uncovering and evaluating investment opportunities.