In the world of trading—whether it be stocks, forex, commodities, or cryptocurrencies—being successful isn’t just about making a few good calls. It’s about consistent, long-term profitability. While the allure of quick money might draw many new traders, the reality is that trading is a craft built on data-driven decisions and systematic risk management.
Among the many metrics that traders use to assess performance, two stand out as particularly significant:
- Average Winner (the average profit on winning trades), and
- Average Loser (the average loss on losing trades).
These two metrics form the backbone of a trader’s performance profile. By analyzing them in tandem, traders can uncover patterns, optimize strategies, and make informed decisions about position sizing, entry and exit points, and risk controls.
In this comprehensive guide, we’ll not only define and explore the concepts of average winners and average losers, but we’ll also walk through practical applications, illustrate their importance in various trading styles, and provide insights into improving your results. Whether you’re a day trader, swing trader, or position trader, mastering these key metrics can dramatically impact your bottom line and overall trading success.
What Is the Average Winner vs Average Loser Concept?

Before diving into complex formulas or strategies, let’s establish a clear definition of these two critical metrics.
- Average Winner
This is the average amount of profit you make on your winning trades. For instance, if you record 10 winning trades in a month and your total profit from these trades is $2,000, then your average winner is $200. - Average Loser
This is the average amount of loss you incur on your losing trades. If you record 10 losing trades in a month and your total loss is $1,200, then your average loser is $120.
These averages give you a snapshot of how well your winners are performing versus how badly your losers are hurting you. By comparing them, traders can quickly gauge whether their trading strategy is leaning toward profitability or edging toward losses over time.
Why Average Winner and Average Loser Matter in Trading

Understanding these metrics isn’t just a theoretical exercise. They have real-world implications on how you manage trades and structure your overall trading plan. Here are several reasons why average winners and average losers matter:
- Risk Management
- If your average loser is consistently larger than your average winner, you could see your account dwindle even if you have a high win rate.
- Conversely, if your average winner is significantly higher than your average loser, you can remain profitable even with a moderate win rate.
- Strategy Assessment
- By looking at historical data, you can judge whether your current trading strategy is viable. Consistently large losing trades may indicate a flaw in your stop-loss placement or your initial entry triggers.
- Trade Optimization
- Understanding your average winners and losers allows you to optimize exits. You can identify whether you should let winners run longer or cut losers more quickly.
- Psychological Benefits
- Knowing that your average winners are bigger than your average losers can give you the psychological confidence to execute trades faithfully, without fear or hesitation.
- Consistency Over Flashy Gains
- Rather than going for home runs, focusing on a consistently healthy average winner vs average loser profile can lead to stable account growth over time.
How to Calculate and Interpret Average Winner and Average Loser

Calculation is straightforward, but interpretation is where traders can often go astray. Let’s break down both:
Calculating Your Averages
Average Winner Calculation:
Average Winner = Sum of All Profits from Winning Trades / Number of Winning Trades
Average Loser Calculation:
Average Loser = Sum of All Losses from Losing Trades / Number of Losing Trades
Example Calculation:
Let’s assume the following scenario for the month of January:
- Winning Trades = 8
- Sum of all winning trades’ profits = $1,600
- Losing Trades = 5
- Sum of all losing trades’ losses = $1,000
Therefore:
- Average Winner = 1600/8 = $200
- Average Loser = 1000/5=$200
In this case, your average winner equals your average loser, meaning that if you want to maintain profitability, you either need to increase your win rate (have more winners than losers) or find a way to increase your average winning trade relative to your average losing trade.
Interpreting These Averages
- If Average Winner > Average Loser
- You can remain profitable with a relatively lower win rate. For example, if your average winner is $300 and your average loser is $100, you don’t need an extremely high win rate to stay in profit. Even a 40% win rate can potentially keep your trading account growing.
- If Average Winner < Average Loser
- You need a very high win rate to compensate. For example, if your average winner is $100 but your average loser is $300, you might need to win 75% or more of the time just to break even.
- If Average Winner = Average Loser
- Your profitability depends almost exclusively on your win rate minus commission and slippage costs.
The Role of Risk-Reward Ratios
Closely tied to the concepts of average winners and losers is the risk-reward ratio (RRR). The risk-reward ratio is typically expressed as a ratio of potential profit to potential loss on an individual trade. For instance, a 2:1 RRR means you stand to make twice as much as you’re risking if the trade goes in your favor.
- Aligning RRR with Average Winner vs Average Loser
- If you typically set a 2:1 RRR, you’d expect your average winner to be roughly twice your average loser.
- Deviations could indicate that you’re either cutting winners too early or letting losers run too far.
- Practical Example
- Suppose you plan a trade where you set your stop loss at $100 below your entry point and your take profit at $200 above your entry point. This is a 2:1 RRR.
- Over multiple trades, if your actual average winner is only $120 while your average loser is $100, you’re underachieving relative to your planned 2:1 ratio.
- Managing RRR vs. Win Rate
- A higher RRR often means a lower win rate, because you’re aiming for bigger moves that don’t materialize as often.
- A lower RRR might mean a higher win rate, but also smaller profits per trade.
- The balance between RRR and win rate ties into the concept of average winners vs average losers and ultimately determines your overall profitability.
Influence of Win Rate and Lose Rate
Win rate (percentage of your trades that close in profit) and lose rate (percentage of your trades that close in loss) play a significant role in how average winners and average losers affect your overall profit-and-loss (P&L) statement.
- High Win Rate with Large Average Loser
- You might win 80% of your trades, but if you lose significantly on the 20% of trades that go wrong, your account can still end up negative.
- Low Win Rate with Large Average Winner
- Even with a 40% win rate, if your average winner is consistently double or triple your average loser, you can come out on top.
- Balance Is Key
- Neither extreme is inherently better. Some professional traders thrive with lower win rates but robust risk-reward ratios, while others prefer high win rates with smaller RRR.
- What matters is maintaining a sustainable relationship between average winner, average loser, win rate, and lose rate.
Position Sizing and Its Effect on Averages
Position sizing is another critical factor in how your average winners and losers evolve. If you continually adjust your position size based on market conditions, account size, or perceived risk of each trade, your averages can shift dramatically.
- Fixed Fraction Position Sizing
- Many traders use a fixed percentage of their account balance as their risk for each trade. For example, risking 1% of your account on every trade.
- This method keeps your average loser relatively stable in percentage terms.
- Optimal F Position Sizing
- This is a more advanced technique derived from position sizing formulas (like Ralph Vince’s Optimal F).
- The idea is to risk a fraction of your account that maximizes growth based on past performance metrics, including average winners and losers.
- Scaling In and Scaling Out
- Some traders enter positions in multiple parts (scaling in) or exit positions gradually (scaling out).
- This can inflate or deflate average winners or losers depending on how effectively the trader times these scale-ins or scale-outs.
By fine-tuning your position sizing, you can manipulate your average winners and losers in a way that aligns with your risk tolerance and trading style.
Risk Management: Controlling the Downside

A universal truth in trading is that protecting your capital is more important than chasing profits. If your average loser grows too large, it only takes a few bad trades to significantly deplete your trading account. Therefore, controlling the downside is essential for long-term viability.
- Stop-Loss Placement
- One of the simplest ways to manage risk is through well-placed stop losses.
- Dynamic stop losses, such as trailing stops, can help lock in profits and reduce the risk of large losses.
- Diversification Across Markets
- By trading across various markets or instruments, you reduce the likelihood of a single event wiping out your portfolio.
- However, keep in mind that different instruments can correlate (e.g., many stocks move with the S&P 500), so true diversification can be tricky.
- Setting a Daily, Weekly, or Monthly Loss Limit
- Once you hit a predetermined loss threshold, you stop trading for that period.
- This practice helps preserve capital and prevents emotional trading following large drawdowns.
- Review of Trading Journal
- Regularly reviewing trades can help identify whether your losers are too large.
- This helps you take corrective action by adjusting stops or re-evaluating your approach to market entries and exits.
Psychological Aspects of Winning and Losing Trades

The psychology of trading can’t be overstated. Emotions like fear and greed can wreak havoc on even the most well-researched trading strategies. When it comes to average winners and losers, the following emotional pitfalls are common:
- Cutting Winners Too Early
- This is often due to the fear of losing unrealized gains.
- If you take profits prematurely, your average winner will be smaller than planned, hurting your overall profitability.
- Letting Losers Run
- Hoping that a losing trade will “come back” can lead to bigger losses.
- Avoiding the pain of taking a loss can push your average loser higher, hurting your risk-reward balance.
- Revenge Trading
- After a significant loss, some traders jump back in too aggressively to “make it all back,” often compounding the problem.
- This can lead to a series of larger-than-usual losers.
- Confirmation Bias
- Traders might ignore signals that a trade is failing because they want to confirm their initial view.
- This can also increase the average size of losers.
Mastering the psychological game is as important as mastering technical and fundamental analysis. Successful traders often stress discipline, patience, and emotional control as keys to keeping average winners healthy and average losers contained.
Trading Styles and Their Impact on Average Winners and Losers
Different trading styles—day trading, swing trading, position trading, and algorithmic trading—can yield vastly different profiles for average winners and losers. Understanding how your style affects these metrics can help you set realistic expectations and manage risk effectively.
- Day Trading
- Typically aims for smaller profits per trade, but with a higher frequency of trades.
- Average winners might be lower, but if well-managed, average losers can also be kept small.
- Short timeframes can introduce more market “noise,” requiring tighter risk controls.
- Swing Trading
- Involves holding positions for several days to weeks.
- Average winners can be larger because traders aim to catch multi-day price movements.
- Average losers might also be larger if stop losses are placed farther away to accommodate bigger price swings.
- Position Trading
- Positions may be held for months or even years.
- Average winners can be quite large if the trade is held through a major trend.
- Average losers also can be large, especially if the market moves against your long-term thesis.
- Algorithmic and Quantitative Trading
- Relies on systematic approaches, often with large sample sizes of trades.
- Average winners and losers can be calibrated based on backtested data to target specific risk-reward outcomes.
- Emotions play a lesser role, which can help maintain consistency in how winners and losers are captured.
Practical Examples and Case Studies
It’s one thing to understand these metrics in theory, but real-world examples can illuminate the concepts further.
Case Study I: The Swing Trader with a 3:1 RRR
- Setup: A swing trader targets setups with a 3:1 risk-reward ratio and has a 40% win rate.
- Performance: Over 20 trades in a month, 8 are winners and 12 are losers.
- Profit and Loss Calculation:
- Average winner is $300, average loser is $100 (3:1 ratio).
- Total profit from winners = 8 × $300 = $2,400
- Total loss from losers = 12 × $100 = $1,200
- Net profit = $2,400 – $1,200 = $1,200
Despite losing more frequently than winning (8 wins vs. 12 losses), the trader comes out ahead because the average winner is three times the size of the average loser.
Case Study II: The Day Trader with a 1:1 RRR but 70% Win Rate
- Setup: A day trader who closes trades quickly, keeping a tight stop loss and a roughly equal take profit level.
- Performance: Over 20 trades, 14 are winners and 6 are losers.
- Profit and Loss Calculation:
- Average winner = $100, average loser = $100
- Total profit from winners = 14 × $100 = $1,400
- Total loss from losers = 6 × $100 = $600
- Net profit = $1,400 – $600 = $800
Here, a high win rate compensates for a modest risk-reward ratio, resulting in profitability. However, if the trader experiences even a slight decline in win rate or a small increase in average loser, the net profit could erode.
Combining Average Winner vs Average Loser with Other Key Metrics
While average winners and losers are crucial, they don’t tell the entire story. Combining them with other metrics can offer a more comprehensive view of your trading performance.
- Win Rate and Lose Rate
- As discussed, these percentages help you know how often you need to win to stay in profit given your average winners and losers.
- Maximum Drawdown (MDD)
- Shows the largest peak-to-trough drop in your equity curve.
- If your drawdowns are too large, you might reconsider your average loser or position sizing.
- Profit Factor
- Defined as the ratio of your gross profits to your gross losses.
- A profit factor above 1.0 indicates profitability, but combining it with average winners/losers tells you how stable or volatile those profits are.
- Sharpe Ratio or Sortino Ratio
- Measure returns relative to the volatility or downside deviation, respectively.
- These ratios can offer insight into whether your big losers are introducing excessive volatility to your strategy.
- Time in Trade
- Average holding time can correlate with how big your winners and losers get. For instance, longer holding times can capture bigger moves but also expose you to more risk.
Common Mistakes and How to Avoid Them
Even traders who understand the concepts of average winners and losers can fall into traps that sabotage their results. Here are some of the most common mistakes and how to dodge them:
- Failing to Follow a Trading Plan
- Mistake: Ignoring predefined stop-loss or take-profit levels because you’re “sure” the market will reverse.
- Solution: Commit to your plan and document every trade to ensure accountability.
- Overtrading
- Mistake: Placing too many trades can inflate your losses and reduce the quality of setups.
- Solution: Implement filters for trade entry to ensure only high-quality setups are taken.
- Using Arbitrary Position Sizes
- Mistake: Risking too much or too little on each trade without a consistent method.
- Solution: Adopt a systematic position-sizing model (e.g., fixed fraction) to keep losses in check.
- Chasing Performance
- Mistake: Doubling down after a winning streak or chasing a “hot market” with no risk control.
- Solution: Understand that winning streaks are often followed by drawdowns; remain disciplined in your approach.
- Ignoring Psychological Pressure
- Mistake: Letting fear or greed dictate when to exit trades, increasing average losers or decreasing average winners.
- Solution: Practice mindfulness, consider using a trading journal, and stick to mechanical rules whenever possible.
Strategies to Improve Your Average Winner and Reduce Your Average Loser
Improving your average winner vs average loser is an iterative process that involves refining both your trading strategy and execution. Here are several strategies to consider:
- Trend-Following Techniques
- Rationale: If you catch a strong trend, your winners can become significantly larger than your losers.
- How: Use moving averages, trendlines, or breakout strategies to identify and ride trends.
- Tighten Your Stop Losses
- Rationale: Reducing your average loser is often the quickest way to improve overall profitability.
- How: Place stops just below (for longs) or above (for shorts) a significant support/resistance level. Consider trailing stops if the market is trending in your favor.
- Pyramiding Into Winning Trades
- Rationale: Adding to positions that move in your favor can increase the average size of winners without substantially increasing risk.
- How: Scale in only after the initial position shows a profit and move stop losses accordingly to manage downside.
- Let Your Winners Run
- Rationale: One of the primary reasons for a small average winner is premature exit.
- How: Use partial profit-taking strategies to lock in gains, but keep a portion of the position open to ride extended moves.
- Selective Entry Signals
- Rationale: Only taking trades with a favorable risk-reward setup increases the probability that your average winner will be larger than your average loser.
- How: Implement filters such as volume requirements, technical indicators, or chart patterns to ensure high-conviction trades.
- Review and Adjust
- Rationale: Continuous improvement relies on reviewing your trading metrics and making data-driven adjustments.
- How: Schedule a weekly or monthly review session. Identify which trades had exceptionally large losers and figure out if they were preventable or part of normal variance.
Using Journals and Data Tracking for Continuous Improvement
A trading journal is an invaluable tool for any trader looking to refine their approach systematically. If you’re not logging your trades and reviewing them, you’re flying blind when it comes to improving your average winner vs average loser. Here’s how you can make the most of your journal:
- Data Points to Record
- Entry and exit prices
- Reason for entry (technical setup, fundamental catalyst, etc.)
- Stop-loss placement and take-profit level
- Actual outcome in terms of profit or loss
- Screenshots of charts at entry and exit
- Analyzing the Data
- Look for patterns in winning trades: Are you consistently entering at the right time but exiting too soon?
- Identify recurring issues in losing trades: Are you ignoring certain signals or failing to place stops correctly?
- Creating Actionable Insights
- If you notice large losers tend to come from trades against the prevailing trend, consider removing counter-trend strategies from your playbook.
- If your winning trades tend to cap out at a certain profit level, examine whether you could adjust your exit strategy for bigger gains.
- Setting Goals and Benchmarks
- Set a specific target for your average winner vs average loser ratio. For example, aim for a 2:1 ratio over the next quarter.
- Compare your monthly performance against these goals to measure progress.
By systematically logging and reviewing trades, you’ll have a clearer picture of how your average winners and losers are evolving, allowing you to make more informed decisions.
Recommended Tool: TradeZella
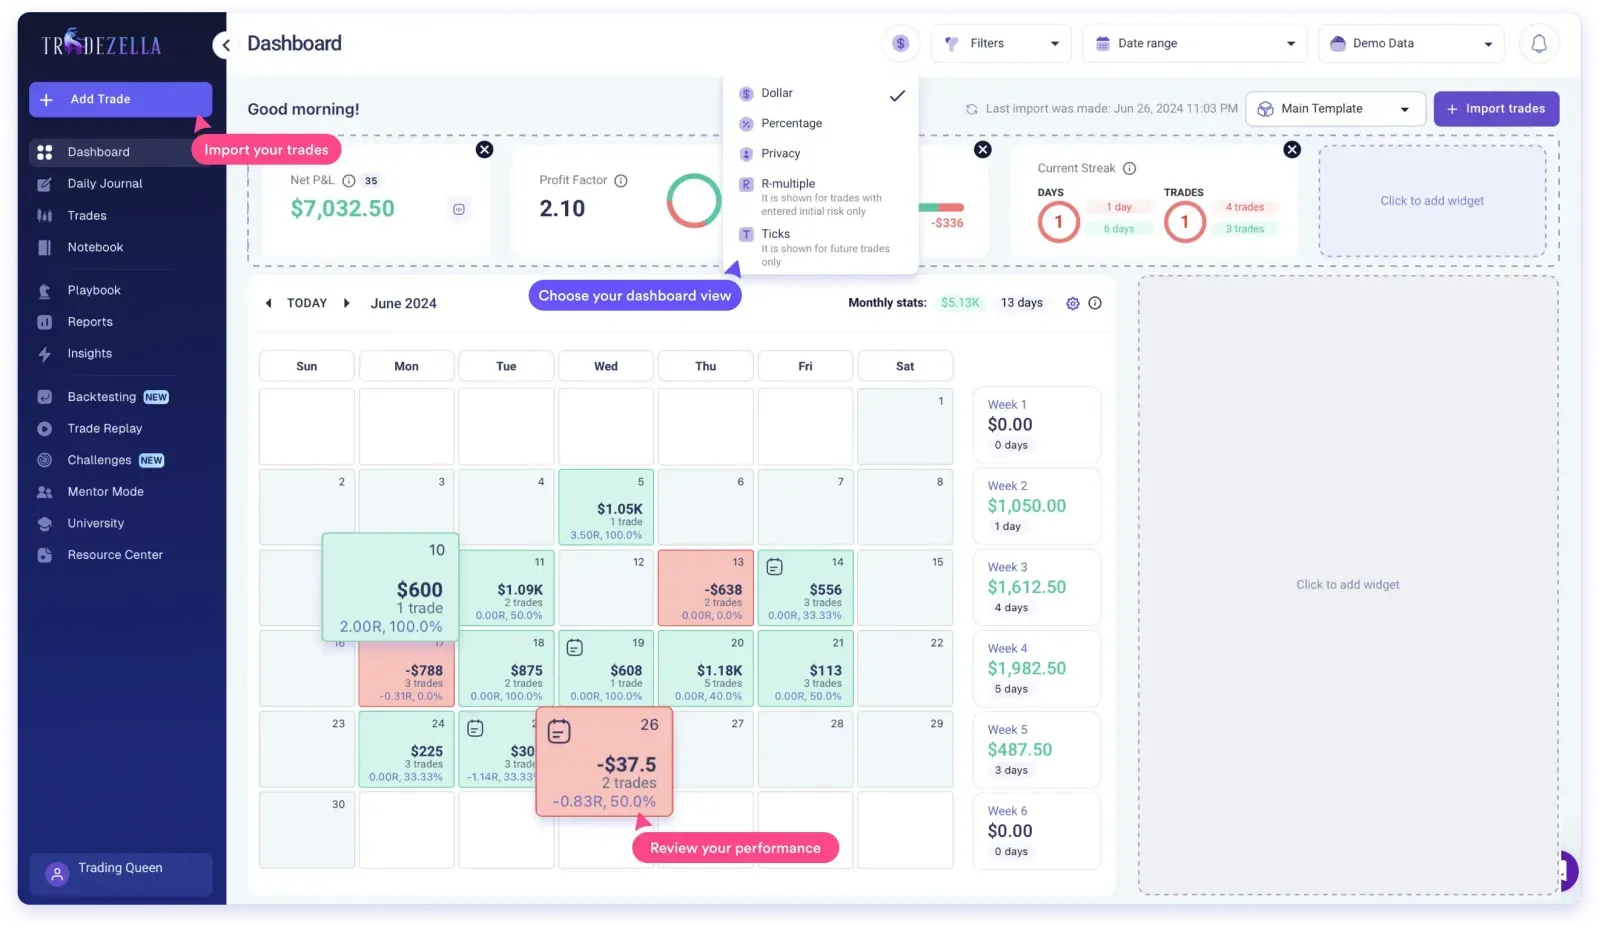
Enhance your trading performance with TradeZella, a powerful trading journal designed to simplify trade logging and analysis.
Key Features:
- Automatic Trade Import: Easily sync trades from supported platforms.
- Detailed Analytics: Track metrics like average winners, losers, and risk-reward ratios.
- Goal Setting: Set and monitor targets to improve performance.
- Actionable Insights: Identify patterns to refine your strategy.
Best Practices for Mastering Average Winner vs Average Loser
Below is a concise list of best practices to keep in mind as you work to master these metrics:
- Start with a Clear Strategy
- You can’t improve your averages without a well-defined entry and exit approach.
- Implement Robust Risk Management
- Always know your maximum risk per trade and use stop losses effectively.
- Maintain a Trading Journal
- Document all trades and regularly review them to identify patterns that affect your average winners and losers.
- Focus on Execution Quality
- Even the best strategy can fail if you consistently execute trades late or mismanage exits.
- Use Data-Driven Adjustments
- Base changes to your trading plan on real numbers—like average winners, average losers, and win rate—rather than on gut feelings or market hype.
- Control Emotions
- Fear and greed are the two biggest roadblocks to disciplined trading.
- Practice mindfulness or step away from the screen if you feel overwhelmed.
- Stay Flexible
- Market conditions change, and so should you. A strategy that works in a volatile environment might not perform as well in a ranging market.
- Continual Education
- Remain a student of the markets. Stay updated on trading methodologies, risk management techniques, and market developments.
Conclusion
Mastering the relationship between your average winner and average loser is a vital stepping stone in your journey to trading success. By understanding these metrics, you gain deeper insights into how your trading strategy performs under various market conditions. Coupled with additional metrics such as win rate, maximum drawdown, and profit factor, your average winners and losers help form a comprehensive view of your risk profile and profitability potential.
Yet, the power of these metrics doesn’t lie solely in calculation; it’s in the interpretation and application. A strong average winner vs average loser ratio can provide you the psychological edge to remain disciplined, even when faced with losses. It allows you to target strategies that fit your risk tolerance, personality, and market preferences, whether you’re a short-term day trader or a long-term position trader.
Here are the key takeaways to ensure you’re leveraging these metrics for long-term success:
- Understand the Math: Know how to calculate and interpret your average winner and loser.
- Tie Them to a Trading Plan: Your entry, exit, and risk management rules should be aligned with the goal of optimizing this ratio.
- Adapt and Evolve: Market conditions shift, and so should your approach. A strategy that yields a 3:1 ratio in trending markets might need adjustment in choppy or ranging markets.
- Keep Learning: Continuous education, journaling, and data analytics help refine your trading strategy and keep your average winners larger than your average losers.
Ultimately, it’s not about having zero losers—that’s impossible. It’s about making sure your losing trades are controlled and that your profitable trades outpace those losses over time. When you focus on maintaining a healthy average winner vs average loser, you position yourself on a stable path toward consistent profitability and trading mastery.
Frequently Asked Questions (FAQs)
These FAQs aim to address common concerns and enhance your understanding of how to master average winners and losers for trading success.
1. What is the difference between average winner and average loser in trading?
The average winner represents the average profit you make on winning trades, while the average loser indicates the average loss on losing trades. Comparing these metrics helps traders understand the balance of risk and reward in their strategy.
2. Why is it important to compare average winners to average losers?
This comparison helps evaluate the effectiveness of your trading strategy. If your average winners are consistently larger than your average losers, you can remain profitable even with a moderate win rate. Conversely, large average losers can erode profits quickly.
3. How can I improve my average winner vs. average loser ratio?
To improve your ratio:
- Use tight stop-losses to minimize losses.
- Let winners run longer by using trailing stops or partial exits.
- Focus on high-quality setups with favorable risk-reward ratios.
- Regularly review and refine your strategy based on trade performance.
4. What role does the risk-reward ratio play in average winners and losers?
The risk-reward ratio (RRR) directly influences these metrics. For example, with a 2:1 RRR, your average winner should ideally be twice the size of your average loser, ensuring profitability with a balanced win rate.
5. Can I still be profitable if my win rate is low?
Yes! A low win rate can still be profitable if your average winner significantly exceeds your average loser. For example, with a 3:1 risk-reward ratio, you only need to win about 30% of your trades to break even or turn a profit.
6. How does journaling help in improving average winners and losers?
Keeping a trading journal allows you to track and analyze your trades. By identifying patterns in winners and losers, you can adjust your strategy to enhance your performance and refine risk management.
7. Should I focus more on win rate or on average winners and losers?
Both are important, but average winners and losers often hold more weight. A high win rate with small average winners and large average losers can still lead to losses, whereas a balanced or favorable ratio ensures sustainable profitability over time.
8. How often should I review my trading metrics?
Regular reviews are essential. Weekly or monthly reviews are ideal for identifying trends in your performance and making timely adjustments to your trading plan.
