Stock prices fluctuate constantly, and while many attribute these movements to news or economic events, the real driving force is the orders placed by market participants. Prices change as buyers and sellers interact in financial markets, and understanding this interaction is key to mastering how markets work.
This guide explores in detail the mechanisms behind how stock prices change, focusing on critical elements like order books, time and sales records, market dynamics, and supply-demand imbalances. Whether you’re a novice or an experienced trader, gaining a comprehensive understanding of these concepts is essential for making better trading decisions.
The Foundations of Price Movements

At its core, the stock market operates on the principle of supply and demand. Prices move up or down based on the balance—or imbalance—between buyers and sellers. While news and events can influence sentiment, it is the actual buy and sell orders placed in the market that directly affect stock prices.
To understand price changes, let’s delve into the following fundamental elements:
- Order Book (Level II)
- Time and Sales (T&S)
- Market Dynamics and Supply-Demand Interactions
What is an Order Book?
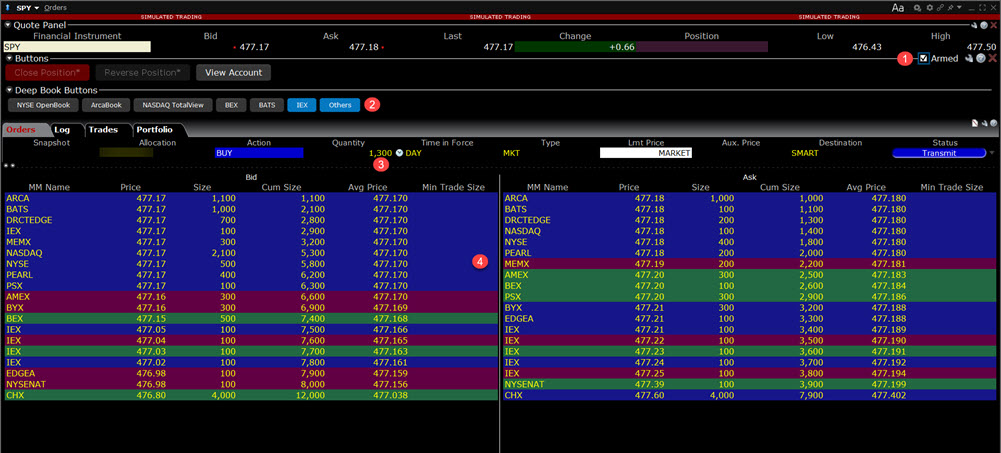
The order book is a real-time electronic ledger maintained by an exchange. It records all active buy and sell orders for a security, displaying the prices and quantities traders are willing to transact.
Key Features of the Order Book
- Transparency: Shows all current limit orders (pending buy and sell orders) placed by market participants.
- Price Levels: Displays prices at which buyers want to buy (bids) and sellers want to sell (asks).
- Market Depth: Reveals the quantity of shares or contracts available at each price level.
Order Book Structure
An order book typically contains two columns:
- Buy Orders (Bids): Prices and quantities buyers are willing to pay.
- Sell Orders (Asks): Prices and quantities sellers are willing to accept.
Example:
| Buyers | Sellers |
|---|---|
| 1,000 shares @ $50 | 1,500 shares @ $55 |
| 800 shares @ $49 | 2,000 shares @ $56 |
| 1,200 shares @ $48 | 1,000 shares @ $57 |
- The best bid (highest bid price) is $50.
- The best ask (lowest ask price) is $55.
- The spread (difference between best bid and best ask) is $5.
Time and Price Priority in the Order Book
When multiple orders are placed, the exchange uses a time and price priority system to determine the sequence of execution.
Price Priority
Orders are ranked by price. Higher bid prices are prioritized for buyers, while lower ask prices are prioritized for sellers.
Time Priority
If two or more orders have the same price, the one placed first takes priority.
Example of Order Execution Priority
- Buy Orders:
- Order A: 500 shares @ $50 (placed at 10:00 AM)
- Order B: 1,000 shares @ $50 (placed at 10:05 AM)
- Sell Orders:
- Order C: 1,000 shares @ $55 (placed at 9:55 AM)
- Order D: 500 shares @ $55 (placed at 10:10 AM)
Impact of Order Matching on Prices
The matching of buy and sell orders updates the order book and causes price changes. For example:
- If a large buy order matches multiple sell orders at higher prices, the stock price rises.
- Conversely, a large sell order may push prices down by matching lower-priced buy orders.
Levels of Market Data: Level I vs. Level II
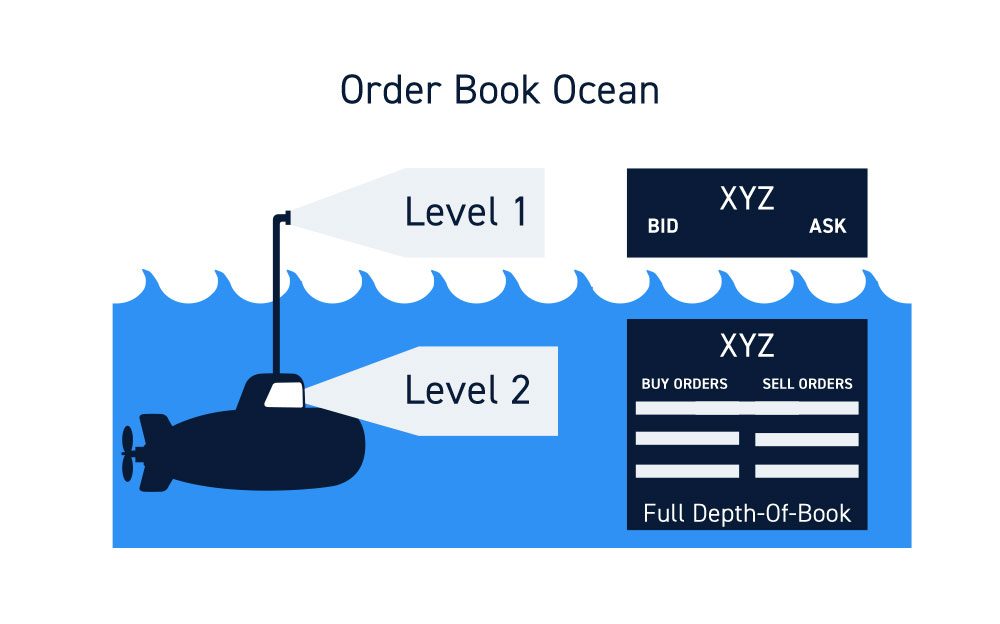
Level I Market Data
Level I provides essential information for a security, including:
- Best bid and ask prices
- Last traded price
- Trading volume
Example:
- Bid: $50
- Ask: $55
- Spread: $5
- Last Price: $52 (price of the most recent trade)
Level II Market Data
Level II expands on Level I by showing the entire order book, including:
- All active limit orders across multiple price levels.
- Market Depth: The number of shares or contracts available at each price level.
How Market Orders Affect Prices
A market order is executed immediately at the best available price. While limit orders are added to the order book, market orders prioritize execution, often causing rapid price changes.
Example of a Market Order
- A trader places a market buy order for 5,000 shares.
- The order matches existing sell orders in the order book:
- 2,000 shares @ $55
- 2,000 shares @ $56
- 1,000 shares @ $57
After execution:
- The best ask rises to $58.
- The last price is updated to $57.
- The spread widens.
Market orders can trigger slippage, especially in low-liquidity markets, where the absence of sufficient opposing orders causes significant price shifts.
Time and Sales: The Record of Trades
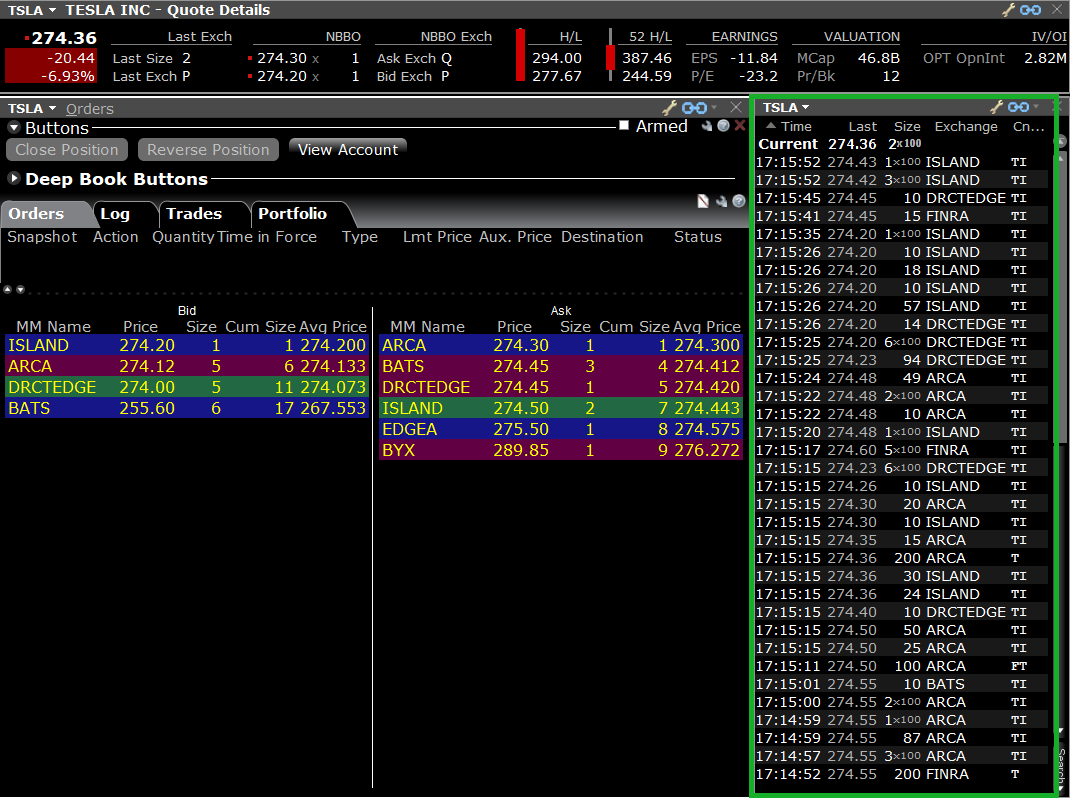
The time and sales (T&S) log provides a detailed record of every executed trade. It includes:
- Time: When the trade occurred.
- Price: The execution price.
- Size: The number of shares or contracts traded.
Importance of Time and Sales
The T&S log is crucial for:
- Identifying trends: Analyzing trade sizes and frequency.
- Determining the last price: Reflecting the most recent transaction.
Example:
| Time | Price | Size |
|---|---|---|
| 10:01:30 | $50 | 1,000 |
| 10:02:15 | $55 | 500 |
| 10:03:45 | $57 | 2,000 |
How Supply and Demand Drive Prices

At its heart, the stock market operates on supply and demand principles:
- When demand exceeds supply, prices rise as buyers outbid each other.
- When supply exceeds demand, prices fall as sellers compete to attract buyers.
Example of Price Movement
- Increased Demand: Positive earnings results cause a surge in buy orders. Buyers place orders at higher prices, moving the best bid up.
- Increased Supply: A large shareholder sells a significant number of shares, pushing the best ask lower.
News and Market Sentiment
News and events can influence supply and demand but do not directly move prices. Instead, they act as catalysts for traders to place orders.
Example:
- Positive News: A company’s announcement of record profits leads to increased buy orders, pushing prices up.
- Negative News: A scandal prompts a wave of sell orders, causing prices to drop.
Common Misconceptions About Price Changes
- Myth: Prices change due to news.
- Reality: Prices change due to orders placed in response to news.
- Myth: A stock’s performance always aligns with its fundamentals.
- Reality: Short-term price movements often reflect market sentiment and order flow, not fundamentals.
Practical Applications for Traders
Understanding order books and market dynamics helps traders:
- Anticipate price movements.
- Identify key levels of support and resistance.
- Develop strategies based on supply and demand.
Advanced tools, like those provided by Interactive Brokers, allow traders to access Level II data and time and sales logs, providing deeper insights into market behavior.
Conclusion
Stock prices change due to the interplay of orders placed by market participants, guided by supply and demand. The order book, time and sales, and market dynamics form the backbone of these price movements. By mastering these concepts, traders can navigate the markets more effectively and make informed decisions.
Glossary of Terms
- Bid: Highest price a buyer is willing to pay.
- Ask: Lowest price a seller is willing to accept.
- Spread: Difference between the bid and ask prices.
- Market Order: Order executed immediately at the best available price.
- Limit Order: Order executed at a specified price.
By learning these details and watching live markets, you’ll build the skills to understand and predict how prices change.
