When it comes to technical analysis in financial markets—be it stocks, forex, commodities, or cryptocurrencies—few tools are as universally relied upon as candlestick charts. Renowned for their intuitive visual representation, candlesticks allow traders to quickly gauge market sentiment, identify potential trend reversals, and time their entries and exits with greater precision. Mastering candlestick patterns isn’t just about recognizing shapes and colors—it’s about understanding the underlying psychology of buyers and sellers and using that knowledge to make more informed trading decisions.
This comprehensive guide will take you through everything you need to know about candlestick patterns, from the fundamentals of how they are constructed to advanced interpretations that help you read market sentiment like a seasoned pro. By the end of this article, you’ll have the knowledge and confidence to incorporate candlestick analysis into your trading strategy and take your market analysis to the next level.
What Are Candlestick Charts?
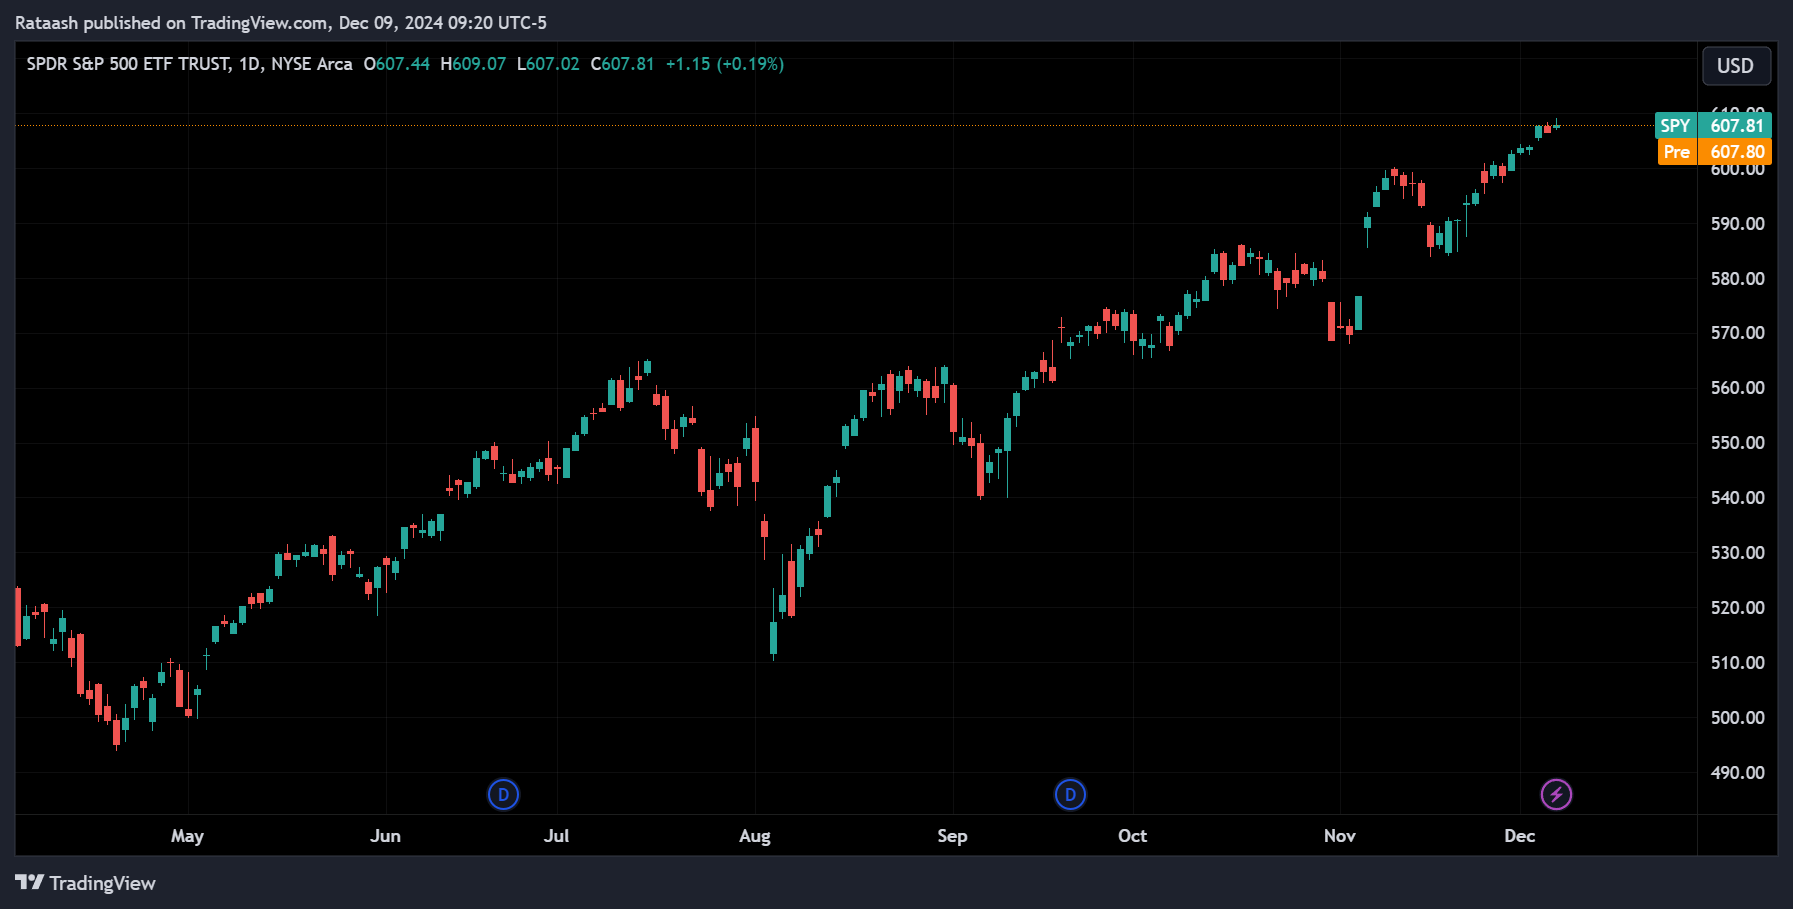
Candlestick charts originated in Japan centuries ago as a method for tracking the price of rice, and today they are a global standard for traders. Each candlestick represents the price activity for a given time period—this could be as short as one minute or as long as a month. Instead of simply plotting a single price point (like a line chart), each candlestick captures four crucial data points:
- Open: The price at the beginning of the selected time interval.
- High: The maximum price reached during that interval.
- Low: The minimum price reached during that interval.
- Close: The final price at the end of the selected time interval.
By displaying all four prices, candlesticks provide a richer snapshot of market behavior, including volatility and shifts in sentiment that may not be visible on a line chart.
Anatomy of a Candlestick
A candlestick is composed of two main parts:
1. The Body:
The body is the rectangular portion of the candlestick. It shows the distance between the opening and closing prices. The color of the body often conveys sentiment:
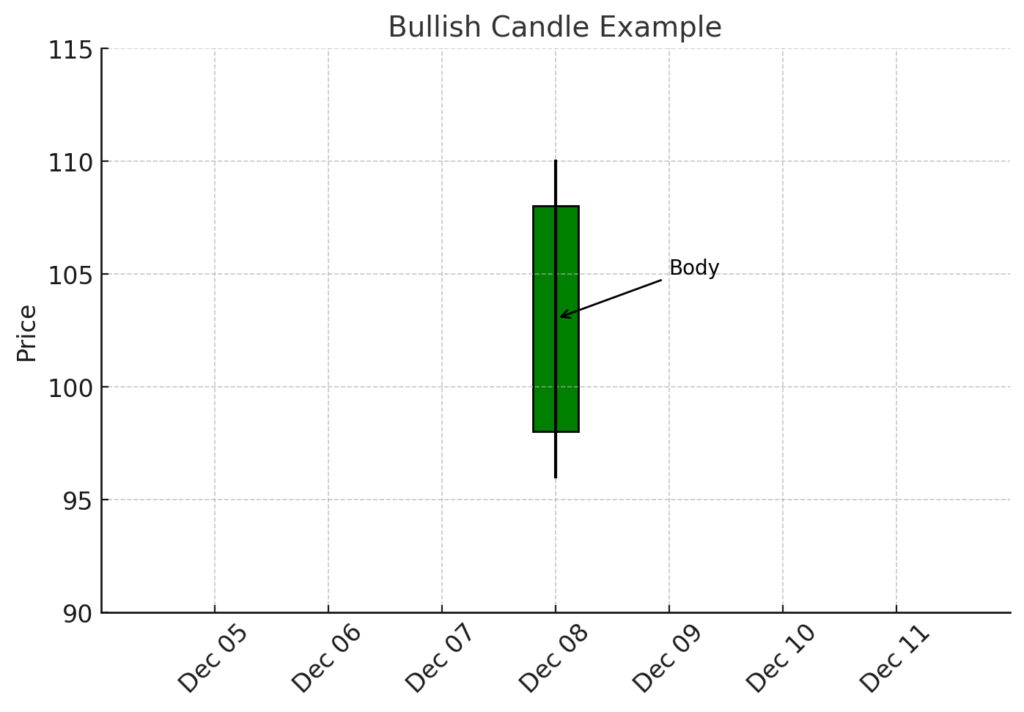
Green (or White) Body: Indicates that the closing price is higher than the opening price. This is typically interpreted as bullish, meaning buyers dominated during that period.
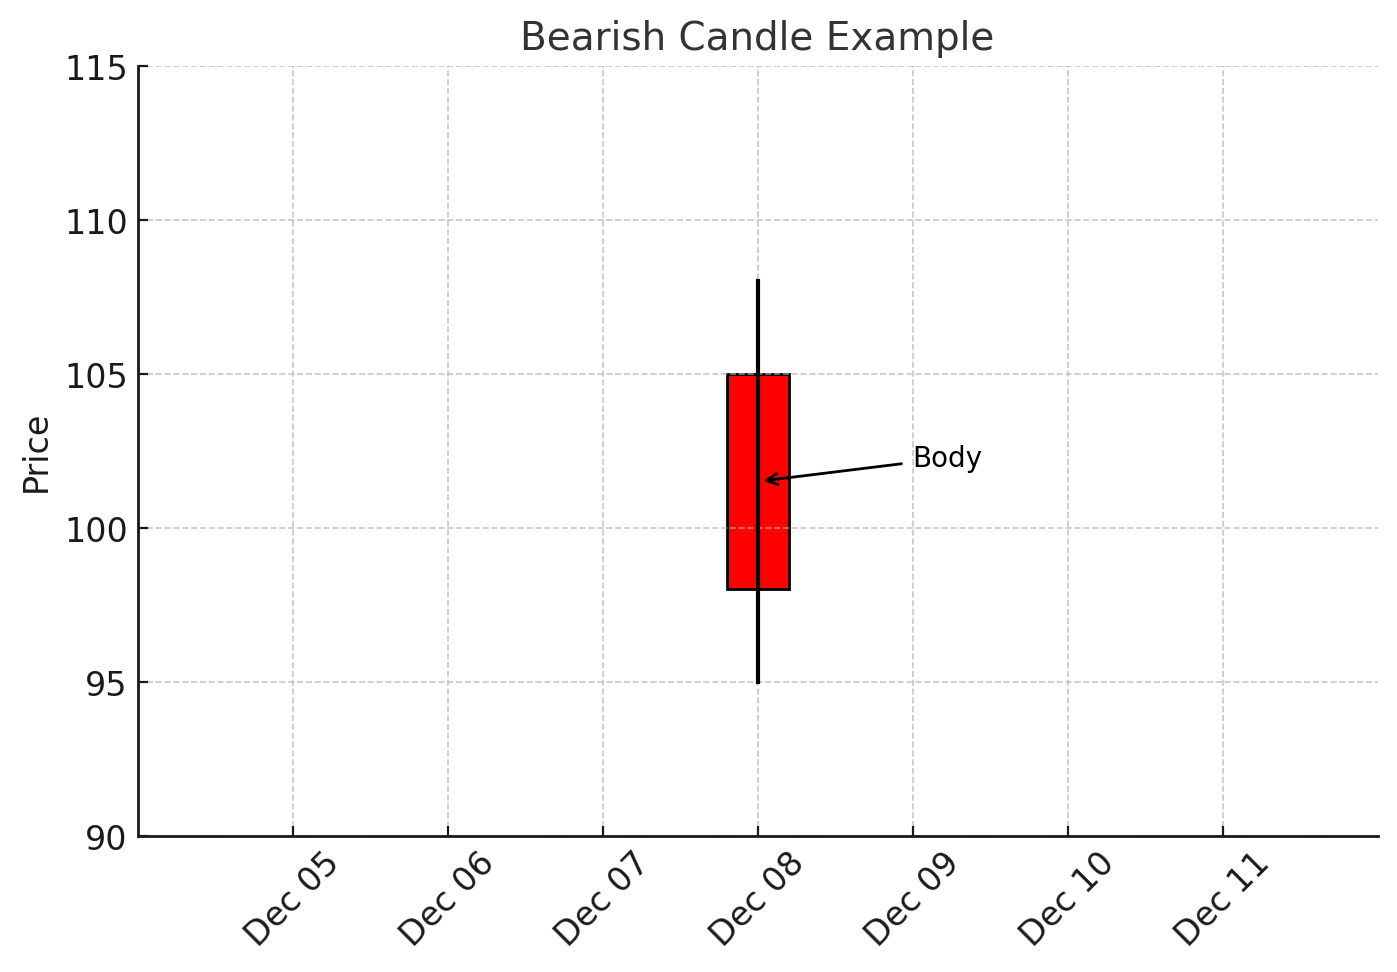
Red (or Black) Body: Indicates that the closing price is lower than the opening price, signaling bearish sentiment, as sellers had more influence.
2. The Wicks (or Shadows):
Thin lines extending above and below the body represent the high and low prices reached during the trading interval.
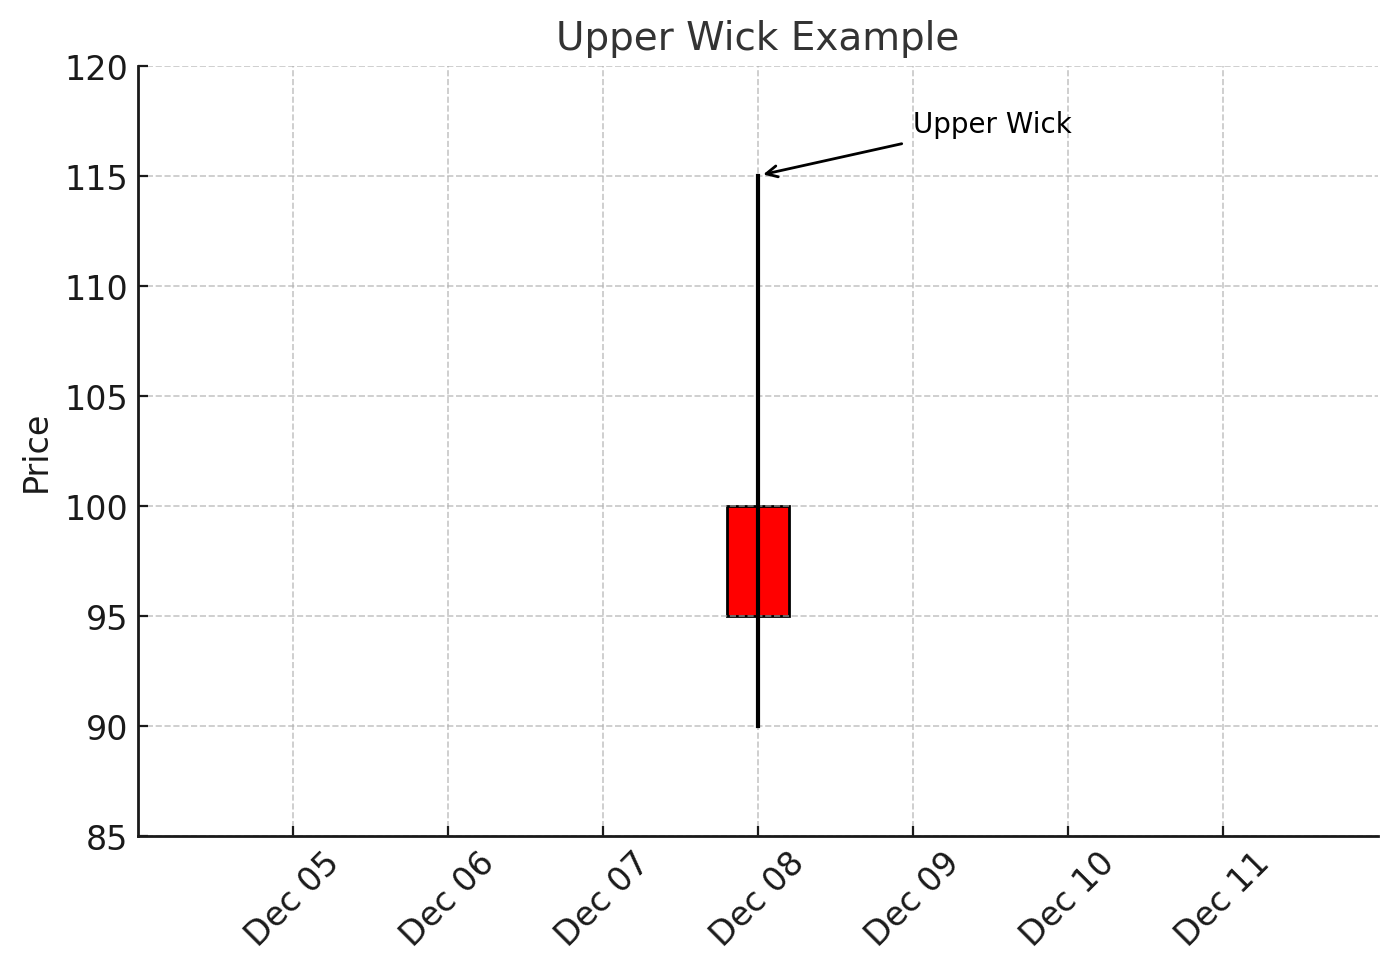
Upper Wick (Shadow): Shows the highest traded price. A long upper wick might suggest that, although buyers pushed the price up, sellers eventually forced it back down before close.
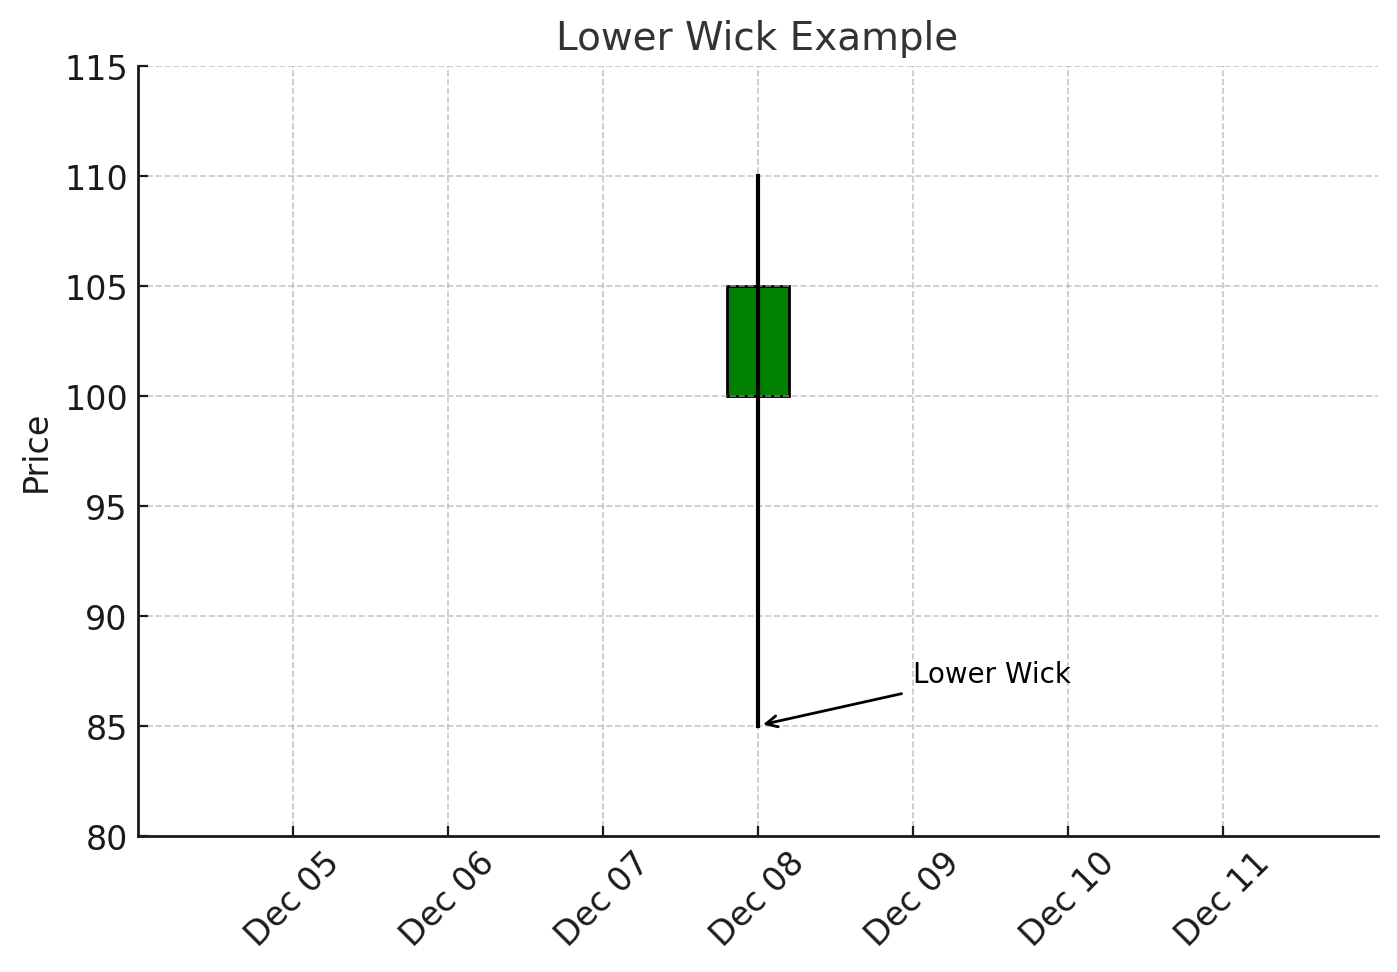
Lower Wick (Shadow): Shows the lowest traded price. A long lower wick might indicate that, although sellers pushed the price down, buyers regained control and pushed it back up.
Why Candlesticks Are Important
Candlesticks condense a wide range of price information into a single visual unit, allowing traders to quickly interpret the ebb and flow of supply and demand. Instead of just knowing where price closed, traders can see the tug-of-war between buyers and sellers throughout the entire session. This level of detail helps identify key turning points, potential continuations, and emerging market sentiment shifts.
Key Advantages of Candlestick Charts:
- Visual Clarity: Candlesticks offer a visually appealing and intuitive method of understanding price action.
- Rich Information: Each candle encapsulates the open, high, low, and close, providing a complete picture for that time frame.
- Pattern Recognition: Over time, certain candlestick shapes and sequences appear frequently and can signal potential reversals or continuations. Recognizing these patterns can help improve your timing and accuracy in trading.
Basic Candlestick Interpretations
Before diving into complex candlestick patterns, it’s essential to fully grasp the basics of bullish and bearish candles, as well as the significance of candle sizes and wicks.
Bullish vs Bearish Candles:
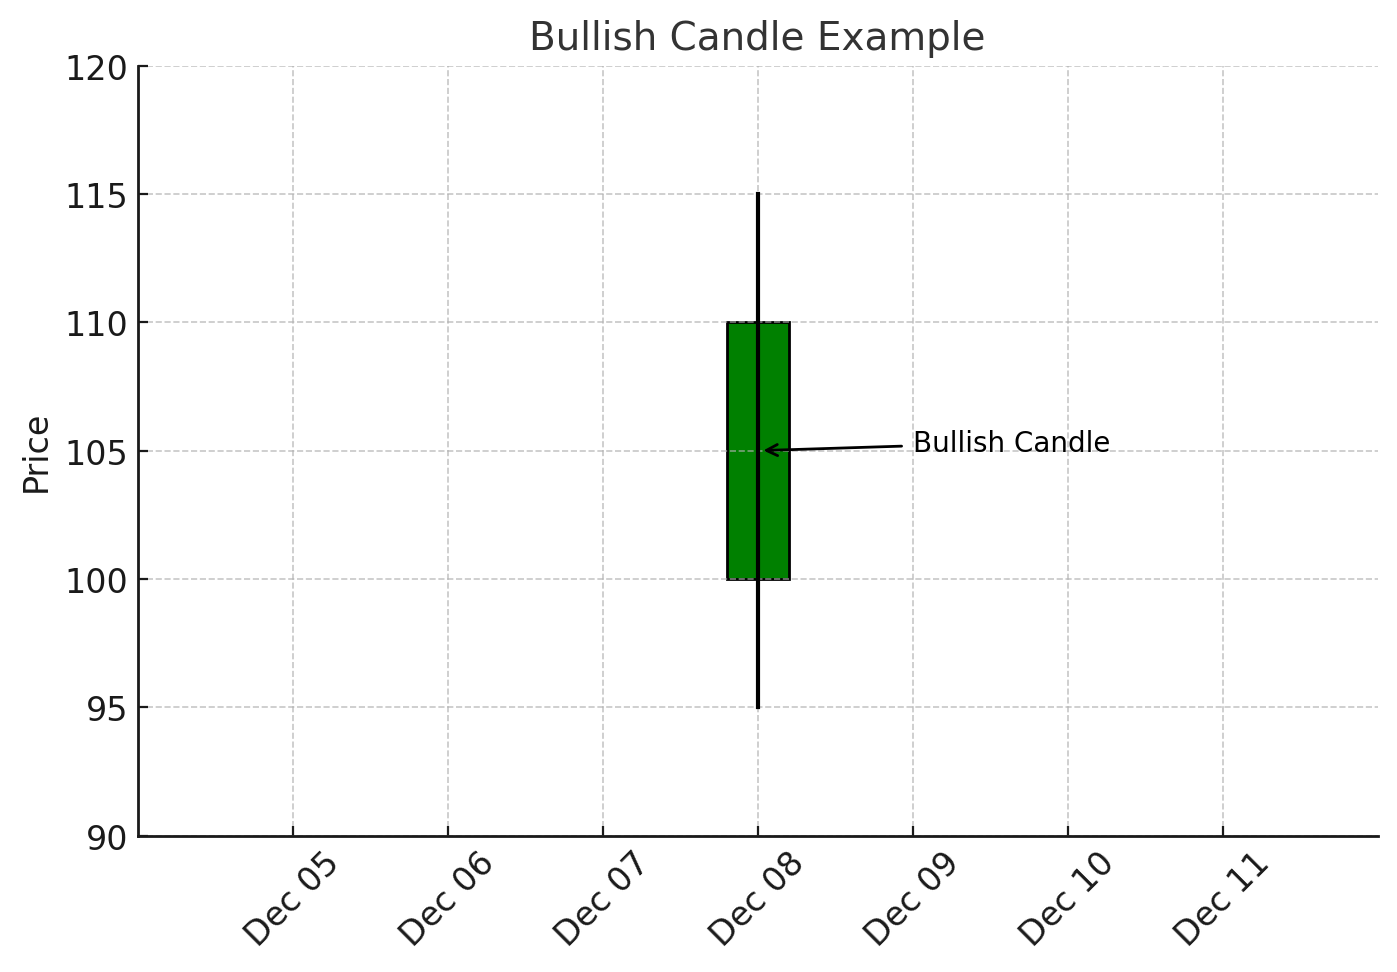
Bullish Candle: The closing price is above the opening price. This candle usually appears in green or white. It suggests that buyers were in control, pushing the price upward during the candle’s timeframe.
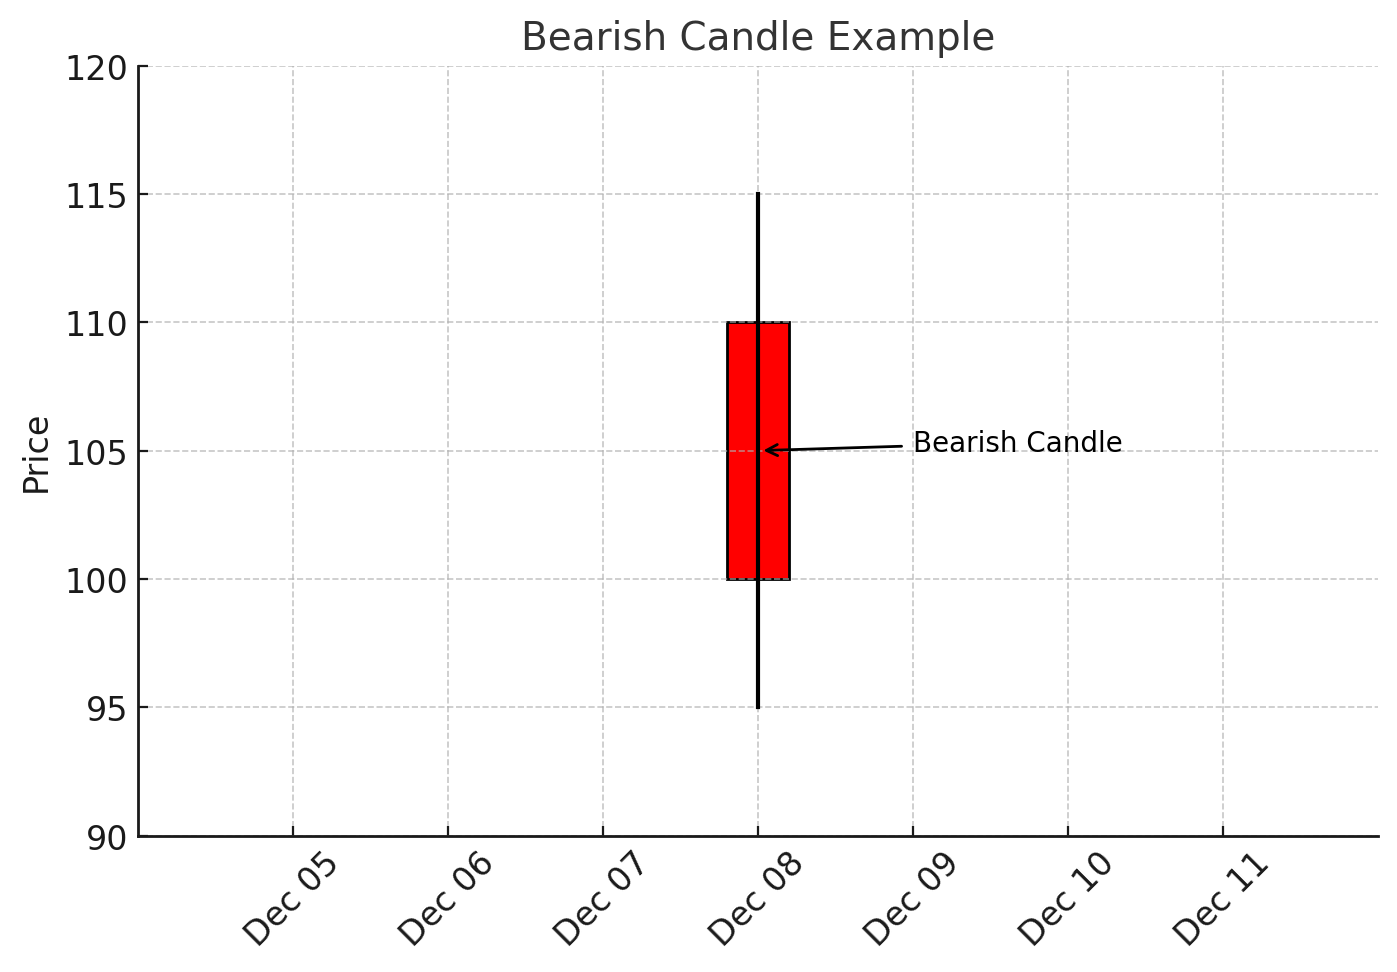
Bearish Candle: The closing price is below the opening price. Often colored red or black, this candle indicates that sellers were dominant, driving the price down.
The Importance of Candle Size:
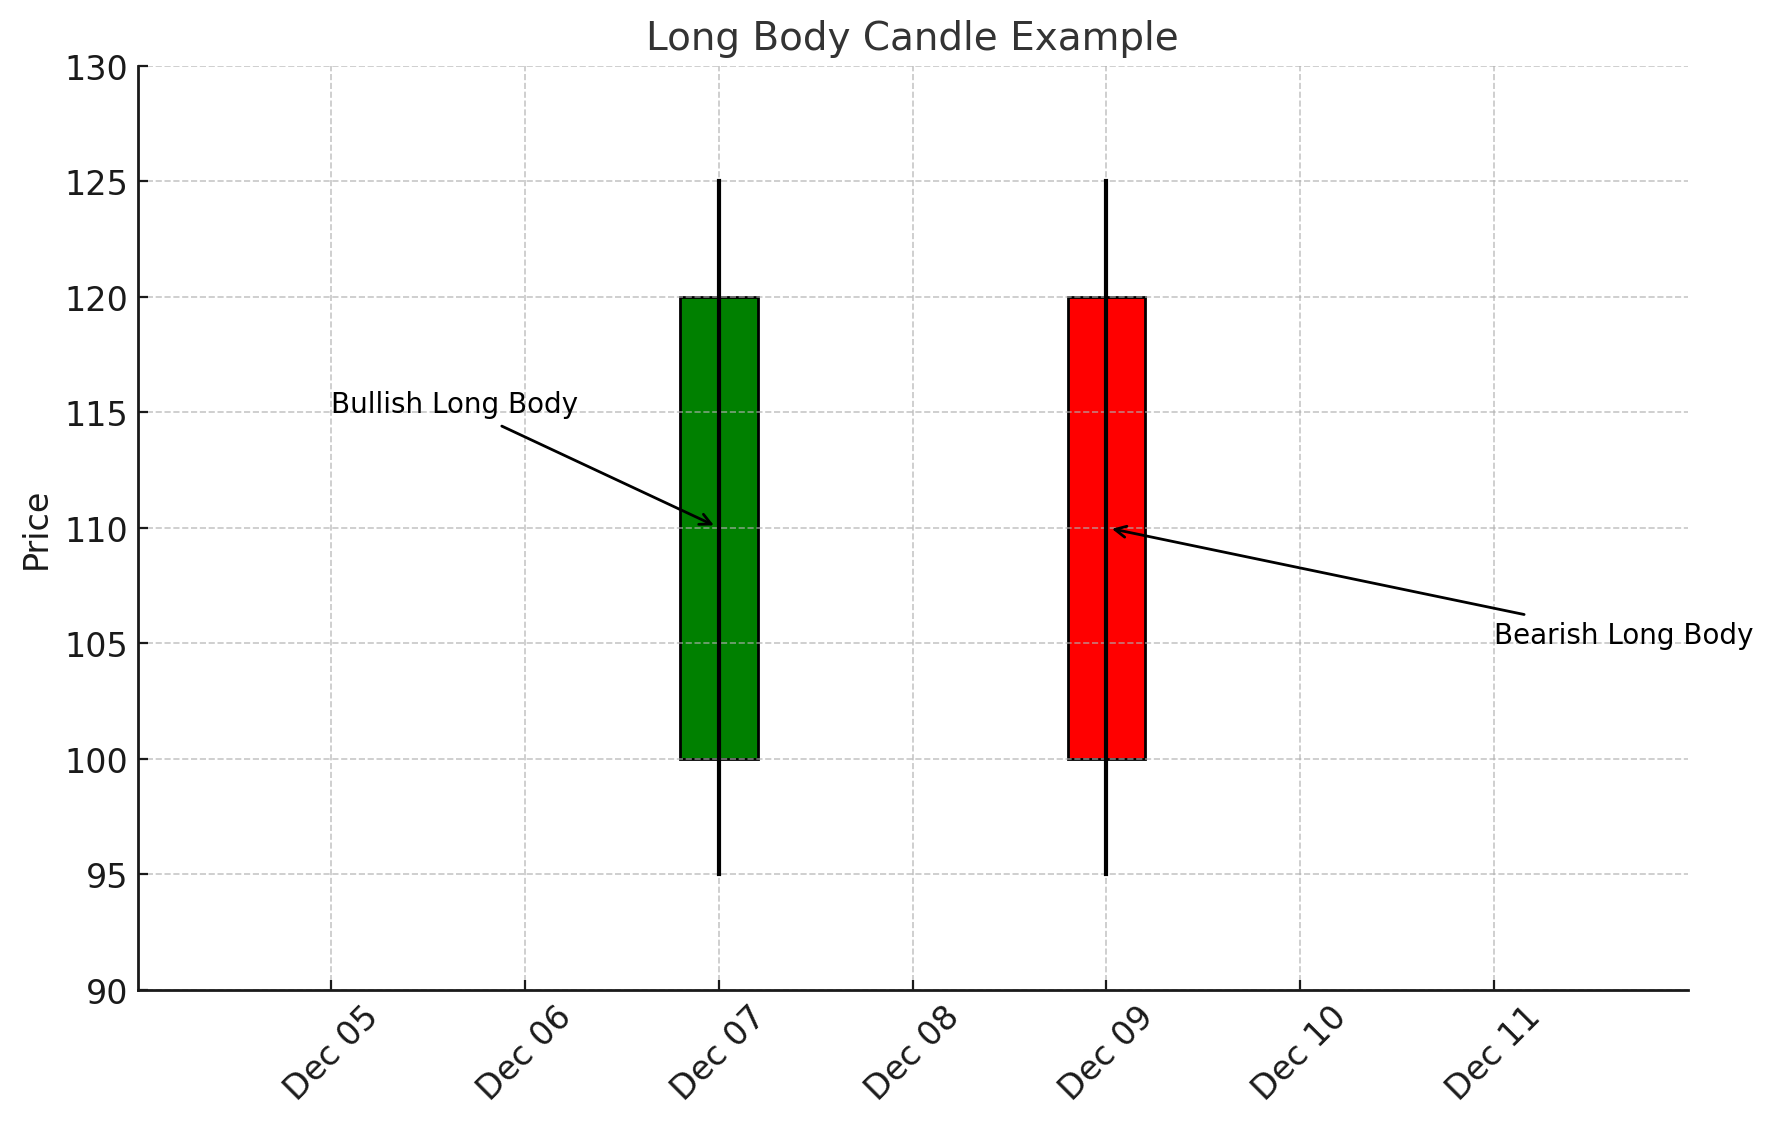
Long Body Candle: A candle with a large body (long distance between open and close) indicates strong buying or selling pressure.
- A large green (bullish) candle suggests high demand, as buyers aggressively lifted prices.
- A large red (bearish) candle points to heavy selling pressure, as sellers forced prices lower.
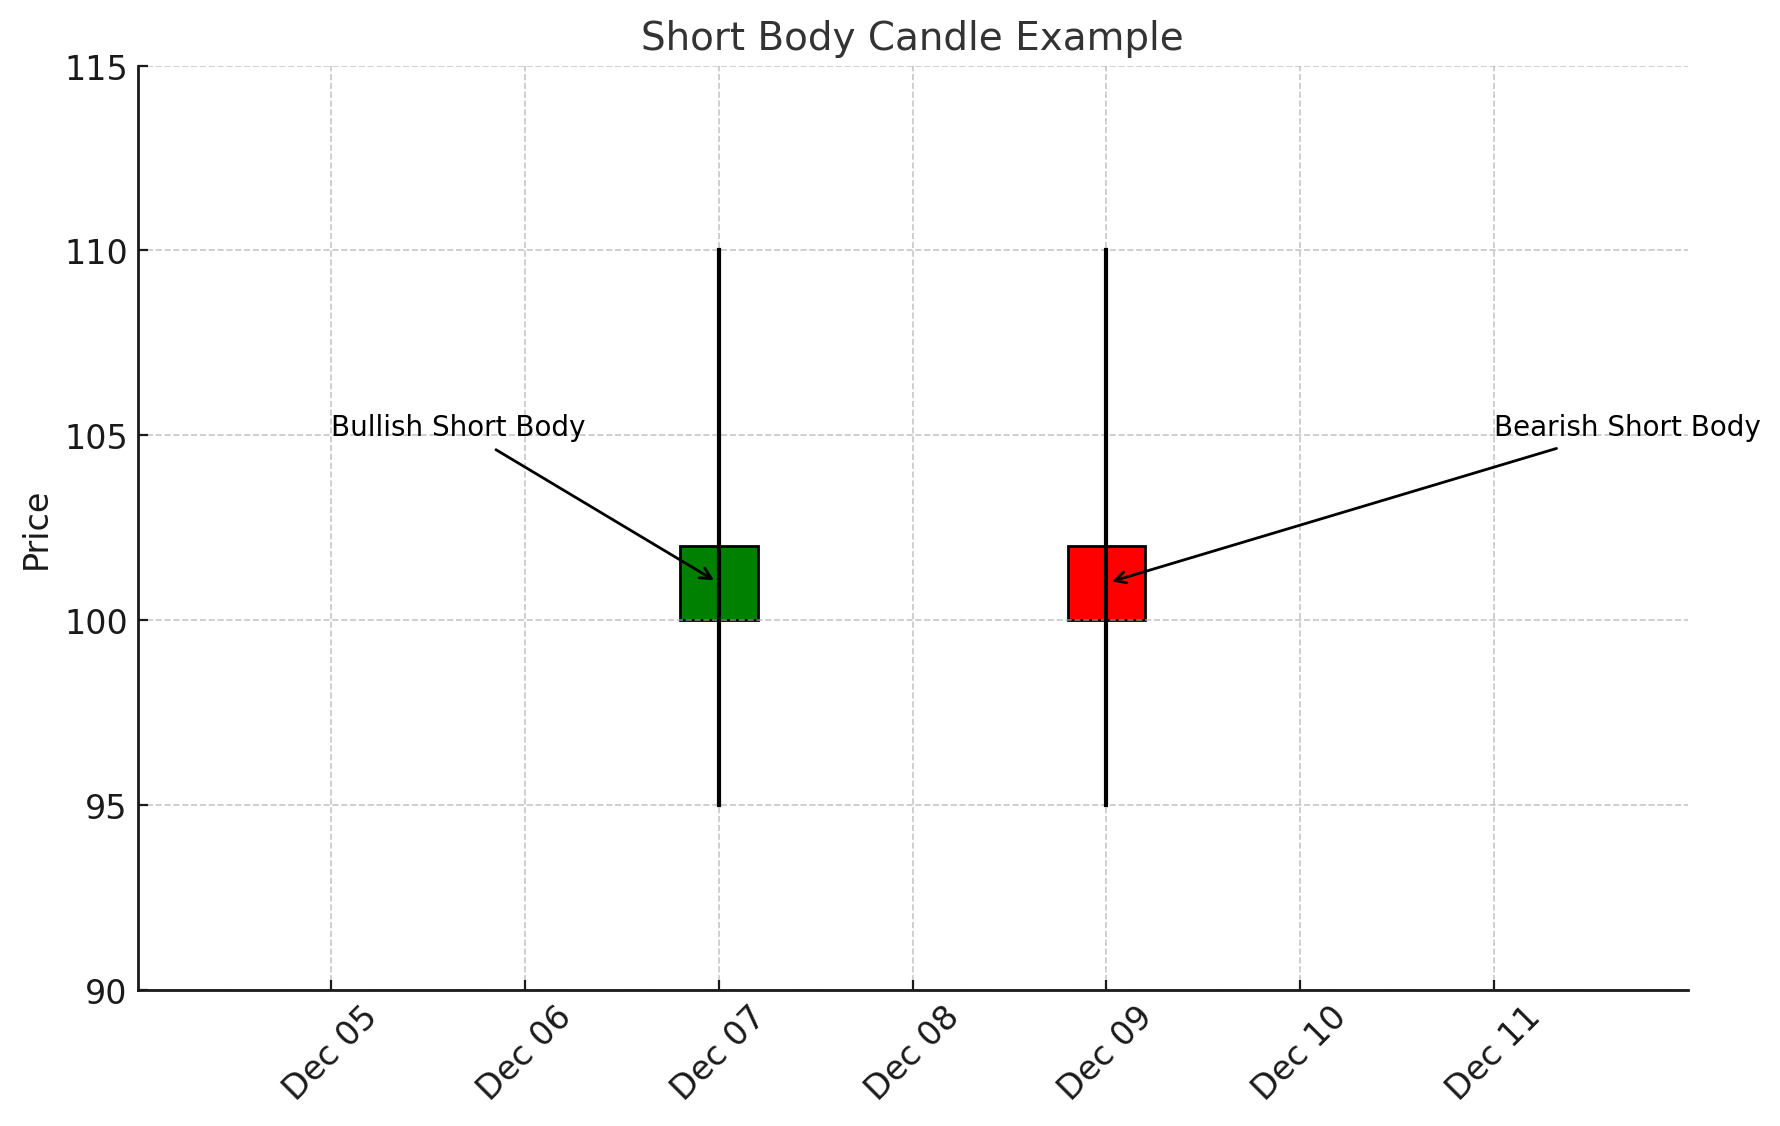
Short Body Candle: A candle with a small body indicates indecision or balance between buyers and sellers. The market may have fluctuated, but prices ended up close to where they started.
Wicks and Their Meaning:
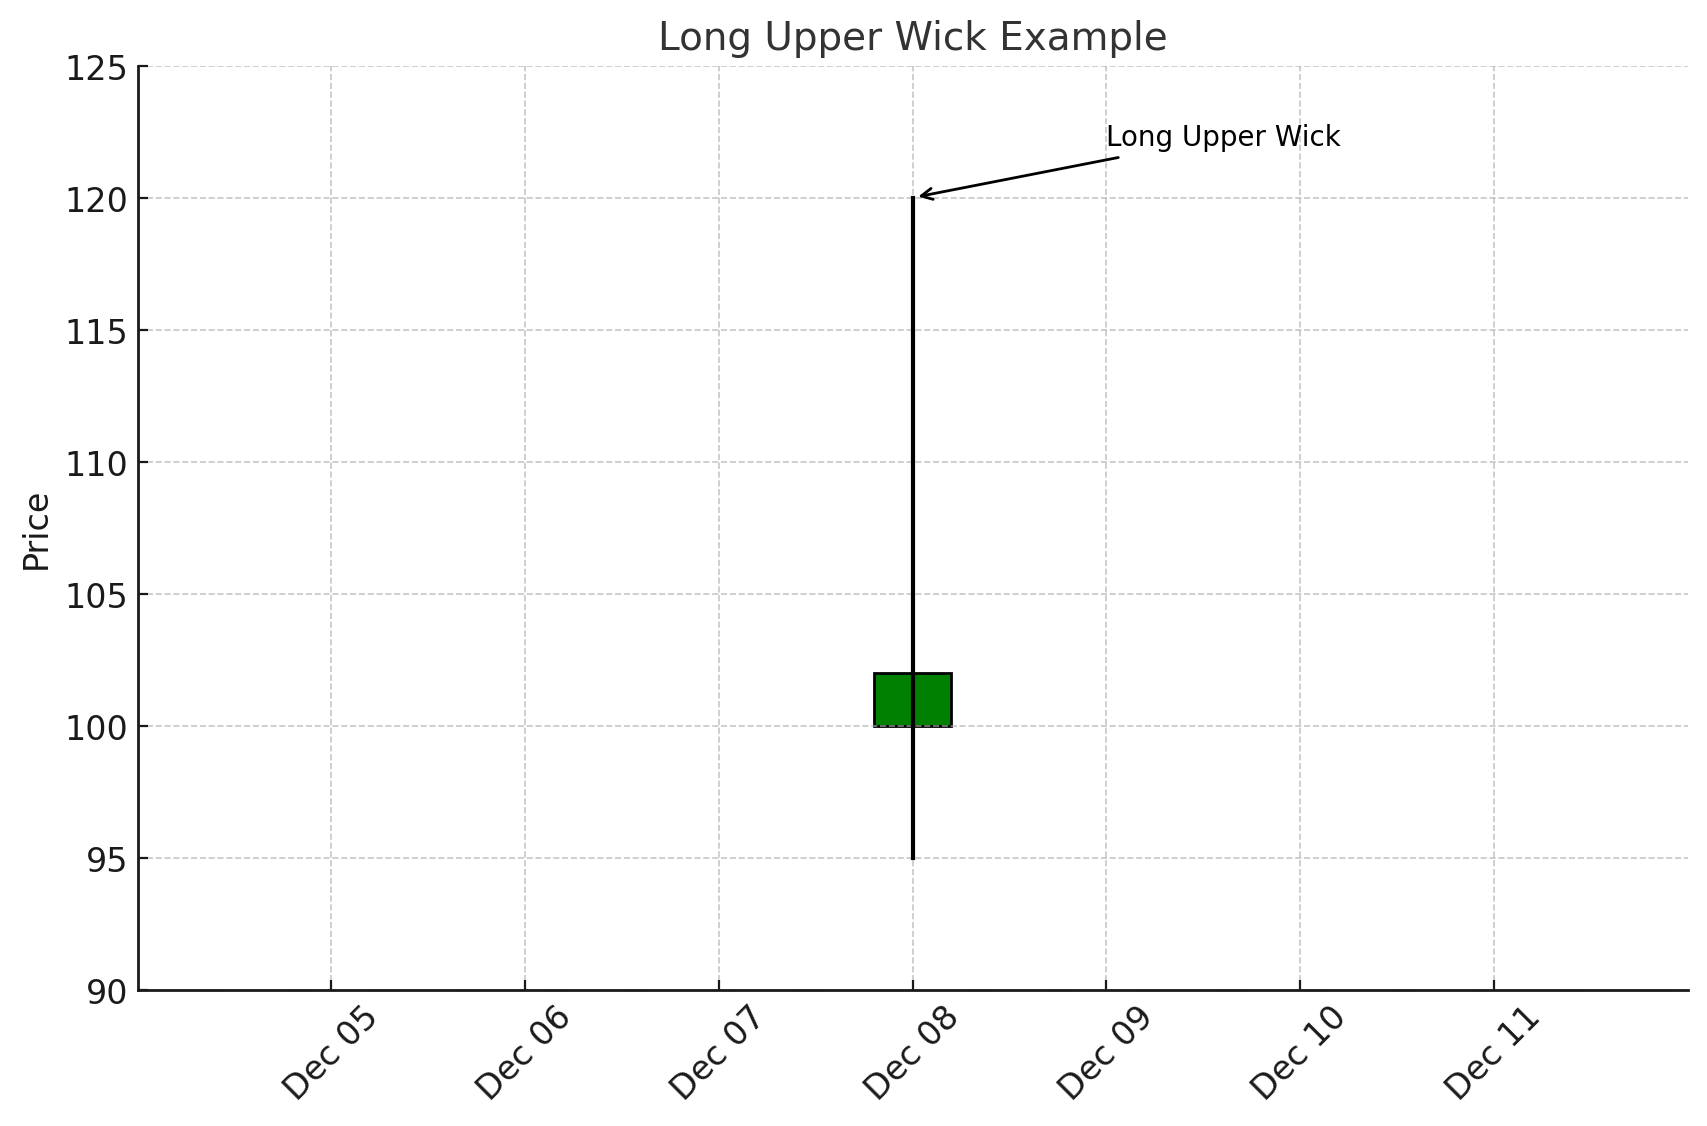
Long Upper Wick: Implies that buyers tried to push the price higher but were met with strong resistance from sellers who pushed it back down.
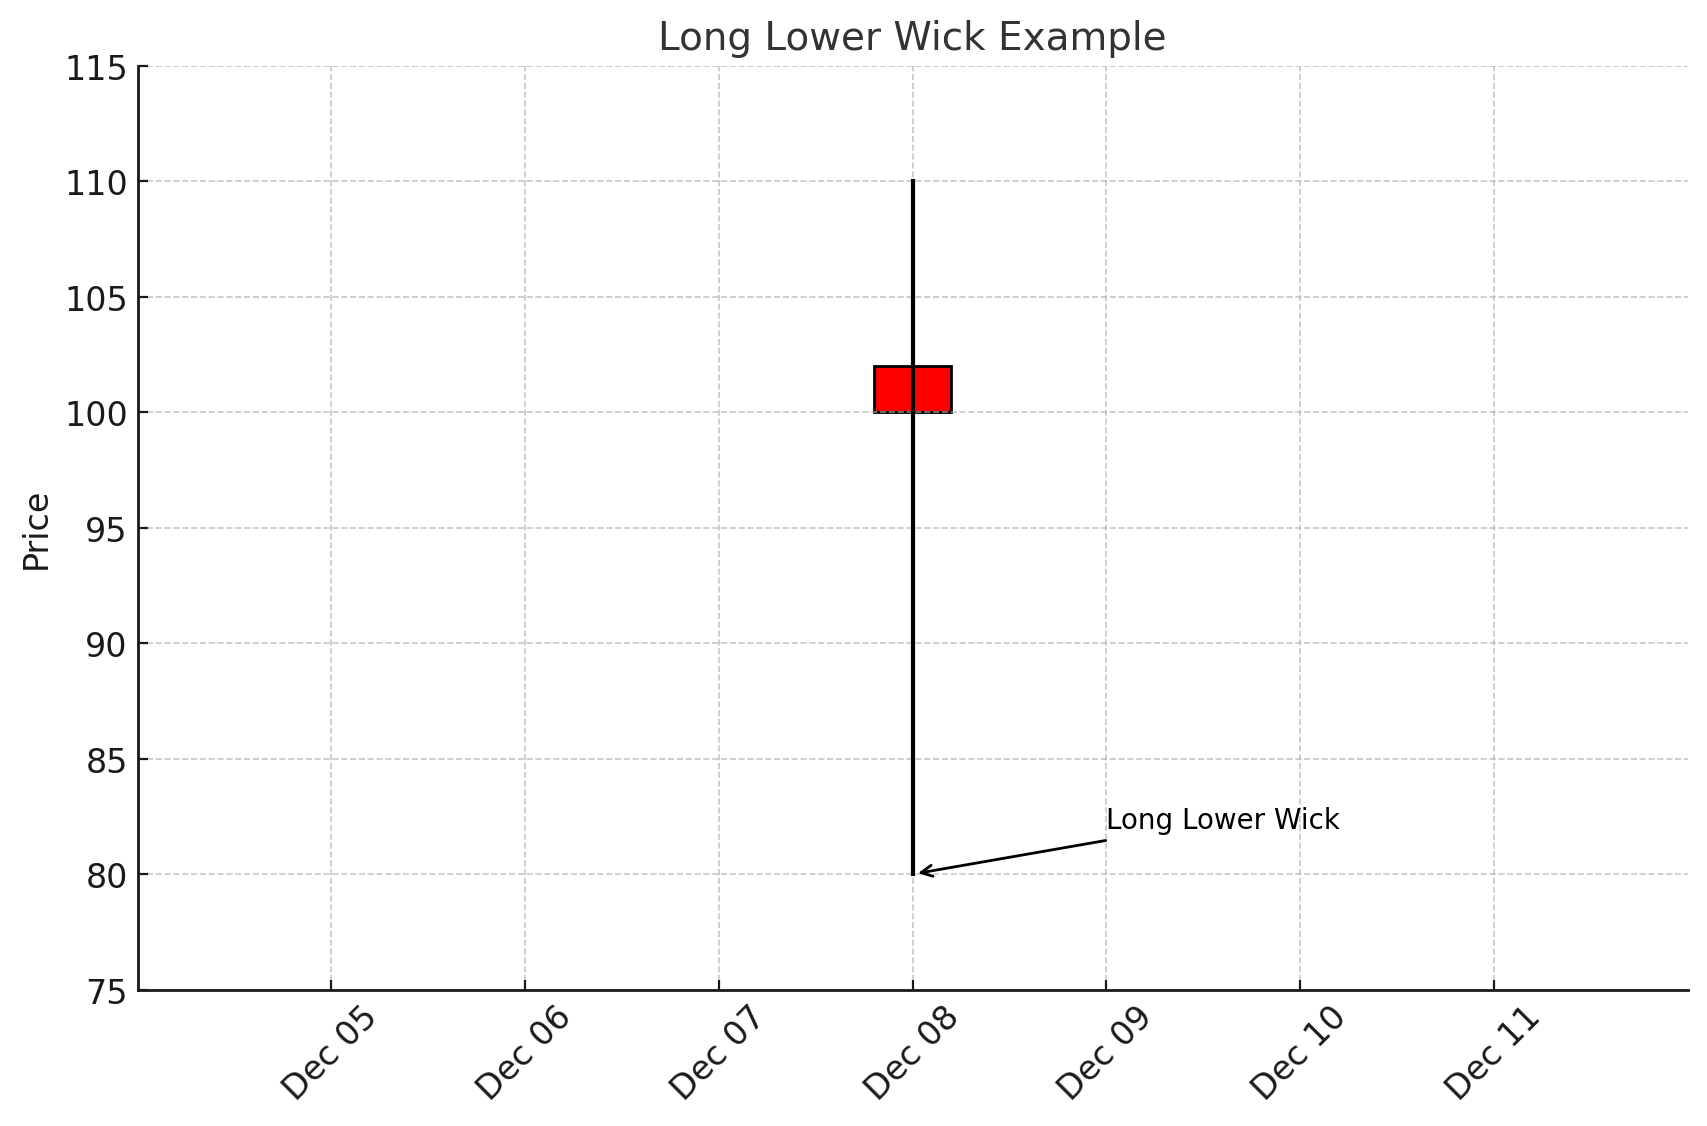
Long Lower Wick: Suggests that sellers drove prices down, but buyers eventually stepped in, pushing prices back up. This can sometimes signal a shift in sentiment.
Understanding Common Candlestick Patterns
Candlestick patterns are formed by one or more individual candles and often hint at a potential change in trend direction or market momentum. While there are dozens of recognized patterns, it’s more important to understand the logic behind them rather than memorizing each by name. Patterns generally fall into two major categories: Reversal Patterns and Continuation Patterns.
1. Doji Candles
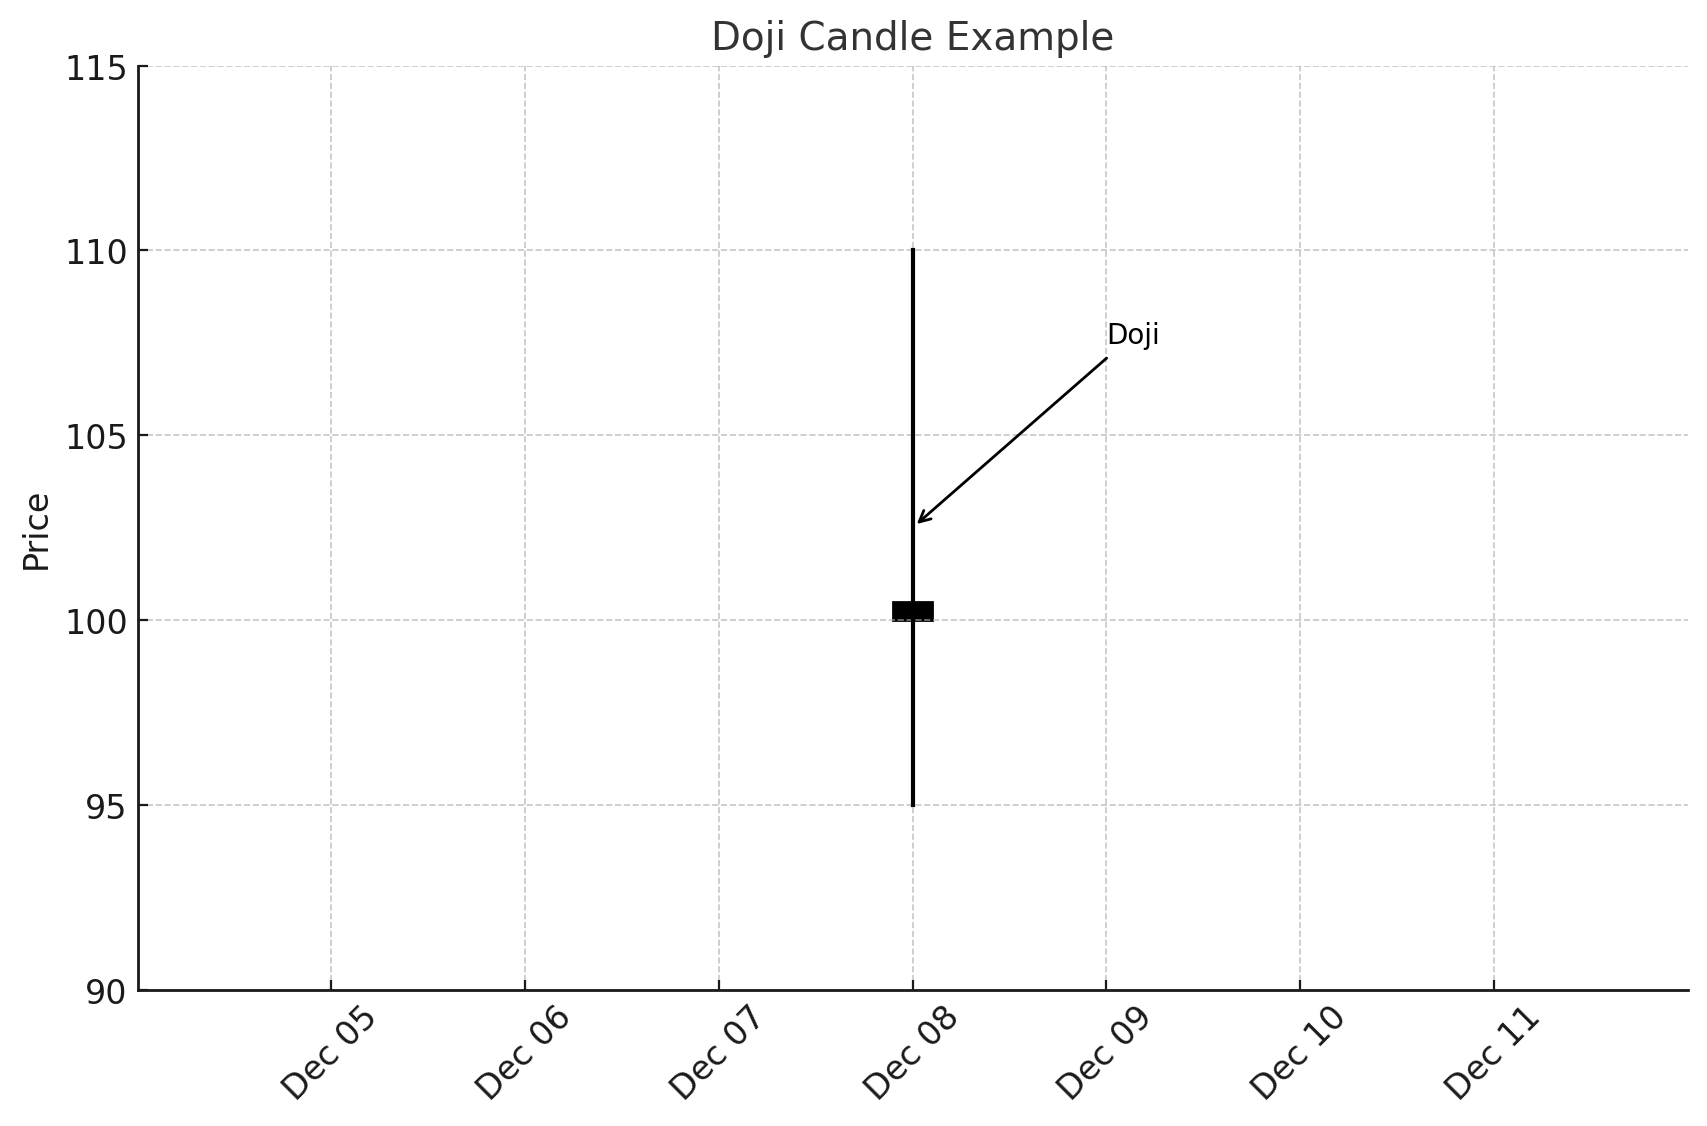
A Doji forms when the opening and closing prices are nearly the same, resulting in a very small body. Although the highs and lows might vary, the small body signifies that neither buyers nor sellers held decisive control. A Doji often signals indecision and can suggest that a trend may be losing momentum or is on the verge of a reversal—especially when it appears after a prolonged uptrend or downtrend.
Key Point: A Doji by itself isn’t a trading signal; rather, it’s a warning sign to watch closely for the next move. Combine Dojis with other indicators or patterns for stronger confirmation.
2. Hammer and Hanging Man
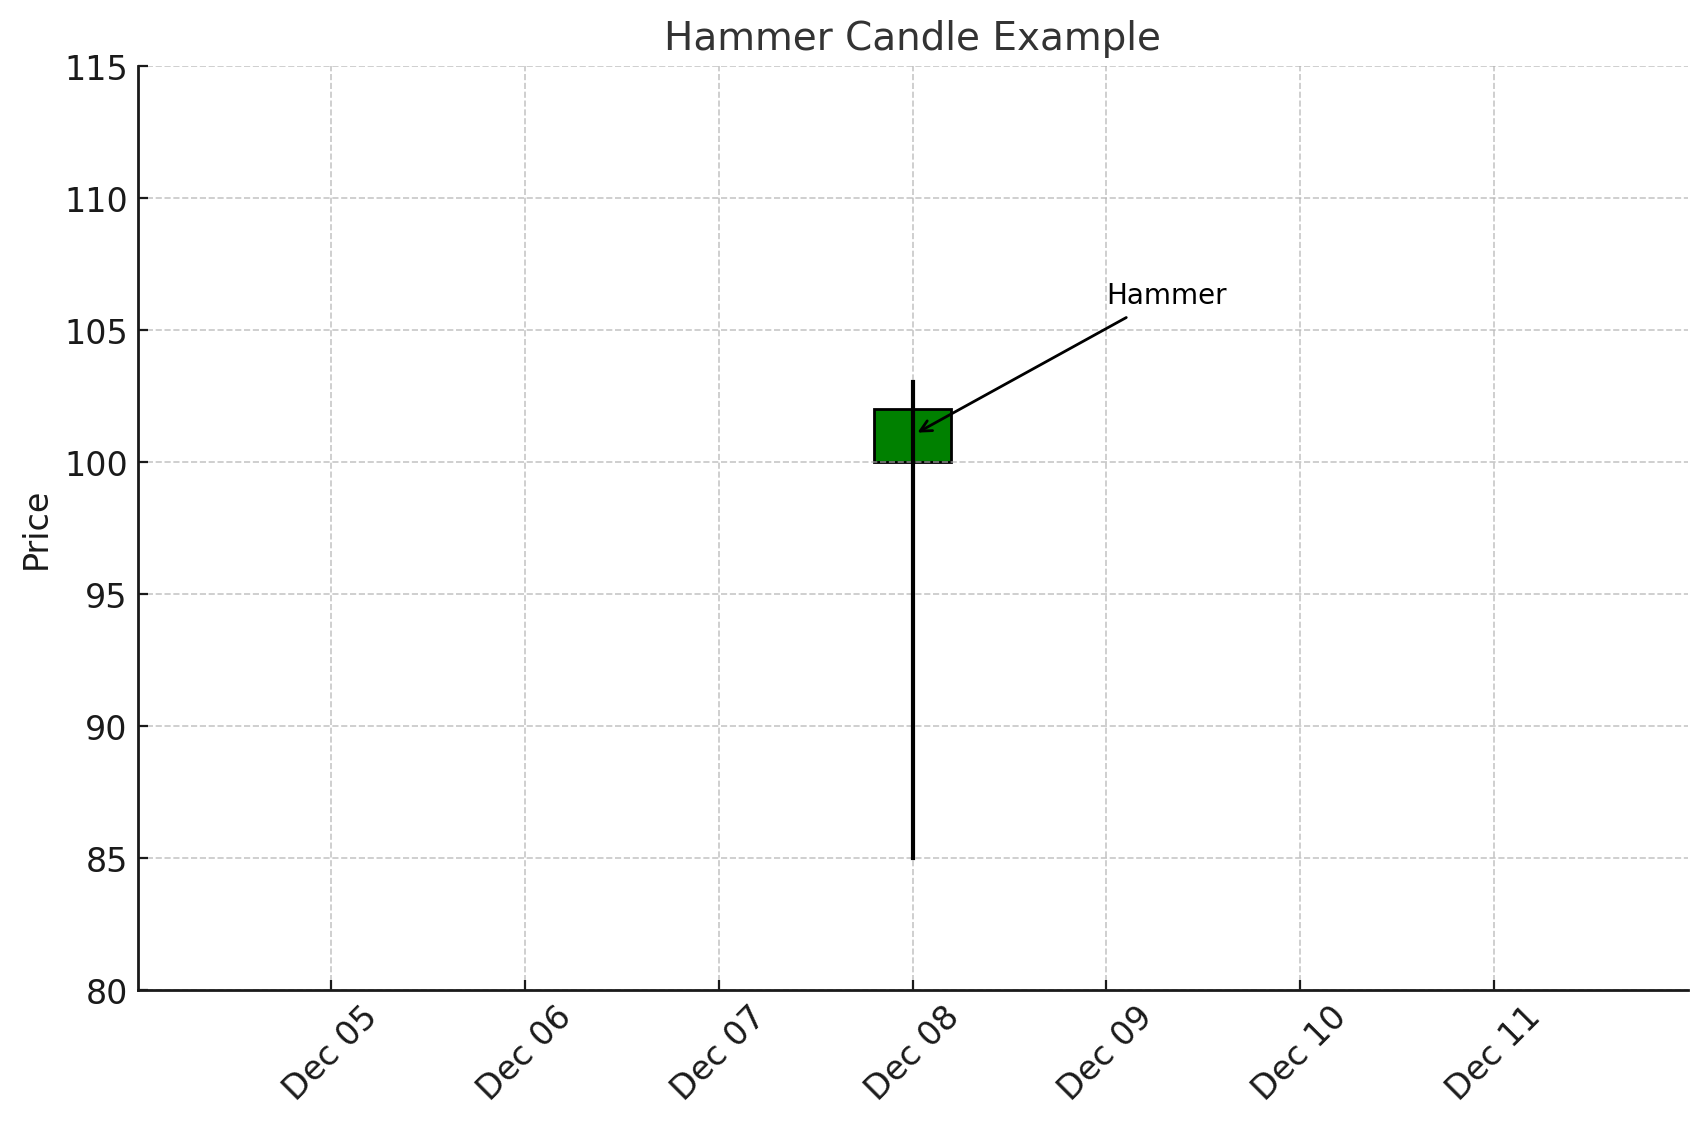
Hammer: A hammer candle has a small body and a long lower wick. It typically appears after a downward move. The long lower wick indicates that sellers drove the price down, but buyers stepped in strongly by the close. A hammer often signifies a potential bullish reversal, especially if it appears at a major support level.
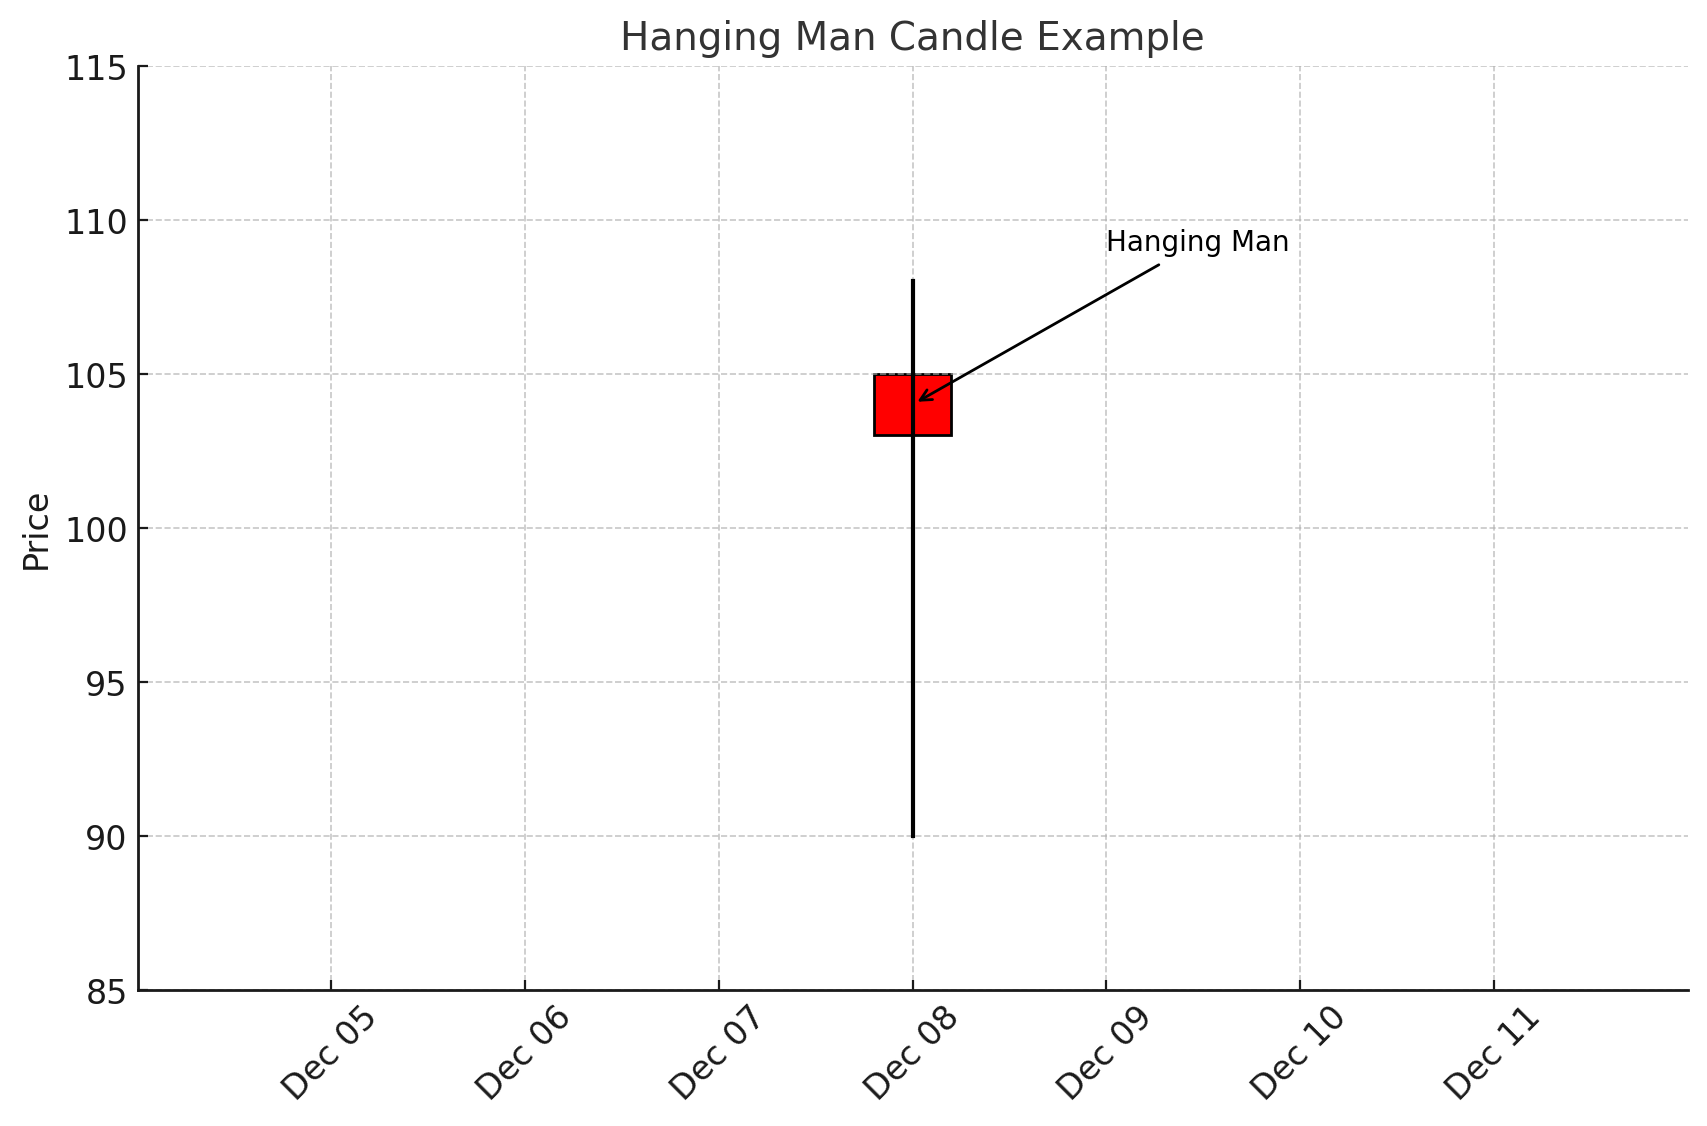
Hanging Man: Almost identical in shape to the hammer, but it appears at the top of an uptrend. The long lower wick shows buyers tried to keep control, but sellers began to push prices down. The hanging man suggests a possible bearish reversal if confirmed by subsequent price action.
3. Inverted Hammer and Shooting Star
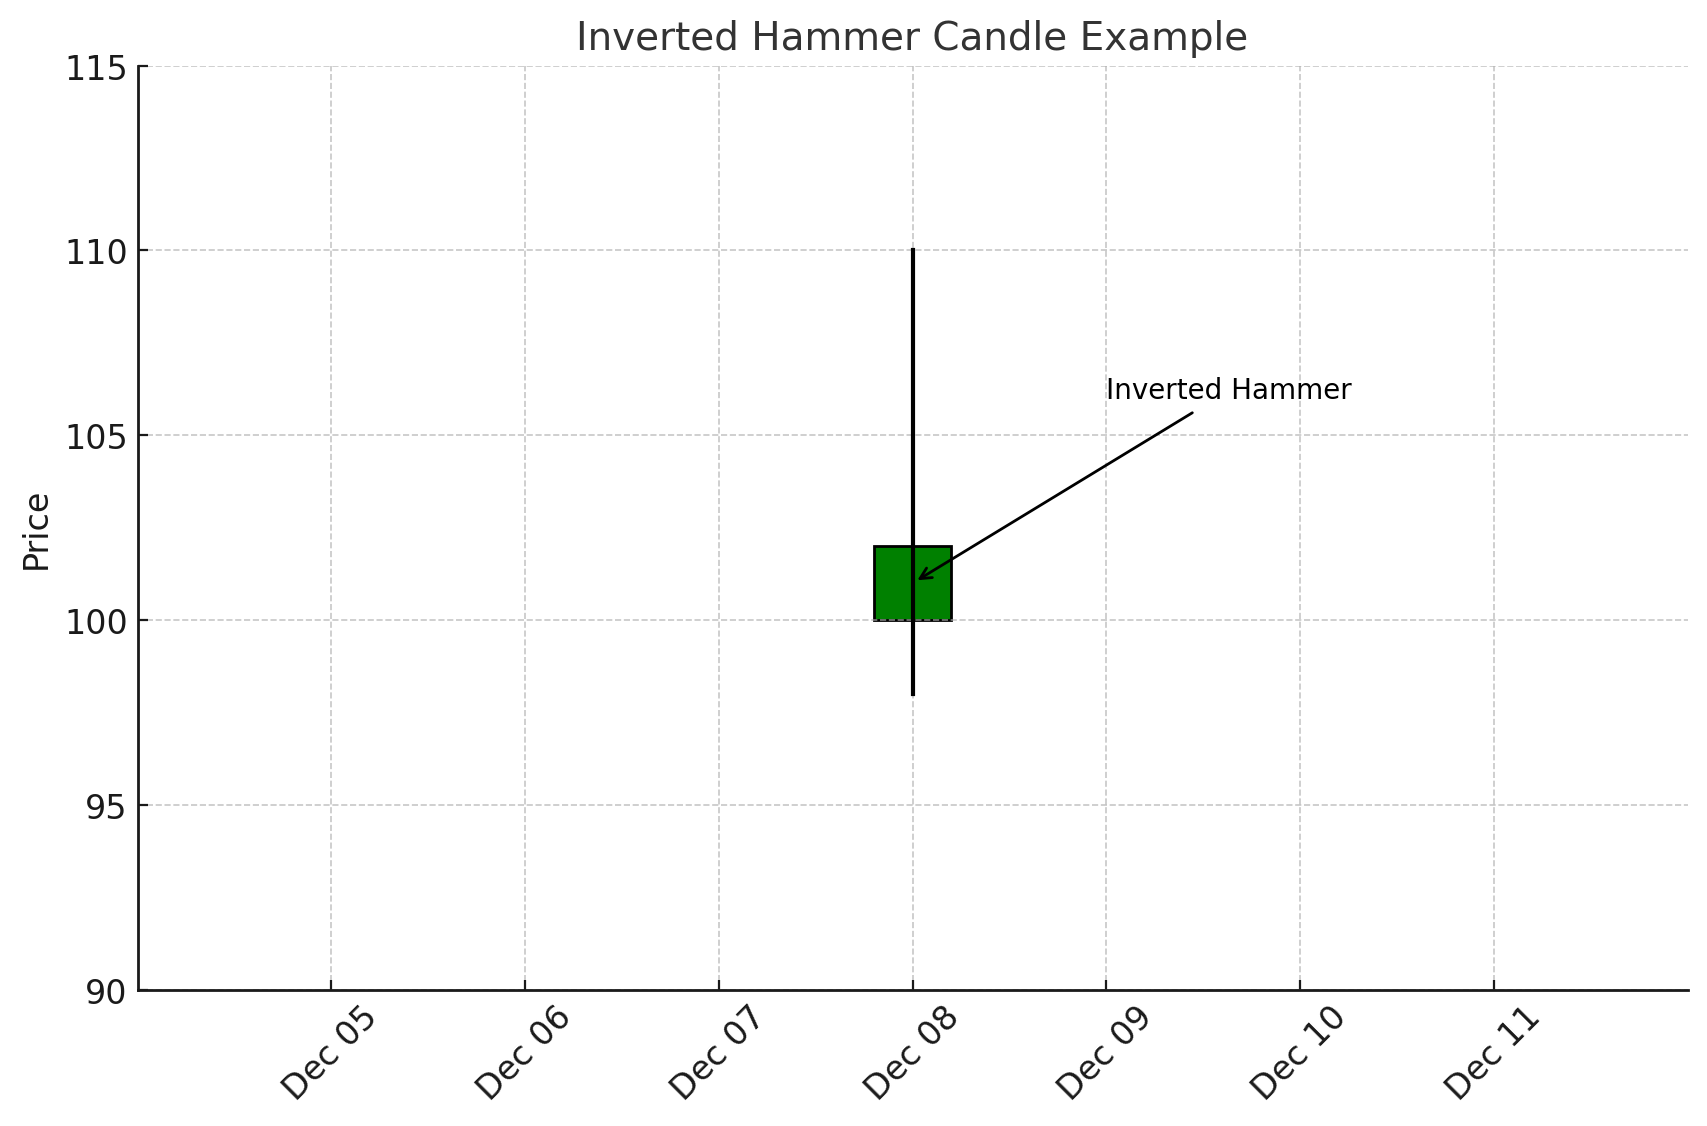
Inverted Hammer: Similar to a hammer but with a long upper wick and a small body near the bottom. It appears after a downtrend. The upper wick indicates buyers attempted to push the price higher, signaling a possible reversal if the next candle confirms upward movement.
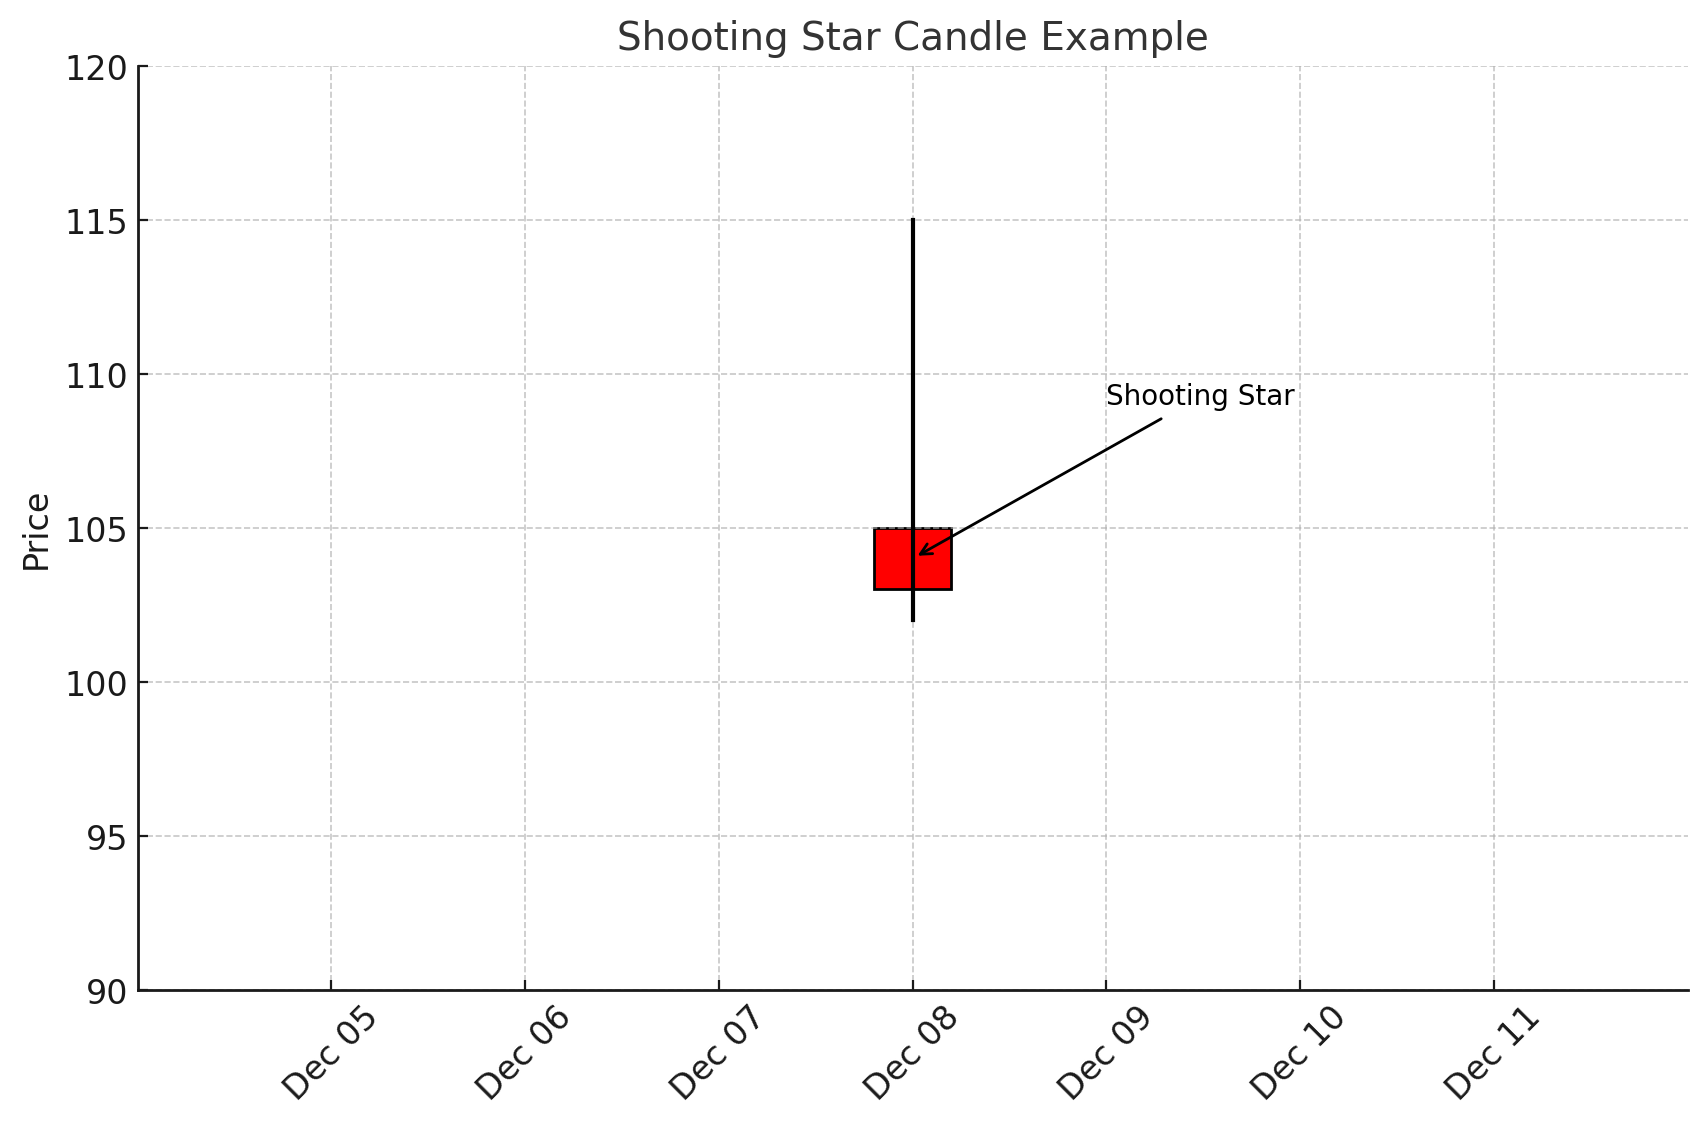
Shooting Star: The bearish counterpart of the inverted hammer. It appears at the top of an uptrend with a long upper wick and suggests that although buyers tried to push higher, sellers regained control. A shooting star can precede a potential downtrend if confirmed.
4. Spinning Tops
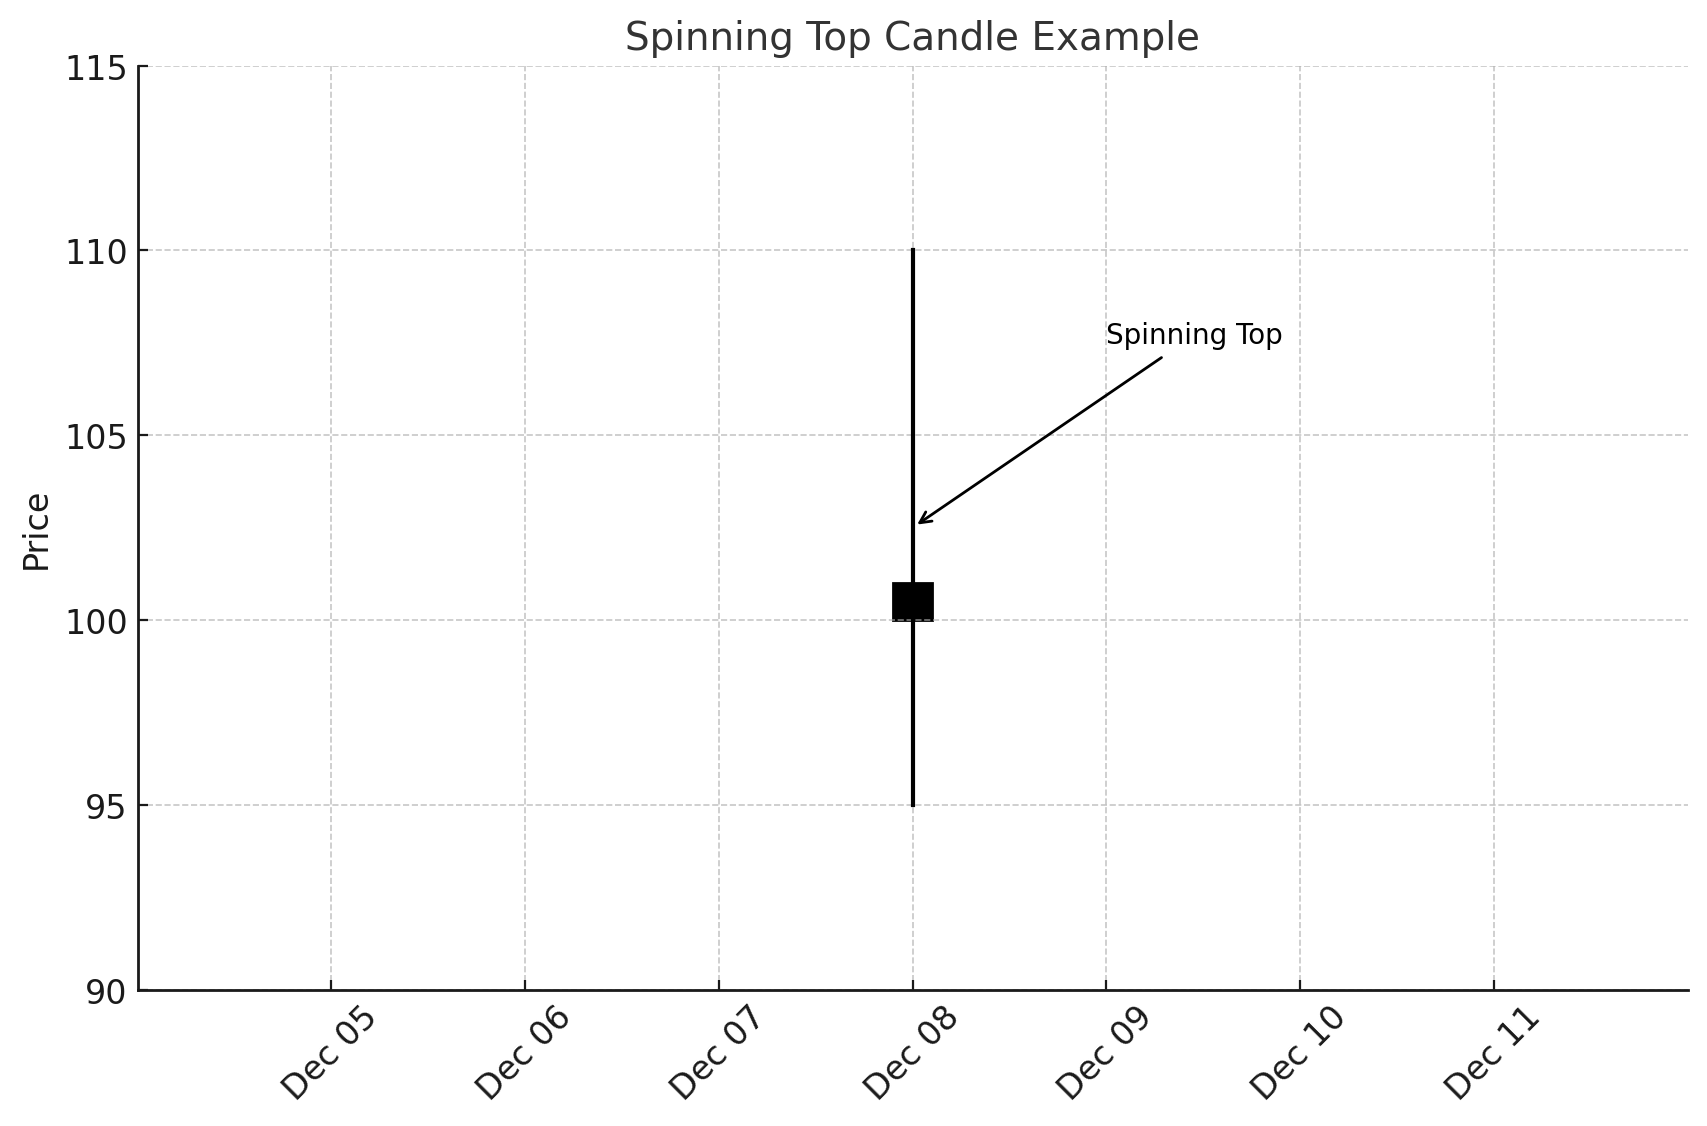
A Spinning Top is characterized by a small body centered between upper and lower wicks of relatively equal length. It represents indecision in the market, similar to a Doji, but with slightly more movement during the session. Spinning tops often occur during periods of consolidation, hinting that the current trend might pause or potentially reverse.
5. Marubozu Candles
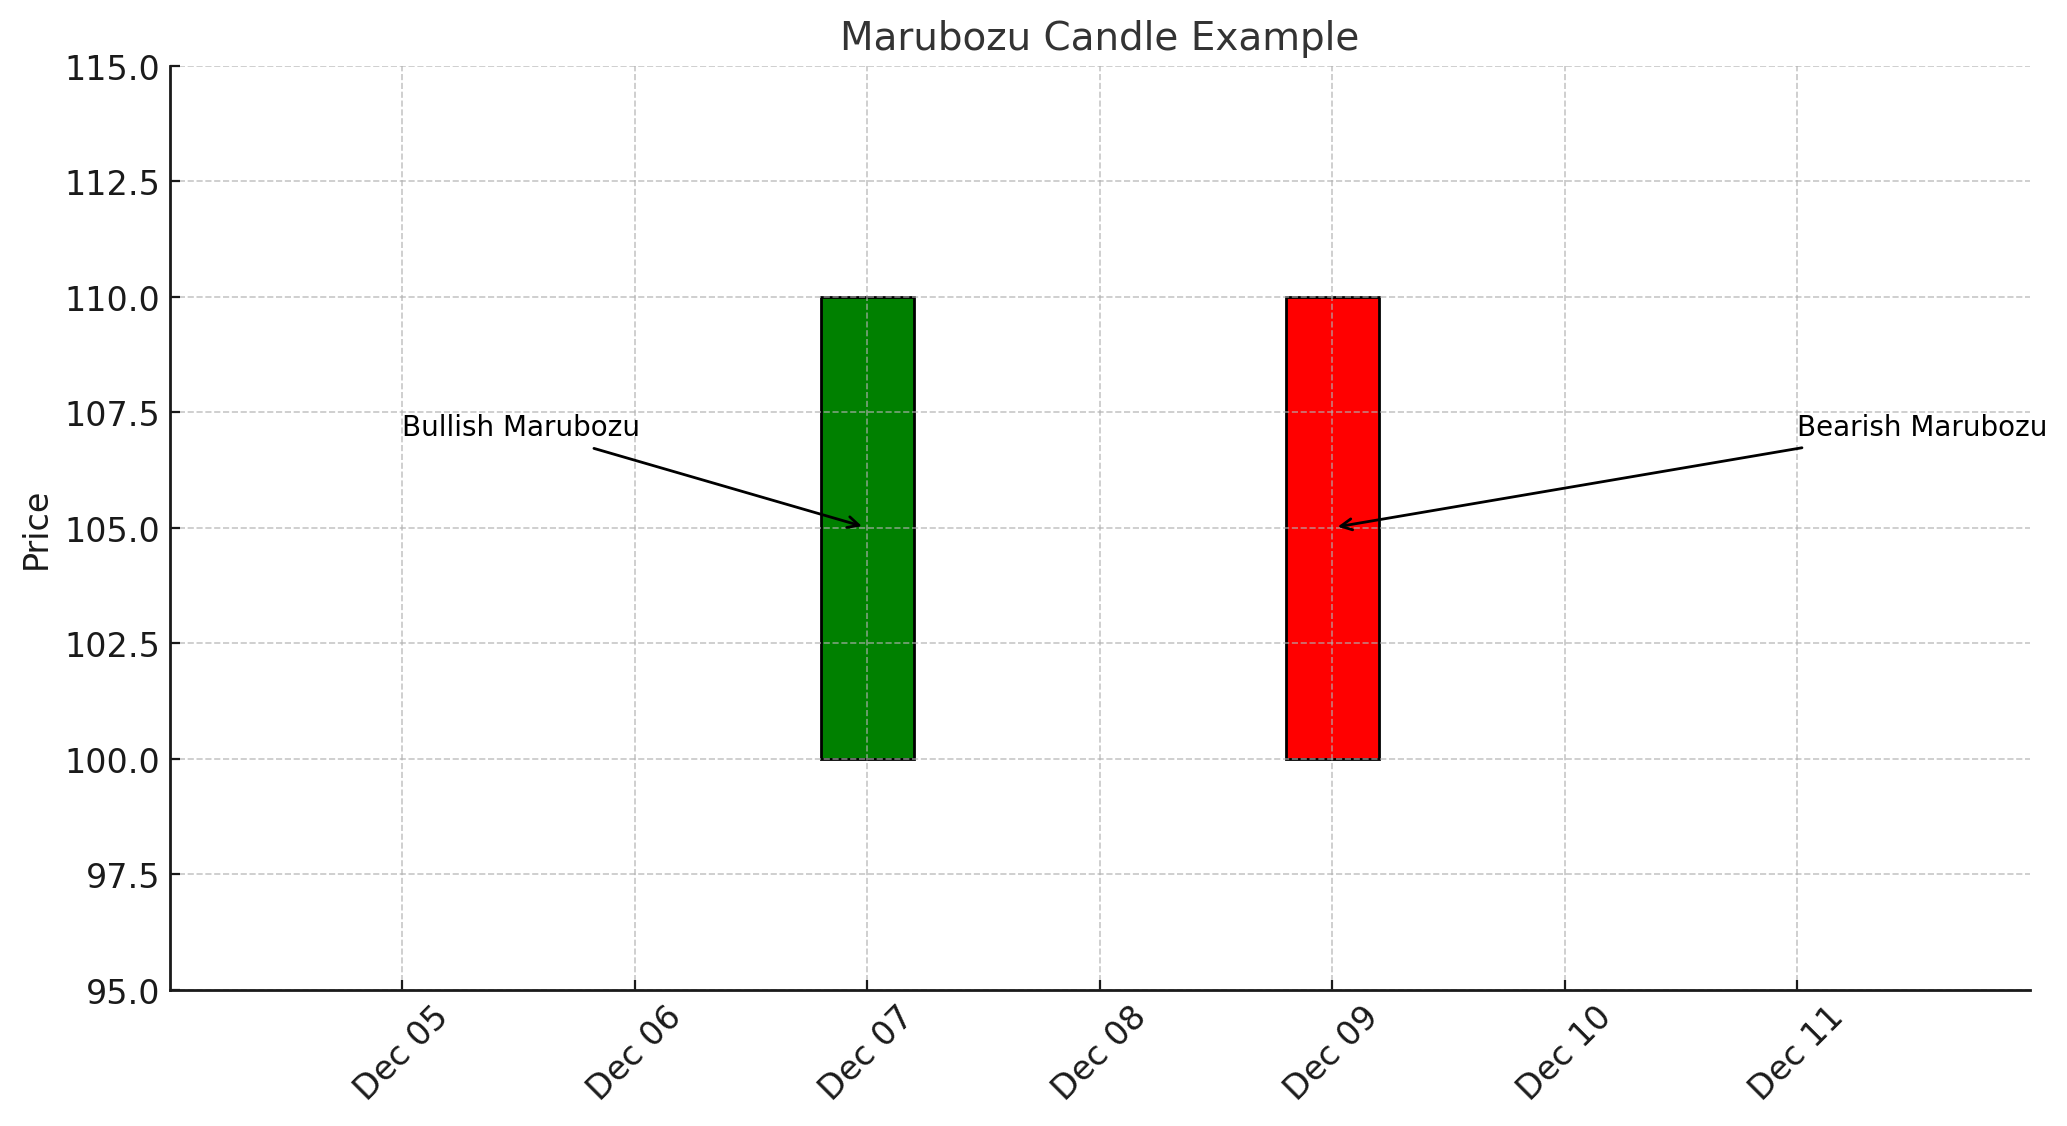
A Marubozu is a candle with no wicks on either the top or bottom—just a solid body. A bullish marubozu has its open at the low and close at the high, reflecting strong buying pressure throughout the period. A bearish marubozu, on the other hand, opens at the high and closes at the low, signifying strong selling pressure. Marubozu candles often occur at breakout points, suggesting strong momentum that can kick off a new trend leg.
Multi-Candle Patterns
While single-candle patterns provide valuable clues, multi-candle patterns can offer even more reliable signals due to the additional context they provide.
1. Engulfing Patterns
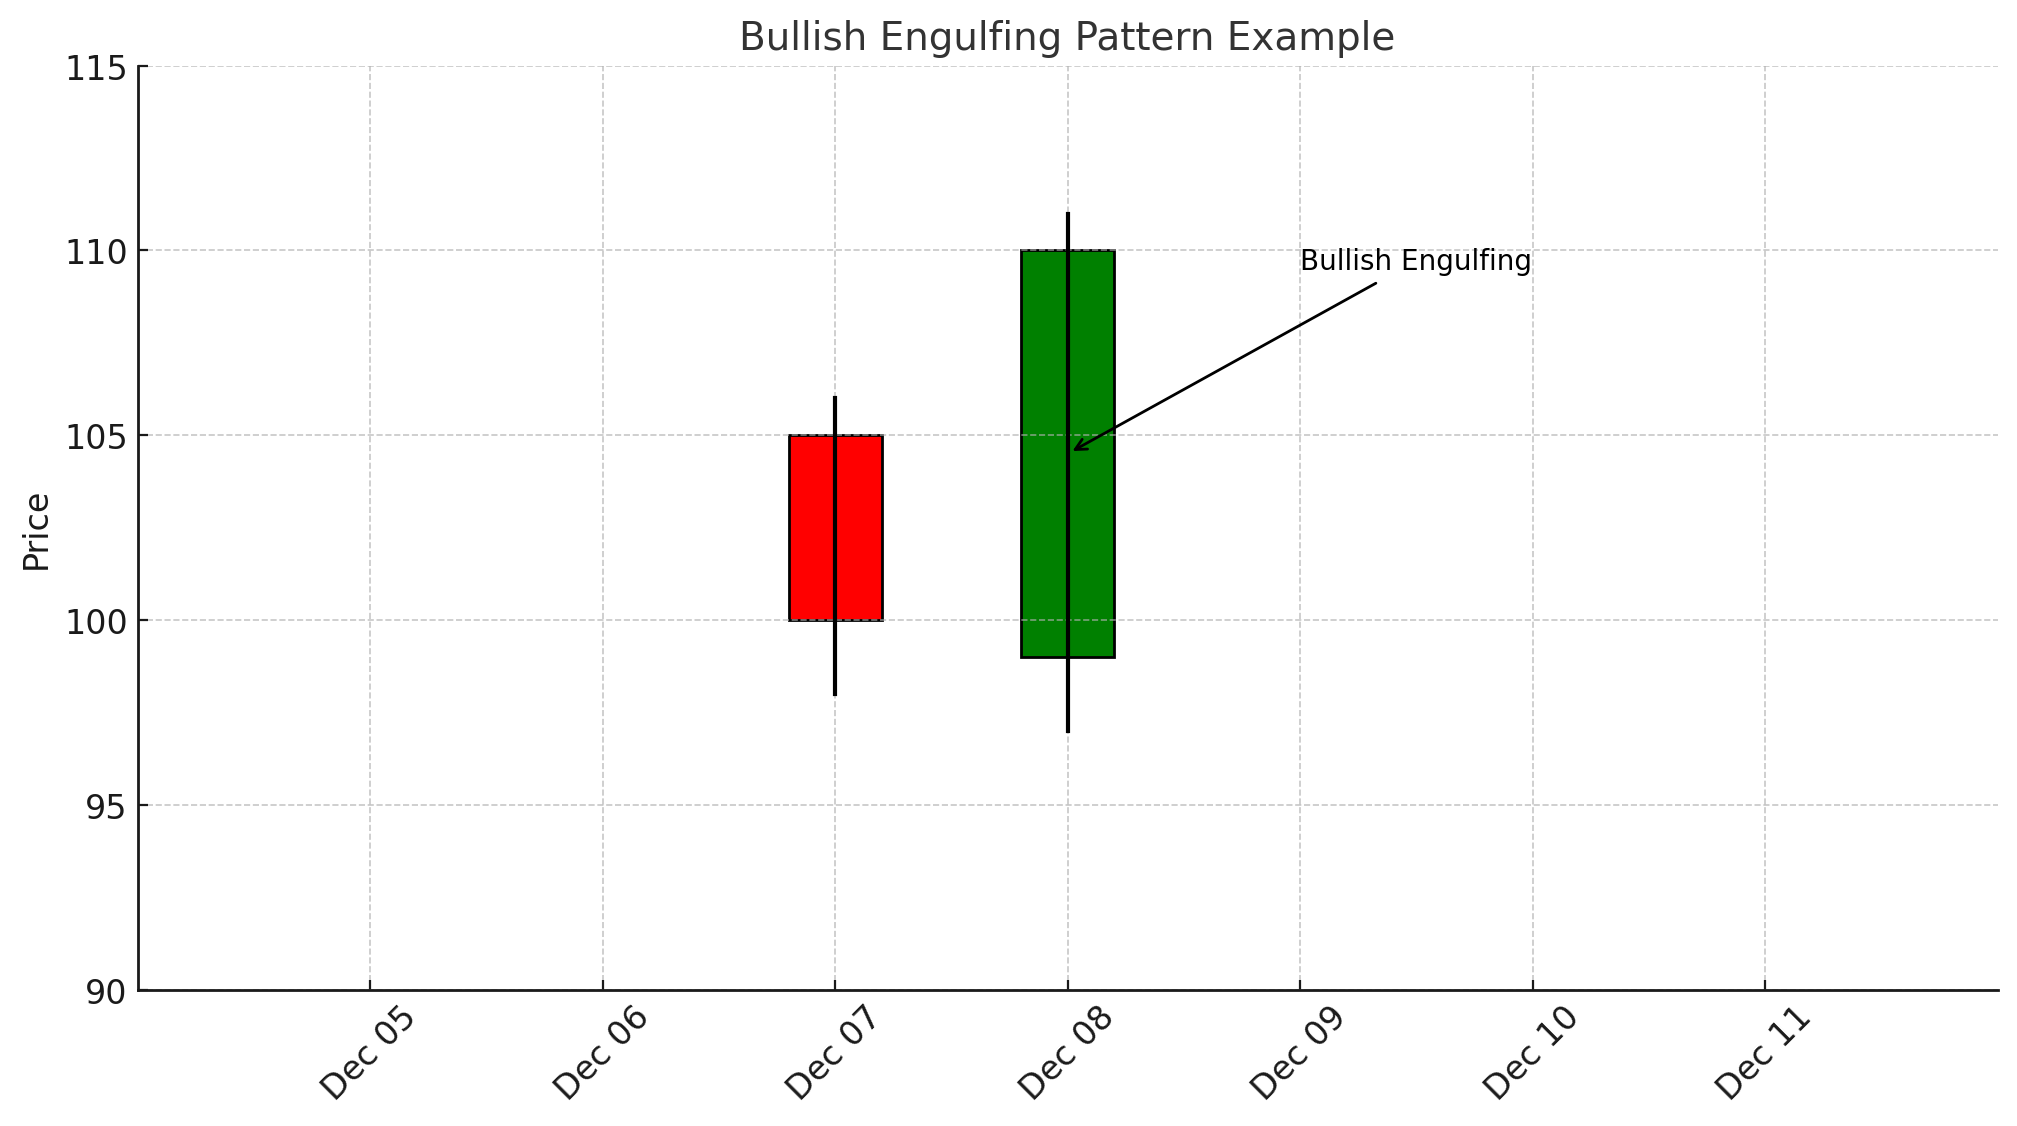
Bullish Engulfing Pattern: This pattern appears in a downtrend when a small bearish candle is immediately followed by a larger bullish candle that completely “engulfs” the previous candle’s body. This suggests buyers have overcome sellers, indicating a potential bullish reversal.
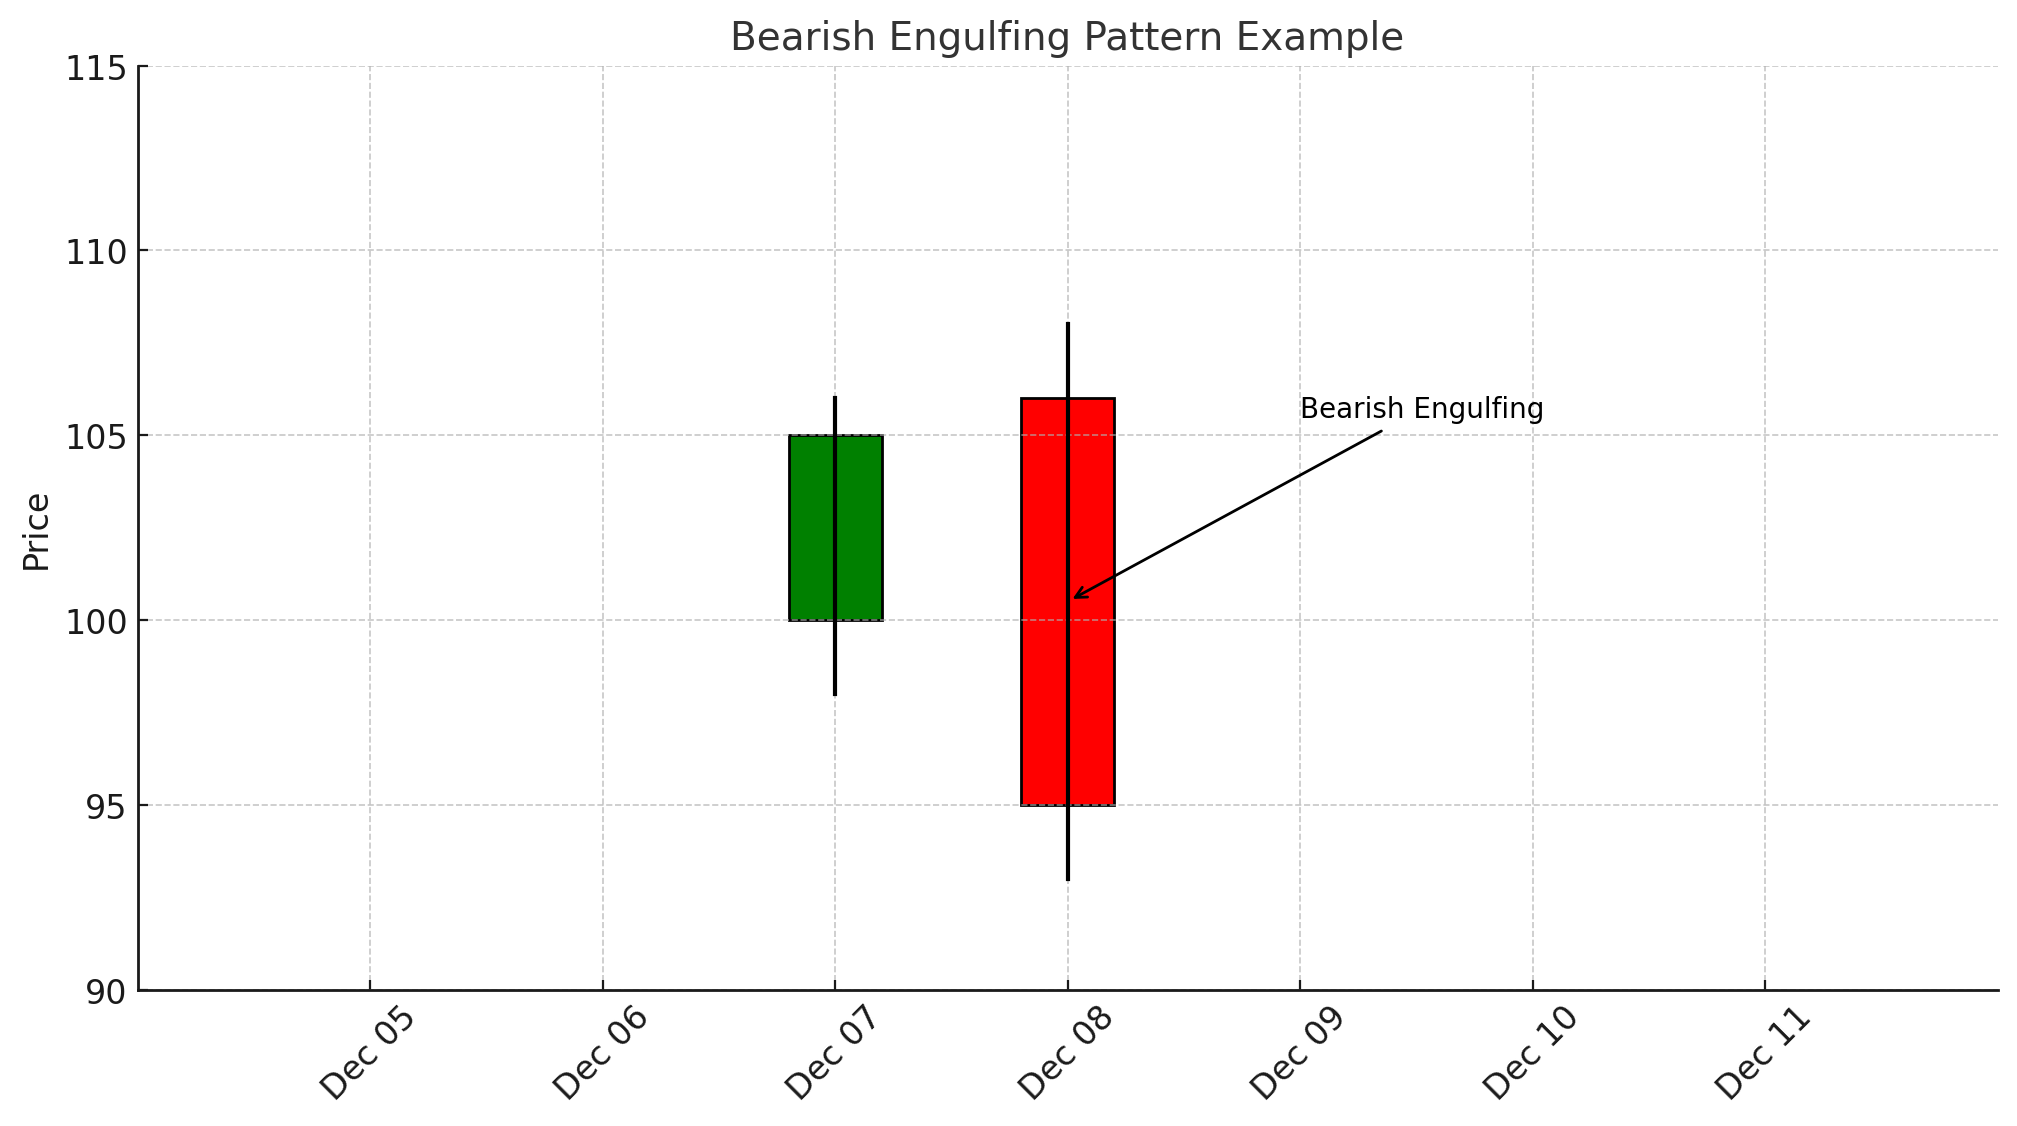
Bearish Engulfing Pattern: The opposite scenario, where a small bullish candle is followed by a large bearish candle engulfing the previous body, signaling that sellers have taken control and a bearish reversal may be imminent.
2. Harami Patterns
The word “Harami” means “pregnant” in Japanese, and the Harami pattern looks like a small candle nestled within the range of the previous larger candle.
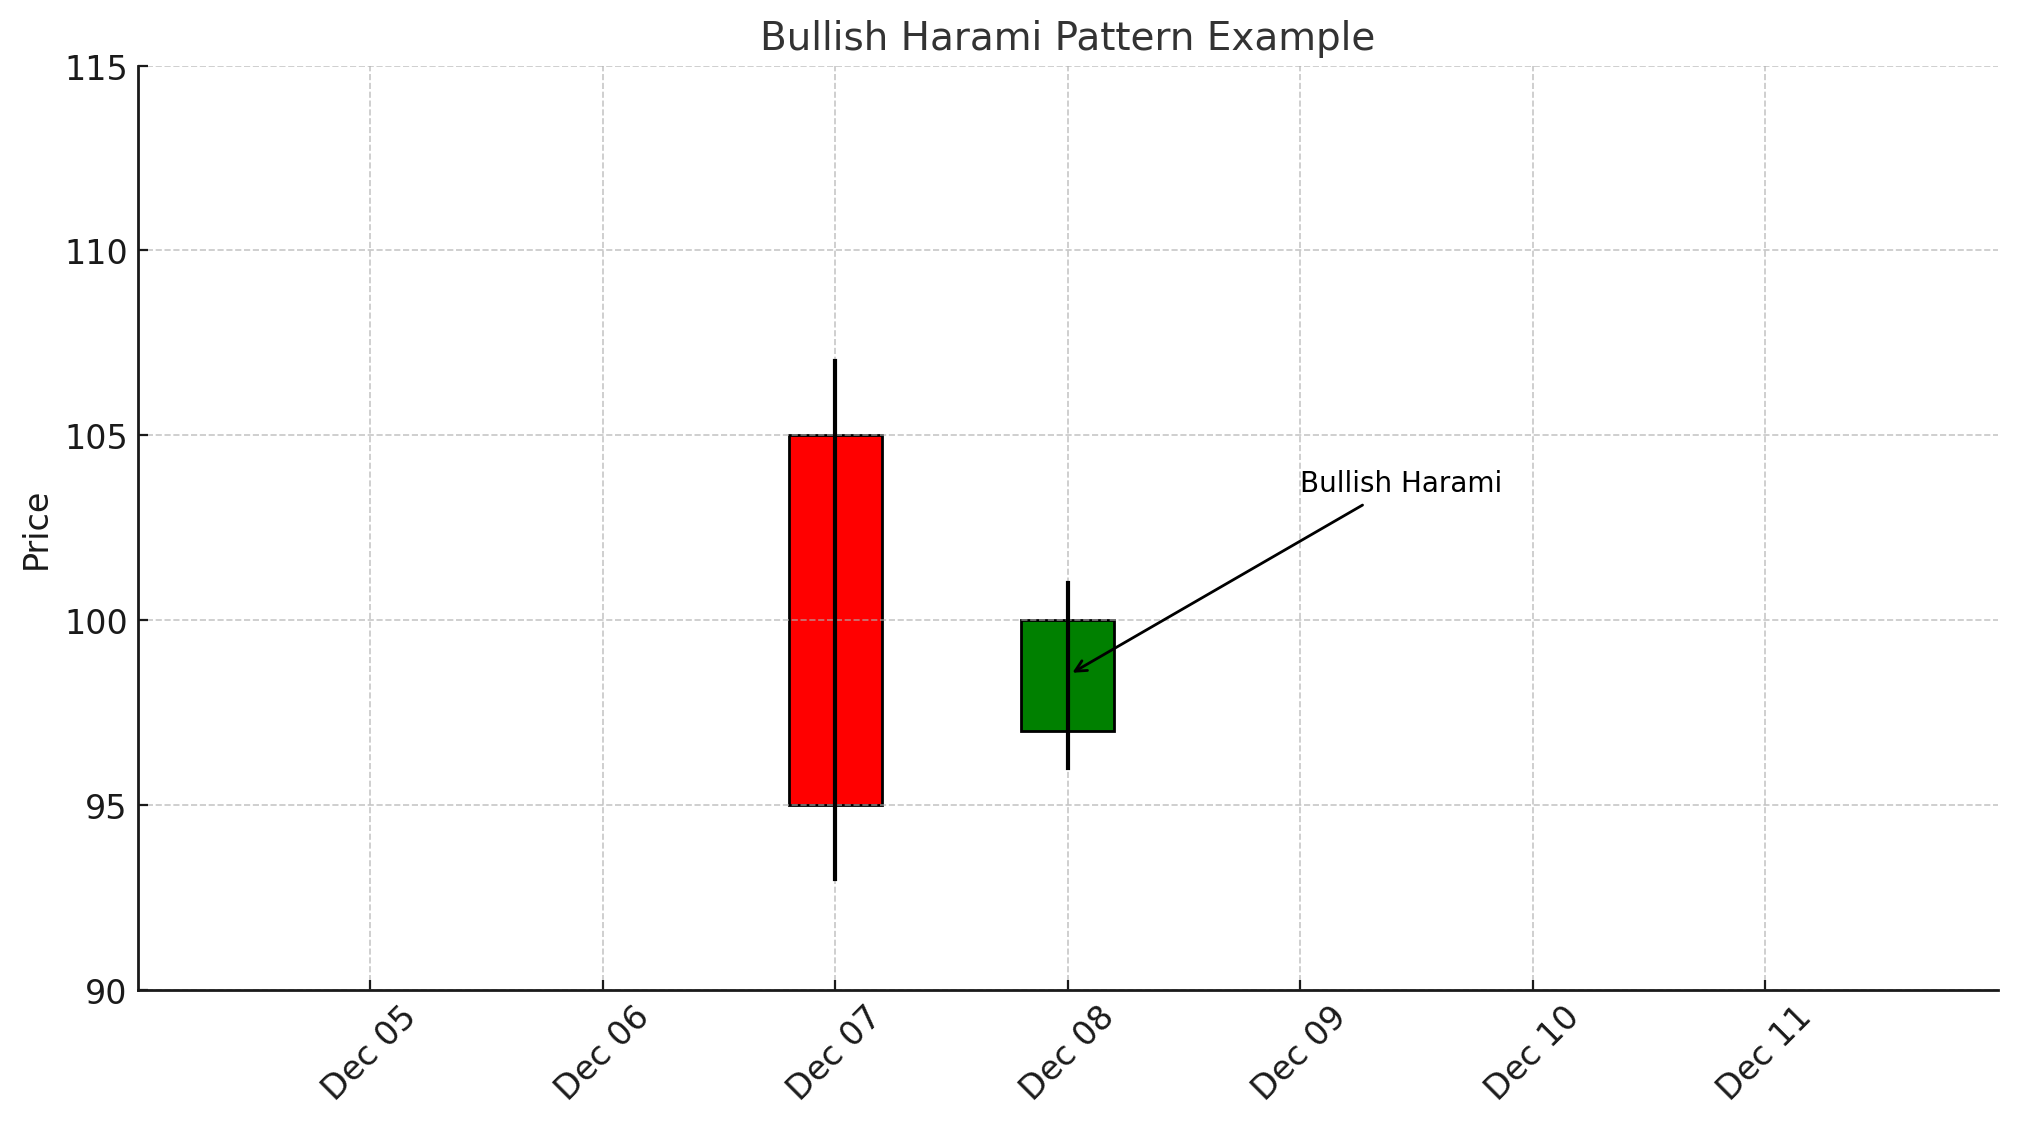
Bullish Harami: Appears in a downtrend. A large bearish candle is followed by a smaller bullish candle that fits entirely within the previous candle’s body. This suggests that selling pressure may be subsiding, and a reversal could be on the horizon.
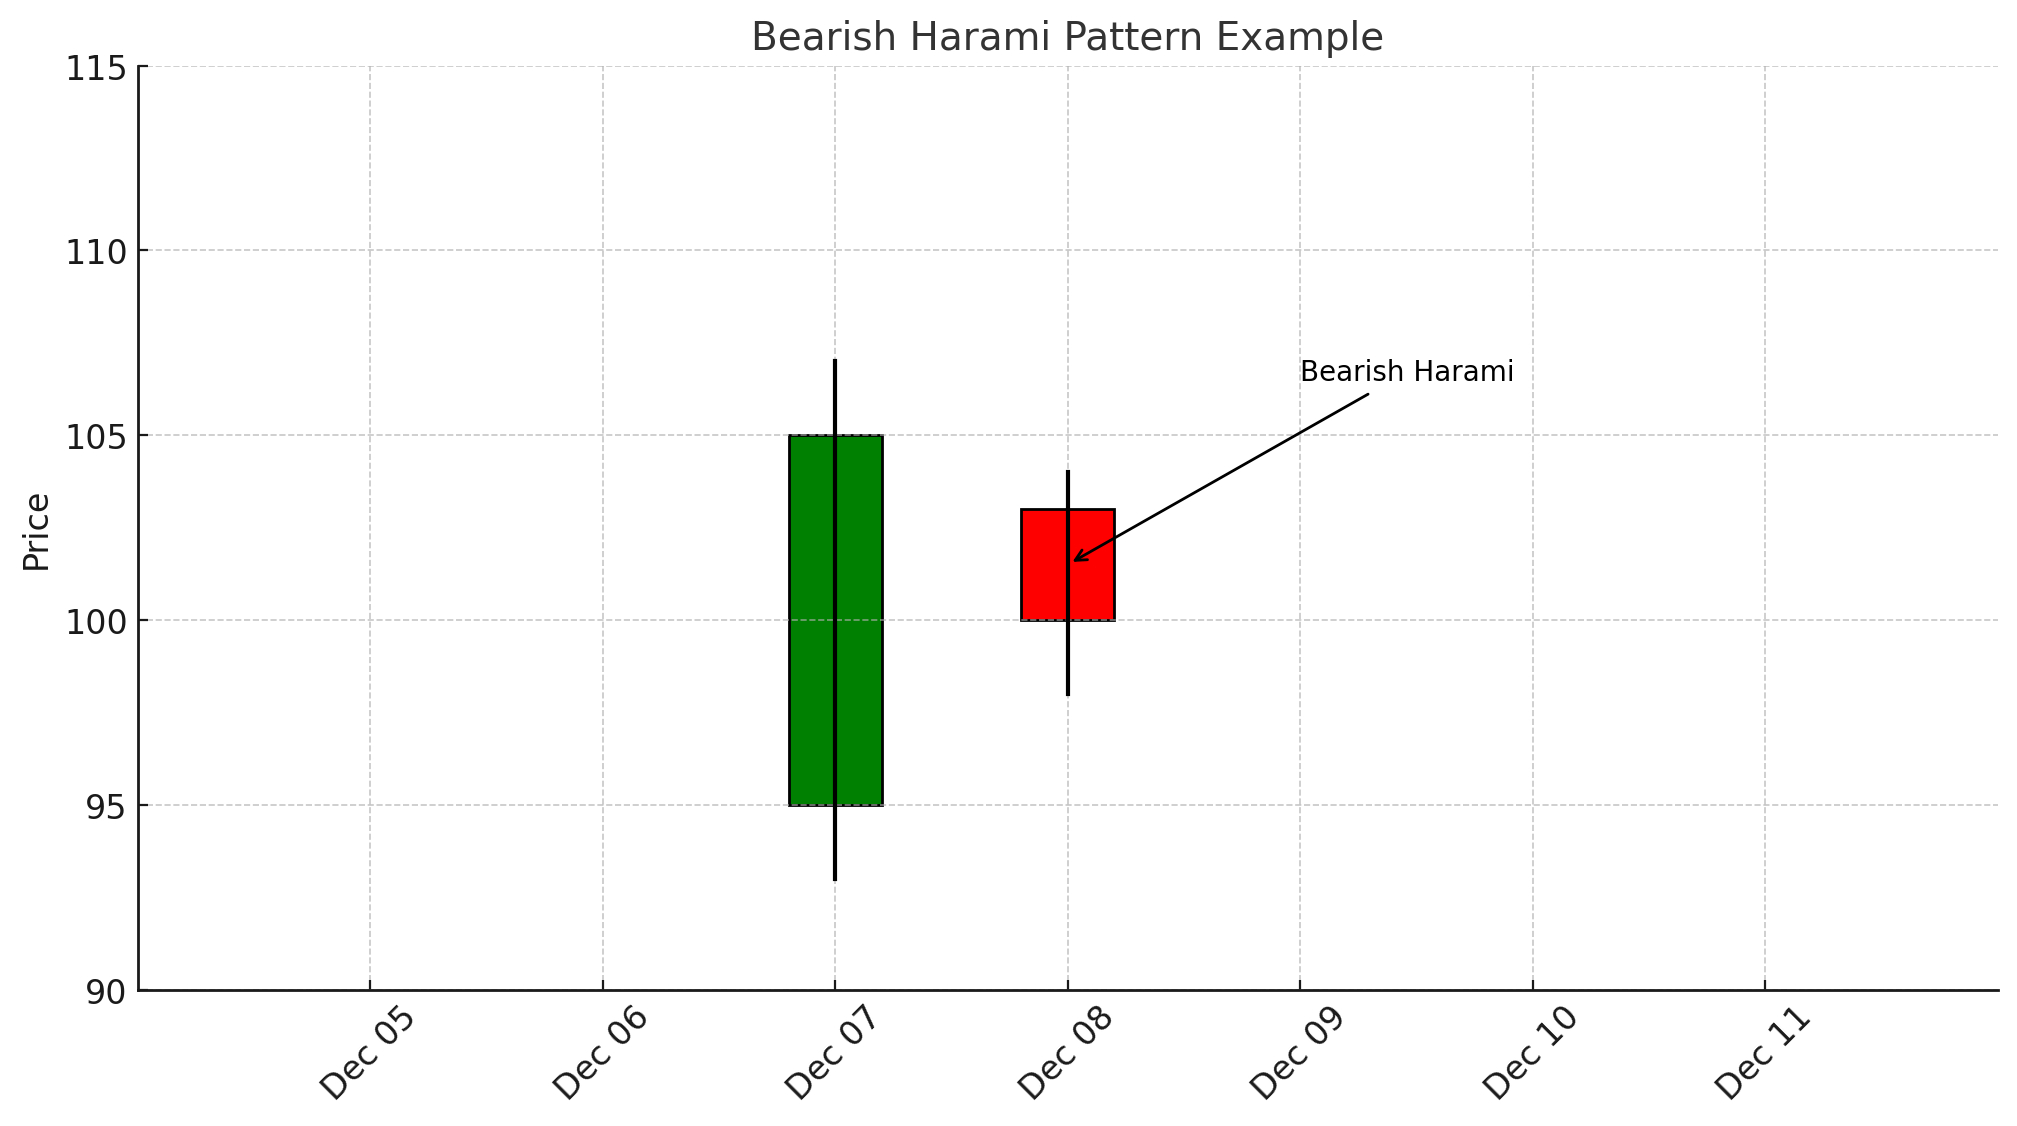
Bearish Harami: Occurs in an uptrend. A large bullish candle is followed by a smaller bearish candle inside its range. The pattern signals waning buying pressure and a possible shift toward selling.
3. Morning Star and Evening Star
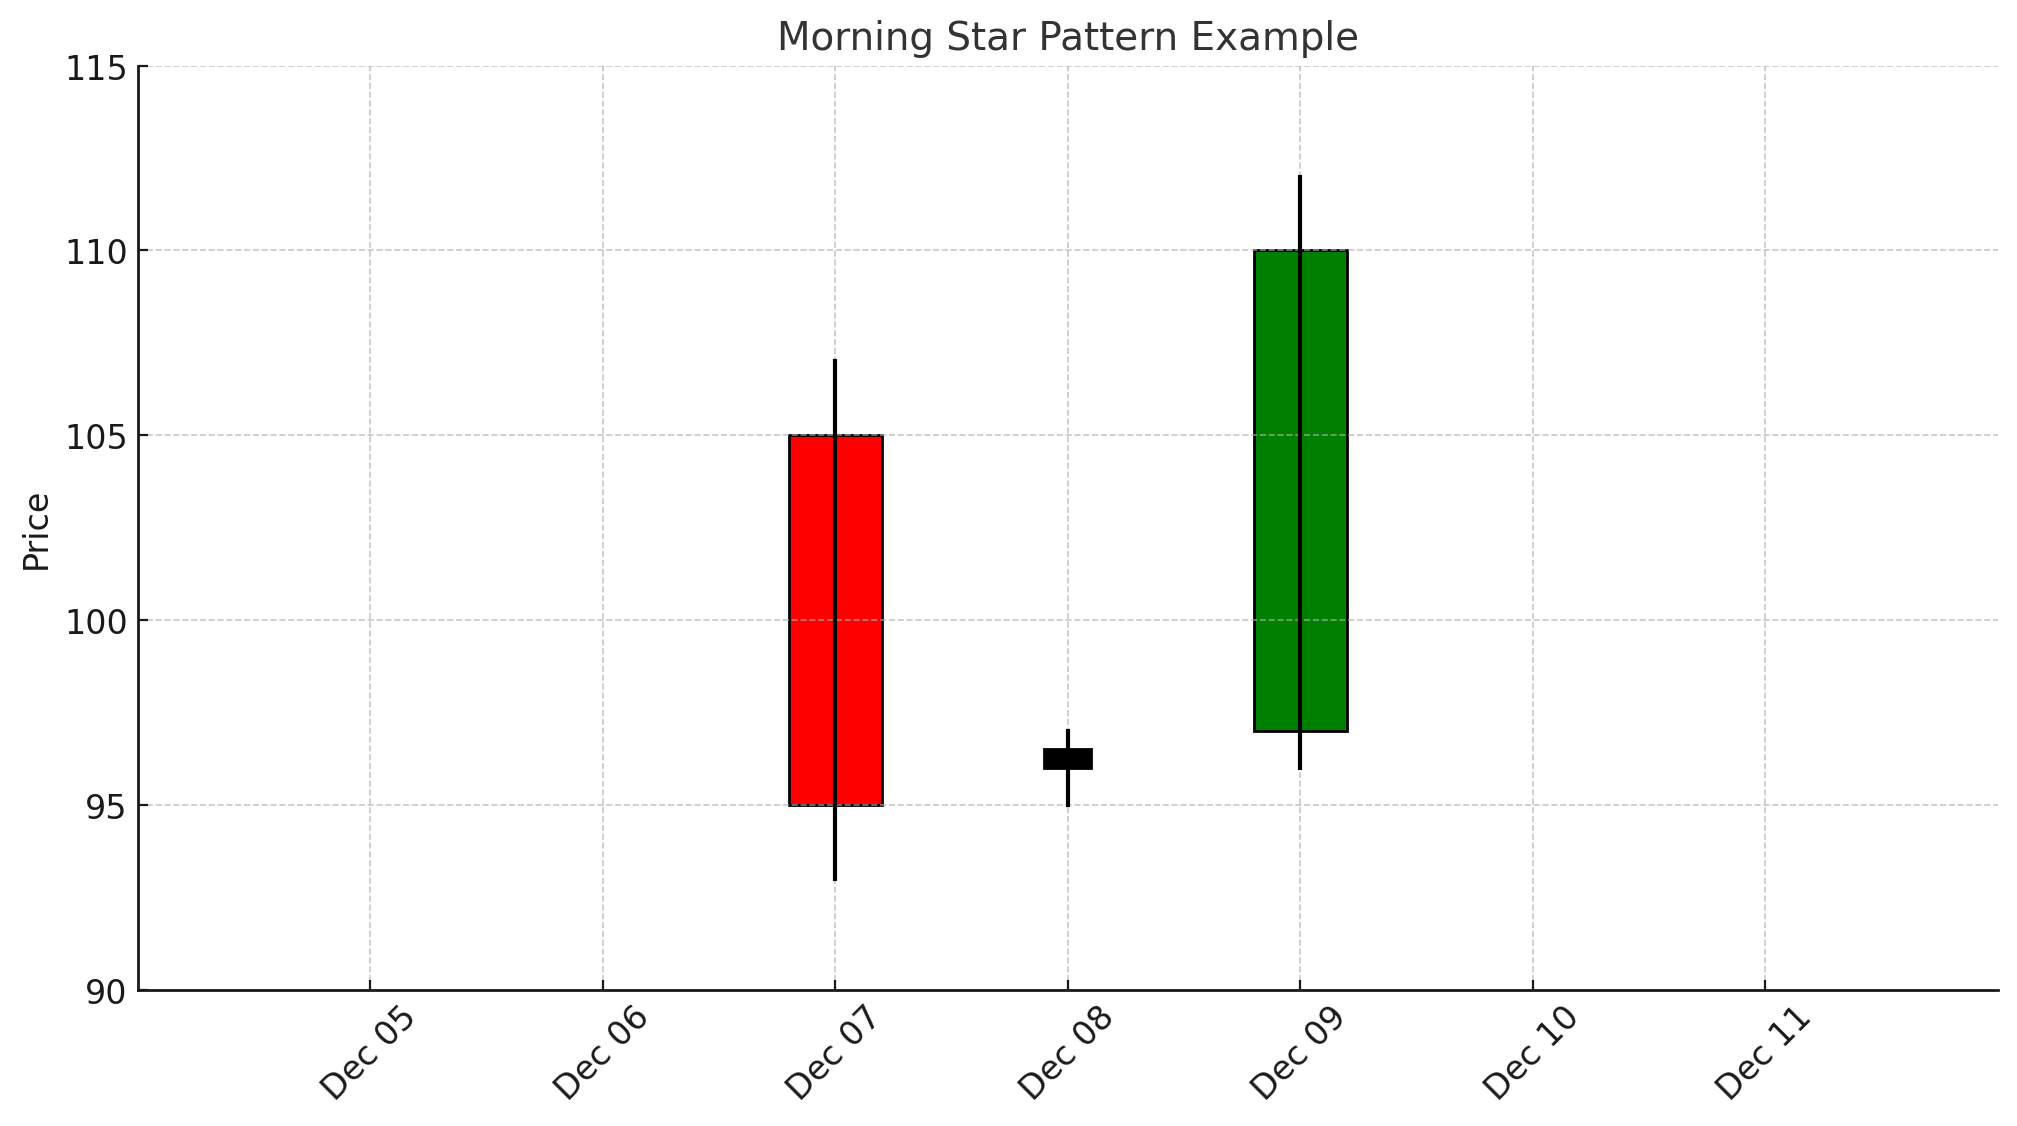
Morning Star: A three-candle pattern that often signals a bullish reversal. It appears at the end of a downtrend and consists of a large bearish candle, a small (often Doji-like) candle, and then a large bullish candle. The formation suggests that sellers are losing power and buyers are stepping in.
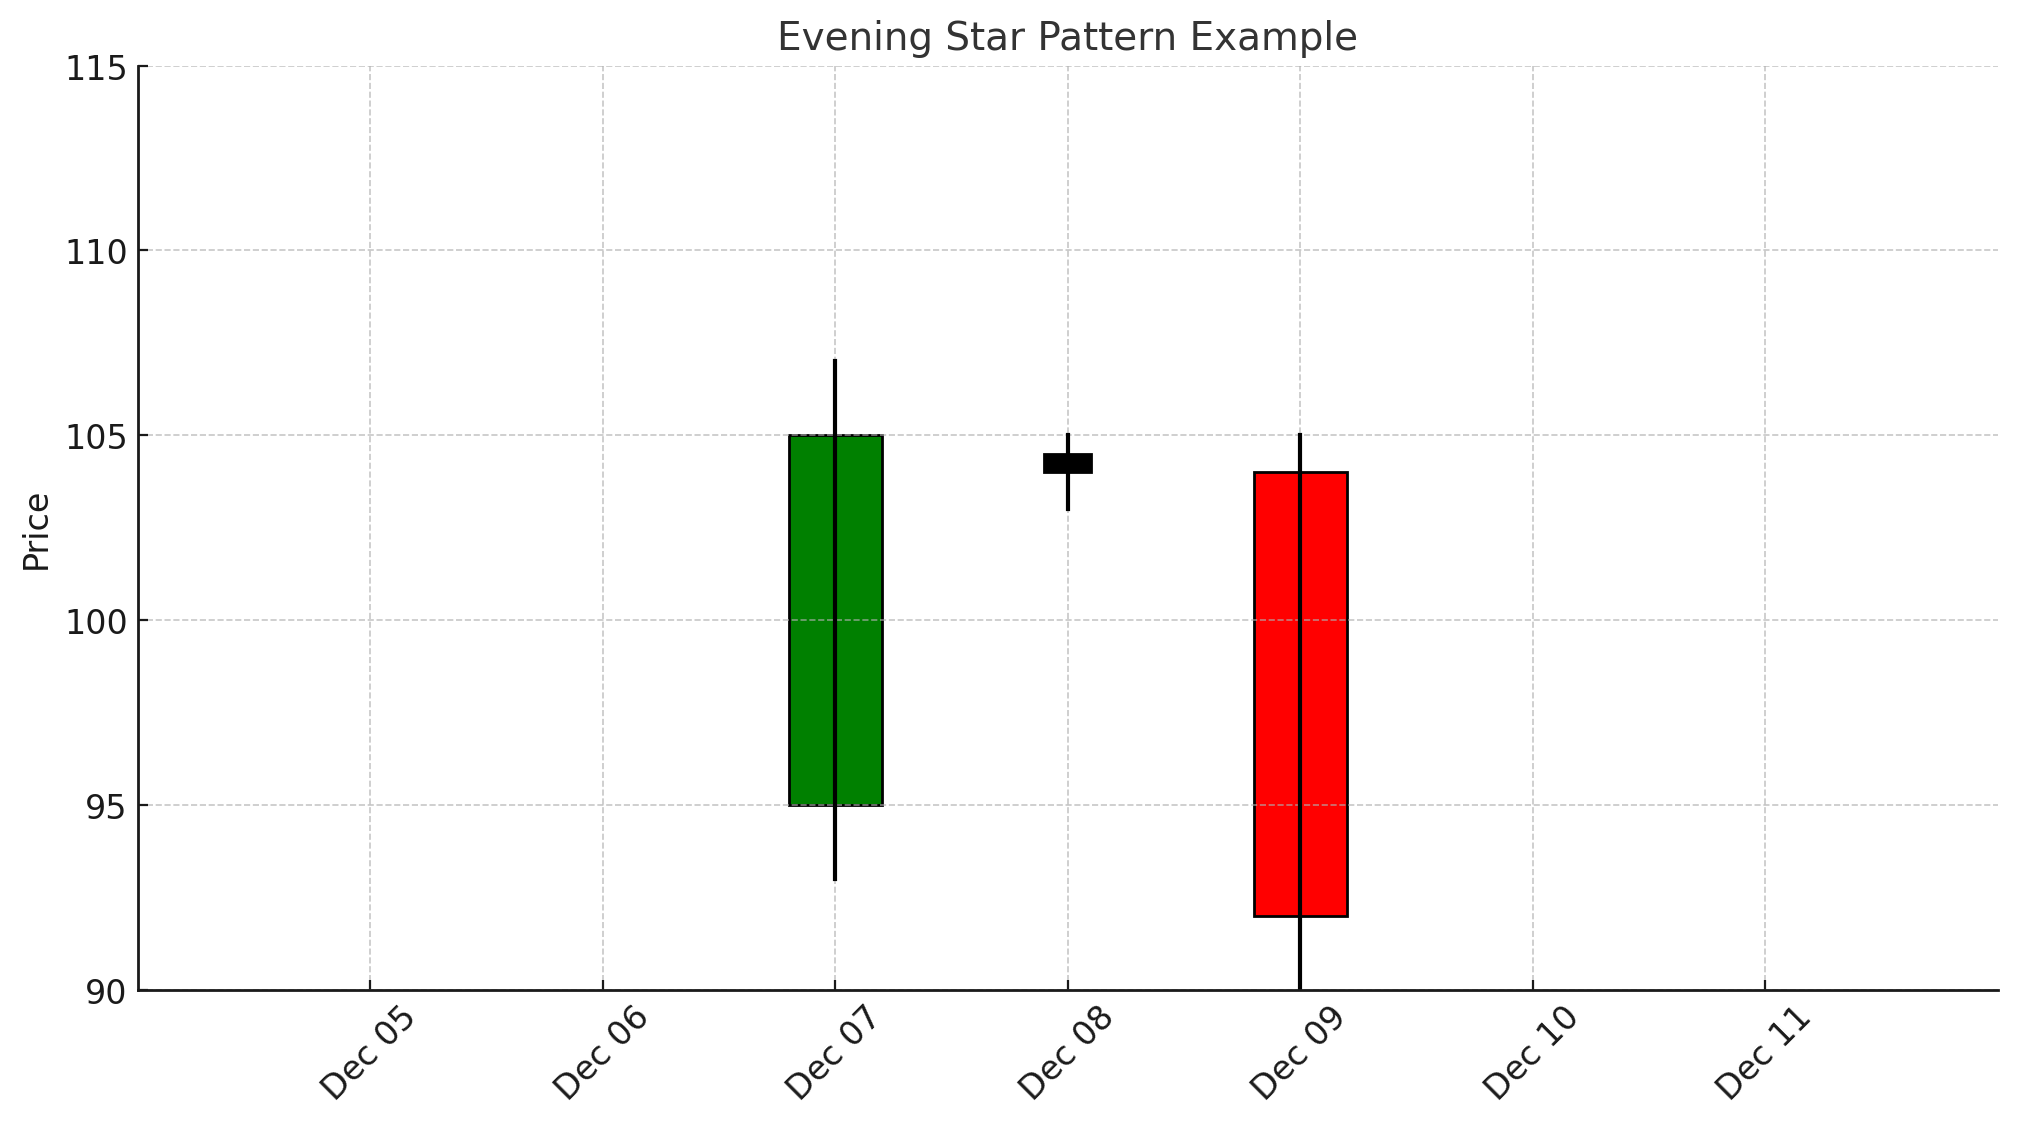
Evening Star: The bearish counterpart, appearing at the end of an uptrend. It consists of a large bullish candle, a small indecisive candle, and a large bearish candle. The pattern implies that buyers are losing control and sellers are about to take over.
Using Candlestick Patterns in Real Trading
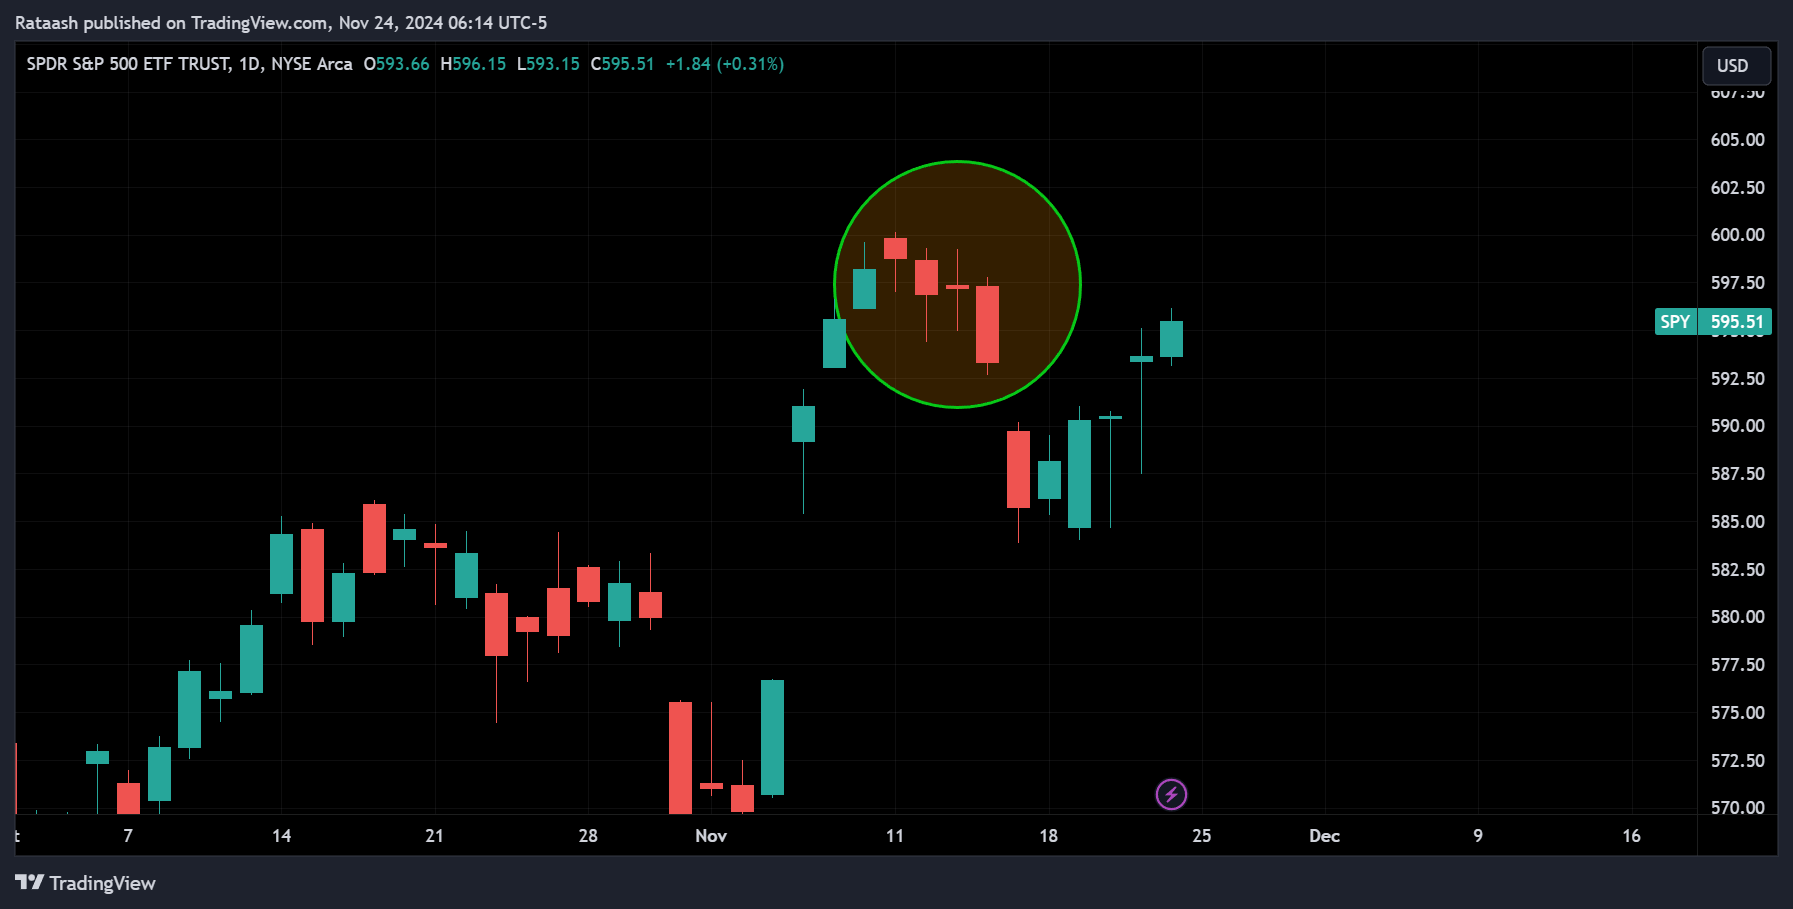
Knowing candlestick patterns is just the first step. The true power of these patterns emerges when combined with other forms of analysis. Here are some best practices:
1. Confirm with Indicators:
Complement your candlestick readings with volume indicators, moving averages, or oscillators like RSI or MACD. For instance, a bullish engulfing pattern is more convincing if accompanied by rising volume and a bullish divergence on the RSI.
2. Focus on Key Support and Resistance Levels:
Candlestick patterns become more reliable when they occur at significant price levels—areas where the price has historically reversed or paused. For example, a hammer forming at a well-established support level is a stronger sign of a potential reversal than a hammer appearing in the middle of a price range with no historical significance.
3. Consider the Trend Context:
Candlesticks are most meaningful within the context of a prevailing trend. A bullish reversal pattern in a strong downtrend might be less reliable than the same pattern emerging after a prolonged period of selling exhaustion. Always ask: “How does this pattern fit into the bigger picture?”
4. Use Multiple Timeframes:
Confirm candlestick signals by looking at higher timeframes. A bullish reversal pattern on a 1-hour chart may carry more weight if you see a similar signal on the 4-hour chart. Multiple timeframe analysis reduces false signals and increases confidence in your trading decisions.
5. Practice Risk Management:
Even the most reliable candlestick patterns fail sometimes. Always set stop-loss orders and manage position sizes appropriately. Use candlestick patterns as part of a broader trading plan that includes predetermined entry and exit points, risk/reward ratios, and ongoing trade management.
Examples of Applying Candlestick Analysis
Example 1:
You identify a bullish engulfing pattern at a known support level after a prolonged downtrend in a stock. At the same time, the RSI indicator shows oversold conditions and starts ticking upward. This confluence of evidence suggests that the downtrend may be losing steam and a reversal could be on the horizon. You decide to enter a long position with a stop-loss below the support level, aiming to catch the reversal.
Example 2:
A shooting star candle forms at the top of a strong uptrend, just as price hits a historical resistance level. Volume is elevated, indicating significant selling pressure as the candle forms. This pattern is confirmed by bearish divergence on the MACD. The alignment of these signals suggests that the market could be primed for a downwards correction or a full reversal. You take this as a cue to either exit your long position or open a short position with an appropriate stop-loss above the recent high.
Mistakes to Avoid
- Relying Solely on Candlestick Patterns:
While powerful, candlestick patterns are not foolproof. Relying on them without additional confirmation can lead to premature trades and losses. - Ignoring Market Context:
Patterns that appear during low-volume, choppy market conditions may be less reliable than those forming during periods of strong volume and directional movement. - Forgetting Fundamental Influences:
Major news releases, earnings reports, economic data, or geopolitical events can override even the strongest technical signals. Always stay aware of the fundamental calendar and market sentiment.
Continuous Learning and Practice
Becoming proficient in reading candlestick patterns is not an overnight process. It involves consistent practice, review, and adaptation. Consider the following steps to enhance your skillset:
- Backtesting:
Review historical charts to see how certain patterns played out in the past. Identify which patterns offered the best signals and under what conditions. - Journal Your Trades:
Keep a trading journal. Document every trade that you take based on candlestick patterns, note the outcome, and analyze the results. This will help you refine your strategy over time. - Stay Updated:
Markets evolve, and so do trading strategies. Stay up to date by reading quality trading literature, participating in online communities, and, if possible, engaging with more experienced traders to gain new insights.
Final Thoughts
Candlestick patterns offer a fascinating glimpse into market psychology, vividly portraying the dynamic tug-of-war between buyers and sellers during each trading session. Instead of memorizing patterns, focus on understanding the underlying supply and demand dynamics they represent. This approach provides a deeper grasp of market behavior and enhances your analytical edge.
Tools like TradingView, renowned for its intuitive interface and advanced charting features, can elevate your analysis, making it easier to spot and interpret these patterns in real-time. By combining candlestick patterns with support and resistance levels, indicators, risk management strategies, and a thorough market context, you can make well-rounded and informed trading decisions.
Remember, no single pattern guarantees success. Effective trading requires a holistic approach that integrates various tools and perspectives. With practice and consistent learning, candlestick patterns can evolve into a vital component of your technical analysis toolkit, empowering you to navigate the complexities of financial markets with clarity and confidence.
