Chart patterns are one of the most powerful tools in a trader’s arsenal. They help you visualize market sentiment, understand the balance between buyers and sellers, and predict potential future price movements. While they won’t guarantee profits, learning how to recognize and correctly interpret chart patterns can greatly improve the quality of your trading decisions.
In this comprehensive guide, you’ll learn how to trade chart patterns effectively. We’ll cover the basics of technical analysis, break down key types of chart patterns, show you how to identify them, and teach you how to build winning trading strategies around these formations. By the end, you’ll be equipped with the tools to confidently integrate chart patterns into your trading routine.
Understanding the Basics of Technical Analysis
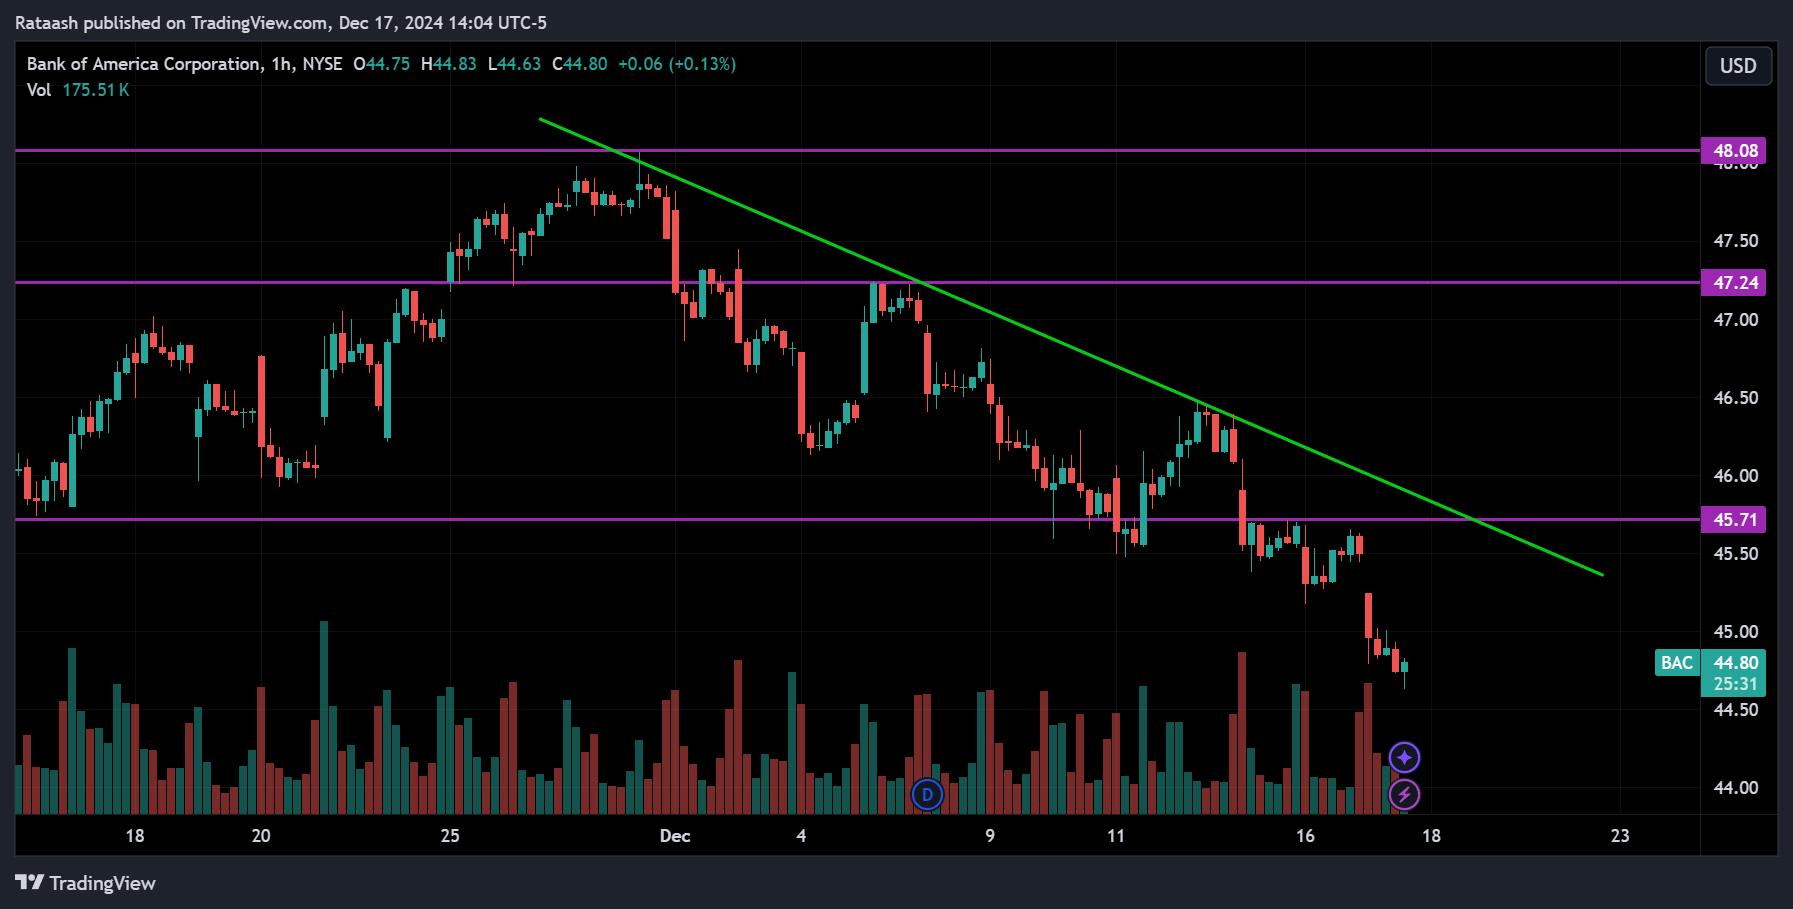
Before diving into chart patterns, it’s crucial to understand the foundation upon which they rest: technical analysis. Technical analysis is the study of historical price data—usually displayed on charts—in order to forecast future price movements. Unlike fundamental analysis, which focuses on economic indicators, company earnings, and valuation metrics, technical analysis relies entirely on price and volume data.
Key Principles of Technical Analysis:
- Market discounts everything: The price of a security reflects all available information, including fundamentals, news, and trader sentiment.
- Prices move in trends: Once a trend in price (uptrend, downtrend, or sideways) is established, it’s more likely to continue than to reverse.
- History tends to repeat itself: Price patterns and trading behavior that worked in the past often recur as human psychology remains relatively consistent over time.
Chart patterns are a direct application of these principles. They form as a result of collective market psychology, and by learning to read these patterns, you can gauge whether buyers or sellers are likely to dominate going forward.
What Are Chart Patterns and Why Are They Important?
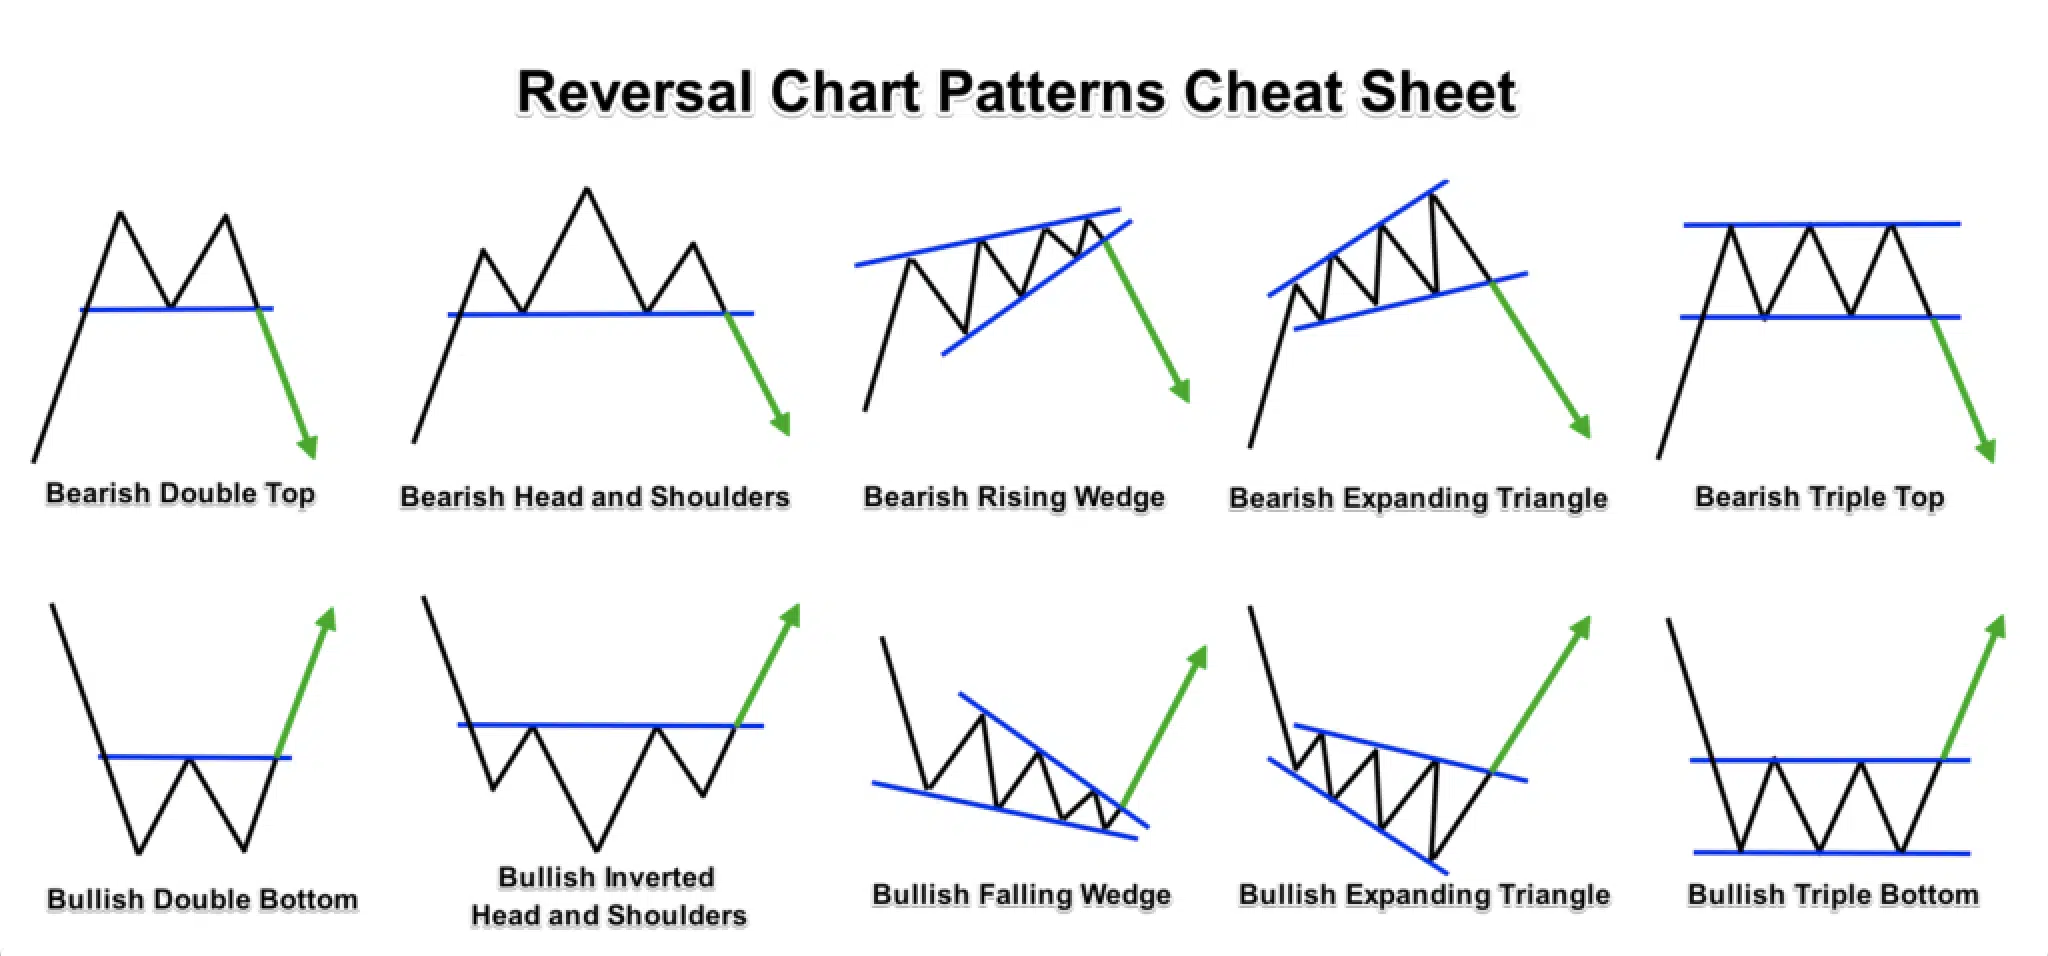
Chart patterns are shapes and formations on a price chart that help traders predict potential market turning points or trend continuations. They represent a visual footprint of the market’s behavior—telling you when bulls (buyers) and bears (sellers) reach equilibrium, when one side gains the upper hand, and when a likely breakout might occur.
Reasons Why Chart Patterns Are Important:
- Clarity on Market Direction: By identifying patterns, traders can anticipate bullish or bearish movements and position themselves accordingly.
- Risk-Reward Setup: Patterns often come with identifiable breakout points, stop-loss levels, and profit targets, making it easier to manage risk.
- Versatility: Chart patterns work across different timeframes and markets, from stocks and forex to commodities and cryptocurrencies.
- Psychological Insight: Each pattern reflects the underlying psychology and sentiment of market participants, giving you insights into supply-demand dynamics.
Key Types of Chart Patterns
Chart patterns generally fall into two broad categories: reversal patterns and continuation patterns. Understanding the difference is critical.
- Reversal Patterns:
These patterns signal that the current trend—either bullish or bearish—may be nearing its end. In other words, if prices have been rising, a reversal pattern indicates they may soon start falling, and vice versa. If identified early, reversal patterns provide excellent opportunities to enter trades close to the turning point, thus potentially capturing the bulk of the new trend. - Continuation Patterns:
Continuation patterns suggest that the current trend will remain intact after a brief pause or consolidation period. They indicate that the market is “taking a breather” before resuming in the same direction.
Common Reversal Chart Patterns
Reversal patterns are critical to traders because they can signal when to exit a profitable trend-following trade or when to position themselves for a new trend in the opposite direction. Below are some of the most well-known reversal patterns.
1. Head and Shoulders Pattern
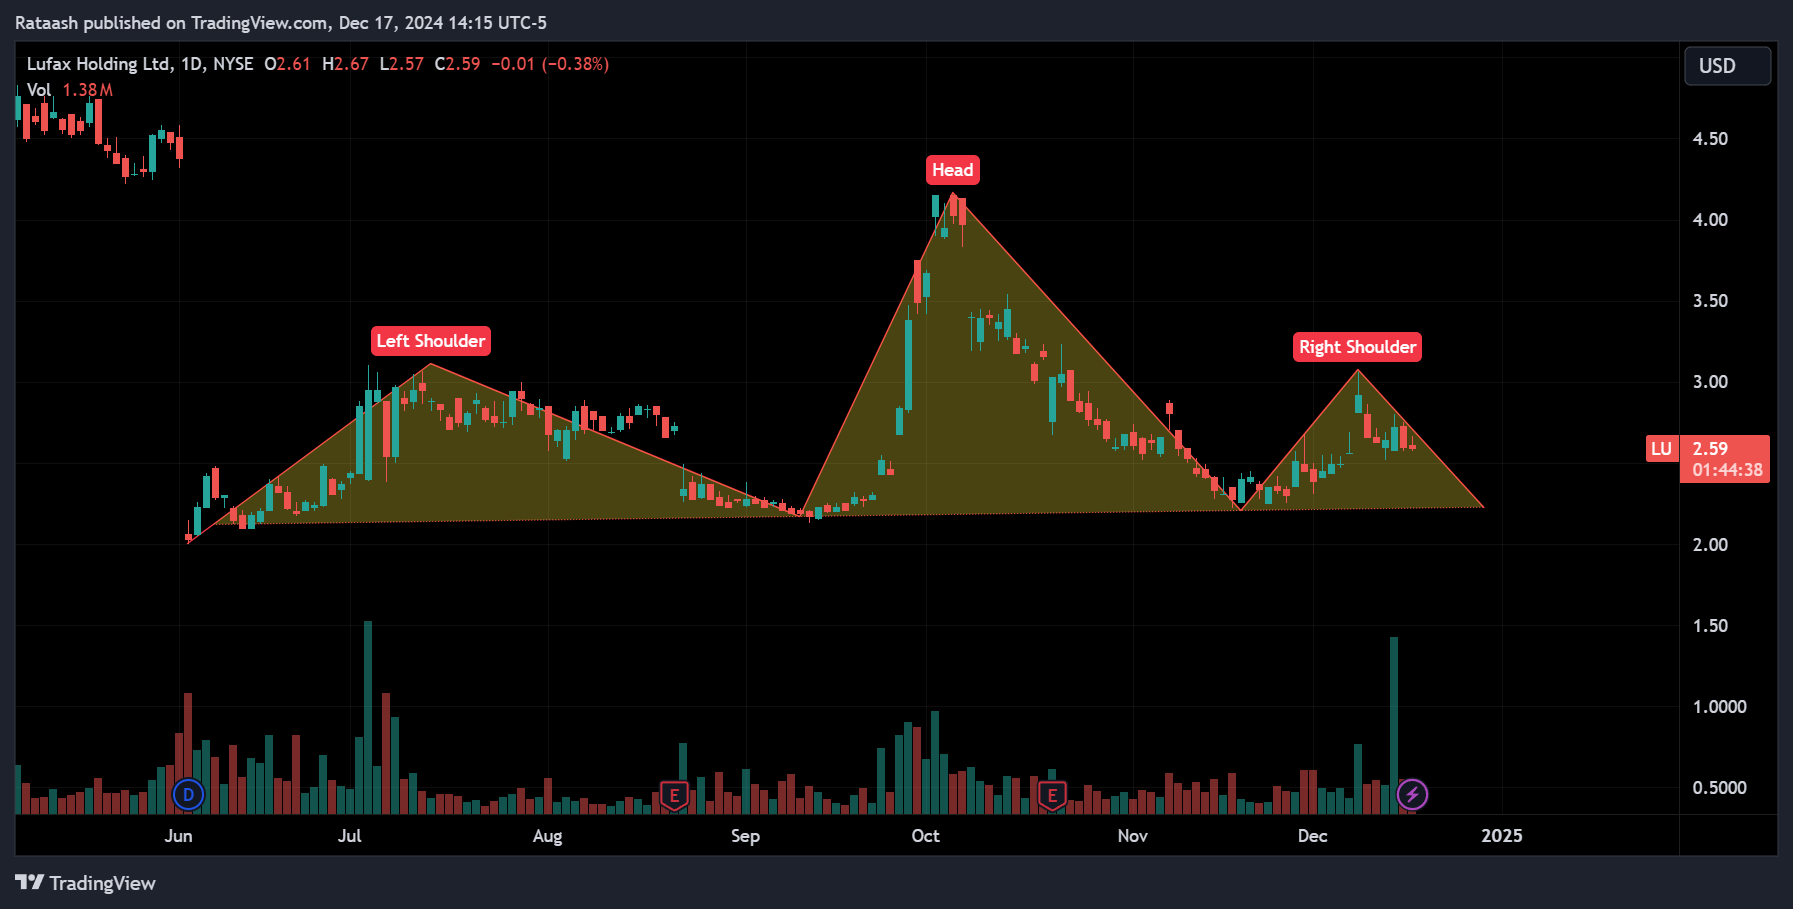
The head and shoulders pattern typically forms at the end of an uptrend. It comprises three peaks: the middle peak is the highest (“head”), and the two flanking peaks are lower and roughly equal (“shoulders”). A “neckline” connects the lows of the troughs between these peaks.
How It Forms:
- During a strong uptrend, buyers push the price to a peak (left shoulder), followed by a brief pullback.
- The price rallies again to a higher peak (head) but then retreats once more.
- A final attempt to push higher leads to a peak around the same height as the first (right shoulder), but this time, the buying momentum is weaker.
- Once the price breaks below the neckline, it suggests that sellers have taken control, signaling a potential trend reversal to the downside.
Trading Strategy Example:
- Entry: Wait for a confirmed neckline break on higher-than-average volume.
- Stop-Loss: Place a stop above the right shoulder to protect against false breakouts.
- Take-Profit: Aim for a profit target equal to the distance from the head to the neckline projected downwards.
2. Inverse Head and Shoulders Pattern
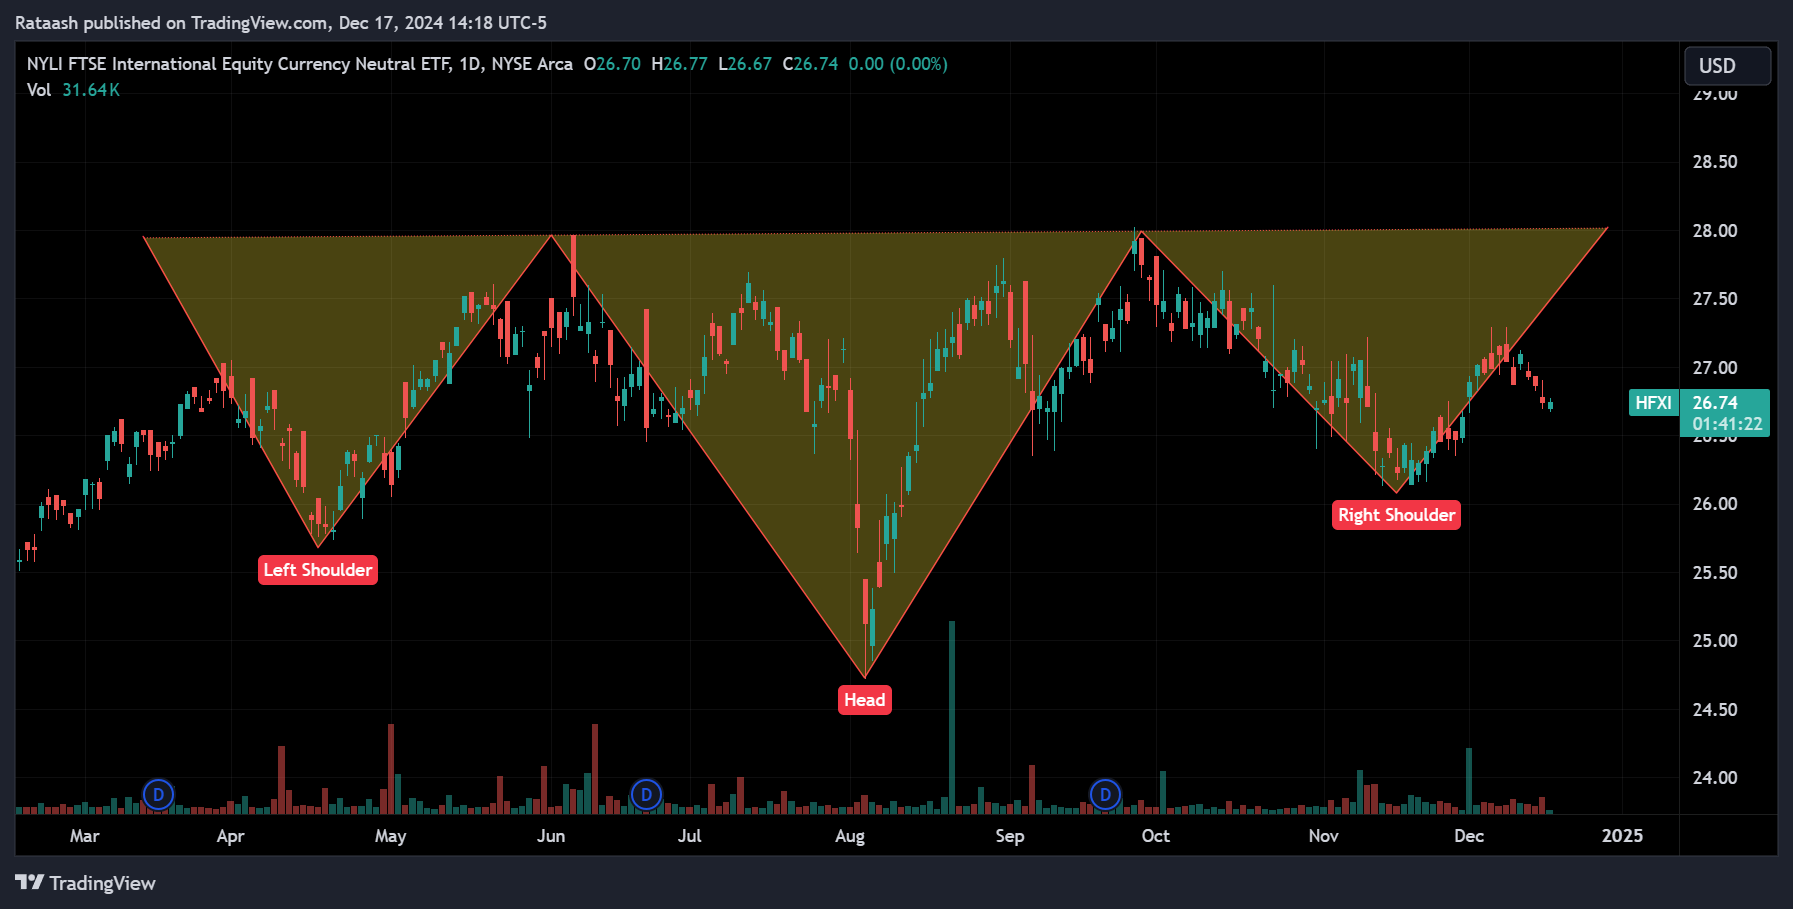
The inverse head and shoulders is the bullish counterpart to the traditional head and shoulders. It occurs at the bottom of a downtrend, signaling a potential bullish reversal.
How It Forms:
- In a downtrend, sellers push prices down to a trough (left shoulder), followed by a minor relief rally.
- The price sinks to a lower trough (head) before bouncing again.
- The price falls once more to form the right shoulder, roughly equal in depth to the left shoulder.
- A breakout above the neckline suggests buyers have regained control, potentially leading to an uptrend.
Trading Strategy Example:
- Entry: Buy when the price breaks above the neckline on strong volume.
- Stop-Loss: Place a stop below the right shoulder.
- Take-Profit: Measure the distance from the head to the neckline and project it upwards.
3. Double Top and Double Bottom
Double Top (Bearish Reversal):
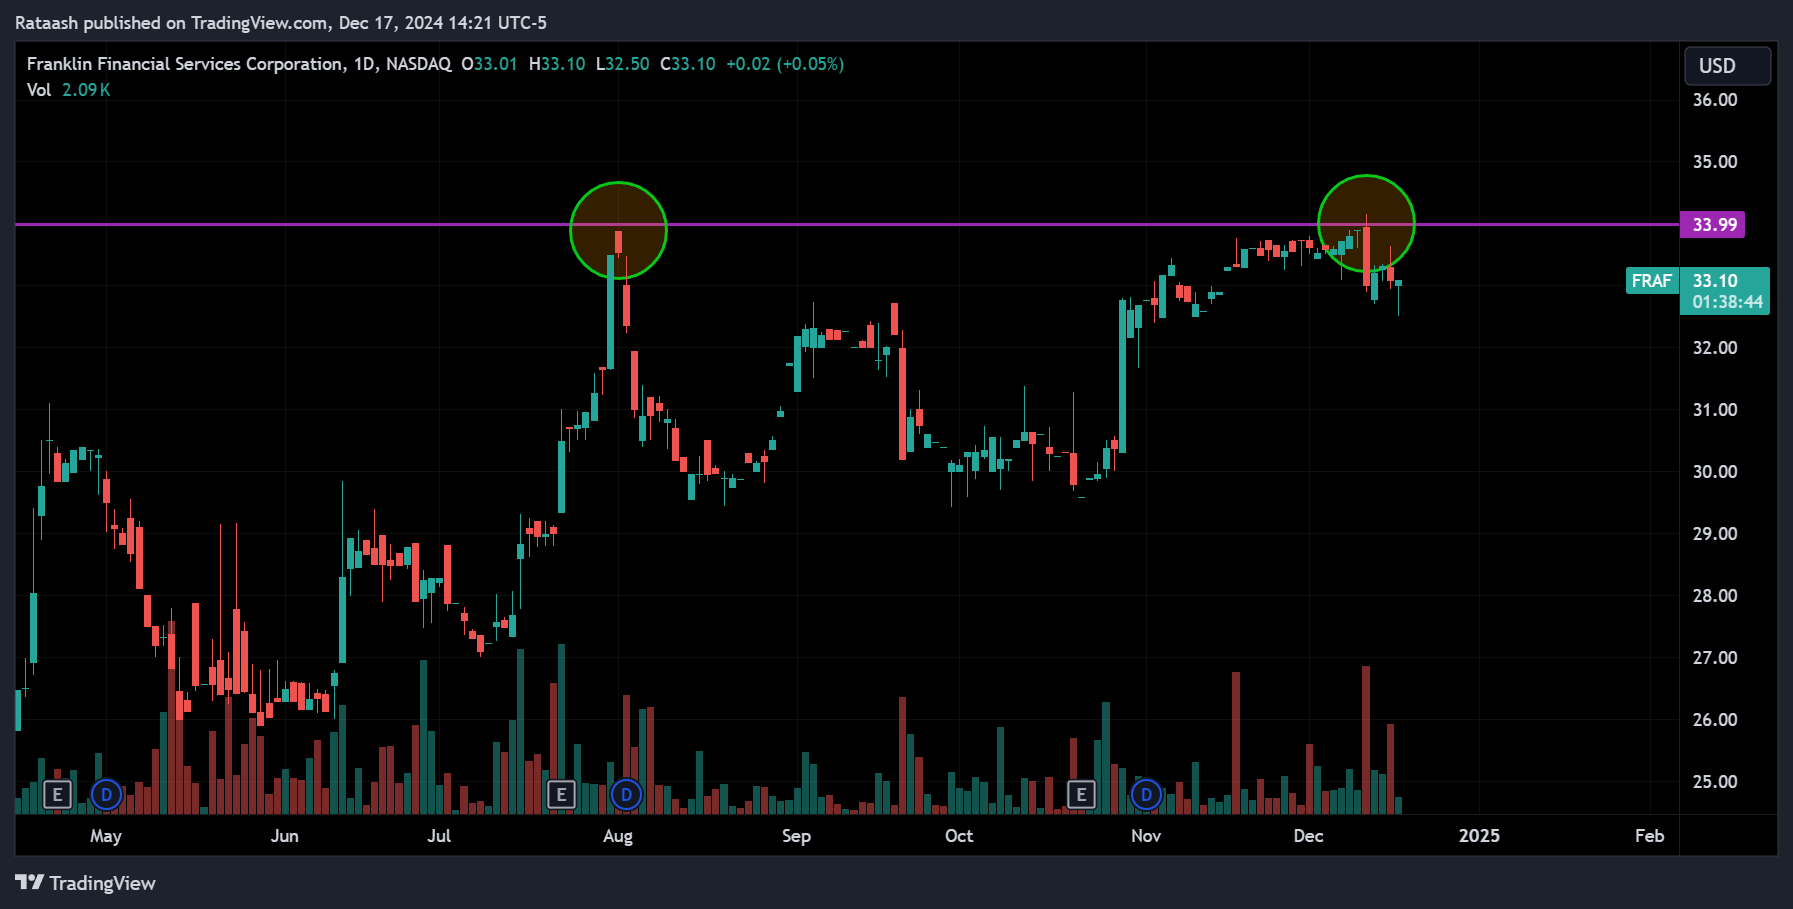
A double top forms when the price reaches a peak, pulls back, and then rallies again to a similar height, failing to break through that resistance level. Once it rolls over and breaks the intervening trough, it suggests the uptrend may be ending.
Double Bottom (Bullish Reversal):
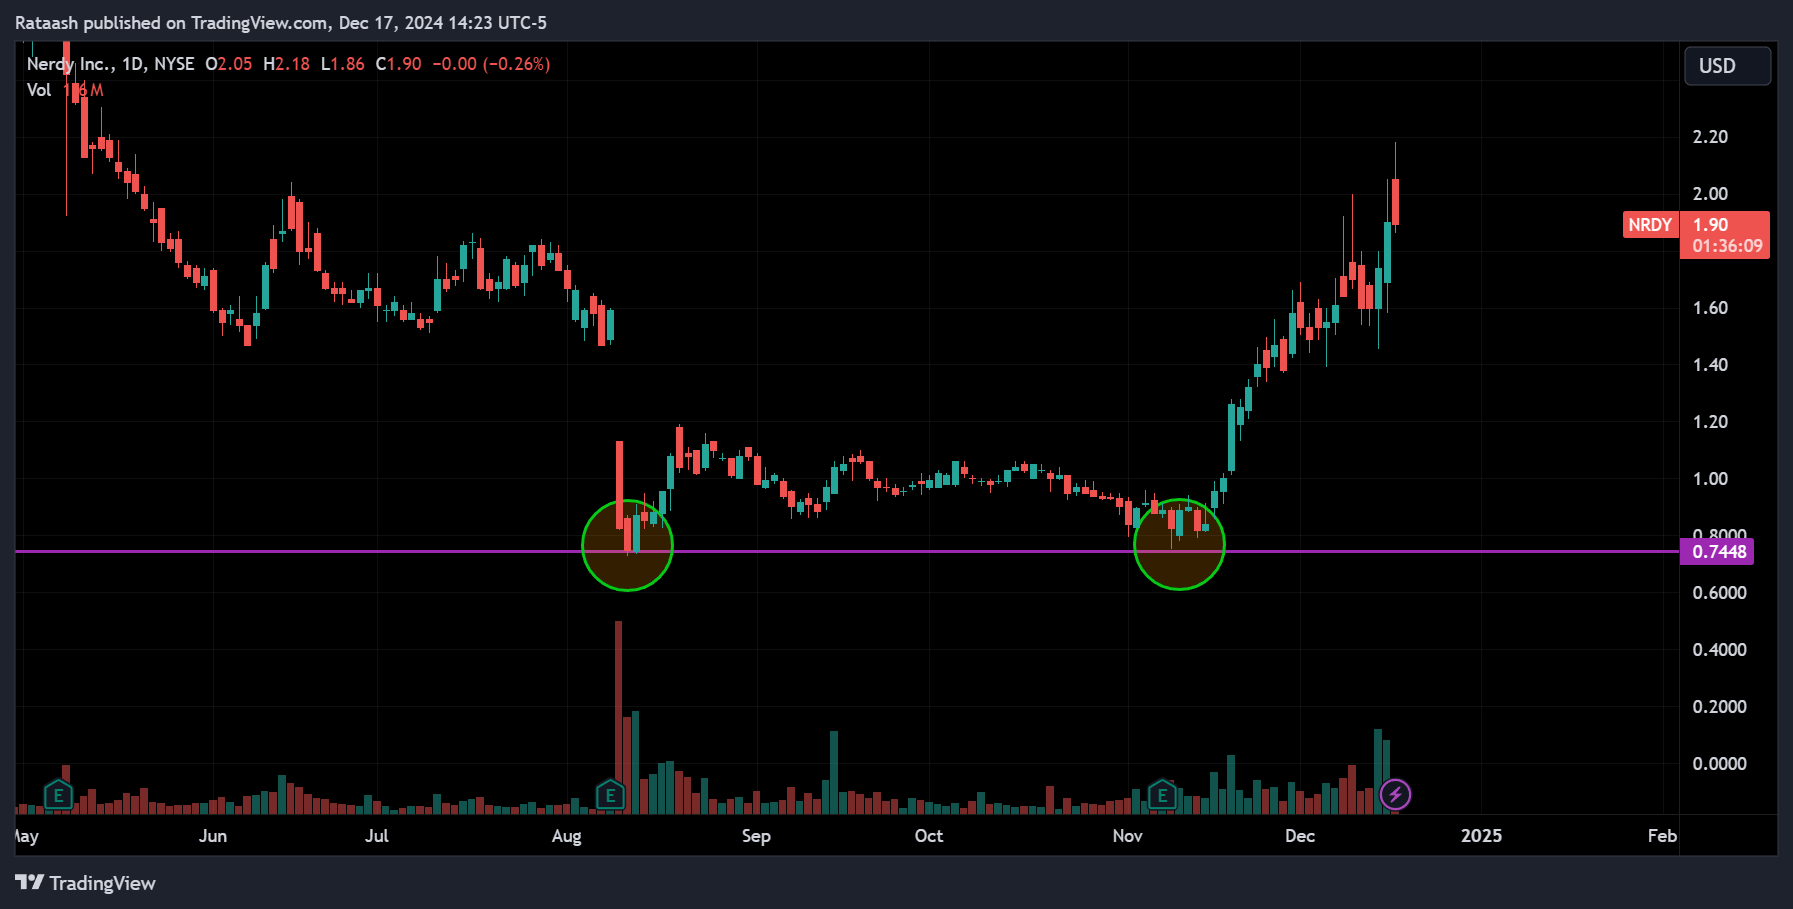
A double bottom is the inverse scenario—price hits a low, bounces, then retests that low but fails to go lower. This pattern indicates sellers have run out of steam, and buyers may push the price higher after breaking above the intervening peak.
4. Triple Top and Triple Bottom
Triple Top (Bearish Reversal):
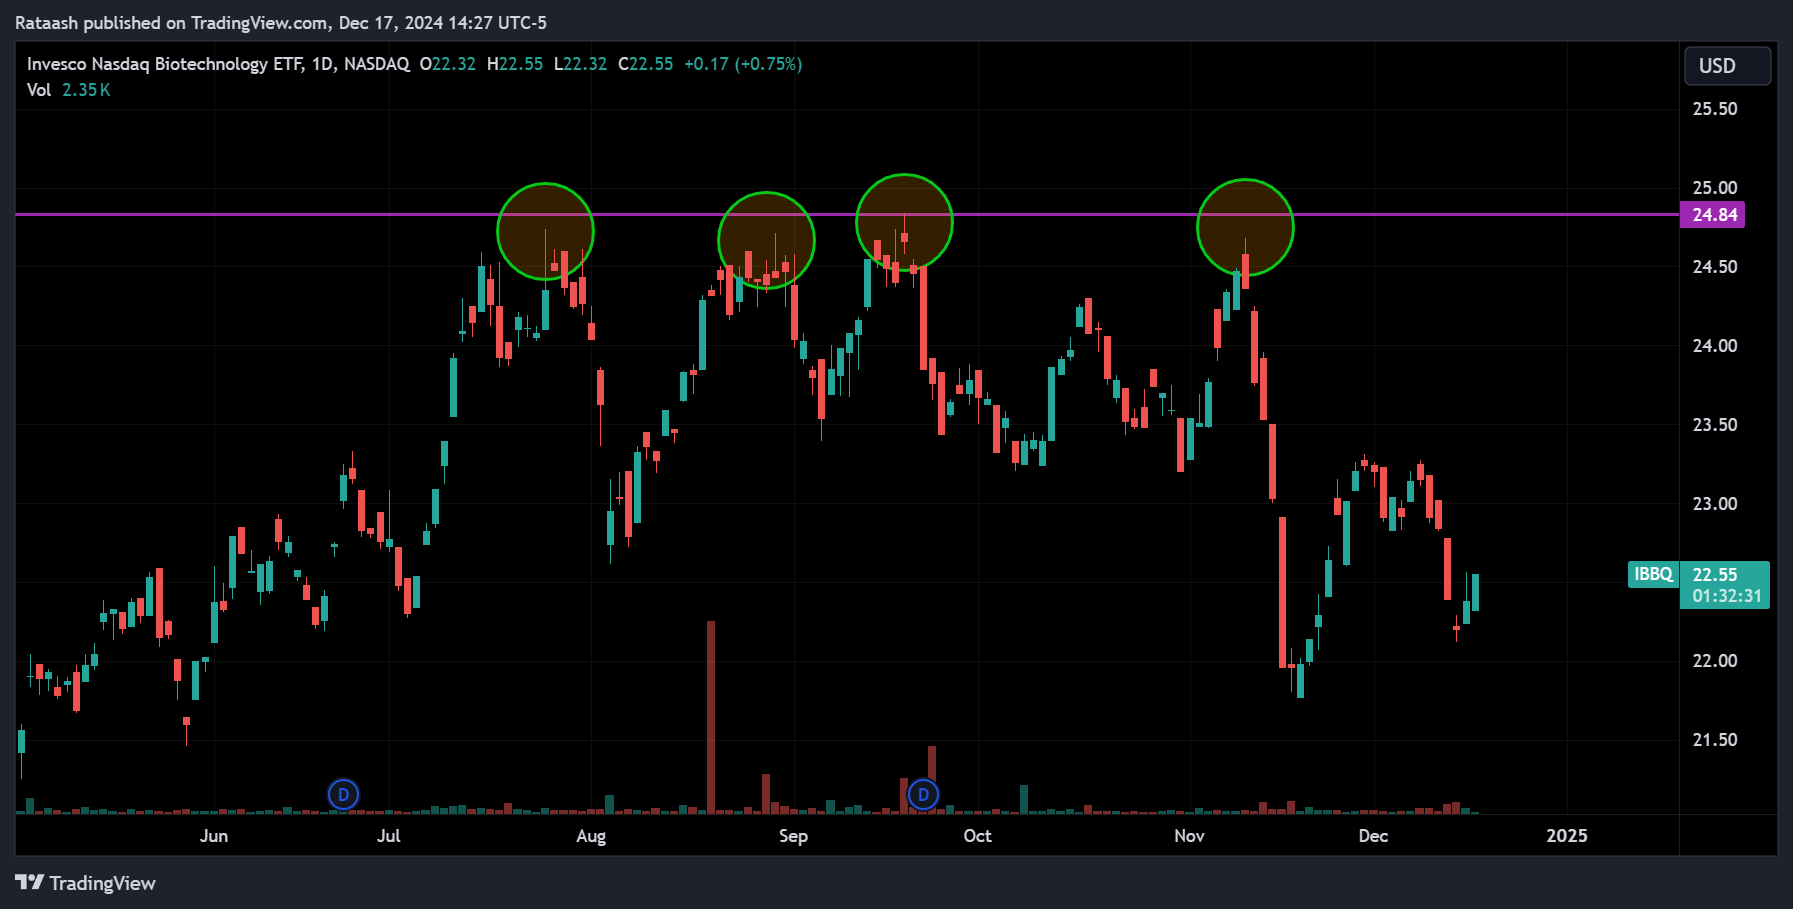
This pattern shows three failed attempts by buyers to push the price higher. Each peak roughly aligns at the same resistance level. The inability to break higher signals increasing weakness, and a break below the support level formed by the troughs confirms the reversal.
Triple Bottom (Bullish Reversal):
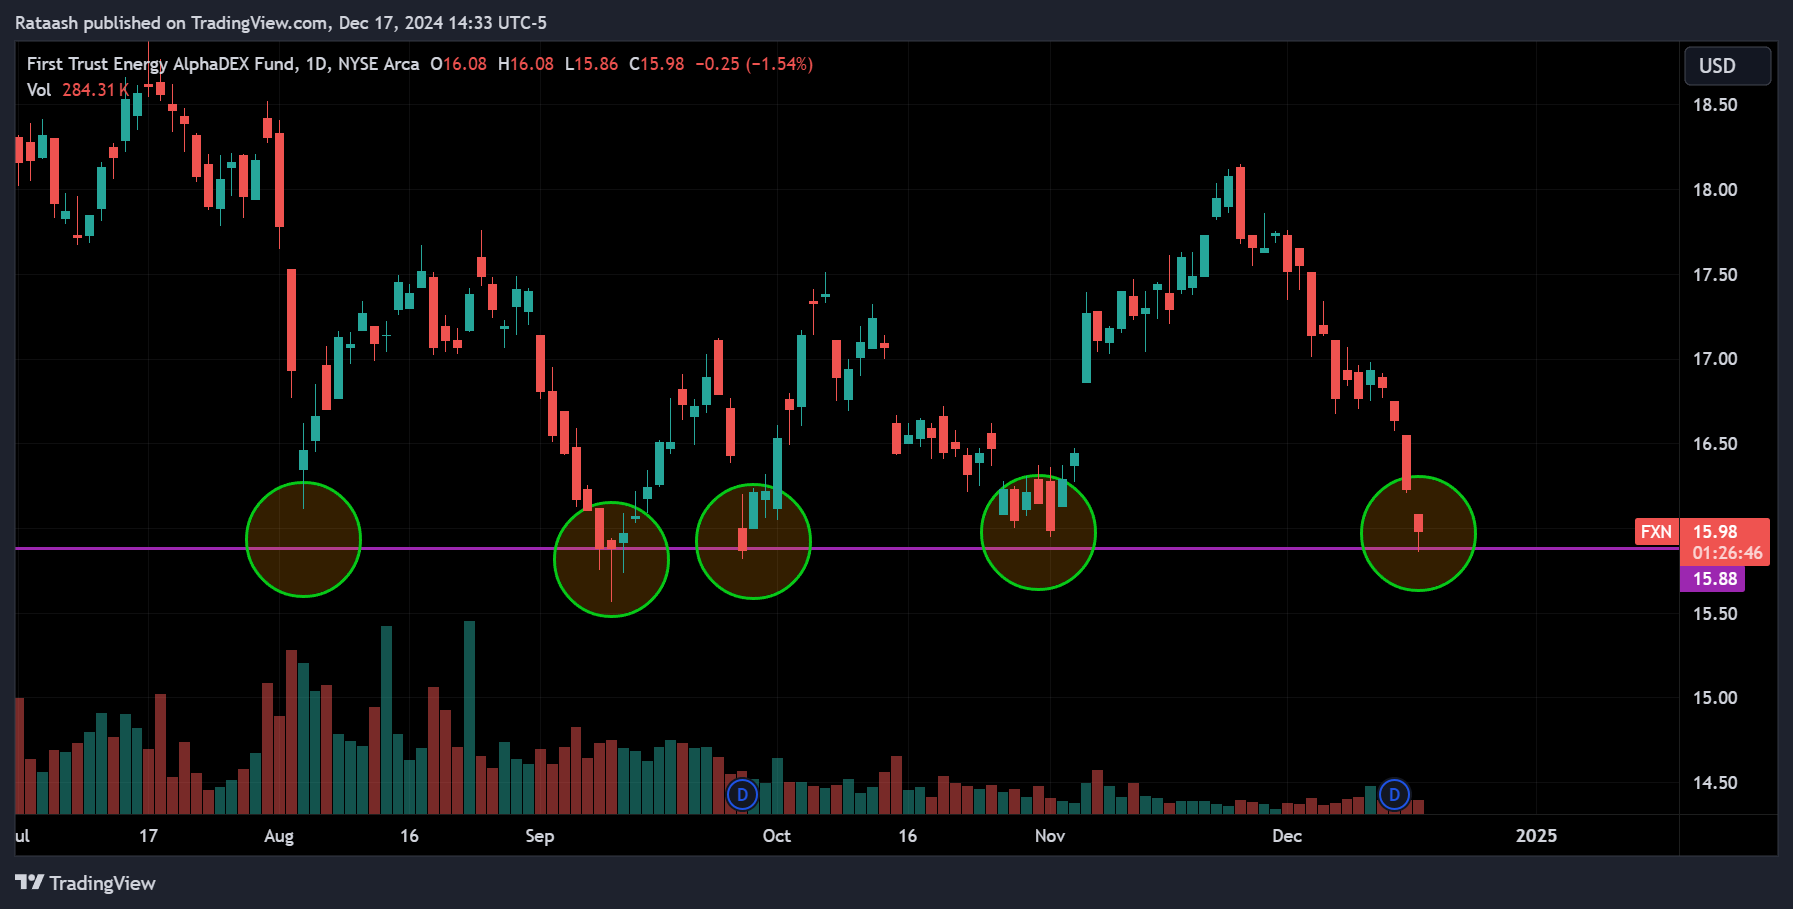
The bullish version, forming three bottoms at about the same level, indicates sellers cannot push the price lower. A breakout above the resistance formed by the intervening peaks suggests a bullish reversal.
Common Continuation Chart Patterns
When markets pause during a trend, continuation patterns often emerge. Learning to identify these can help you spot trading opportunities that allow you to ride the trend’s next leg.
1. Triangles (Symmetrical, Ascending, and Descending)
Symmetrical Triangle:
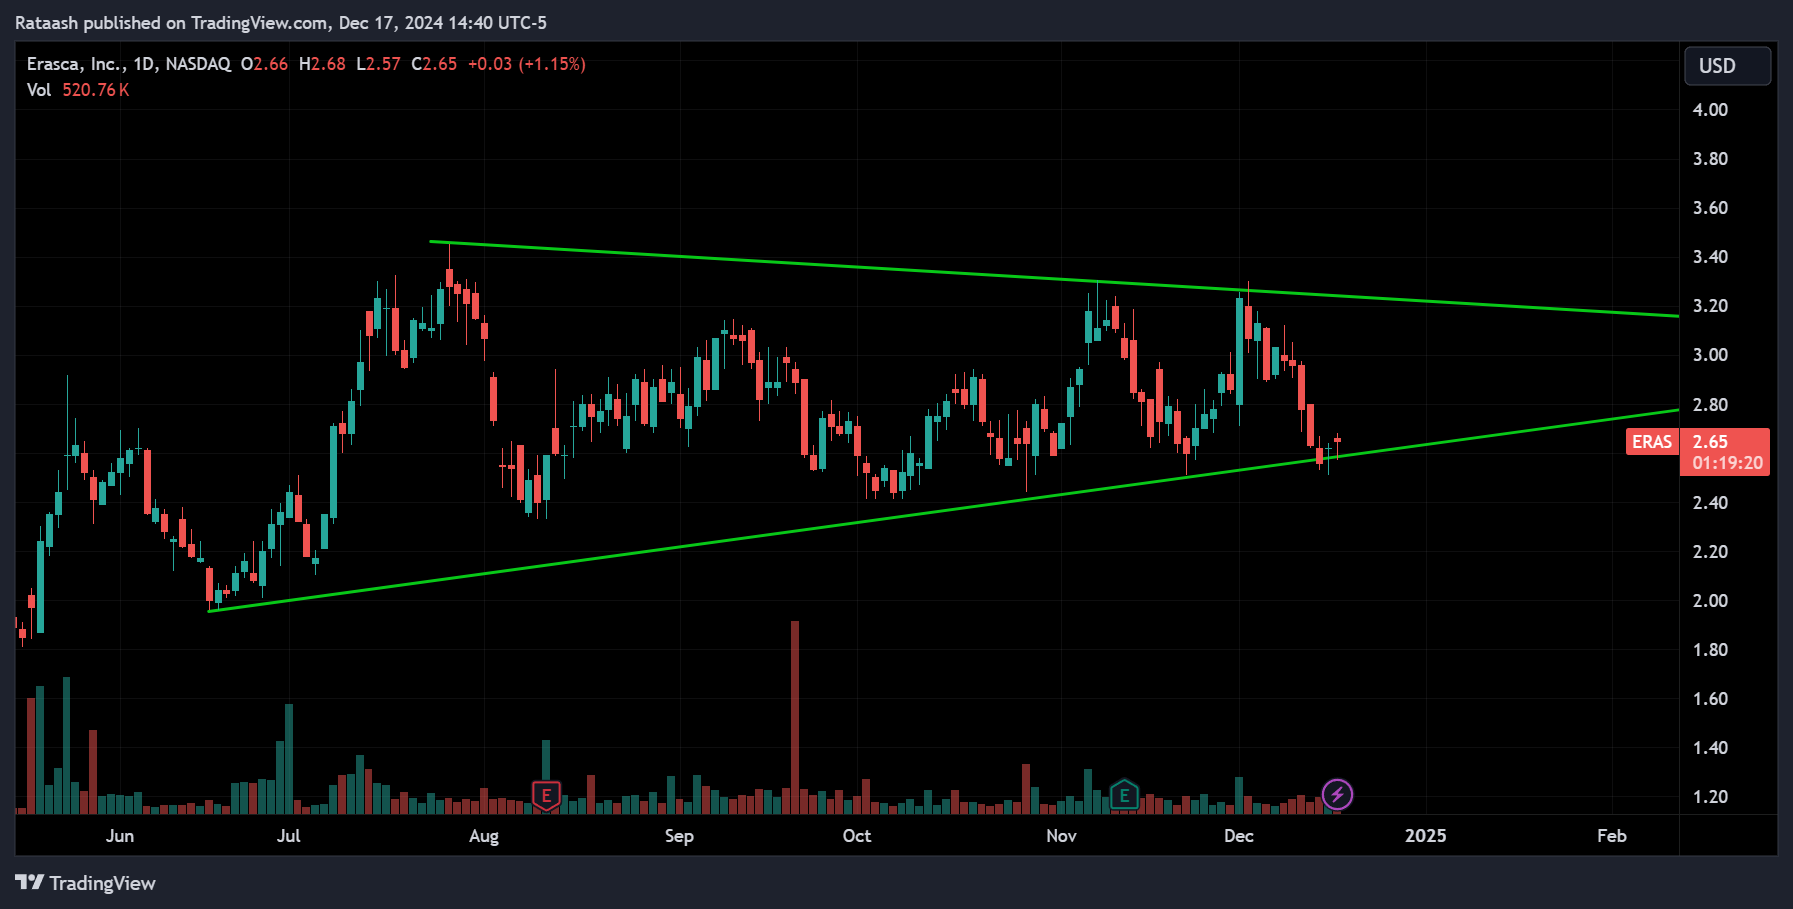
- Formation: Price makes lower highs and higher lows, converging towards a point.
- Interpretation: This pattern suggests a balance between buyers and sellers. A breakout in either direction tends to lead to a strong continuation of the prior trend.
Ascending Triangle:
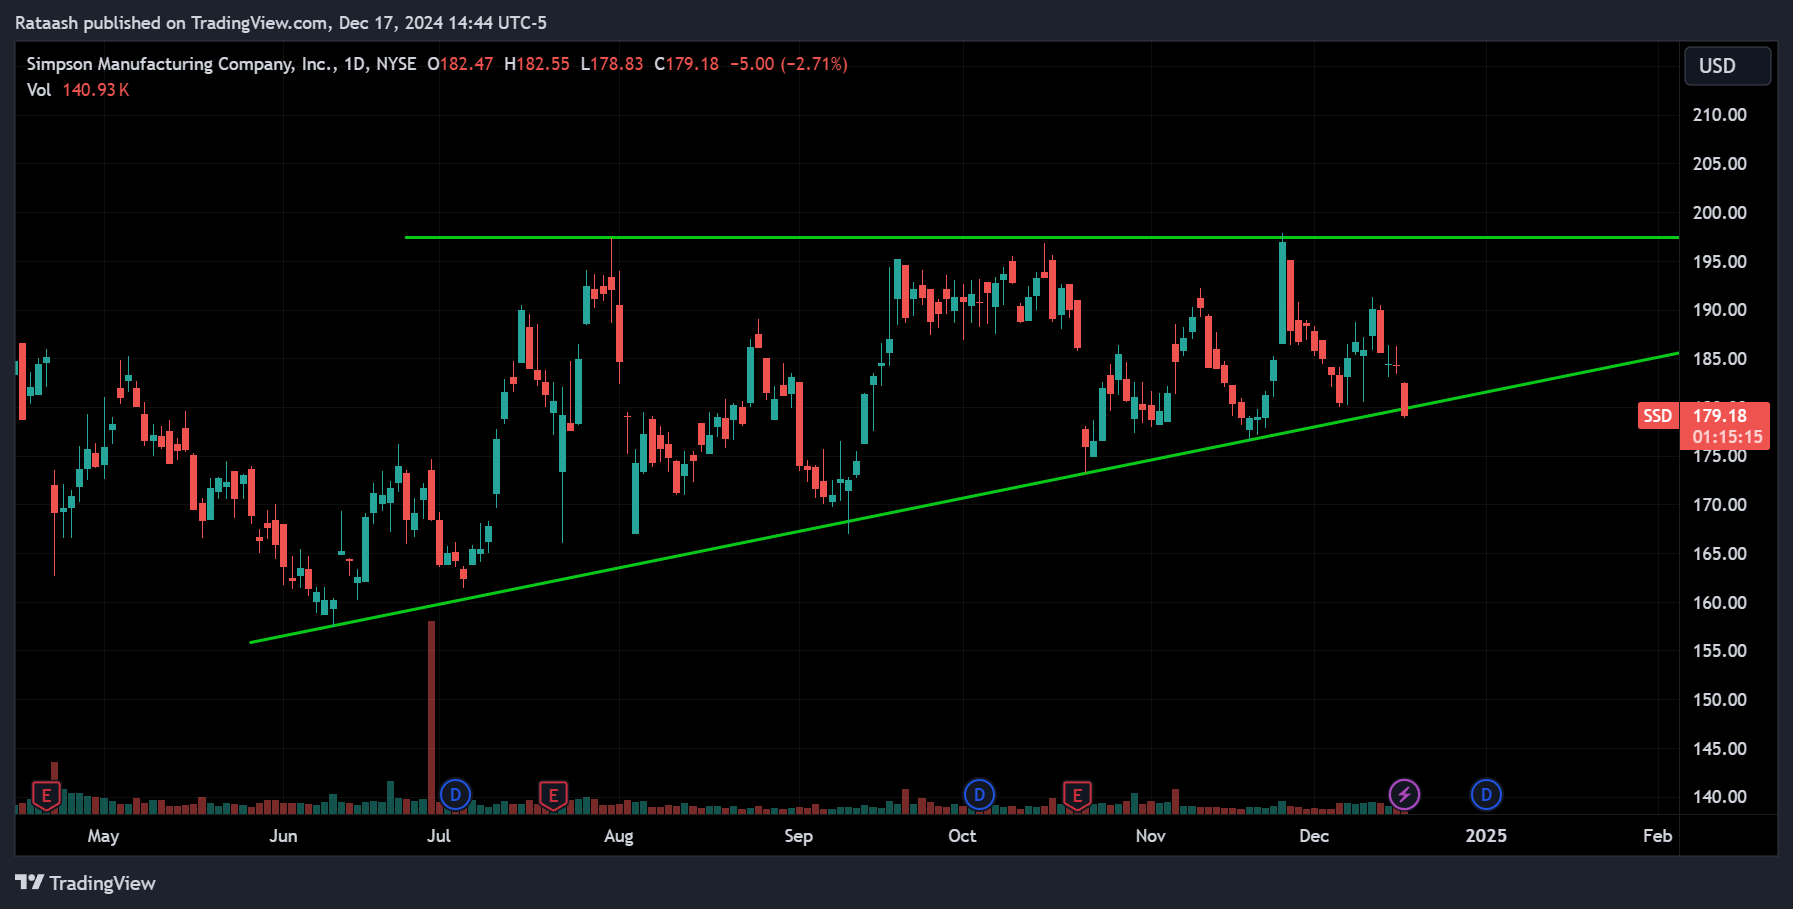
- Formation: Horizontal resistance line on top with rising trendline on the bottom.
- Interpretation: Buyers are increasingly willing to buy at higher prices, creating a rising floor. Once the price breaks above the horizontal resistance, the uptrend typically resumes.
Descending Triangle:
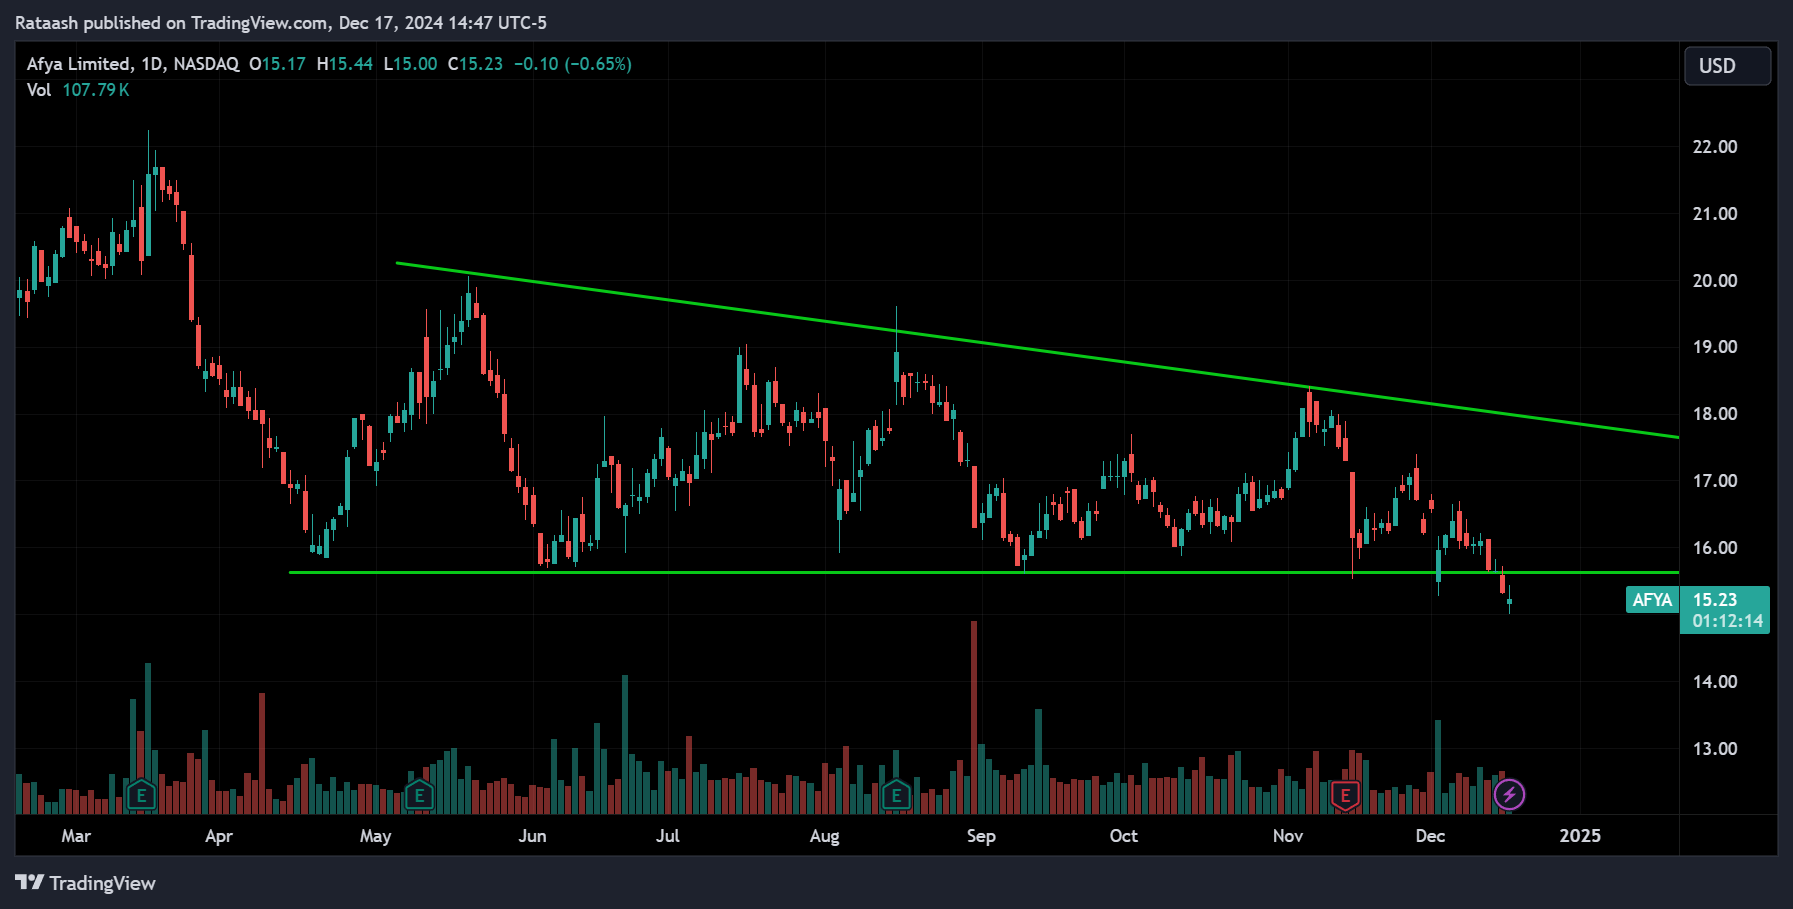
- Formation: Horizontal support line on the bottom with a descending trendline on top.
- Interpretation: Sellers are gradually pushing the price down to test a flat support level. A break below the support often leads to a bearish continuation.
Trading Strategy Example for Triangles:
- Entry: Wait for a confirmed breakout beyond the triangle’s boundaries.
- Stop-Loss: Place stops slightly inside the triangle’s opposite boundary.
- Take-Profit: Measure the triangle’s vertical height and project it in the breakout direction to estimate potential profit targets.
2. Flags and Pennants
Flags:
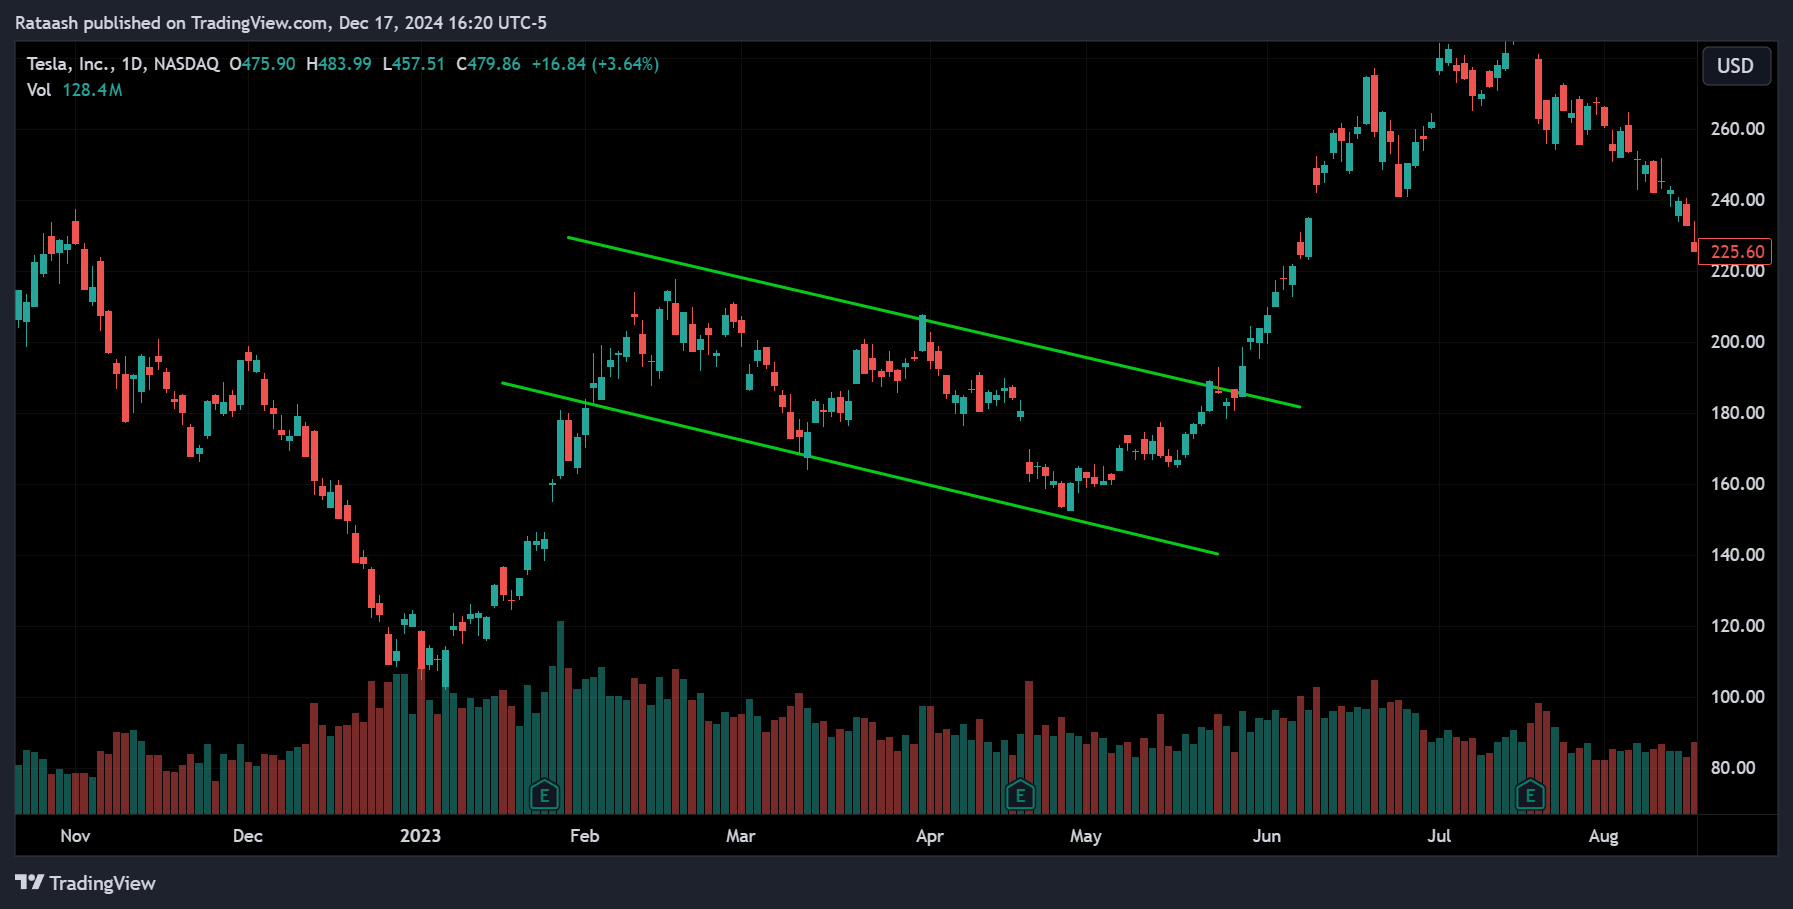
- Formation: Flags form after a strong price move (flagpole) followed by a brief, rectangular consolidation.
- Interpretation: The pattern reflects a short pause in the trend. After consolidation, the price usually continues in the direction of the initial move.
Pennants:
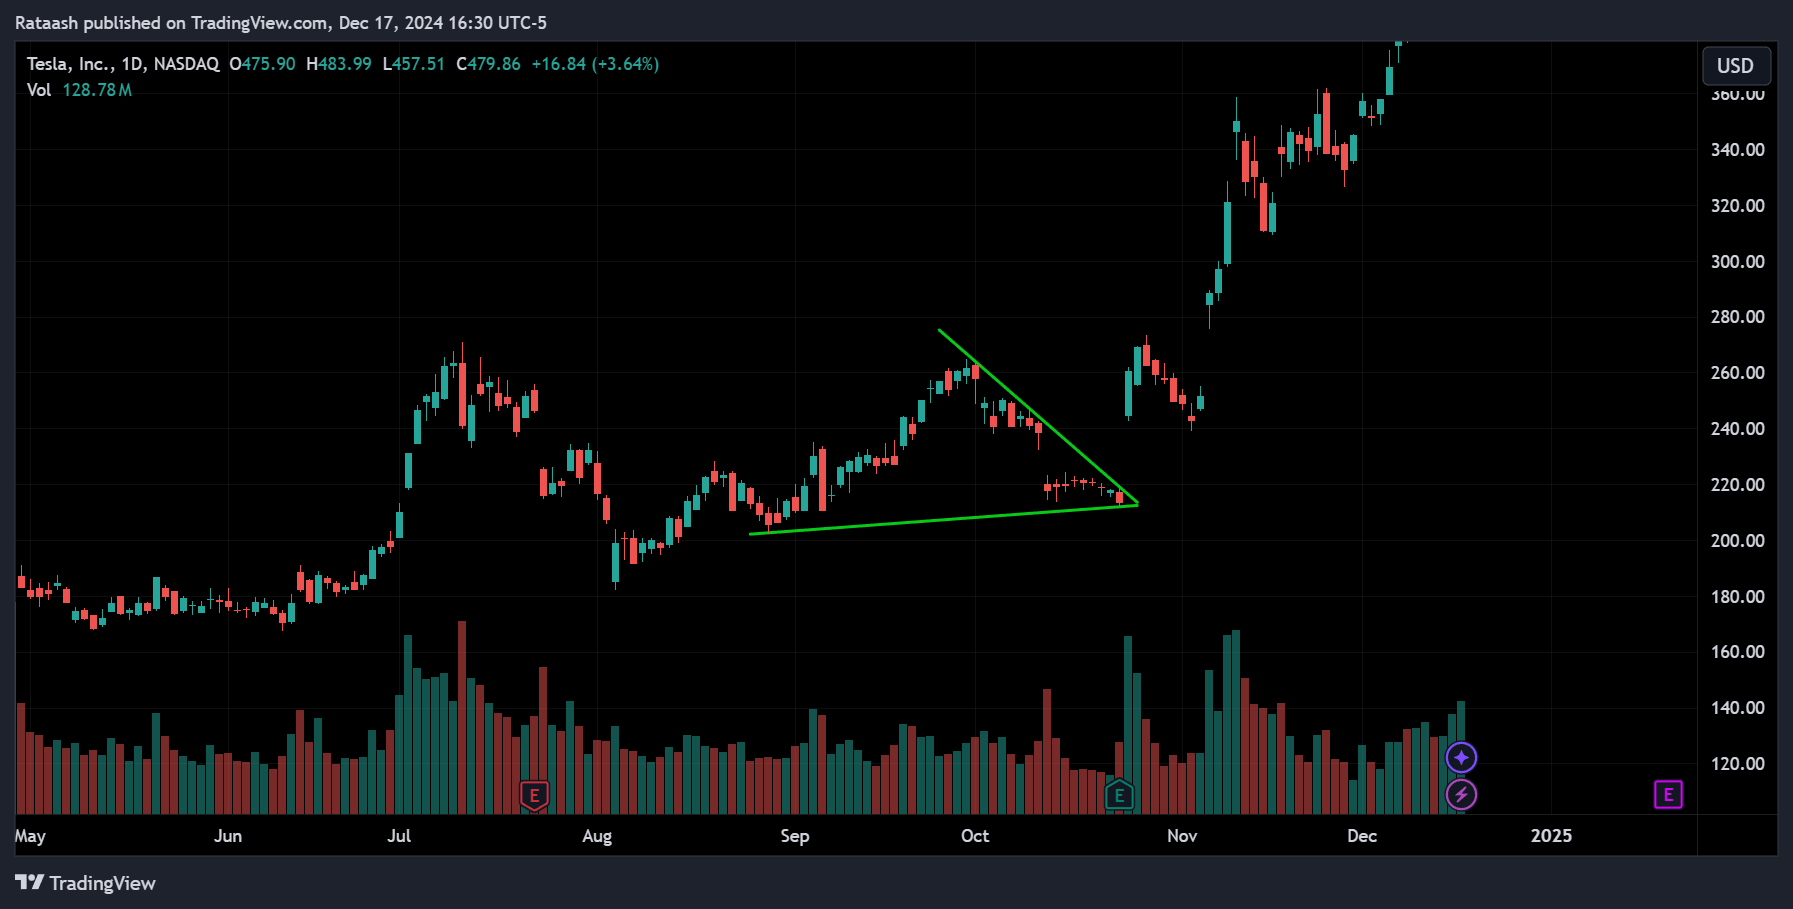
- Formation: Pennants are similar to flags but have converging trendlines, creating a small, symmetrical triangle after a sharp move.
- Interpretation: Like flags, pennants represent a brief rest before the trend resumes.
Trading Strategy Example for Flags and Pennants:
- Entry: Enter after the price breaks above the flag or pennant in an uptrend (or below it in a downtrend).
- Stop-Loss: Place stops below the pattern’s low for bullish setups or above the pattern’s high for bearish setups.
- Take-Profit: Use the height of the flagpole to estimate the likely continuation move.
3. Rectangles
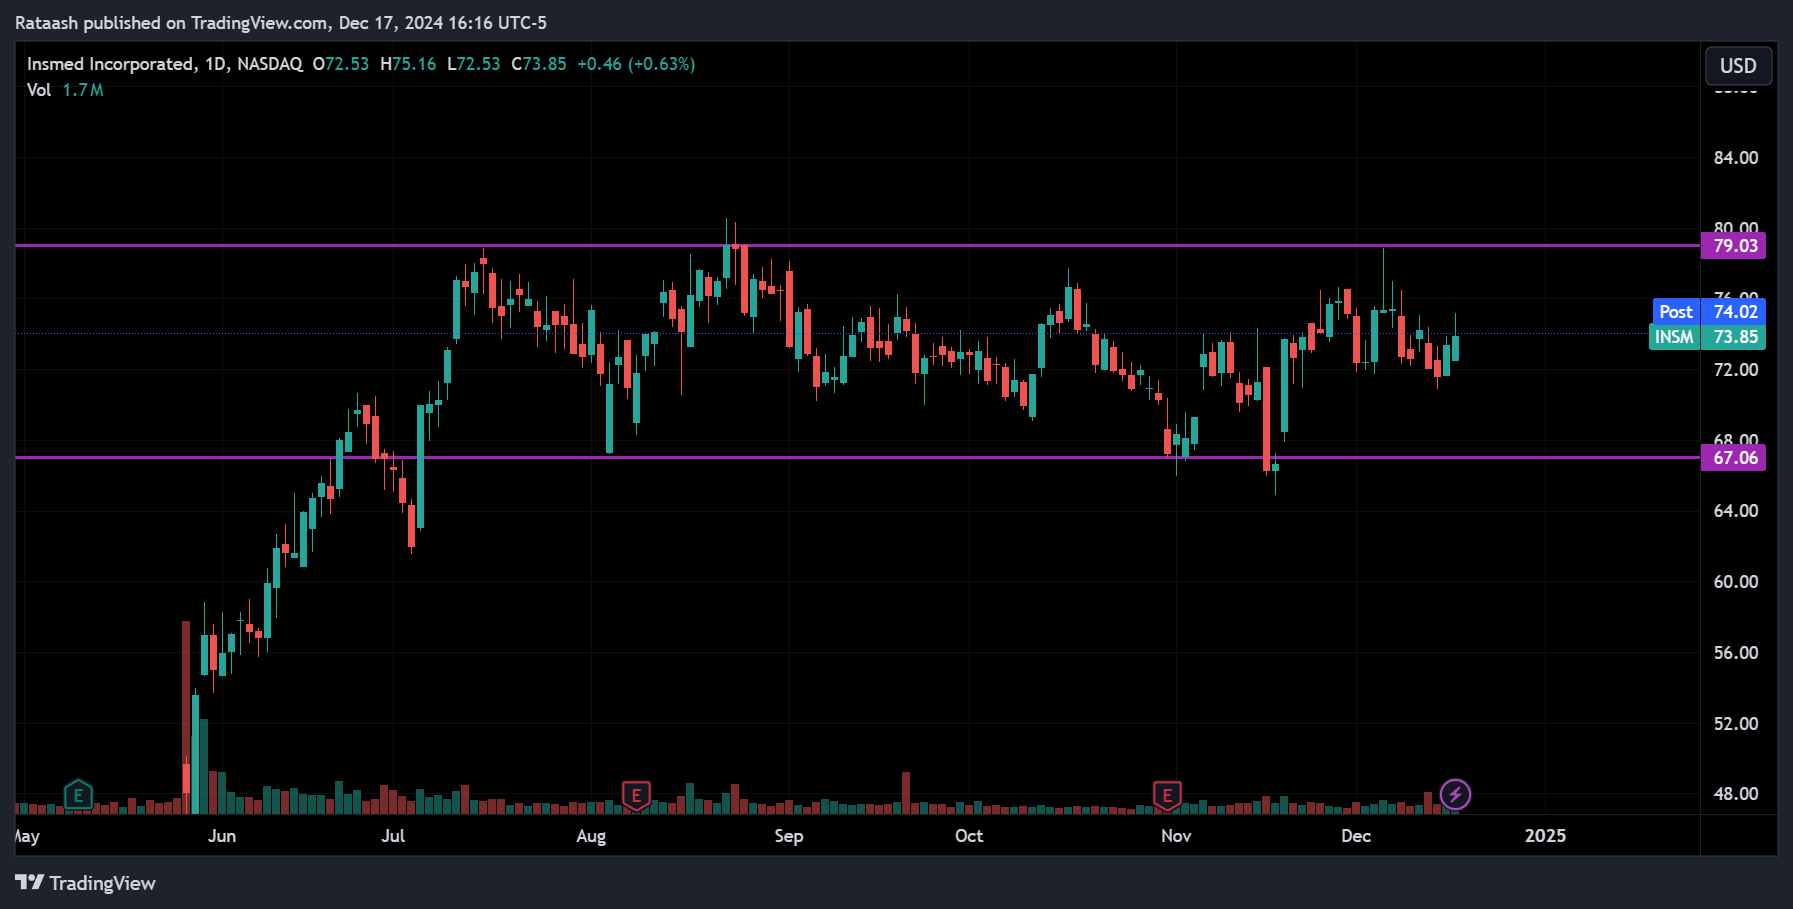
- Formation:
Rectangles occur when the price oscillates between a clear horizontal support and resistance level. The price movement becomes range-bound for a period, creating a “box” shape. - Interpretation:
Rectangles indicate a period of indecision where buyers and sellers are evenly matched. A breakout above the rectangle’s resistance suggests the trend will continue upward, while a breakdown below support suggests the trend will continue downward.
Trading Strategy Example for Rectangles:
- Entry: Wait for a decisive breakout in either direction.
- Stop-Loss: Place stops just inside the rectangle to guard against false breakouts.
- Take-Profit: Target a price move equal to the height of the rectangle.
How to Identify Chart Patterns
Identifying chart patterns isn’t just about memorizing shapes; it’s about understanding price action and market psychology. Here are some tips to sharpen your pattern recognition skills.
- Focus on Clear Patterns:
Start by looking for textbook examples. As a beginner, it’s easy to see patterns everywhere, but not all formations are meaningful. The cleaner and more symmetrical the pattern, the more reliable it tends to be. - Use Multiple Timeframes:
Patterns can appear on any timeframe—daily, hourly, or even 5-minute charts. Check higher timeframes (such as daily or weekly) to get a broader context, and then use lower timeframes (such as hourly) to fine-tune your entries and exits. - Look for Volume Confirmation:
Volume should typically confirm the pattern’s validity. For example, in a head and shoulders top, volume often decreases as the pattern forms and then spikes on the neckline break. Similarly, breakouts from triangles or flags on higher volume reinforce the breakout’s credibility. - Combine with Other Indicators:
While chart patterns can stand on their own, confirmation from technical indicators like moving averages, RSI, or MACD can add confidence. For instance, a bullish reversal pattern forming when RSI is oversold might strengthen your conviction in going long.
Strategies for Trading Chart Patterns
Trading chart patterns effectively involves more than just recognizing the shapes. You need a plan for when to enter, where to set stops, and how to take profits. Let’s break down the key components of a good trading strategy.
1. Entry Points
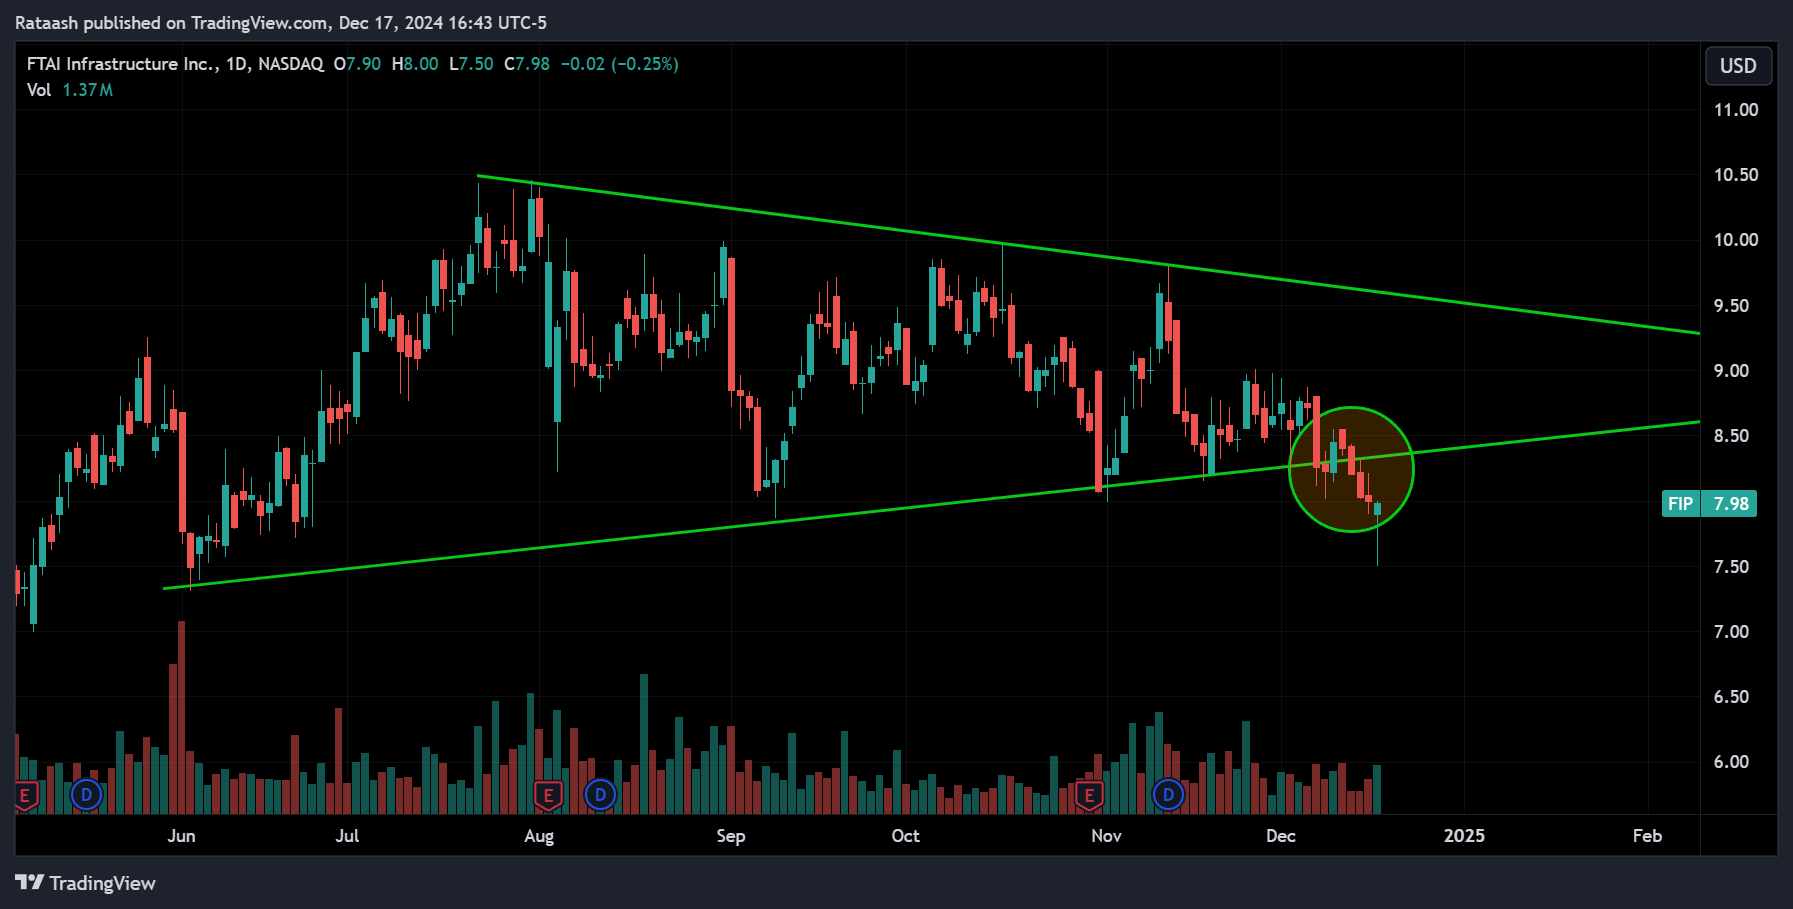
- Wait for Confirmation: Don’t anticipate a pattern’s completion. Wait for the breakout or the key level (like the neckline in a head and shoulders) to be breached with conviction.
- Use Pending Orders: To avoid missing a fast-moving breakout, consider placing buy stop or sell stop orders just beyond the breakout level.
- Combine with Market Context: Check whether the general market environment, sector strength (for stocks), or currency correlations (for forex) support your directional bias.
2. Stop-Loss Placement
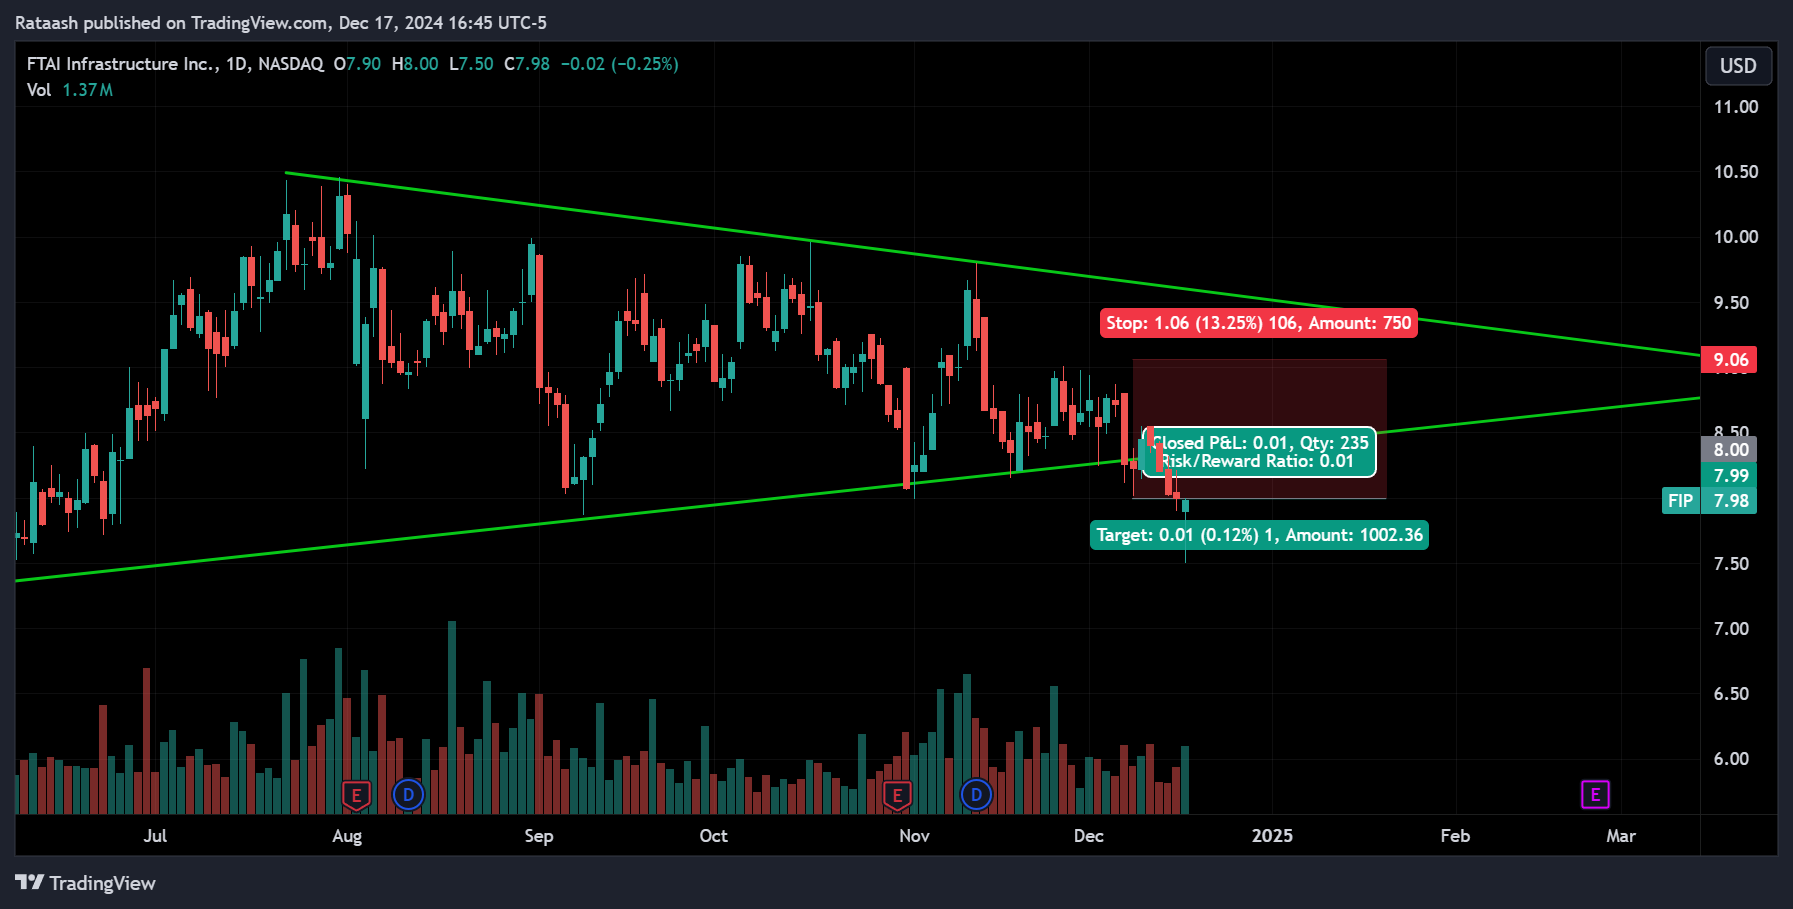
- Pattern-Based Stop-Loss: A logical stop-loss level usually sits slightly beyond a key support or resistance defined by the pattern. For example, if you’re trading a head and shoulders top, place your stop slightly above the right shoulder.
- Volatility Consideration: Adjust your stop-loss according to the asset’s volatility. More volatile instruments may require a wider stop to avoid premature exits.
- Trailing Stops: Once your trade moves in your favor, consider using trailing stops to lock in profits while still allowing the position to grow if the trend continues.
3. Profit Targets
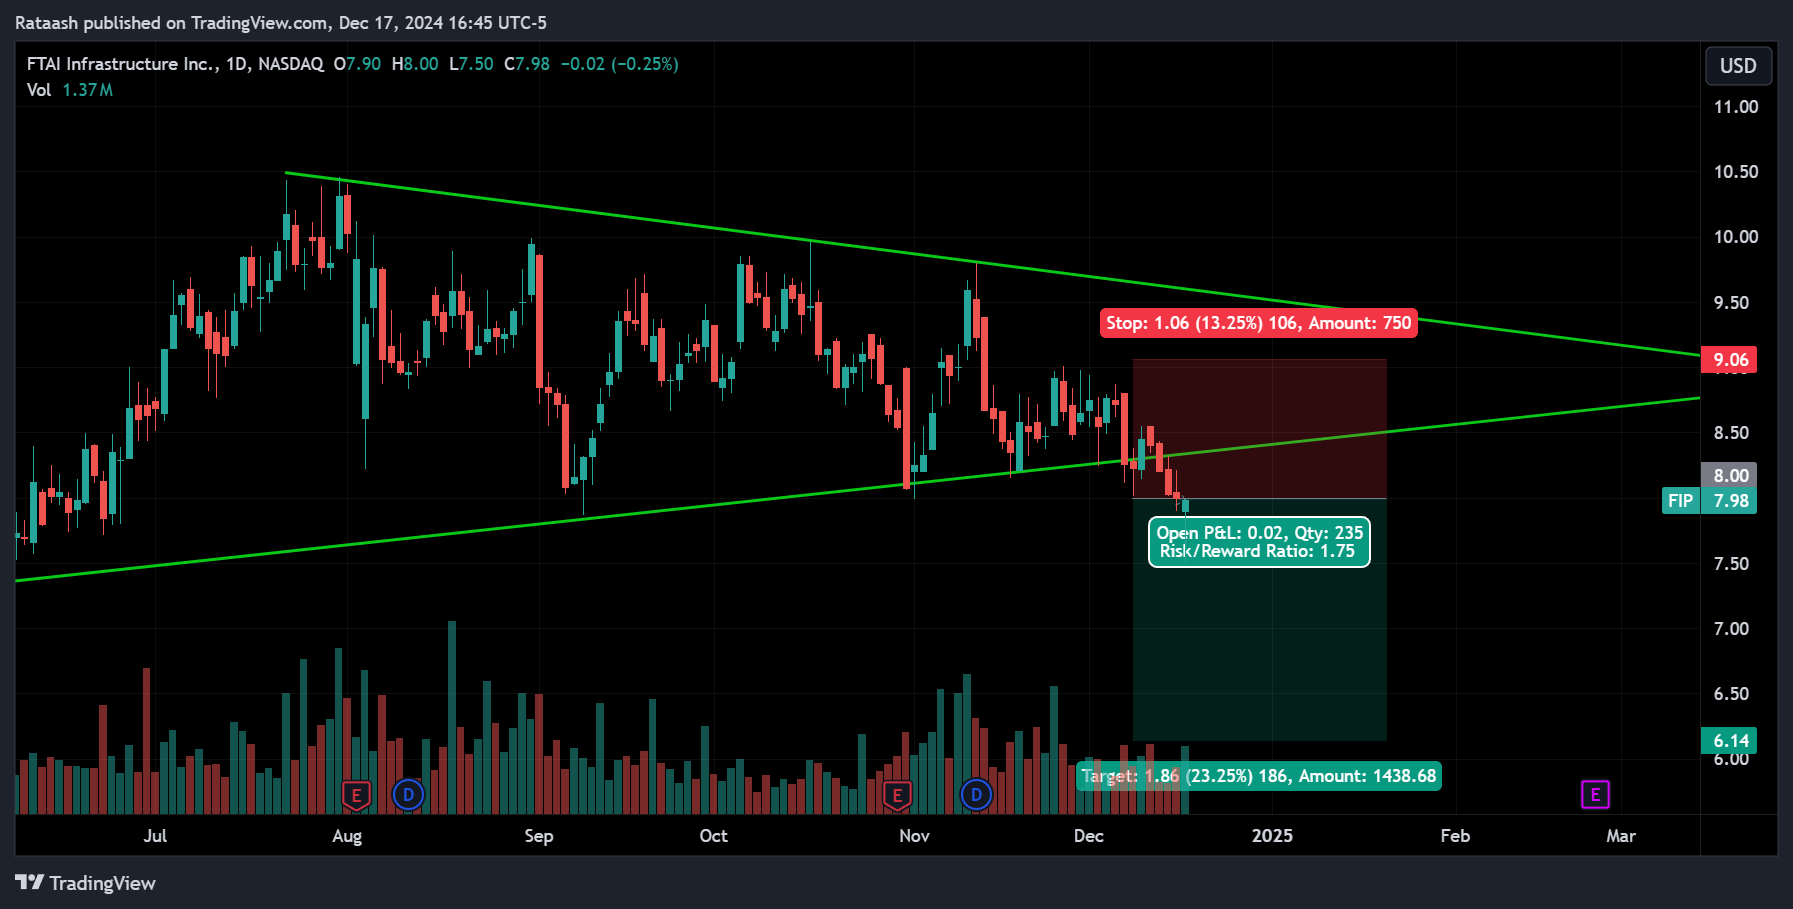
- Measured Moves: Many patterns have a “measured move” technique. For instance, measure the distance from the head to the neckline in a head and shoulders pattern, then project that distance from the breakout point to estimate a potential profit target.
- Partial Profits: Consider taking partial profits at intermediate milestones. Locking in some gains along the way reduces psychological pressure and can improve your overall success rate.
- Dynamic Targets: Adapt to market conditions. If the pattern projects a certain target but market momentum is extremely strong, you might hold on for more gains—or conversely, exit early if momentum falters.
Risk Management and Position Sizing

No matter how skilled you become at identifying and trading chart patterns, you must remain vigilant about risk management. Proper risk management ensures that a single losing trade won’t wipe out your account.
Key Considerations:
- Risk-Reward Ratio:
Always aim for a favorable risk-reward ratio. For instance, risking $1 to potentially earn $2 or $3 puts you in a better position to grow your account even if you’re not winning on every trade. - Position Sizing:
Determine the appropriate position size for each trade based on the distance between your entry and your stop-loss level. If you want to risk only 1% of your capital on a single trade, adjust your position size so that if your stop-loss is hit, you lose no more than 1% of your total account. - Diversification:
Avoid putting all your trading capital into a single asset or pattern setup. Spread your risk across different instruments and chart patterns to reduce the impact of any one losing trade. - Emotional Control:
Stick to your predefined risk parameters. Don’t move your stop-loss farther away in the hope of avoiding a loss. Discipline is crucial for long-term success.
Common Mistakes to Avoid
Every trader makes mistakes, especially when starting out. By being aware of common pitfalls, you can shorten your learning curve and improve your trading performance.
- Overtrading:
Don’t force patterns where they don’t exist. Trading too frequently or chasing every perceived pattern can lead to poor results. Be selective and patient. - Ignoring Fundamental Context:
While chart patterns focus on price action, it never hurts to be aware of fundamental catalysts. Major economic news, earnings reports, or geopolitical events can overshadow technical patterns. - Not Adhering to Stops:
Failing to honor your stop-loss is a recipe for disaster. The market can remain irrational longer than you can remain solvent. Accept small losses and move on to the next opportunity. - Lack of Journaling and Review:
Many traders neglect reviewing their trades. Keep a trading journal with screenshots of patterns, entry/exit points, and emotions felt during the trade. Regularly reviewing this information helps you identify what works and what doesn’t.
Practical Tips for Success
- Start with a Demo Account:
Before risking real money, practice trading chart patterns in a simulated environment. This allows you to sharpen your skills without financial stress. - Focus on a Few Reliable Patterns:
Rather than trying to master every pattern, pick a few you understand deeply. Maybe start with head and shoulders, double tops/bottoms, and triangles, then expand your repertoire. - Combine Technical and Fundamental Inputs (If Appropriate):
Even if you rely heavily on charts, knowing when a company’s earnings report is due or when a central bank might announce interest rate changes can help you navigate potential volatility. - Maintain Emotional Discipline:
Trading success comes from consistent execution. Don’t let fear or greed derail your plan. Stick to your strategy and risk management rules. - Continuously Educate Yourself:
Markets evolve, and so should you. Read trading books, follow reputable analysts, and consider participating in trading forums or mentorship programs to keep growing your skill set.
Example of a Complete Trade Using a Chart Pattern
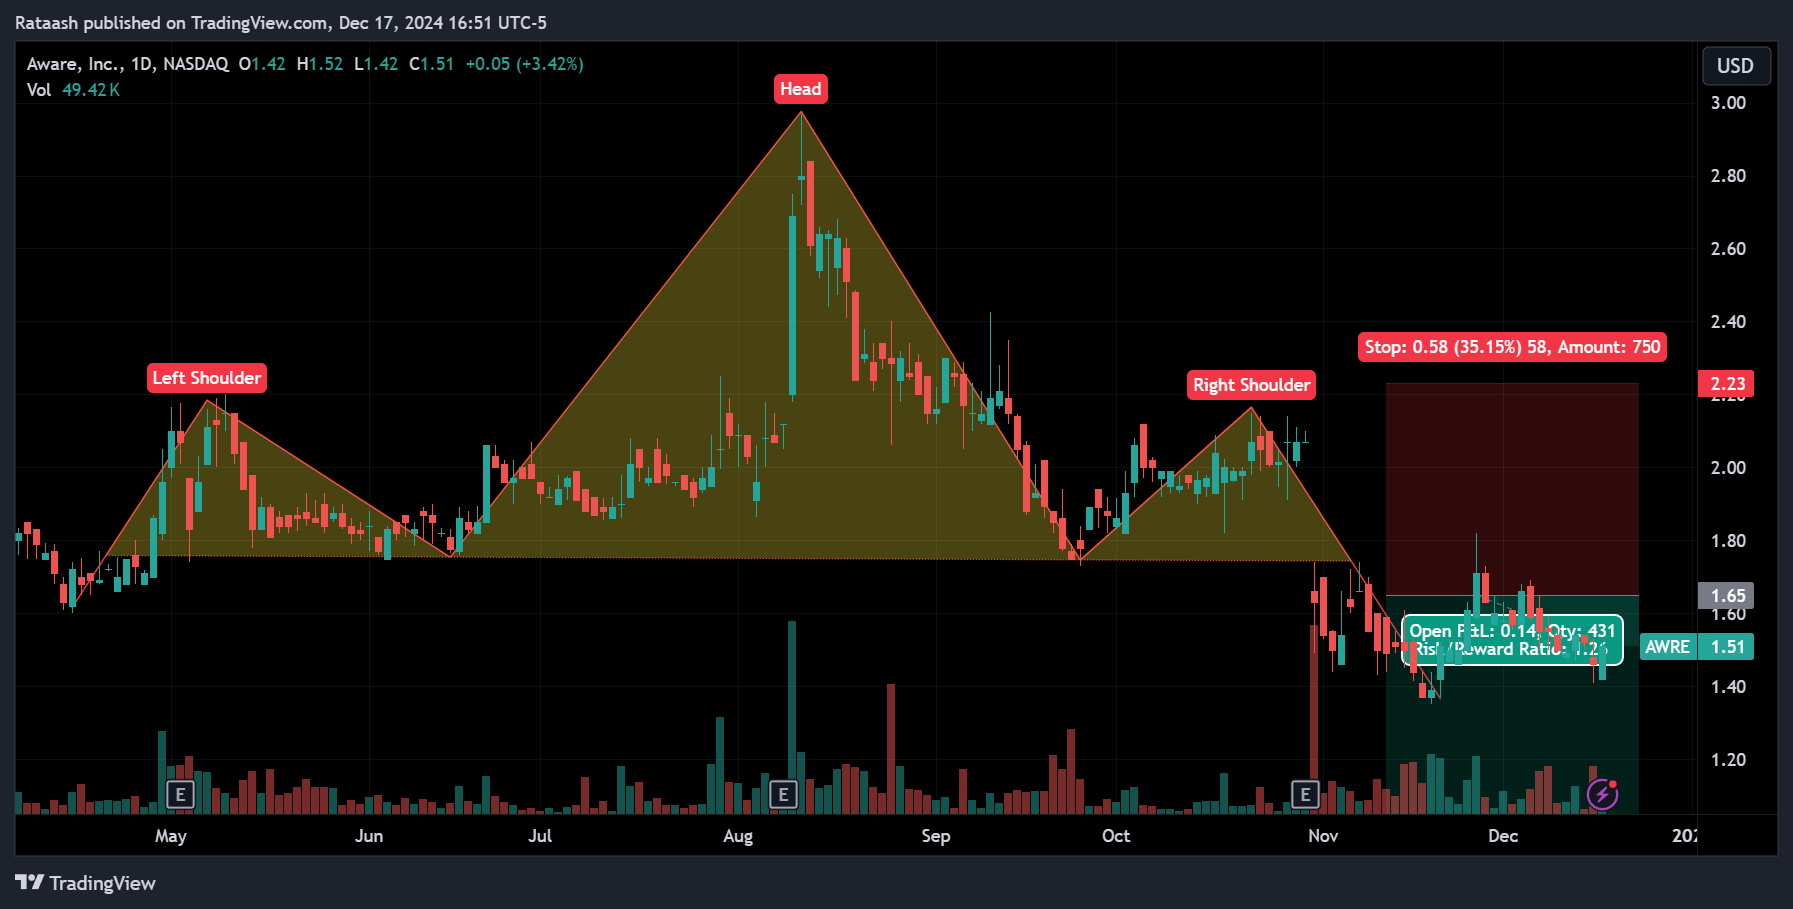
Scenario: You spot a head and shoulders pattern forming after a long uptrend in a popular tech stock.
- Identification:
On the daily chart, you see a peak (left shoulder), a higher peak (head), and a lower peak about equal to the first (right shoulder). The neckline connects the lows between these peaks. - Volume Confirmation:
You notice volume declining as the pattern progresses and then increasing slightly as the price approaches the neckline. - Entry Plan:
You place a sell stop order just below the neckline. When the price breaks the neckline on higher volume, you’re triggered into a short position. - Stop-Loss Placement:
You set your stop a bit above the right shoulder to allow for minor volatility without getting prematurely stopped out. - Take-Profit Target:
You measure the distance from the head to the neckline and project that amount downwards from the neckline. This gives you a logical profit target. - Trade Management:
As the price moves in your favor, you occasionally tighten your stop-loss to lock in profits, ensuring that even if the market reverses, you keep some gains.
This real-world example illustrates how identifying a pattern, confirming it with volume, setting logical entries and exits, and managing risk can lead to a well-structured trade.
Conclusion
Learning to trade chart patterns is both an art and a science. It requires patience, practice, and a solid understanding of market psychology. By starting with the fundamentals of technical analysis, learning the key reversal and continuation patterns, and developing a sound trading strategy that includes proper risk management, you put yourself on the path to becoming a more informed and potentially profitable trader.
Next Steps:
- Practice Identifying Patterns: Start with a demo account and scan charts for common patterns like head and shoulders, double tops/bottoms, and triangles.
- Refine Your Strategy: Experiment with different entry techniques, stop placements, and profit targets to find what works best for you.
- Keep Learning: As you grow more comfortable with basic patterns, explore more complex formations or integrate additional technical indicators to improve your signal quality.
By continually refining your skills, staying disciplined, and focusing on risk management, you can harness the power of chart patterns to enhance your trading decisions and improve your overall success in the financial markets.
