When you first start trading or investing, it’s easy to be overwhelmed by the barrage of metrics and indicators vying for your attention. You might find yourself fixated on a stock’s current price, its chart patterns, or the latest news headlines. Yet there is another key piece of data that is equally important—and often more revealing—than price alone: volume.
Volume, which measures how many shares change hands in a given period, is a fundamental concept that every beginner should understand. Why? Because volume is a window into the level of participation, market sentiment, and liquidity behind any price movement. It offers context that prices alone cannot provide. This comprehensive guide will help you understand what volume is, how it works, the importance of average and relative volume, and how to incorporate volume analysis into your trading and investment decisions.
Table of Contents
Defining Stock Volume

Stock volume refers to the total number of shares of a particular stock that are traded within a given time frame. Typically, this period is one trading day, but investors and analysts also track volume on intraday, weekly, monthly, or even yearly intervals.
Key aspects to understand about volume:
- Indication of Activity: Volume quantifies how actively a stock is being bought and sold. Higher volume means more trading activity, while lower volume suggests reduced interest.
- Universal Metric: Volume data is readily available on almost all trading platforms, financial news websites, and brokerage apps, making it accessible and easy to use even for beginners.
How Stock Volume Is Measured
Measuring volume is straightforward. Every time a transaction takes place—meaning a buyer and a seller agree on a price—those shares add to the total volume tally. By the end of the trading day, the sum of all shares traded gives you the daily volume figure.
Details on measuring volume:
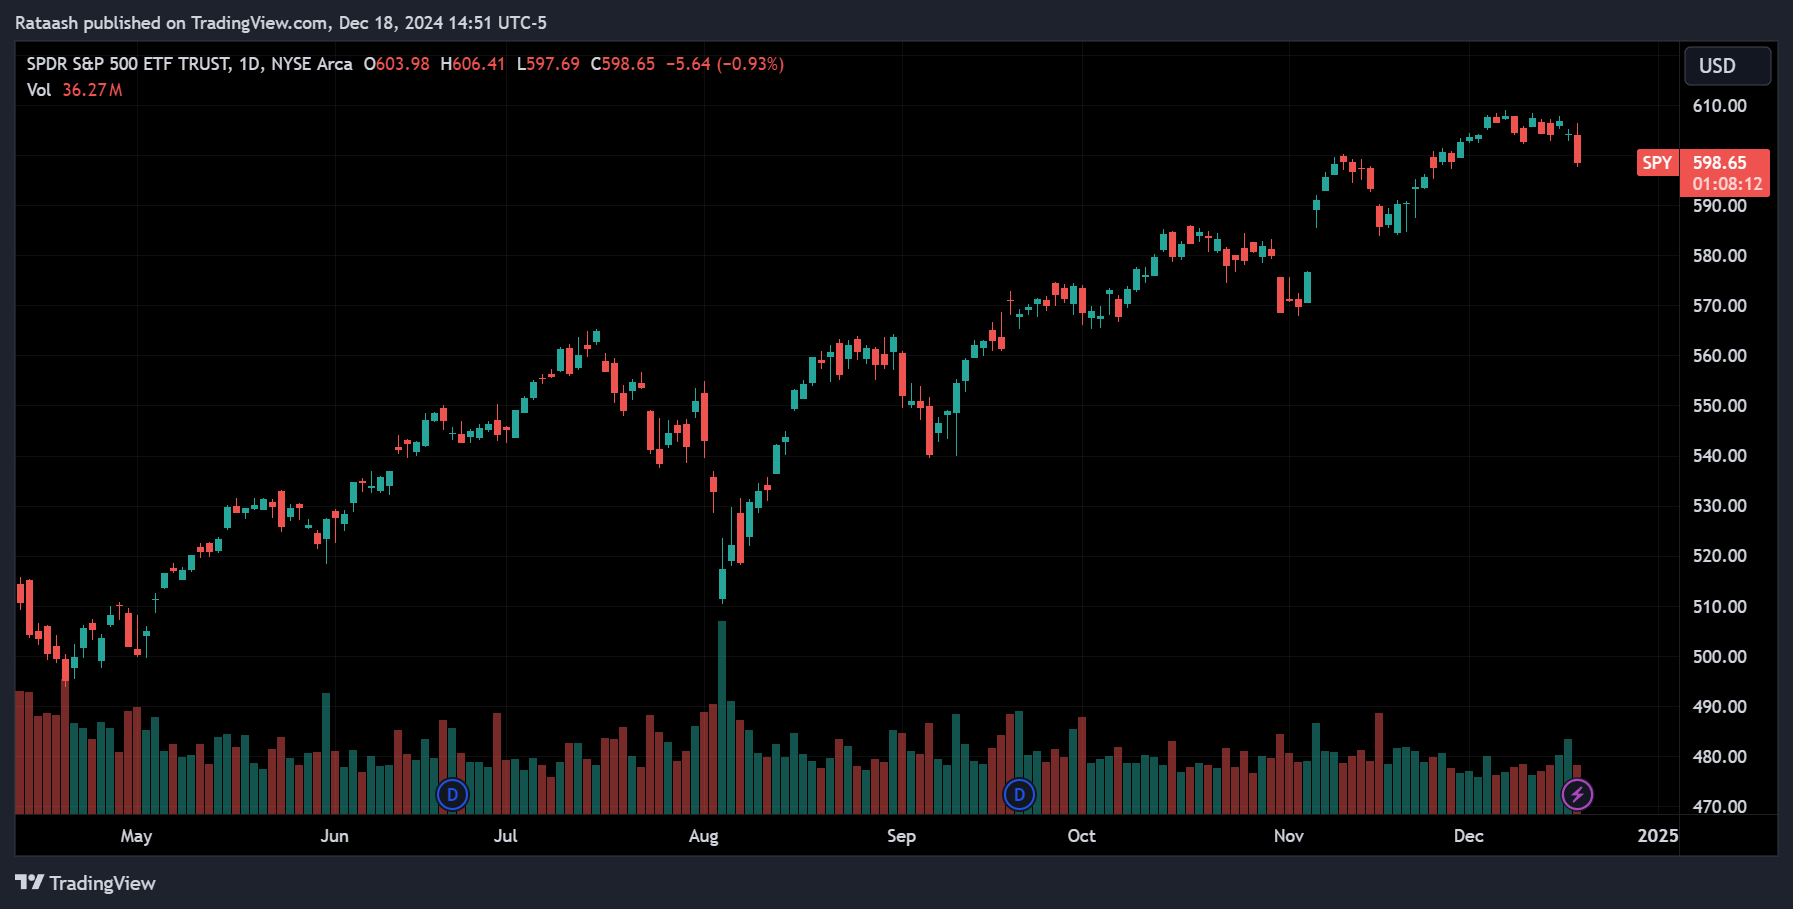
- Continuous Updates: Volume updates dynamically throughout the trading day. Traders often use volume bars on intraday charts to understand how much trading activity occurs during specific intervals (e.g., each minute or hour).
- Exchange-Level Data: The volume data primarily comes from the exchanges where the stock is listed. Real-time or delayed data feeds show traders how volume accumulates over time.
- Historical Perspective: Historical volume data can be retrieved easily, allowing investors to compare current trading activity with past norms.
Why Volume Matters in the Stock Market

While price tells you “what” is happening, volume can help explain “how” and “why.” It provides context that can validate or challenge what price action seems to indicate.
Reasons why volume matters:
- Trend Confirmation: Volume can confirm the strength of a price trend. For instance, a rising price accompanied by high volume suggests genuine market enthusiasm, whereas a price rise on weak volume may be suspect.
- Market Sentiment Gauge: If a stock experiences a significant news event, earnings release, or product announcement, increased volume often indicates heightened interest—both from buyers who see opportunity and sellers who may be taking profits or cutting losses.
- Better Decision-Making: Incorporating volume analysis helps traders and investors make more informed decisions about when to enter or exit positions, or whether a price move is likely to be sustainable.
The Relationship Between Volume and Price
Price and volume move hand-in-hand, forming the backbone of stock market analysis. Understanding their relationship provides traders and investors with valuable insights into market behavior.
Common volume-price patterns include:
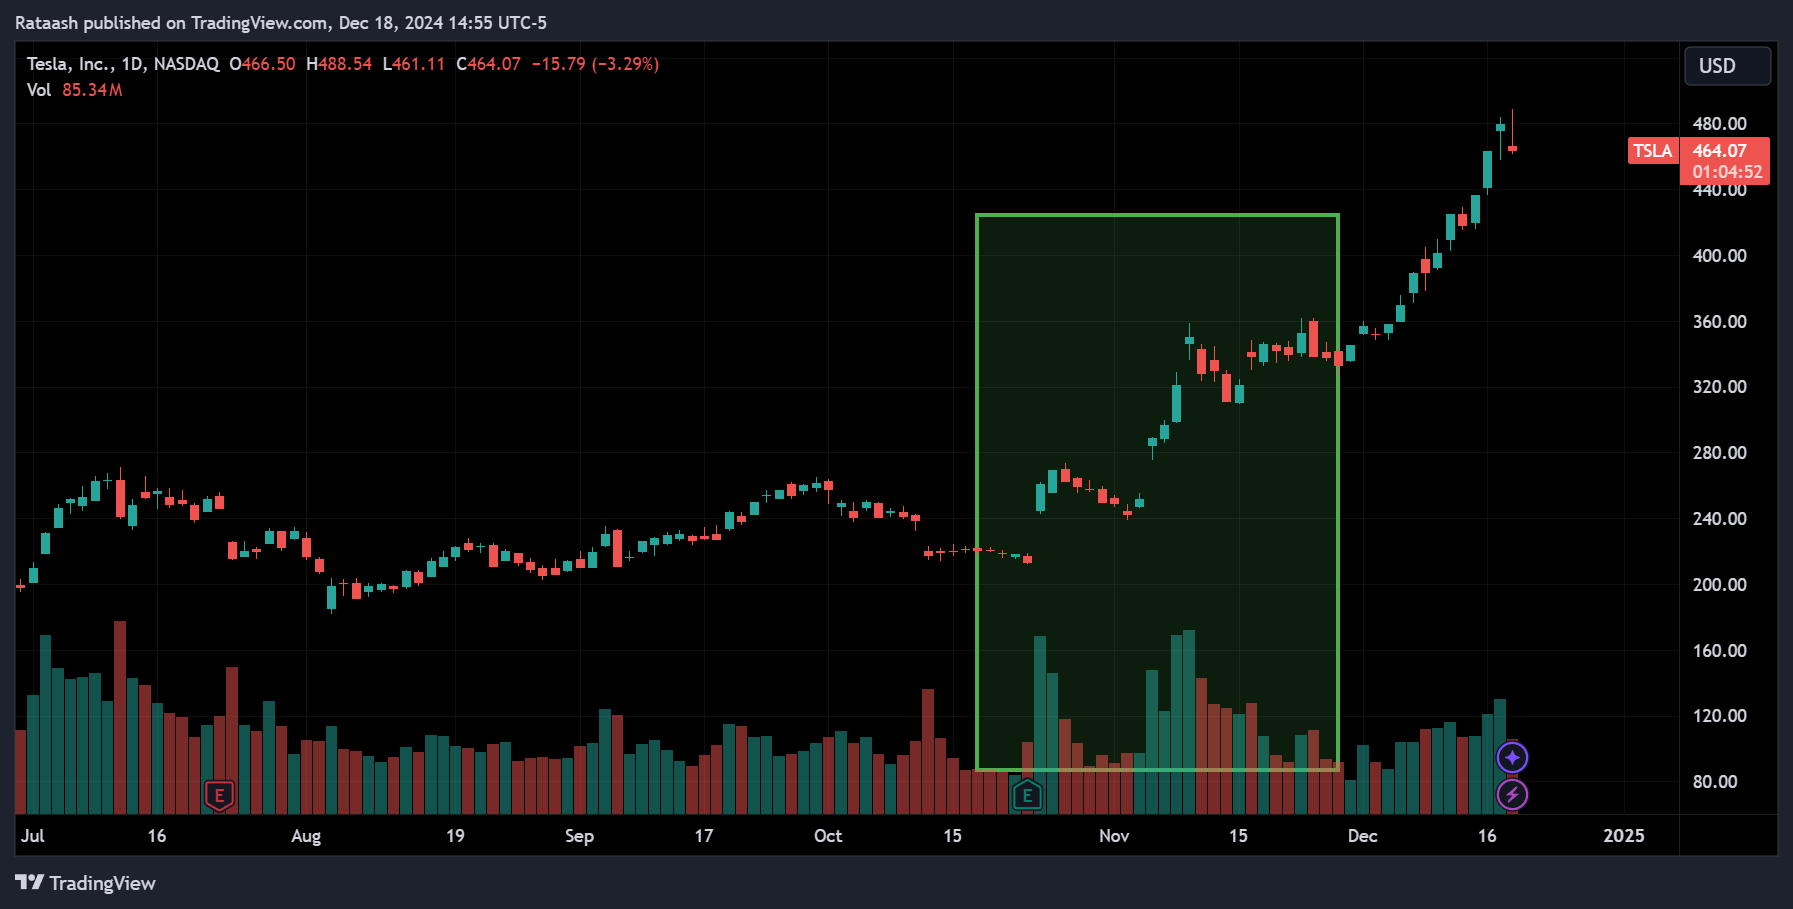
Rising Price, Rising Volume: Indicates strong buying interest, reinforcing a bullish trend.
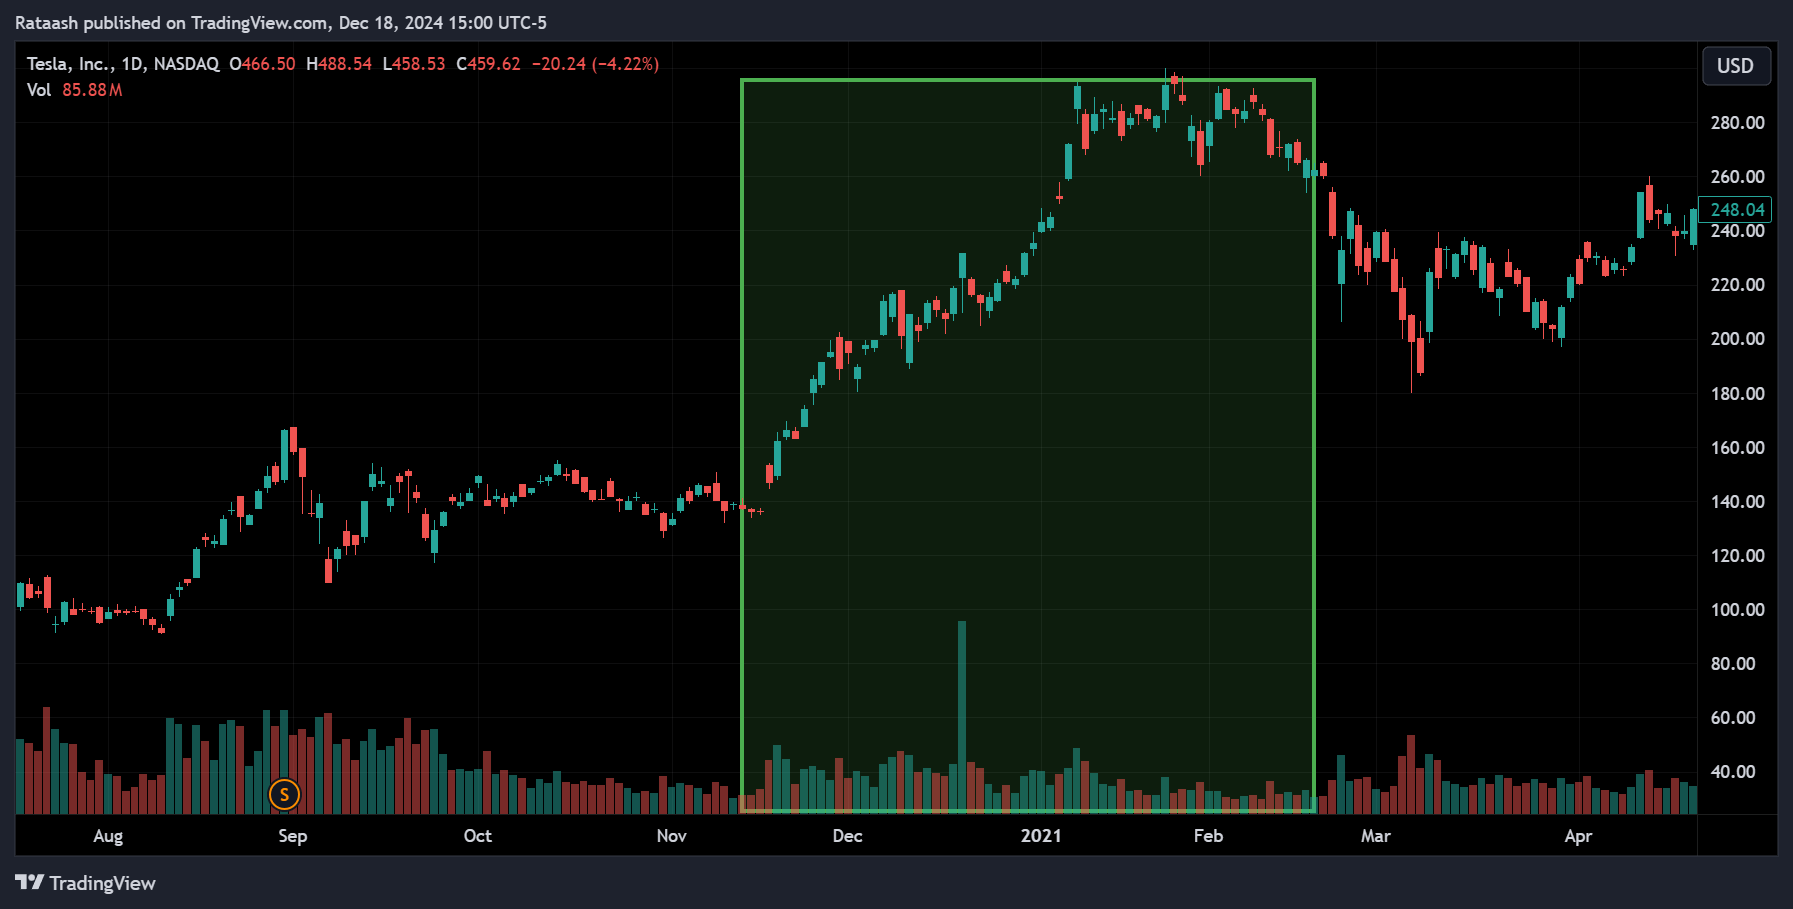
Rising Price, Falling Volume: Suggests weakening momentum; fewer participants are willing to buy at higher prices.
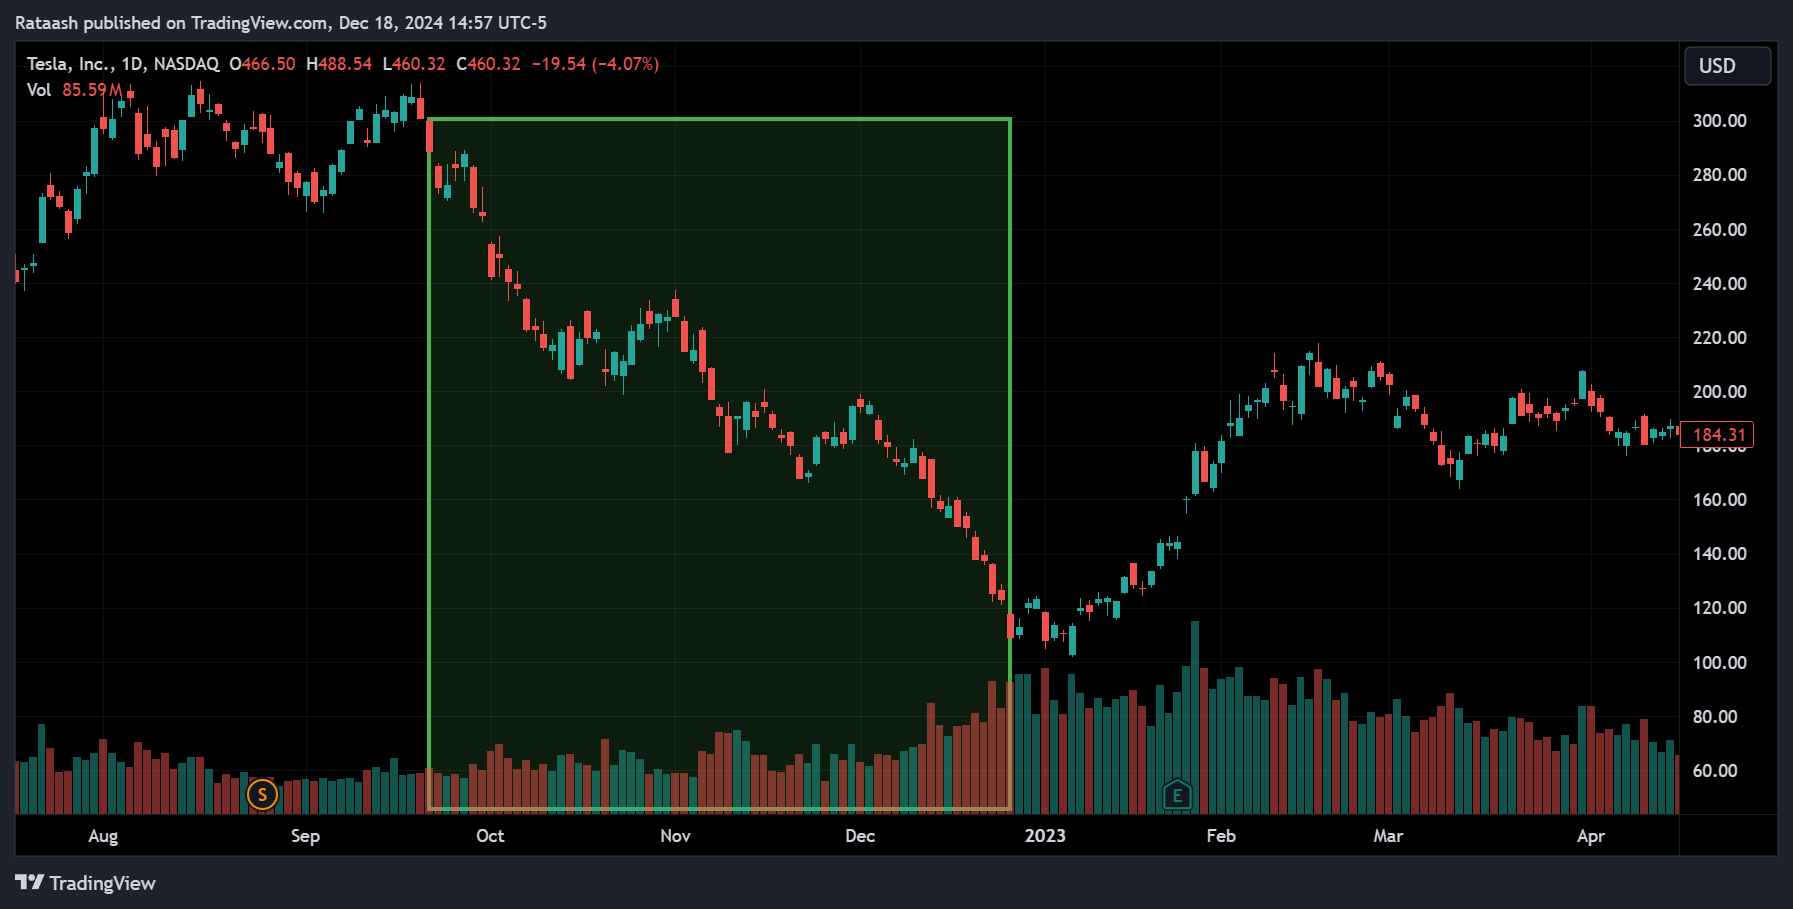
Falling Price, Rising Volume: Often a sign of strong selling pressure or panic selling, implying a robust bearish sentiment.
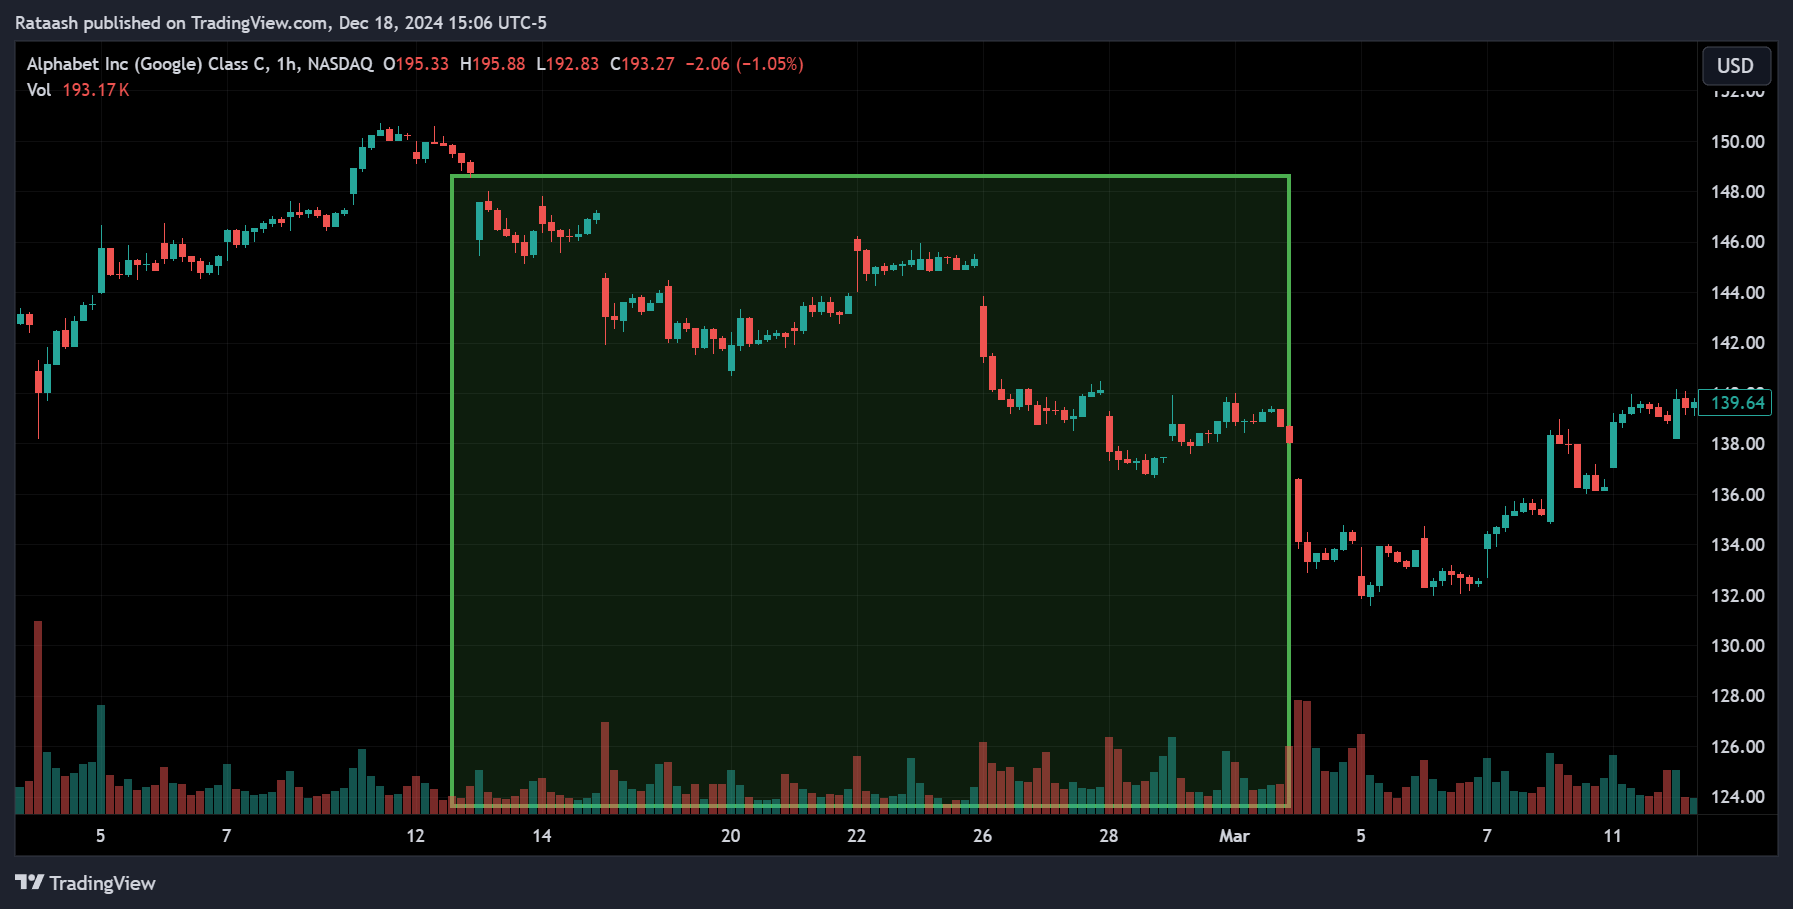
Falling Price, Falling Volume: May mean selling interest is subsiding, potentially signaling a pause or even a reversal if buyers step back in.
How Volume Influences Market Liquidity
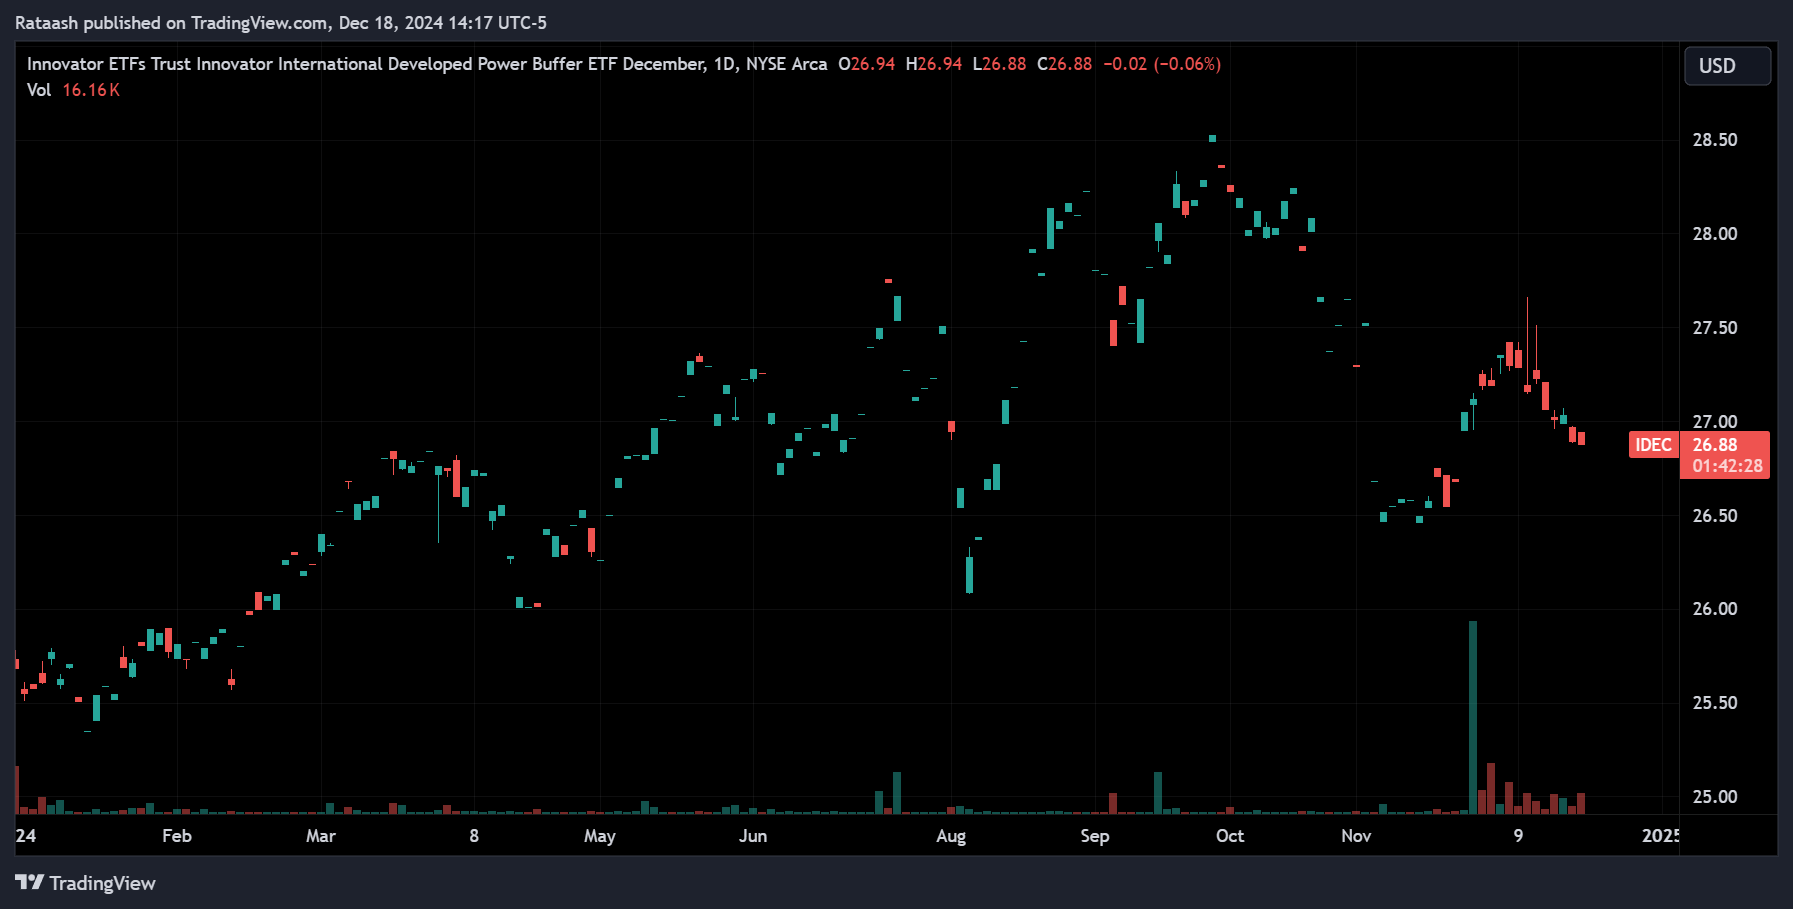
Liquidity refers to how easily you can buy or sell an asset without causing large price swings. High-volume stocks tend to be more liquid, making it easier for traders to enter and exit positions quickly and at prices close to their desired levels.
Key liquidity points:
- Efficient Transactions: High-volume environments mean more buyers and sellers are present, which typically results in tighter bid-ask spreads and less price slippage.
- Stable Pricing: Heavily traded stocks usually exhibit more stable, predictable price movements than thinly traded ones.
- Reduced Execution Risk: Traders dealing in large share quantities find it easier to execute their orders in high-volume stocks without adversely impacting the market price.
Using Volume for Technical Analysis
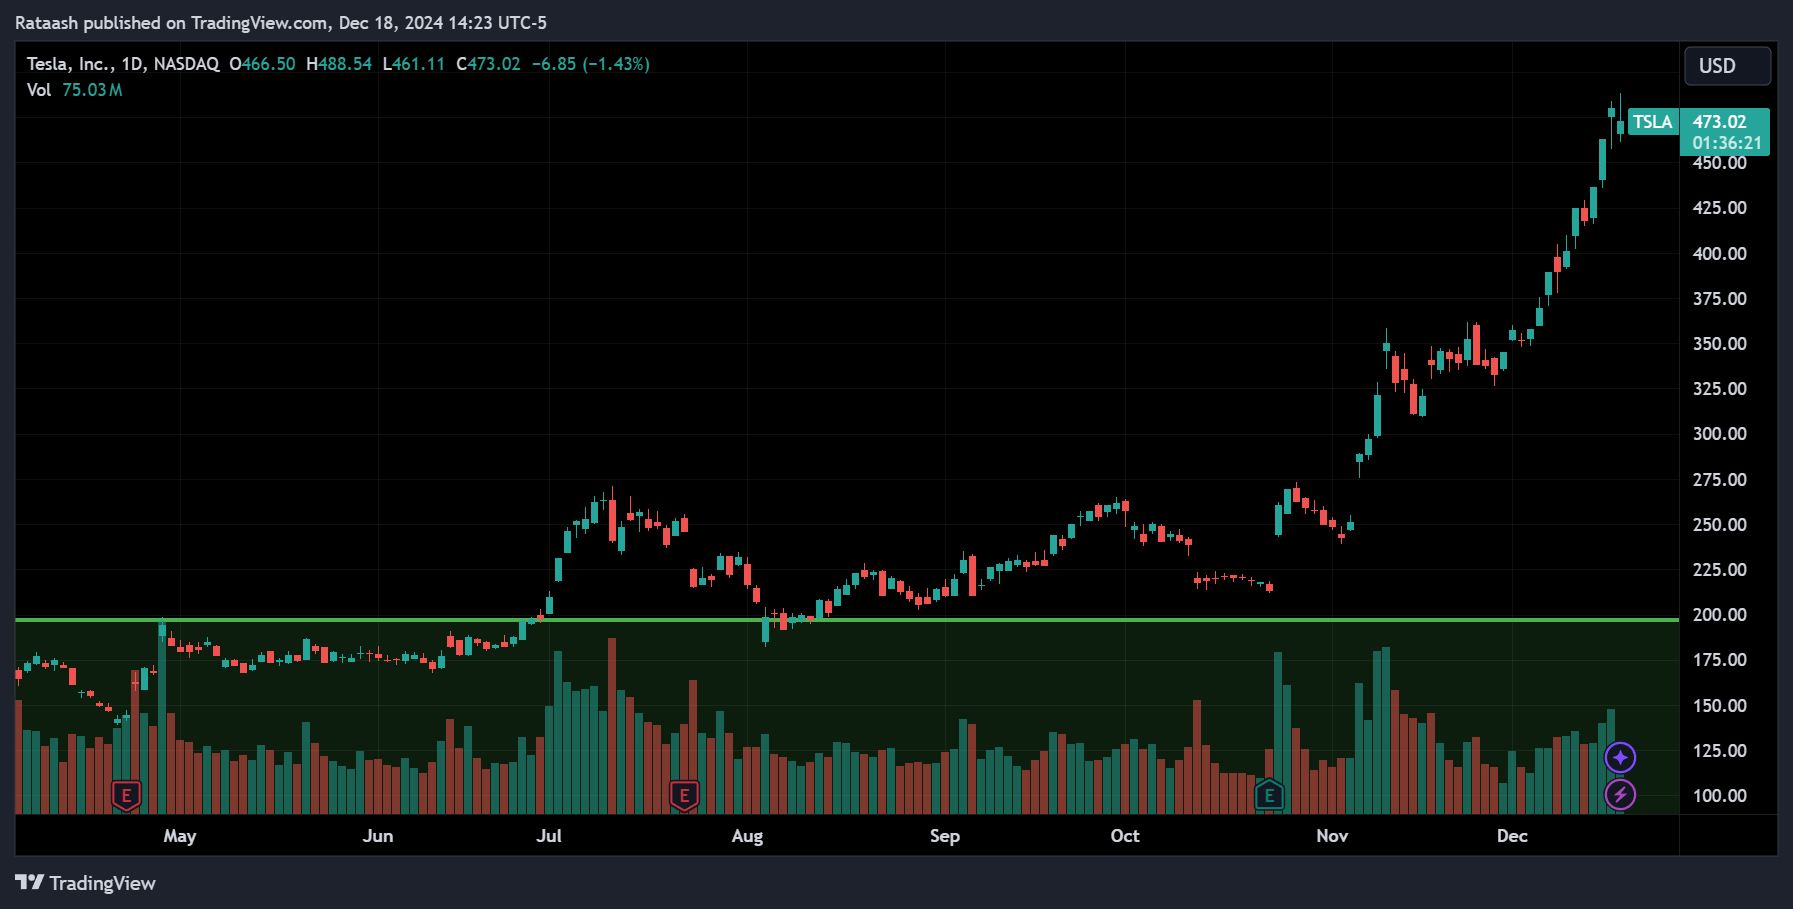
Technical analysis focuses on past price and volume data to forecast future price movements. Volume is an integral part of this approach, helping analysts verify patterns and assess the likelihood of trend continuation or reversal.
How technical analysts use volume:
- Pattern Validation: Chart patterns like breakouts, double bottoms, and head-and-shoulders formations gain credibility when accompanied by high volume.
- Support and Resistance: Areas on a chart where volume spikes often correspond to strong support (where buyers step in) or resistance (where sellers emerge).
- Divergence Signals: A price making new highs on declining volume can indicate weak buyer interest, potentially signaling a future reversal.
Volume Indicators You Should Know
Several indicators incorporate volume data into their calculations, providing traders with valuable tools to analyze market trends and make informed decisions. These indicators simplify complex volume patterns, translating raw data into actionable insights that can be used to identify potential opportunities, confirm trends, or signal reversals.
Common volume-based indicators:
On-Balance Volume (OBV):
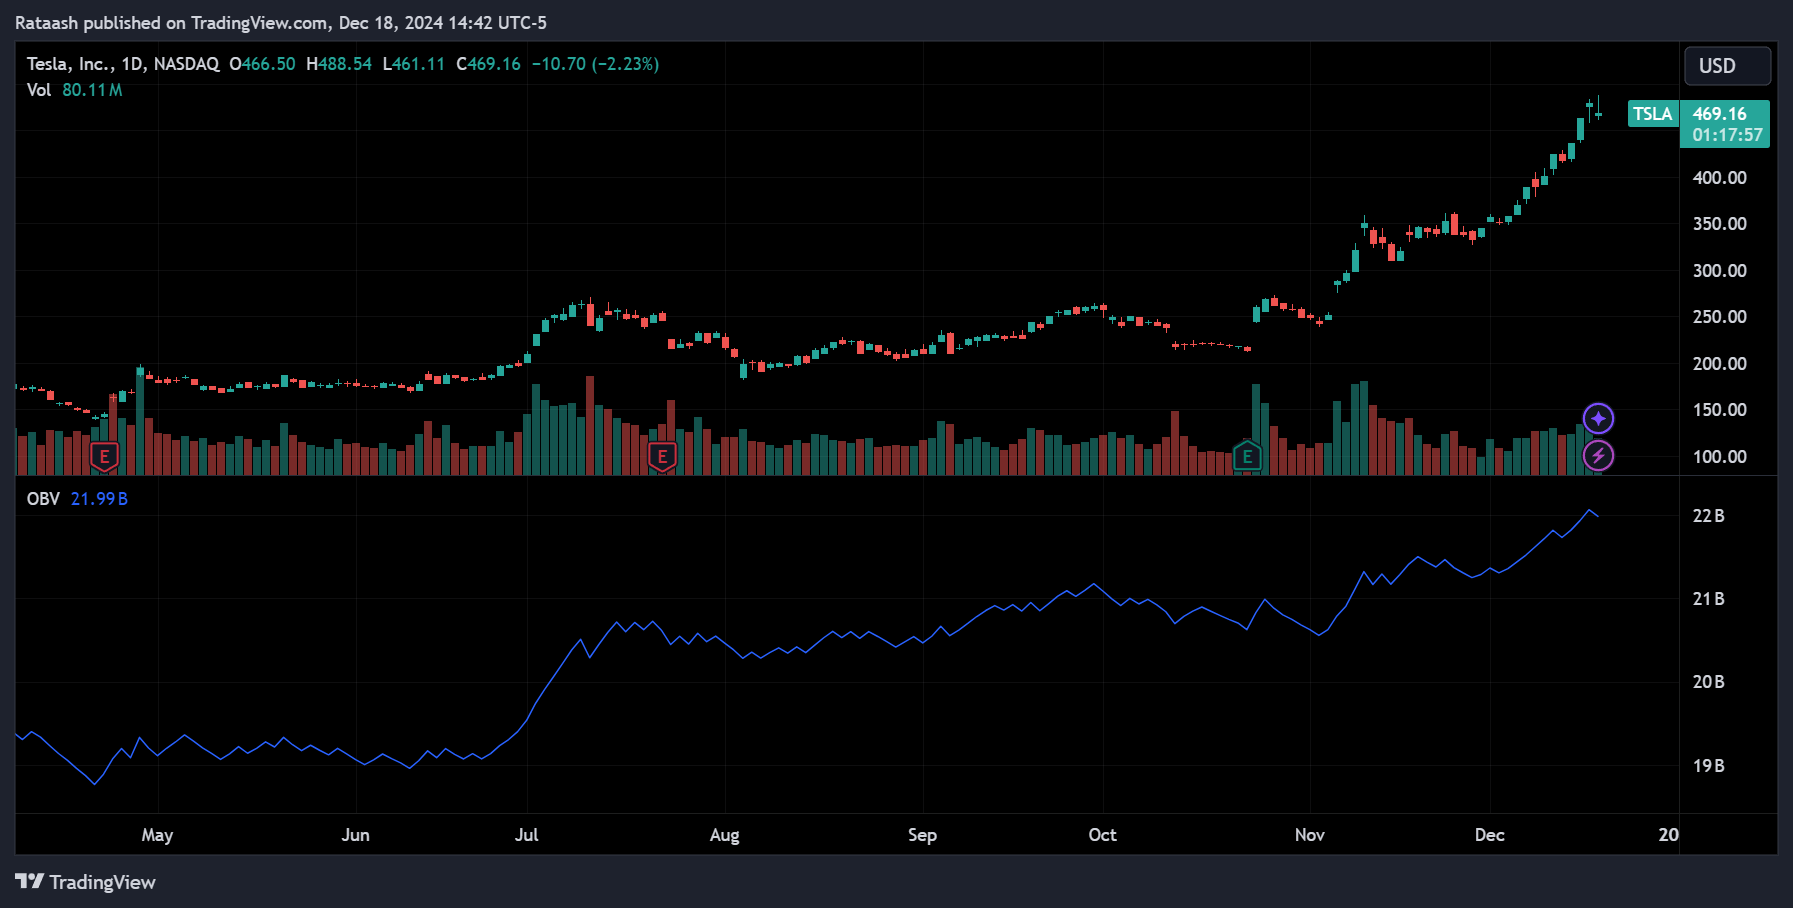
- What It Is: OBV adds volume on days the stock closes higher and subtracts volume on days it closes lower, creating a cumulative measure of buying and selling pressure.
- How It’s Used: Rising OBV alongside flat or falling price can signal that buyers are accumulating shares before a possible price breakout.
Volume-Weighted Average Price (VWAP):
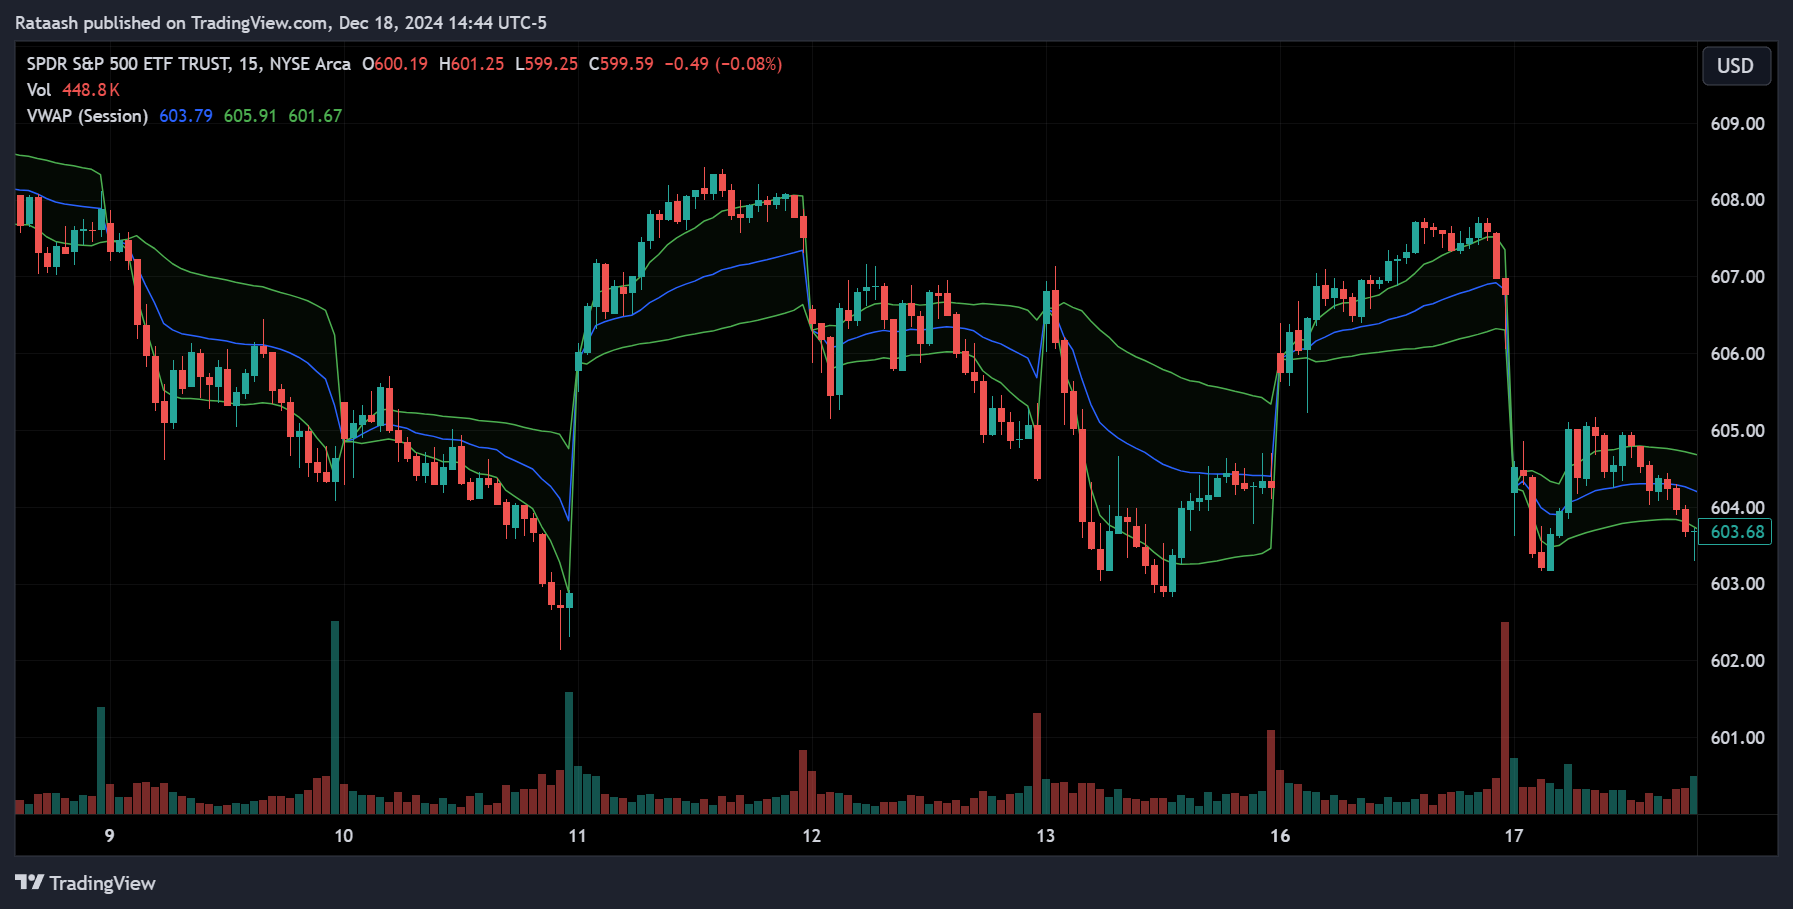
- What It Is: VWAP calculates the average price of a stock over a trading session, weighted by volume.
- How It’s Used: Traders compare the current price to VWAP. If the price is above VWAP, the stock is trading above the average price paid by most buyers that day, which can be considered bullish. Below VWAP might be bearish.
Volume Moving Averages:
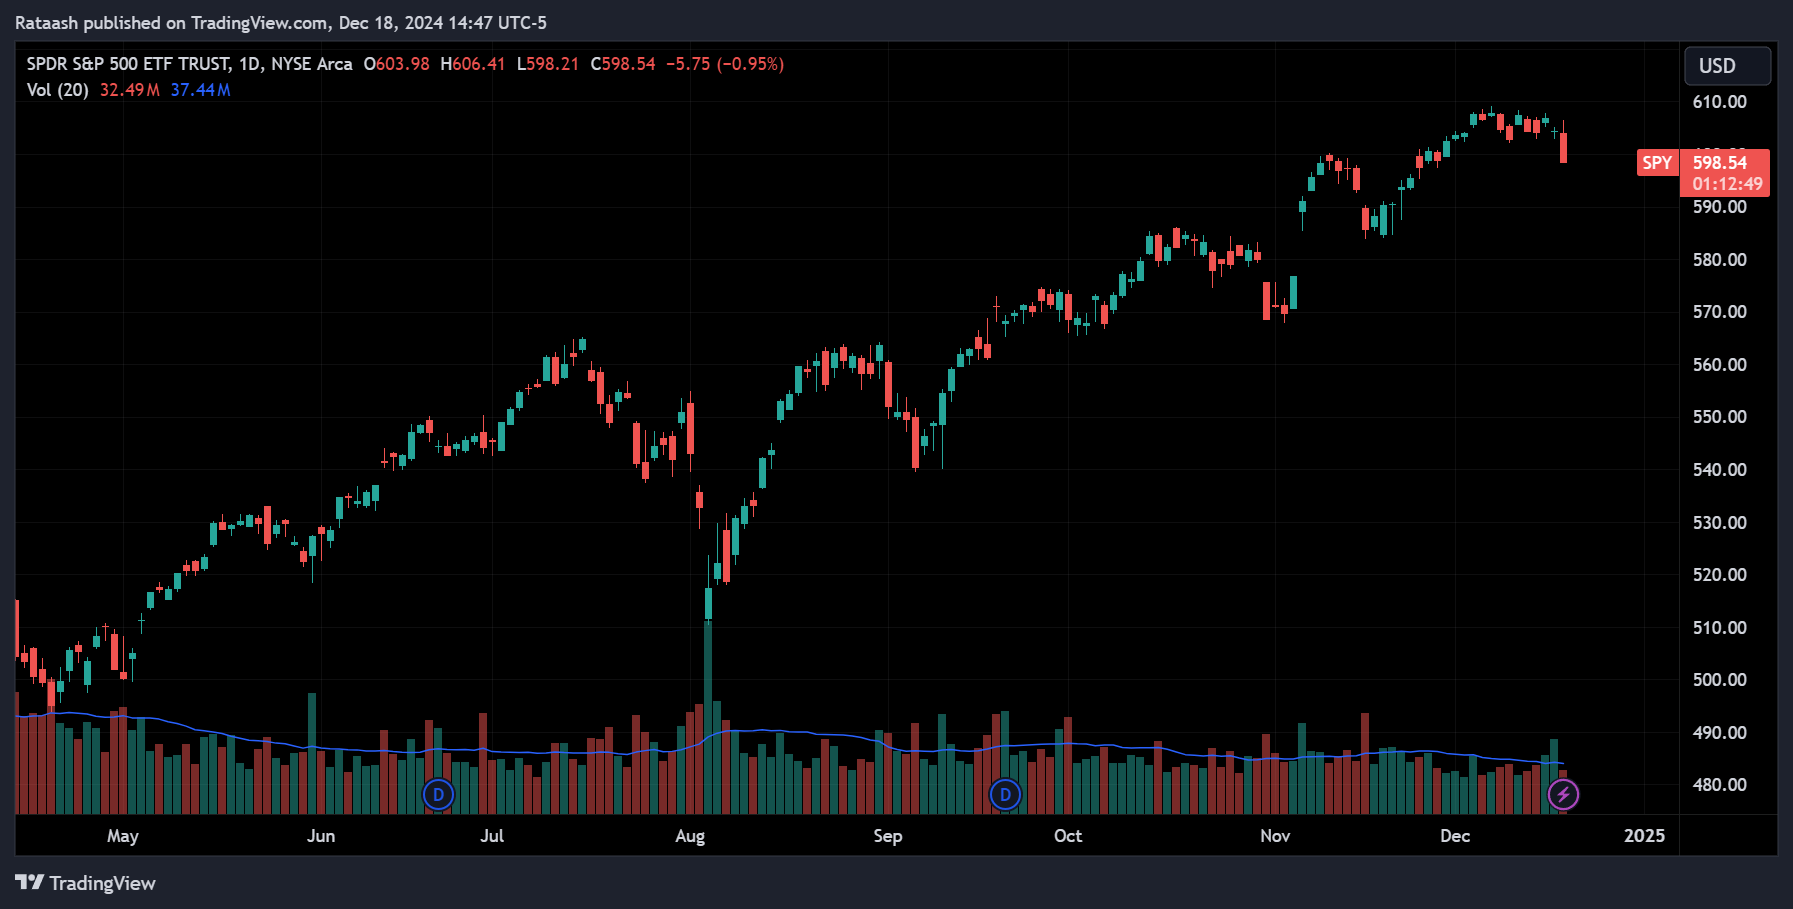
- What It Is: Similar to price moving averages, volume moving averages smooth out daily fluctuations to show long-term volume trends.
- How It’s Used: Consistently above-average volume can signal heightened interest and potentially strong trends, while below-average volume may point to low market participation.
Chaikin Money Flow (CMF):
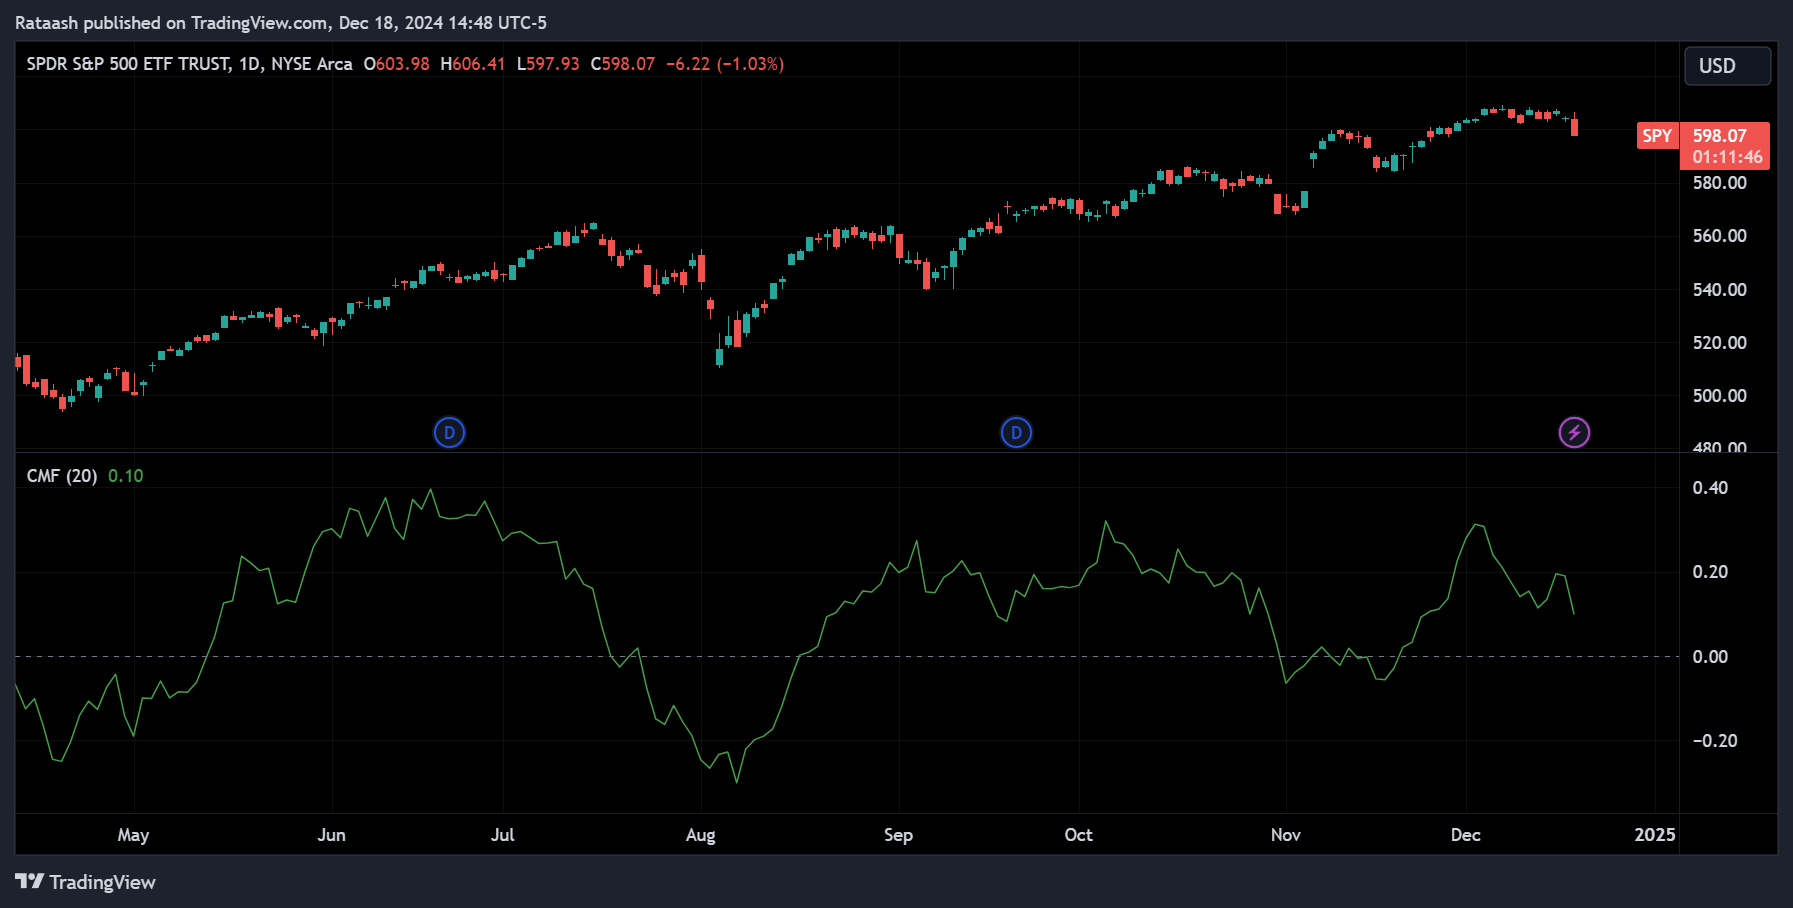
- What It Is: CMF uses both price and volume to determine the accumulation or distribution of a stock.
- How It’s Used: Positive CMF values indicate buying pressure (accumulation), whereas negative readings suggest selling pressure (distribution).
Understanding Average and Relative Volume
While daily volume data is helpful, it’s often even more useful to compare current trading activity to historical norms. This is where average volume and relative volume come into play.
Average Volume:
- Definition: Average volume is the average number of shares traded over a specified period, commonly 30 days. For example, a stock might have a 30-day average daily volume (ADV) of 2 million shares.
- Significance: Knowing the average volume helps you identify whether the current day’s trading activity is unusually high or low. If today’s volume hits 4 million shares, double the 2 million average, it signals heightened interest or significant news driving participation.
- How to Use It: Compare the current session’s volume to the stock’s average volume. If volume today is substantially higher than average, the move (up or down) may carry more conviction. If it’s lower, it suggests a lack of interest, making any price movement less reliable.
Relative Volume (RVOL):
- Definition: Relative Volume measures current trading volume against a predefined average, often the average volume over a similar time period. RVOL is typically expressed as a ratio or multiplier.
- Significance: An RVOL above 1.0 means the stock is currently trading at higher volume than usual. For instance, an RVOL of 2.0 indicates the stock’s volume is twice its normal level. This can be an early sign that something significant is happening—a major news event, earnings release, or a sudden surge in market interest.
- How to Use It: Traders often scan for stocks with high RVOL to find potential trading opportunities. A sudden spike in relative volume could mean the stock is about to break out of a range, reverse a trend, or move aggressively in reaction to news.
Integrating Average and Relative Volume:
- Contextual Decision-Making: By looking at average and relative volumes, you get immediate context for the day’s activity. If the price is moving sharply but volume is at or below average, be cautious—it might be a false move. Conversely, a strong price move with much higher than average or above-normal relative volume could suggest a more sustainable trend.
- Filtering Trade Ideas: Investors and traders often use scanners or filters that require a certain relative volume threshold. For example, they might only consider stocks for day trading that have an RVOL of 1.5 or higher, ensuring they focus on genuinely active and potentially profitable situations.
Interpreting Volume in Different Market Conditions

Market conditions vary, and volume behavior can differ notably depending on whether you’re in a bullish, bearish, or sideways market.
Market conditions and what volume might mean:
- Bull Markets:
- In a strong bull run, volume typically rises during rallies as new buyers flock in. During mild pullbacks, volume often tapers off, suggesting that selling pressure is not overwhelming and that the uptrend may continue.
- Bear Markets:
- In downtrends, volume can spike on sell-offs as investors capitulate. If rallies occur on low volume, it could indicate that the bounce is driven by short-covering rather than genuine buyer interest, keeping the bearish bias intact.
- Sideways or Range-Bound Markets:
- Within a trading range, volume often remains moderate or stable. A breakout from the range on significantly higher-than-average or high relative volume is more likely to be meaningful, as it indicates strong conviction among either buyers (in an upside breakout) or sellers (in a downside breakout).
- Earnings Season and News Events:
- Major corporate announcements, earnings releases, or macroeconomic news can cause volume to spike well above the stock’s average volume. This jump in relative volume helps traders distinguish between routine trading and events that truly shift market sentiment.
How Beginners Can Start Using Volume to Make Better Decisions

For newcomers, volume might seem like a complex addition to their trading toolkit. However, focusing on a few simple steps can make it easy to start leveraging volume effectively.
Practical steps for beginners:
- Combine Price and Volume:
Always assess volume in conjunction with price. Does the price rise on robust volume or trickle higher on weak activity? Is a pullback attracting strong selling volume or just minor profit-taking? - Use Average Volume for Context:
Compare the current day’s volume to the average daily volume. If today’s activity is unusually high, pay attention—something important may be unfolding. - Monitor Relative Volume:
Relative Volume indicators or scans can quickly highlight which stocks are experiencing abnormal trading activity. This can help you focus on more promising setups. - Look for Breakouts with Volume Confirmation:
When a stock breaks out of a price pattern, confirm the validity of the move by checking whether volume surges above its recent averages. A high-volume breakout is more likely to hold than a low-volume one. - Start Simple with Indicators:
Begin by using a simple volume moving average or an OBV line. As you grow more comfortable, consider adding VWAP or relative volume indicators to refine your analysis further.
Real-World Examples of Using Volume Analysis
Example 1: Breakout Confirmation with Average Volume
Imagine a stock trading between $50 and $55 for a month. It repeatedly fails to move above $55. One day, it breaks through $55 on volume that’s double the 30-day average. This heightened volume suggests genuine buying interest, confirming the breakout. A trader might see this as a strong signal to enter a long position.
Example 2: Relative Volume Spikes on Earnings
Suppose a company reports better-than-expected earnings. The stock opens the next morning trading at three times its average volume (RVOL = 3.0). This sudden spike in relative volume and a strong price rally signal that many investors are rushing in to buy. Recognizing this, a day trader might capitalize on the intraday volatility, or a swing trader might hold the position in anticipation of a sustained move.
Common Mistakes Beginners Make with Volume
1. Ignoring Volume Entirely:
Some beginners focus only on price, missing the valuable context volume provides. This can lead to misinterpreting price moves that lack broader market participation.
2. Misreading Volume Spikes:
Not all volume spikes are meaningful. Sometimes, a large block trade or a single institutional order can temporarily boost volume without reflecting wider market sentiment. Always consider the bigger picture, including news events and chart patterns.
3. Overlooking the Role of Average and Relative Volume:
Failing to consider whether today’s volume is unusual can cause you to miss out on significant clues. A price move on average or below-average volume may be less reliable than one backed by a dramatic increase in volume.
4. Relying on Volume Alone:
Volume is a powerful tool, but it works best when combined with other forms of analysis—fundamental research, technical indicators, and risk management practices. Don’t assume that volume alone can guarantee profits.
Frequently Asked Questions About Stock Volume
1. Is higher volume always better?
Not necessarily. Higher volume often provides better liquidity and more reliable price moves, but it doesn’t automatically mean the stock will move in your favor. Always analyze volume in the context of price, trend, and news.
2. Can volume predict future price movements?
Volume doesn’t “predict” price direction. Instead, it offers clues about market participation and conviction. By reading volume trends, you can gauge whether current price moves are likely to continue or fade.
3. What’s the importance of average and relative volume?
Average volume provides a baseline for what’s “normal” for a stock. Relative volume shows how current activity compares to that norm. Using both can help you quickly identify when a stock’s trading activity is unusual, suggesting significant market interest and potential trading opportunities.
4. How do institutional investors use volume?
Institutions pay close attention to volume because they often deal with large orders. High-volume environments enable them to enter and exit large positions with minimal market impact. They might also use VWAP or average volume metrics as execution benchmarks.
5. Does volume matter in all financial markets?
Yes. While this guide focuses on stocks, volume is also critical in markets for ETFs, options, futures, commodities, and cryptocurrencies. In each arena, volume offers insights into liquidity, participation, and market sentiment.
Conclusion
Volume is far more than just a number at the bottom of your chart. It’s a dynamic measure of how many shares are trading hands, reflecting real-time interest and participation in a stock. By understanding stock volume—and going a step further to consider average and relative volume—you gain a clearer picture of whether a price move is robust, how liquid a market is, and if other traders are confirming your reading of the market.
For beginners, integrating volume analysis into your trading and investing approach can dramatically improve your market understanding. It helps you separate genuine opportunities from false signals, confirm breakouts, identify trend strengths or weaknesses, and better time entries and exits.
As with any tool, volume analysis is most effective when combined with a well-rounded strategy. Complement it with fundamental research, other technical indicators, and sound risk management. Over time, as you become more comfortable interpreting volume metrics, you’ll find it an invaluable resource—empowering you to make smarter, more confident decisions in the ever-evolving world of the stock market.
