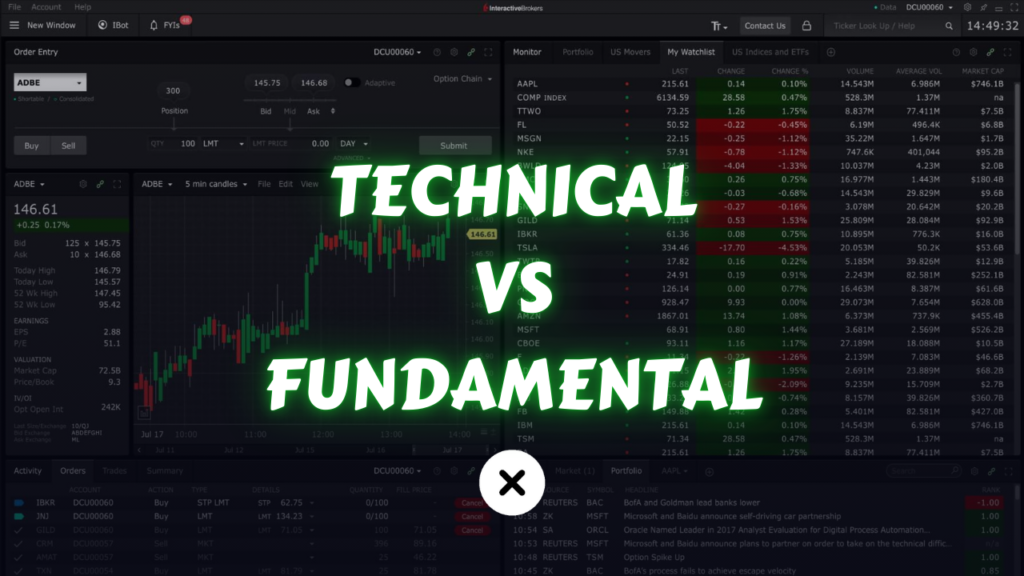
Investing in stocks can be highly rewarding, but mastering the market requires a solid understanding of the tools and methods used to make informed decisions. Among the most widely adopted strategies are Technical Analysis and Fundamental Analysis—two distinct approaches that offer unique insights into stock valuation and trading. While Technical Analysis focuses on price trends and patterns, Fundamental Analysis delves into a company’s financial health and market potential, catering to different types of investors and strategies.
In this comprehensive guide, we’ll take a closer look at Technical Analysis vs Fundamental Analysis as they apply to stocks. We’ll explore their principles, tools, advantages, and limitations in detail, helping you determine which approach aligns with your investment goals—or whether combining both could maximize your success.
What Is Technical Analysis for Stocks?
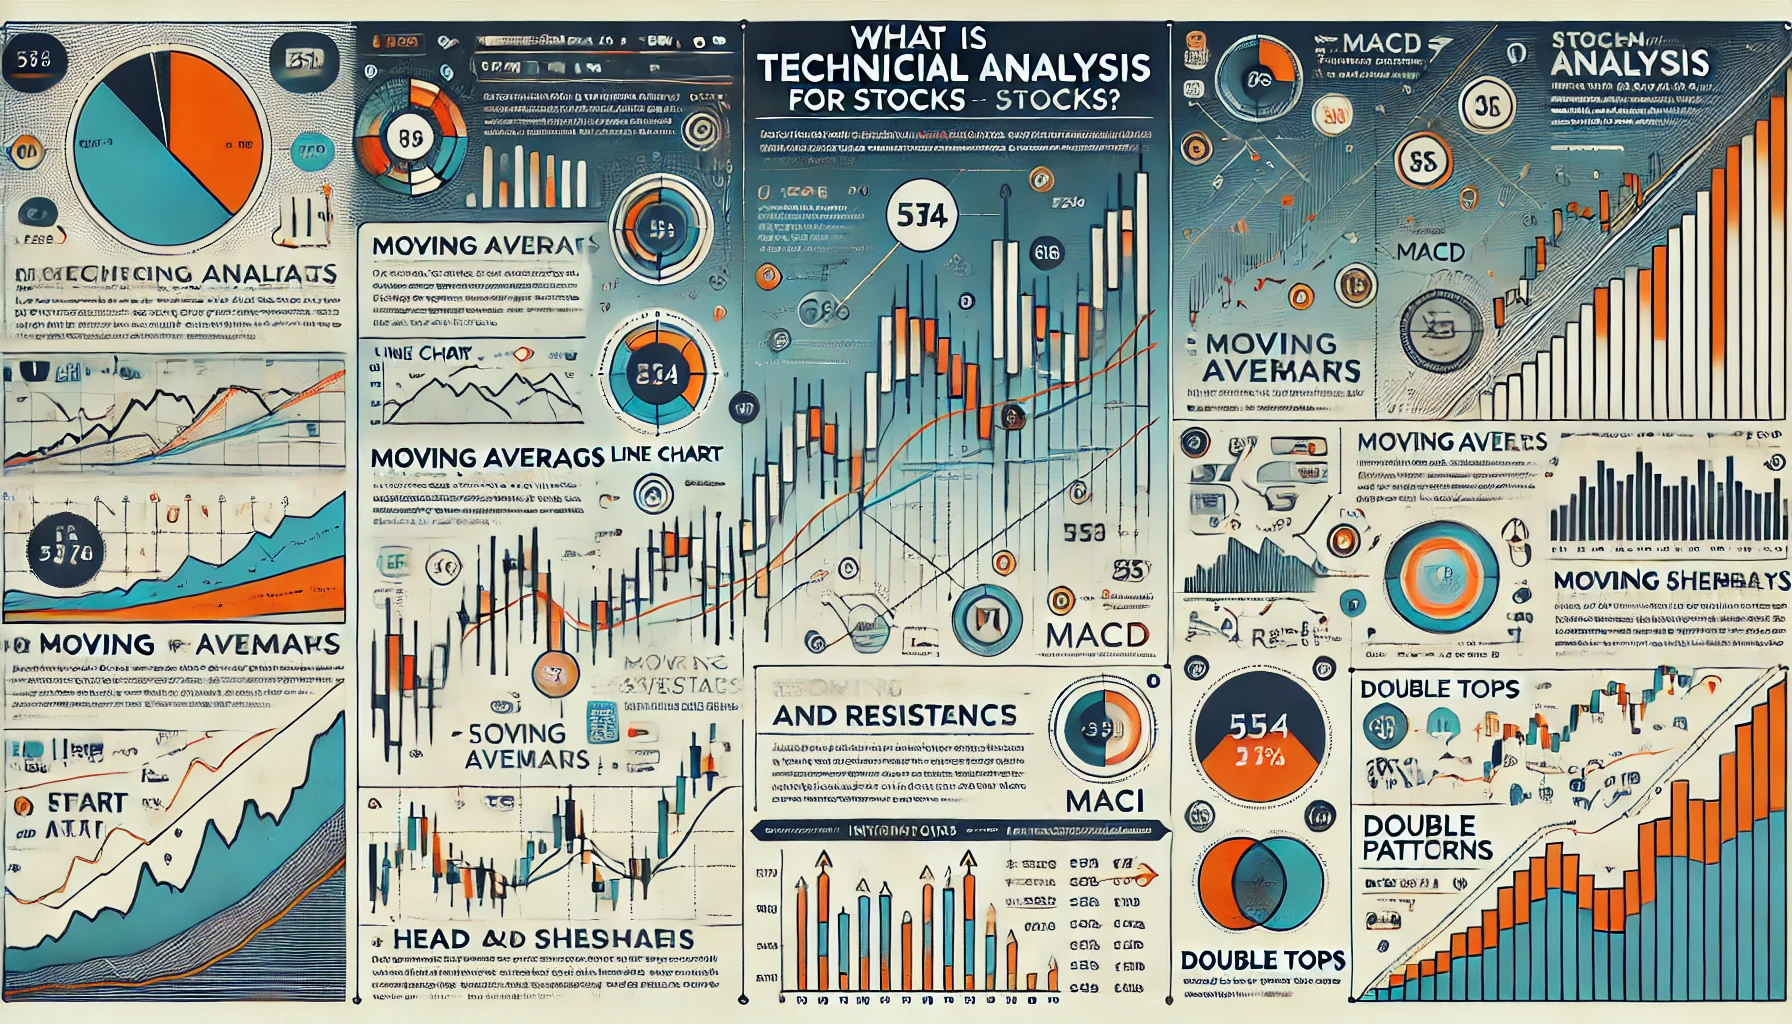
Technical analysis involves studying historical price movements, volume data, and chart patterns to predict future stock prices. It is based on the premise that price reflects all available information, and that patterns in stock price movements tend to repeat due to consistent market psychology.
Technical analysis is particularly popular among traders seeking short- to medium-term gains.
Core Principles of Technical Analysis
- Market Efficiency: Technical analysts believe that the market discounts all publicly available information, meaning price movements already account for external factors like earnings reports and economic data.
- Price Trends: Stocks tend to move in identifiable trends—either upward (bullish), downward (bearish), or sideways (neutral).
- Historical Patterns Repeat: Market psychology leads to recurring price patterns and behavior, making past data a valuable predictor of future performance.
Key Components of Technical Analysis for Stocks
1. Charts and Price Action
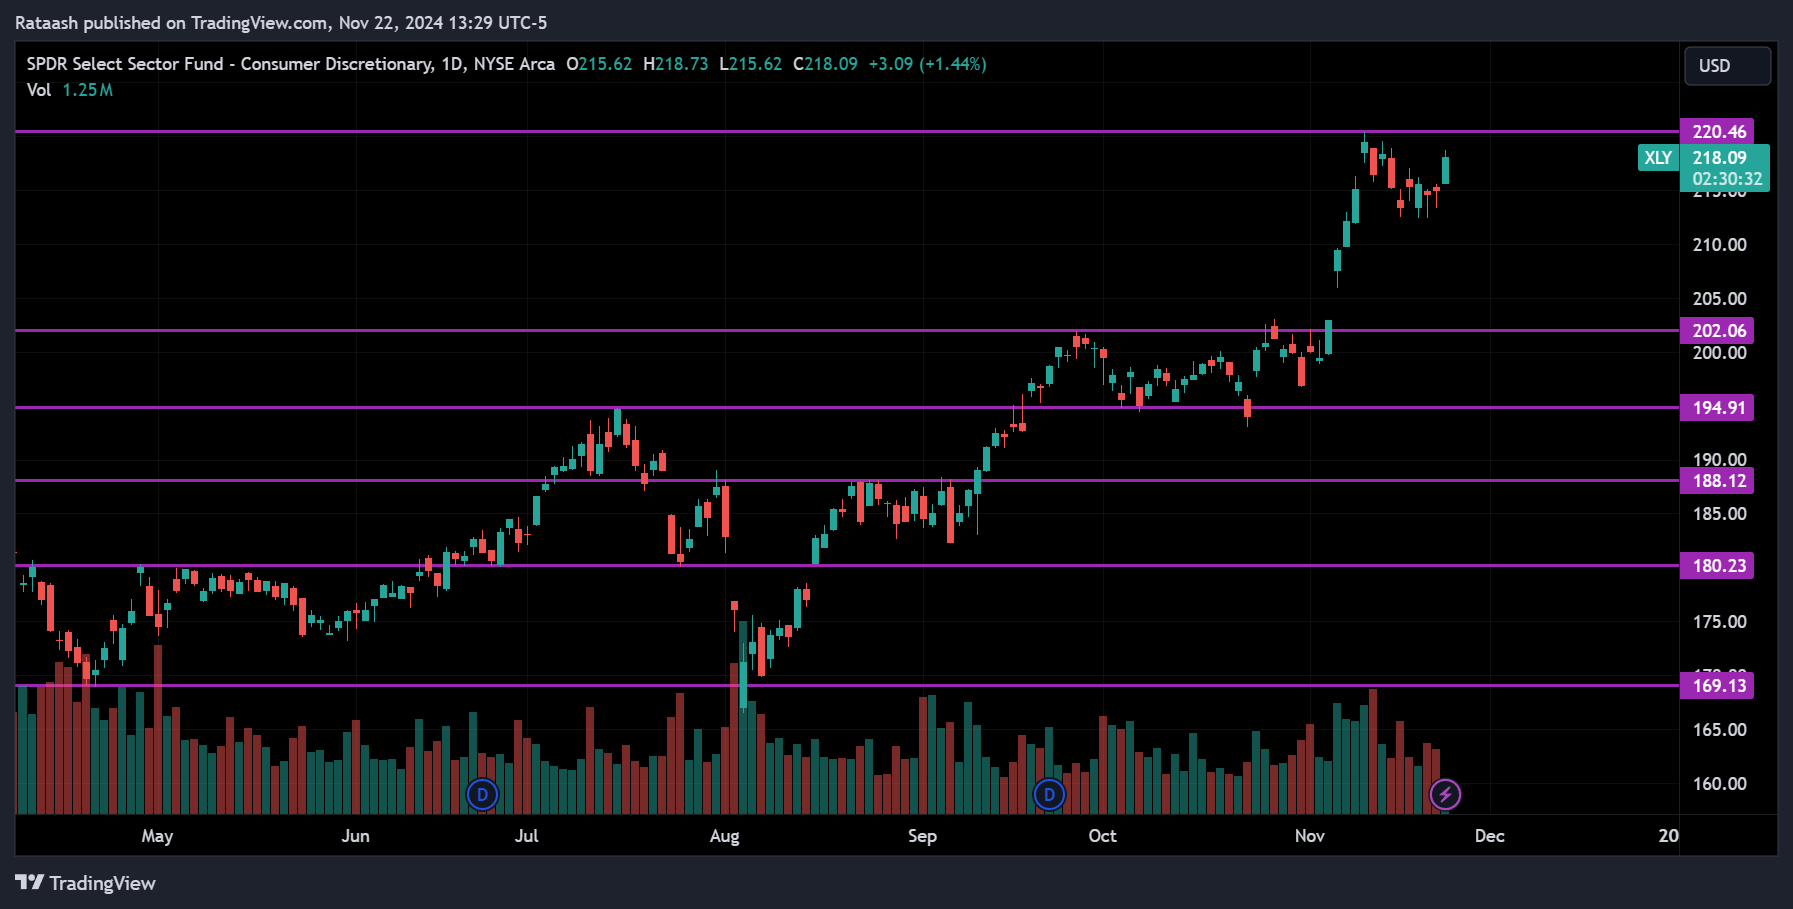
Technical analysis relies heavily on charts to track price movements over time. Common types of charts include:
- Line Charts: Show the closing price over time, ideal for observing long-term trends.
- Candlestick Charts: Provide detailed information on opening, closing, high, and low prices for a given period, popular for short-term trading.
- Bar Charts: Similar to candlestick charts but focus more on volume and range.
2. Indicators
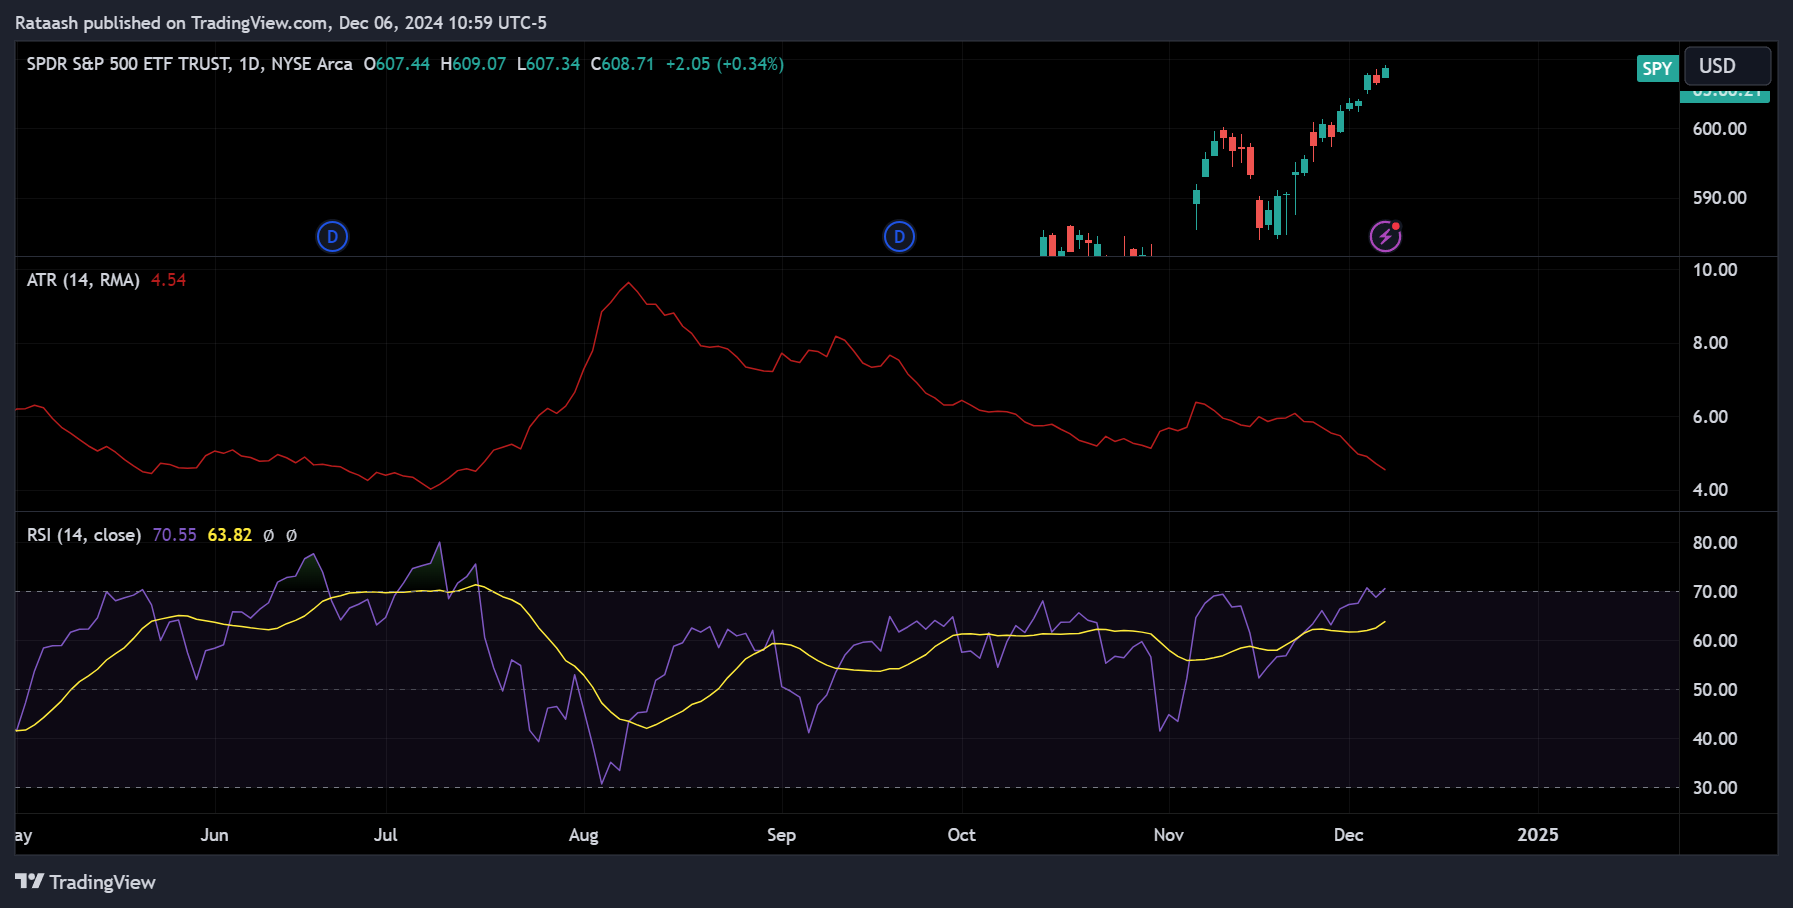
Indicators are mathematical tools used to interpret stock price data and predict future movements. Common indicators include:
- Moving Averages: Smooth out price data to identify trends over a set period (e.g., 50-day or 200-day moving averages).
- RSI (Relative Strength Index): Measures momentum to determine whether a stock is overbought (above 70) or oversold (below 30).
- MACD (Moving Average Convergence Divergence): Highlights trend reversals and strength by comparing moving averages.
- Volume: High trading volume often confirms price movements or signals upcoming volatility.
3. Support and Resistance Levels

- Support: A price level where demand is strong enough to prevent further decline, creating a “floor.”
- Resistance: A price level where selling pressure is strong enough to prevent further price increases, forming a “ceiling.”
4. Chart Patterns
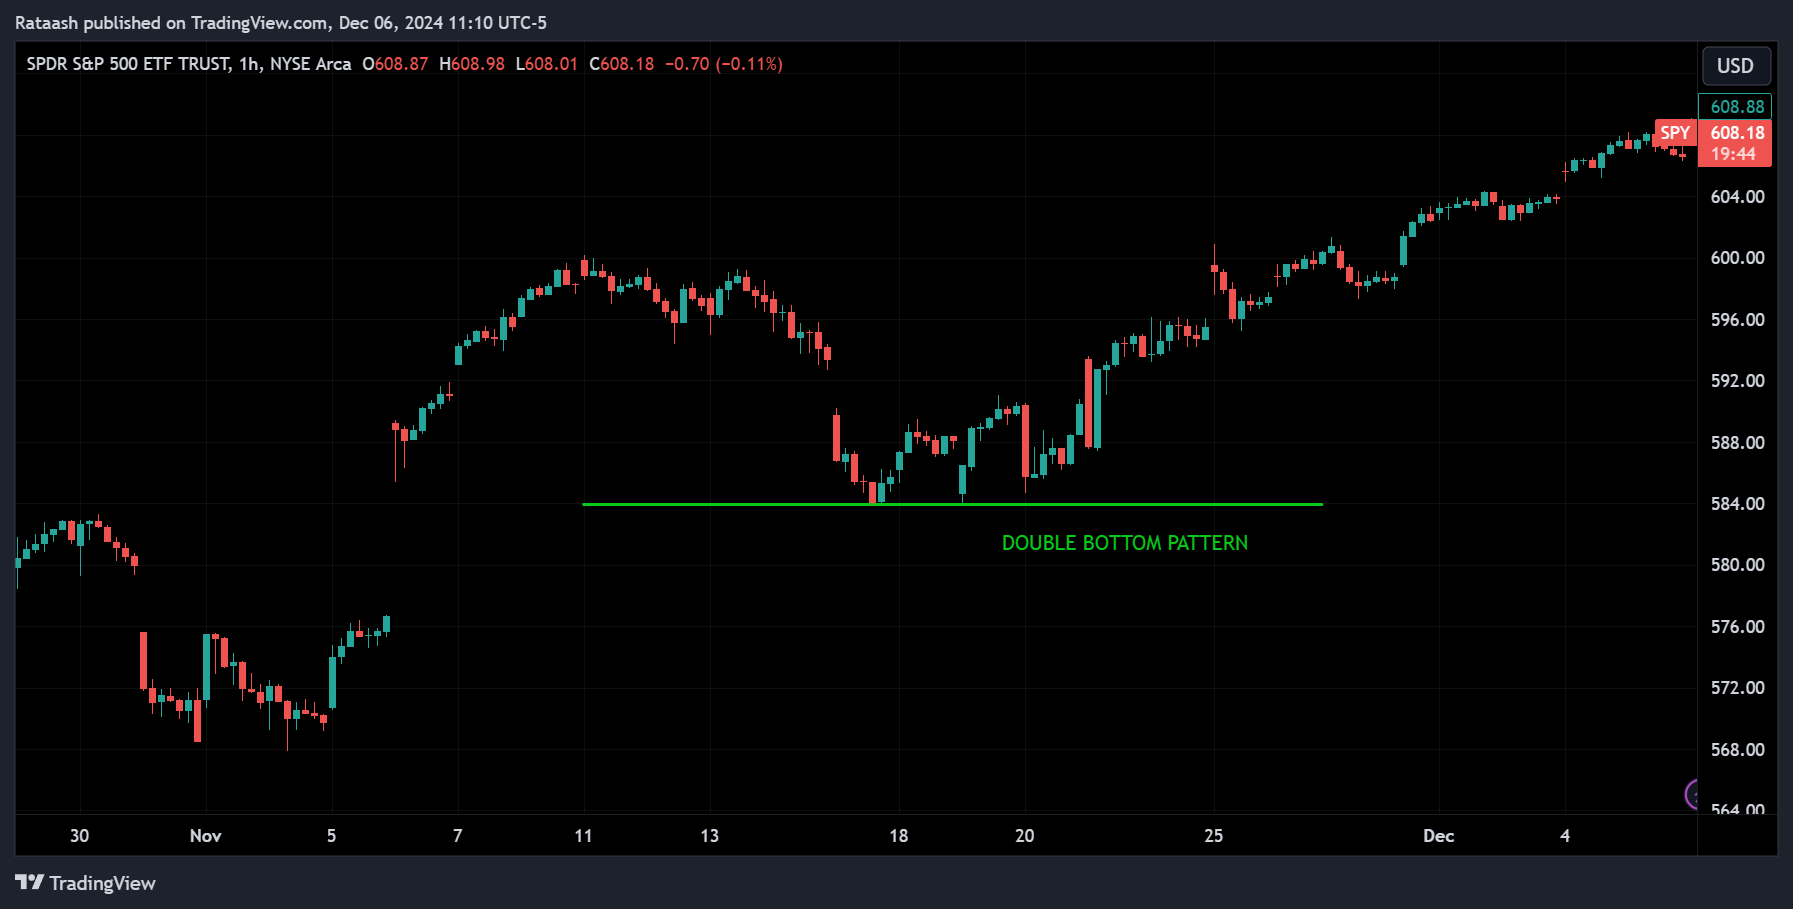
Patterns provide visual signals about potential price direction. Examples include:
- Head and Shoulders: Signals a potential reversal.
- Triangles (Ascending, Descending, Symmetrical): Indicate consolidation before a breakout.
- Double Top/Bottom: Predicts reversals after a failed test of a price level.
5. Timeframes
Technical analysis can be applied to multiple timeframes depending on your goals:
- Day Traders: Use 1-minute to 15-minute charts.
- Swing Traders: Focus on daily or 4-hour charts.
- Position Traders: Analyze weekly or monthly charts.
Advantages of Technical Analysis for Stocks
- Real-Time Application: Ideal for short-term trading as it provides immediate insights based on market movements.
- Universality: Can be applied to any stock, regardless of industry or sector.
- Defined Risk Management: Charts help set stop-loss levels and target prices.
- Visual Clarity: Offers a straightforward way to interpret complex market data.
Limitations of Technical Analysis
- Ignores Fundamentals: Does not account for company performance, earnings, or macroeconomic factors.
- Subjectivity: Chart interpretation can vary widely between traders.
- Lagging Indicators: Many technical tools react to price changes, making them less effective at predicting sudden reversals.
What Is Fundamental Analysis for Stocks?
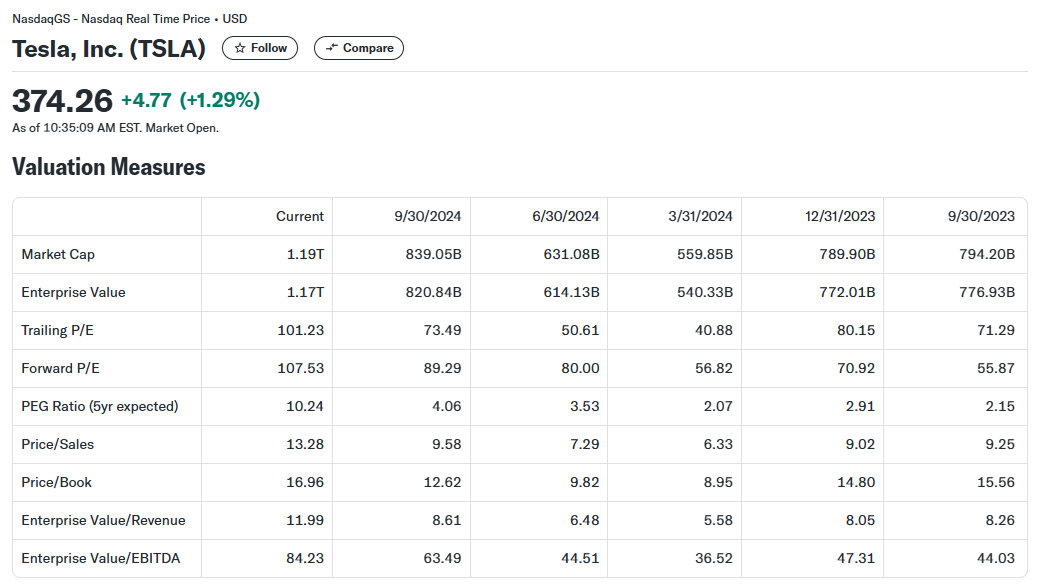
Fundamental analysis evaluates the intrinsic value of a stock by examining financial statements, industry conditions, and macroeconomic factors. It aims to determine whether a stock is undervalued or overvalued compared to its market price.
This approach is preferred by long-term investors who prioritize value and growth potential over short-term price fluctuations.
Core Principles of Fundamental Analysis
- Intrinsic Value: Every stock has an intrinsic value based on the company’s financial performance and potential for growth.
- Market Inefficiency: The market sometimes misprices stocks, creating opportunities for investors to buy undervalued shares or sell overvalued ones.
- Economic and Industry Context: Broader economic trends and industry-specific dynamics play a significant role in shaping a stock’s performance.
Key Components of Fundamental Analysis for Stocks
1. Financial Statements
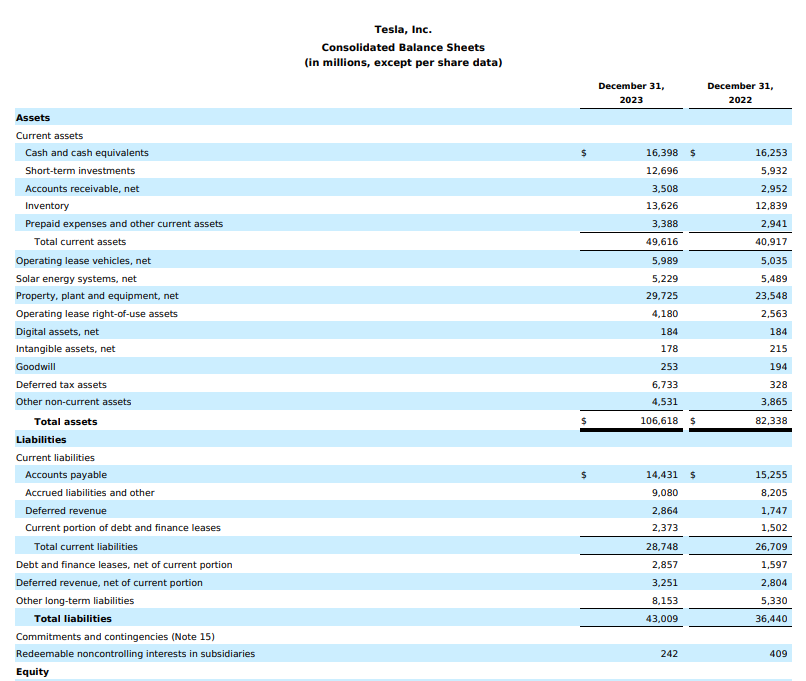
Analyzing a company’s financial health is central to fundamental analysis. The three key financial statements are:
- Balance Sheet: Examines assets, liabilities, and shareholder equity.
- Income Statement: Tracks revenue, expenses, and profitability over a specific period.
- Cash Flow Statement: Analyzes cash inflows and outflows to assess liquidity and operational efficiency.
2. Valuation Metrics

Investors use various ratios to compare a stock’s current market price to its intrinsic value:
- P/E Ratio (Price-to-Earnings): Measures how much investors are willing to pay per dollar of earnings.
- PEG Ratio: Accounts for growth by dividing the P/E ratio by the company’s earnings growth rate.
- P/B Ratio (Price-to-Book): Compares market price to the book value of the company.
- Dividend Yield: Shows the return on investment through dividends.
3. Economic Indicators
Macroeconomic trends such as GDP growth, interest rates, and inflation influence stock prices.
4. Industry Trends
Understanding competitive positioning, market share, and industry growth potential is essential for evaluating stocks in specific sectors.
5. Qualitative Factors
These include intangible aspects like:
- Management Quality: Leadership and decision-making capabilities.
- Brand Strength: Reputation and customer loyalty.
- Innovation: R&D efforts and patent portfolios.
Advantages of Fundamental Analysis for Stocks
- Comprehensive Evaluation: Takes into account both quantitative and qualitative factors.
- Long-Term Insight: Helps identify undervalued stocks with strong growth potential.
- Reduced Volatility: Focuses on intrinsic value, making it less reactive to short-term market fluctuations.
Limitations of Fundamental Analysis
- Time-Consuming: Requires extensive research and analysis.
- Uncertainty: Predictions can be disrupted by unforeseen events, such as economic crises or industry-specific challenges.
- Limited for Short-Term Trading: Less effective for capturing quick price movements driven by market sentiment.
Technical Analysis vs Fundamental Analysis: A Detailed Comparison
| Aspect | Technical Analysis | Fundamental Analysis |
|---|---|---|
| Focus | Historical price and volume data | Intrinsic value and macroeconomic factors |
| Goal | Identify trends and short-term opportunities | Determine long-term value and growth potential |
| Tools | Charts, indicators, support/resistance levels | Financial statements, valuation metrics, economic reports |
| Application | Short-term trading | Long-term investing |
| Time Commitment | Moderate (requires regular chart analysis) | High (requires deep research and analysis) |
Hybrid Approach: Combining Technical and Fundamental Analysis
Many successful investors and traders combine both approaches to maximize their market understanding and returns.
How to Integrate Both Approaches
- Stock Selection (Fundamentals): Use fundamental analysis to identify high-potential stocks.
- Timing (Technical): Apply technical analysis to time your entry and exit points.
- Risk Management: Rely on technical analysis for stop-loss levels while keeping fundamentals in mind for long-term decisions.
Real-World Examples
Technical Analysis Example
A trader analyzing Apple Inc. (AAPL) notices a bullish flag pattern on the daily chart. Using RSI and MACD, they confirm upward momentum and enter a position, targeting the next resistance level.
Fundamental Analysis Example
An investor reviews Amazon (AMZN) and finds it undervalued based on its P/E ratio and revenue growth potential in cloud computing. They invest, expecting long-term gains as the market recognizes its value.
Choosing the Right Approach for Stock Investing

Consider Your Goals
- Short-Term Trading: Technical analysis is better suited for quick trades and timing market movements.
- Long-Term Investing: Fundamental analysis is ideal for building wealth over time.
Assess Your Skills and Resources
- Technical analysis requires knowledge of charts and indicators.
- Fundamental analysis demands financial acumen and access to reliable data sources.
Conclusion
Technical analysis and fundamental analysis are powerful tools for stock market participants, each with unique strengths and limitations. Choosing between them—or integrating both—depends on your investment goals, risk tolerance, and time commitment.
For short-term traders, technical analysis offers actionable insights into price movements and trends. For long-term investors, fundamental analysis provides a deeper understanding of a stock’s true value and growth potential.
Ultimately, the best approach is one that aligns with your strategy, mindset, and objectives. What’s your preferred method? Let us know in the comments below!
