In the world of financial markets, it’s no secret that traders come from all walks of life. From day traders glued to their screens for rapid moves to swing traders who hold positions for days or weeks, everyone has one common goal: consistency and profitability. Yet, many traders overlook one critical aspect of improving their performance—tracking the right trading metrics. By diligently monitoring these metrics, you gain insights into what works, what doesn’t, and how you can optimize your strategies for consistent success in the market.
In this extensive pillar article, we will break down the top 10 essential trading metrics every trader needs to track to elevate their performance and keep their risk in check. We’ll explain why each metric matters, how to calculate it, and how to use the results to make more informed trading decisions. We’ll also include practical examples and recommended best practices, ensuring you leave with a full toolkit of actionable insights. Let’s dive in.
Table of Contents
Why Trading Metrics Matter

When embarking on a trading journey, most people focus heavily on strategies and techniques. They scour the internet for the perfect setup, subscribe to numerous newsletters, or pay for expensive courses in the hope of finding the “holy grail” strategy. While strategy development is undoubtedly important, a crucial piece of the puzzle is often neglected—measuring performance using objective metrics.
1. Clarity and Accountability
Trading metrics provide a clear lens into your performance. They reveal patterns in your profitability, highlight areas of weakness, and show you where adjustments are needed. Without metrics, trading decisions can become emotionally driven—leading to impulsive actions such as revenge trading or panic selling. By regularly reviewing your metrics, you maintain accountability to your trading plan and are less likely to make rash decisions.
2. Continuous Improvement
The best traders treat trading like a business. In any well-run business, metrics are used to identify strengths, weaknesses, opportunities, and threats. Trading is no different. Metrics let you fine-tune aspects of your strategy. For example, you might discover that a specific type of setup yields a higher win rate, prompting you to focus on that trade setup more often. On the other hand, you might realize that you consistently lose money when trading a certain instrument or during specific market conditions, helping you avoid those pitfalls in the future.
3. Risk Management
Effective risk management is the cornerstone of successful trading. Metrics like Maximum Drawdown or Risk-Reward Ratio can quickly show you if you are over-leveraging or risking too much per trade. By keeping track of these metrics, you can adjust position sizes, tighten your stop losses, or even pause trading during high-volatility periods to preserve capital.
4. Emotional Control
Numbers don’t lie. Having a quantitative measure to rely on can significantly reduce the emotional rollercoaster often experienced in trading. With properly tracked metrics, you can detach your self-worth from the outcome of a single trade. Instead, you’ll start viewing each trade as just one instance in a series of many, where the overall metrics matter more than any single outcome.
5. Consistent Profitability
The ultimate goal for most traders is consistent profitability. Achieving this requires discipline, adaptability, and a deep understanding of your trading performance. The metrics we’ll discuss provide insights that help you become more consistent by reinforcing good habits and discouraging harmful ones.
In the following sections, we will explore each essential metric in-depth. You’ll learn not only what they are but also how to calculate and interpret them. By the end of this article, you will have a robust framework for measuring—and ultimately improving—your trading results.
Metric 1: Win Rate
What Is Win Rate?
Your Win Rate (also called Winning Percentage) is the percentage of trades that you close profitably out of the total number of trades you execute. It’s one of the most straightforward yet powerful metrics because it immediately tells you how often your trades are correct according to your strategy.
- Formula for Win Rate:
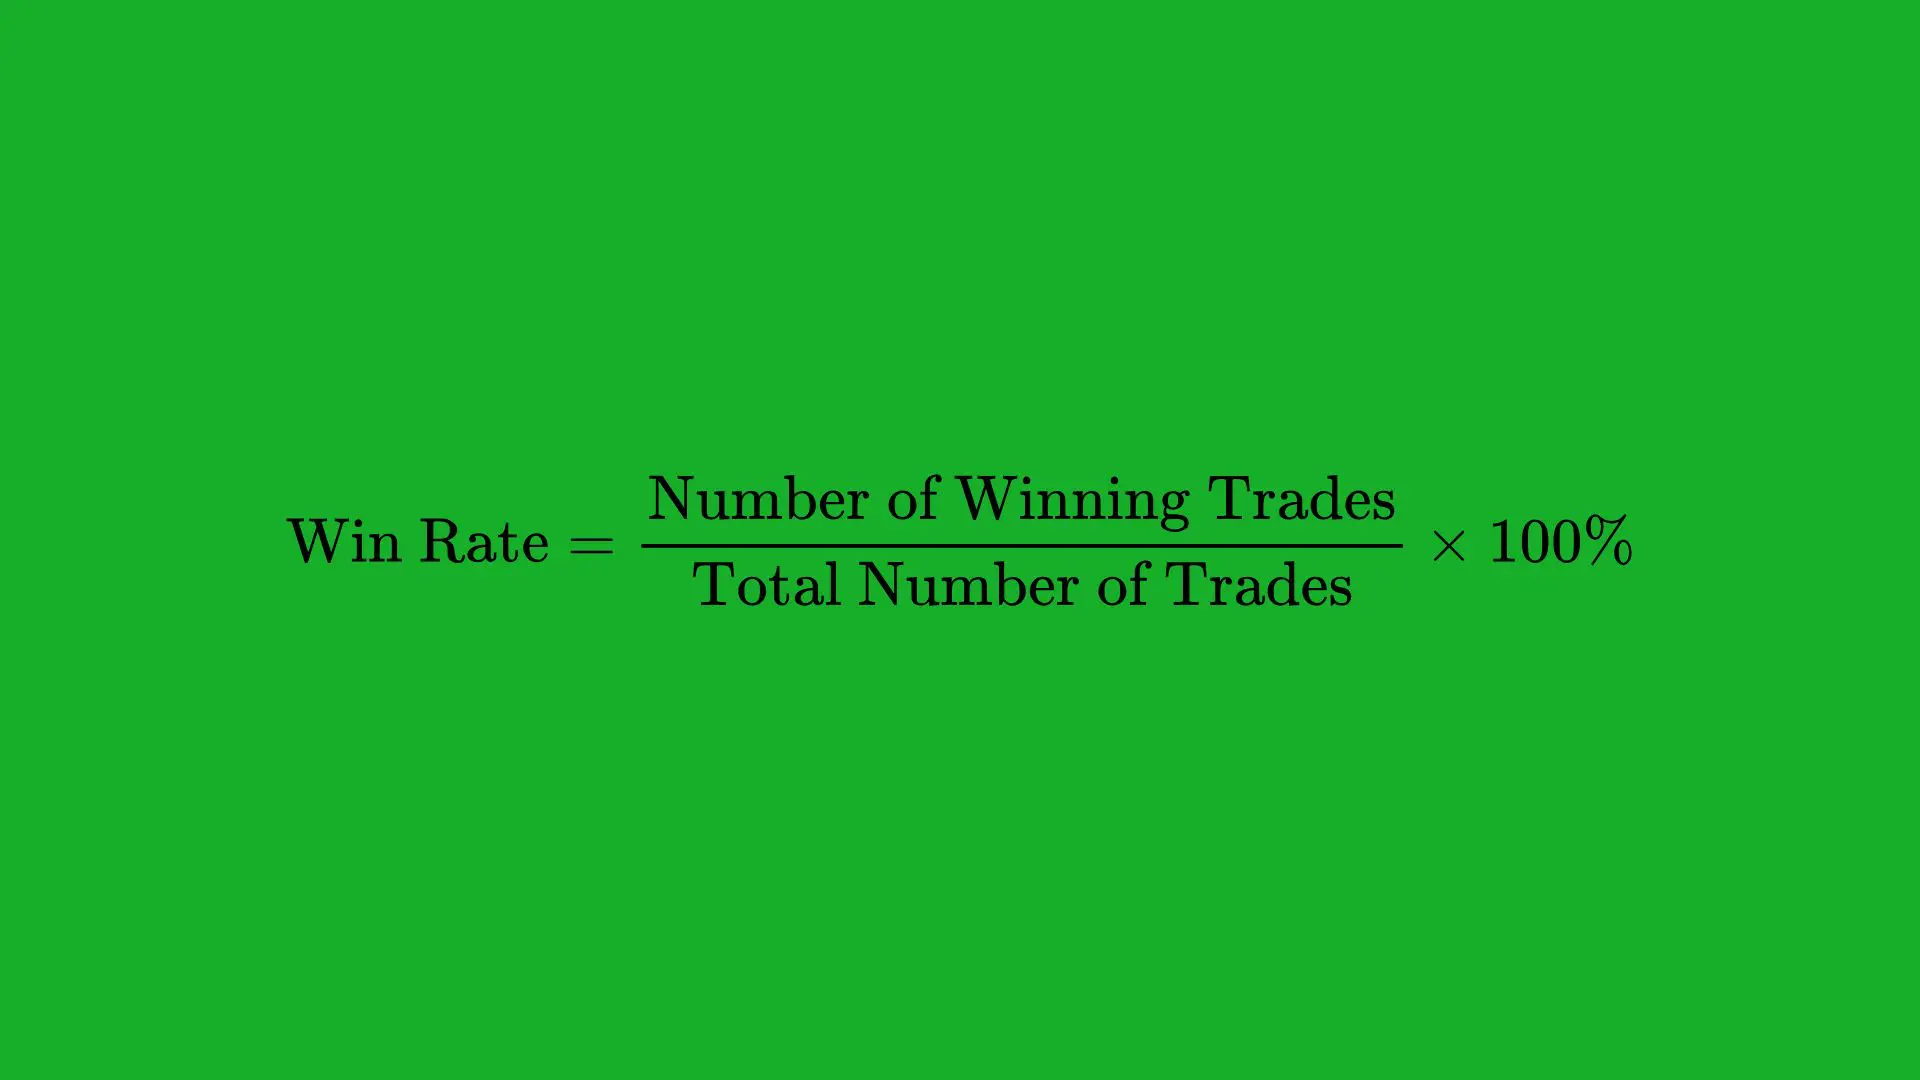
For instance, if you took 100 trades in a month and 55 of them were winners, your Win Rate would be 55/100×100%=55%
Why Win Rate Matters
- Immediate Performance Snapshot: A 55% win rate, for instance, quickly indicates that slightly more than half of your trades are successful. It provides a baseline measure of profitability potential.
- Psychological Comfort: Traders with higher win rates sometimes find it easier to endure drawdowns because they anticipate that a larger portion of future trades will still be winners.
Limitations of Win Rate
A high Win Rate doesn’t necessarily mean your trading strategy is highly profitable. For example, a strategy could have a very high win rate—say 80%—but if the average losing trade is significantly larger than the average winning trade, the strategy could still be unprofitable overall.
How to Improve Win Rate
- Refine Entry Criteria: Evaluate your entry rules. Are you only taking trades that align with clear market signals? Look for confluence among technical indicators, price action, or fundamental catalysts.
- Filter Markets/Time Frames: If you notice that your trades are more successful in trending markets but not in choppy environments, you might want to skip trades when markets are range-bound.
- Better Stop Placement: Poorly placed stops might be stopping you out too soon. Analyze your stops to see if you can tighten or widen them to avoid getting whipsawed.
Example
Imagine you’re a day trader focusing on momentum stocks. After analyzing your last 100 trades, you discover that 60 of them closed in profit, giving you a 60% win rate. Despite being satisfied with the number, you realize that on the 40 losing trades, your losses were nearly double the size of your winners. This reveals that merely having a 60% win rate is not enough; you need to look at other metrics (like Average Winner vs. Average Loser and Risk-Reward Ratio) to get the full picture.
Key Takeaway
Your Win Rate is a crucial initial measure of your strategy’s effectiveness. However, it must be viewed in conjunction with other metrics—especially those involving risk and reward—to determine if your strategy is actually profitable over the long term.
Metric 2: Average Winner vs Average Loser
What Is Average Winner vs Average Loser?
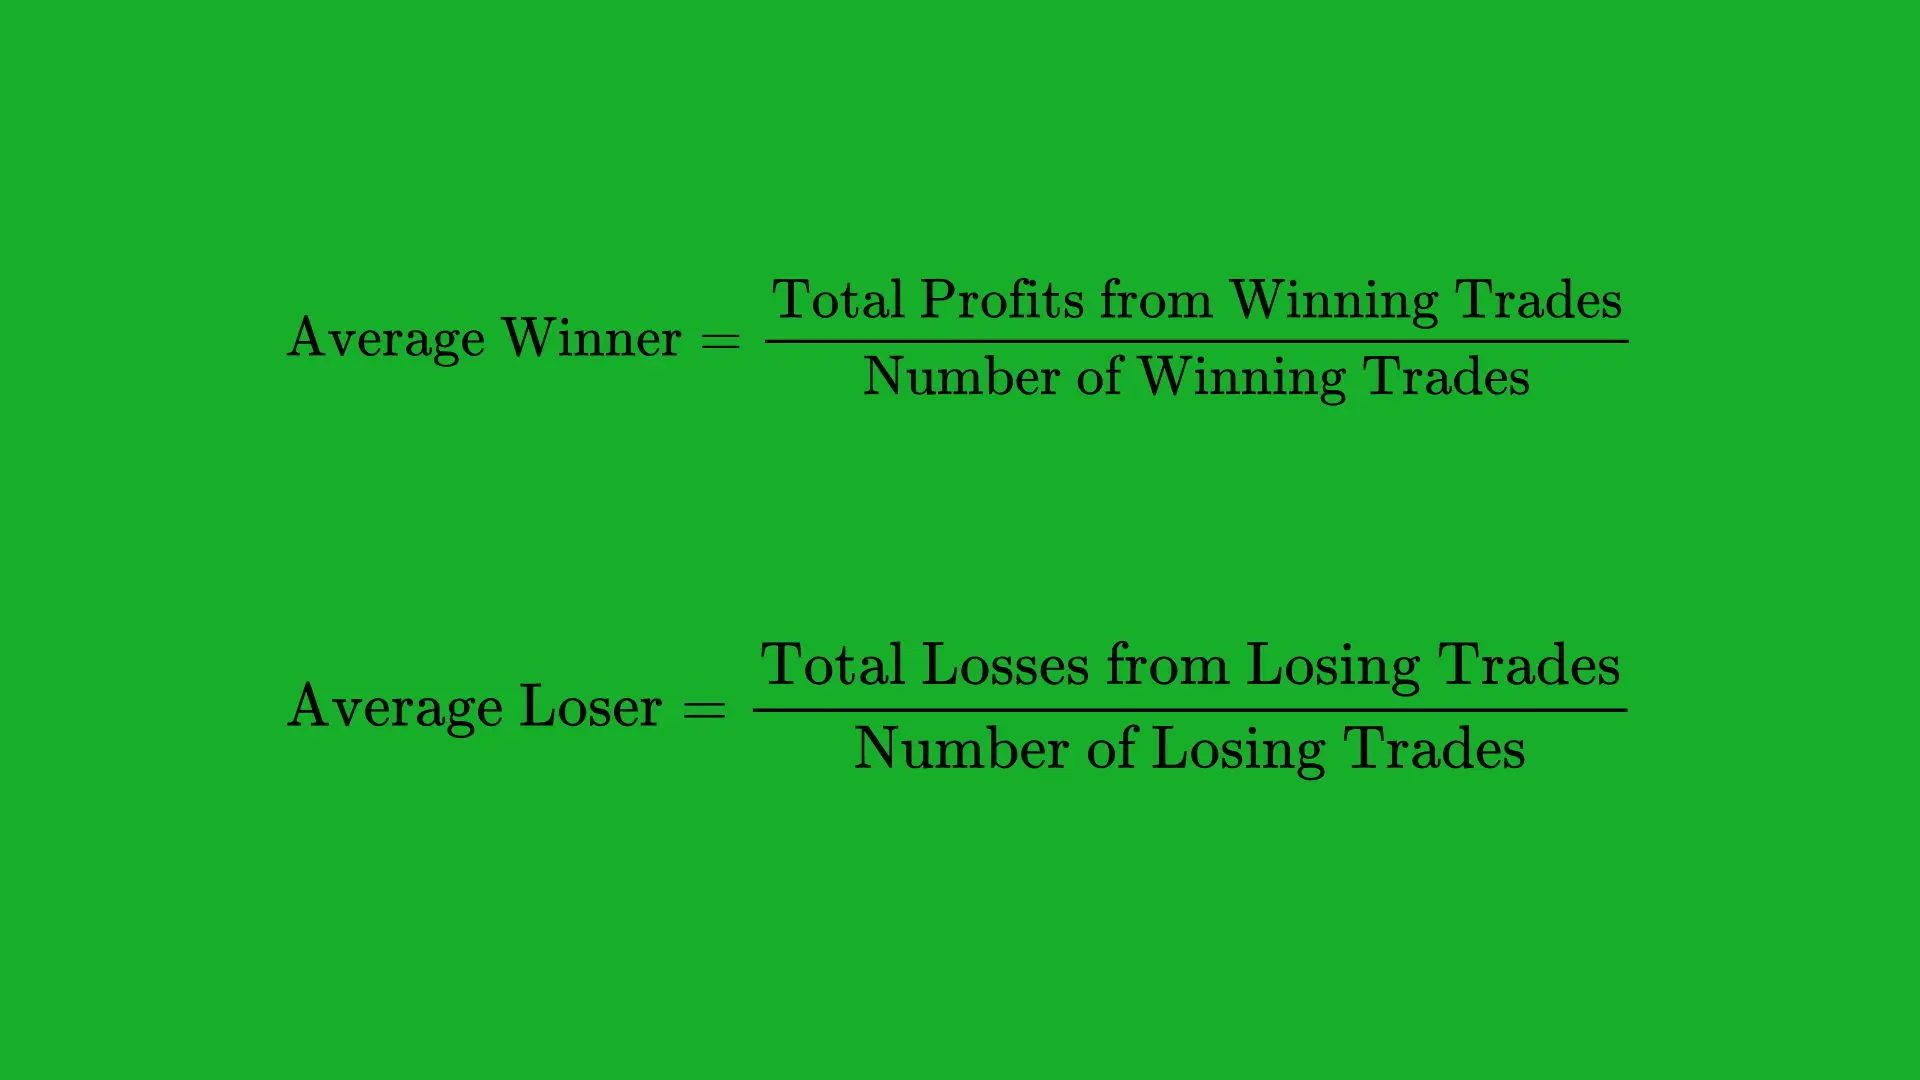
While Win Rate tells you how many trades are successful, the Average Winner vs. Average Loser metric looks at the magnitude of those wins and losses. Specifically, this metric is about calculating the average profit you make on winning trades (Average Winner) and the average loss you incur on losing trades (Average Loser).
- Average Winner: The sum of profits on all winning trades divided by the number of winning trades.
- Average Loser: The sum of losses on all losing trades divided by the number of losing trades.
Why It Matters
- Quality Over Quantity: A high win rate can be overshadowed by big losing trades. Conversely, you can have a relatively low win rate and still be profitable if your winners are disproportionately larger than your losers.
- Insights into Risk Management: If your average loser is much larger than your average winner, you might be letting losses run too long or cutting winners too soon.
How to Calculate
- Segregate Winning and Losing Trades: At the end of a certain period (weekly, monthly, or quarterly), separate your winning trades from your losing ones.
- Sum Up Profits and Losses: Add up the total profits from all winning trades and the total losses from all losing trades.
- Divide by the Number of Trades: Take those sums and divide by the number of winning or losing trades, respectively.
For instance, suppose you had 50 winning trades totaling $5,000 in profits. Your Average Winner would be $5,000/50=$100. If you had 30 losing trades totaling $4,500 in losses, your Average Loser would be $4,500/30=$150. In this scenario, you’d instantly see that, on average, you lose more ($150) on losing trades than you gain ($100) on winning trades, indicating a problematic risk pattern.
How to Interpret the Results
- Balance Is Key: If your average winner is larger than your average loser, you can afford to have a lower win rate and still be profitable. Conversely, if your average loser is consistently bigger, you’ll need a higher win rate just to break even.
- Identify and Control Drawdowns: If your losses are significantly bigger, even a small losing streak can wipe out the profits from several winning trades.
Strategies for Improvement
- Tighten Stop Losses on Losing Trades: If your losers are too large, consider lowering your stop-loss threshold or better identifying when a trade is going against you early on.
- Let Winners Run: If your winners are not that big, analyze whether you’re exiting too soon. Could you scale out of positions to lock in partial profits while letting the remainder run?
- Leverage Risk-Reward Ratios: Structure trades such that the potential reward is at least equal to or larger than the potential loss.
Example
Assume you are an options trader who tends to hold positions until expiration. You notice that some of your losing trades result in the option expiring worthless, incurring a 100% loss of the premium paid, while your winners average about a 50% gain. Despite having a modest 50% win rate, your average loser is quite large compared to your average winner. By adjusting your strategy to exit losing trades earlier or use a spread strategy to reduce potential losses, you could balance out the average loss and improve overall profitability.
Key Takeaway
Simply knowing how many times you win isn’t enough; you also need to know how much you win versus lose. Combining Win Rate with Average Winner vs. Average Loser reveals whether you’re actually capitalizing on your trade entries and managing risk effectively.
Metric 3: Risk-Reward Ratio
What Is the Risk-Reward Ratio?
The Risk-Reward Ratio (RRR) compares the potential profit of a trade to its potential loss. It’s commonly denoted as something like “1:2,” which would indicate you are risking $1 to earn $2. The RRR is a cornerstone metric for risk management and trade planning.
Formula:
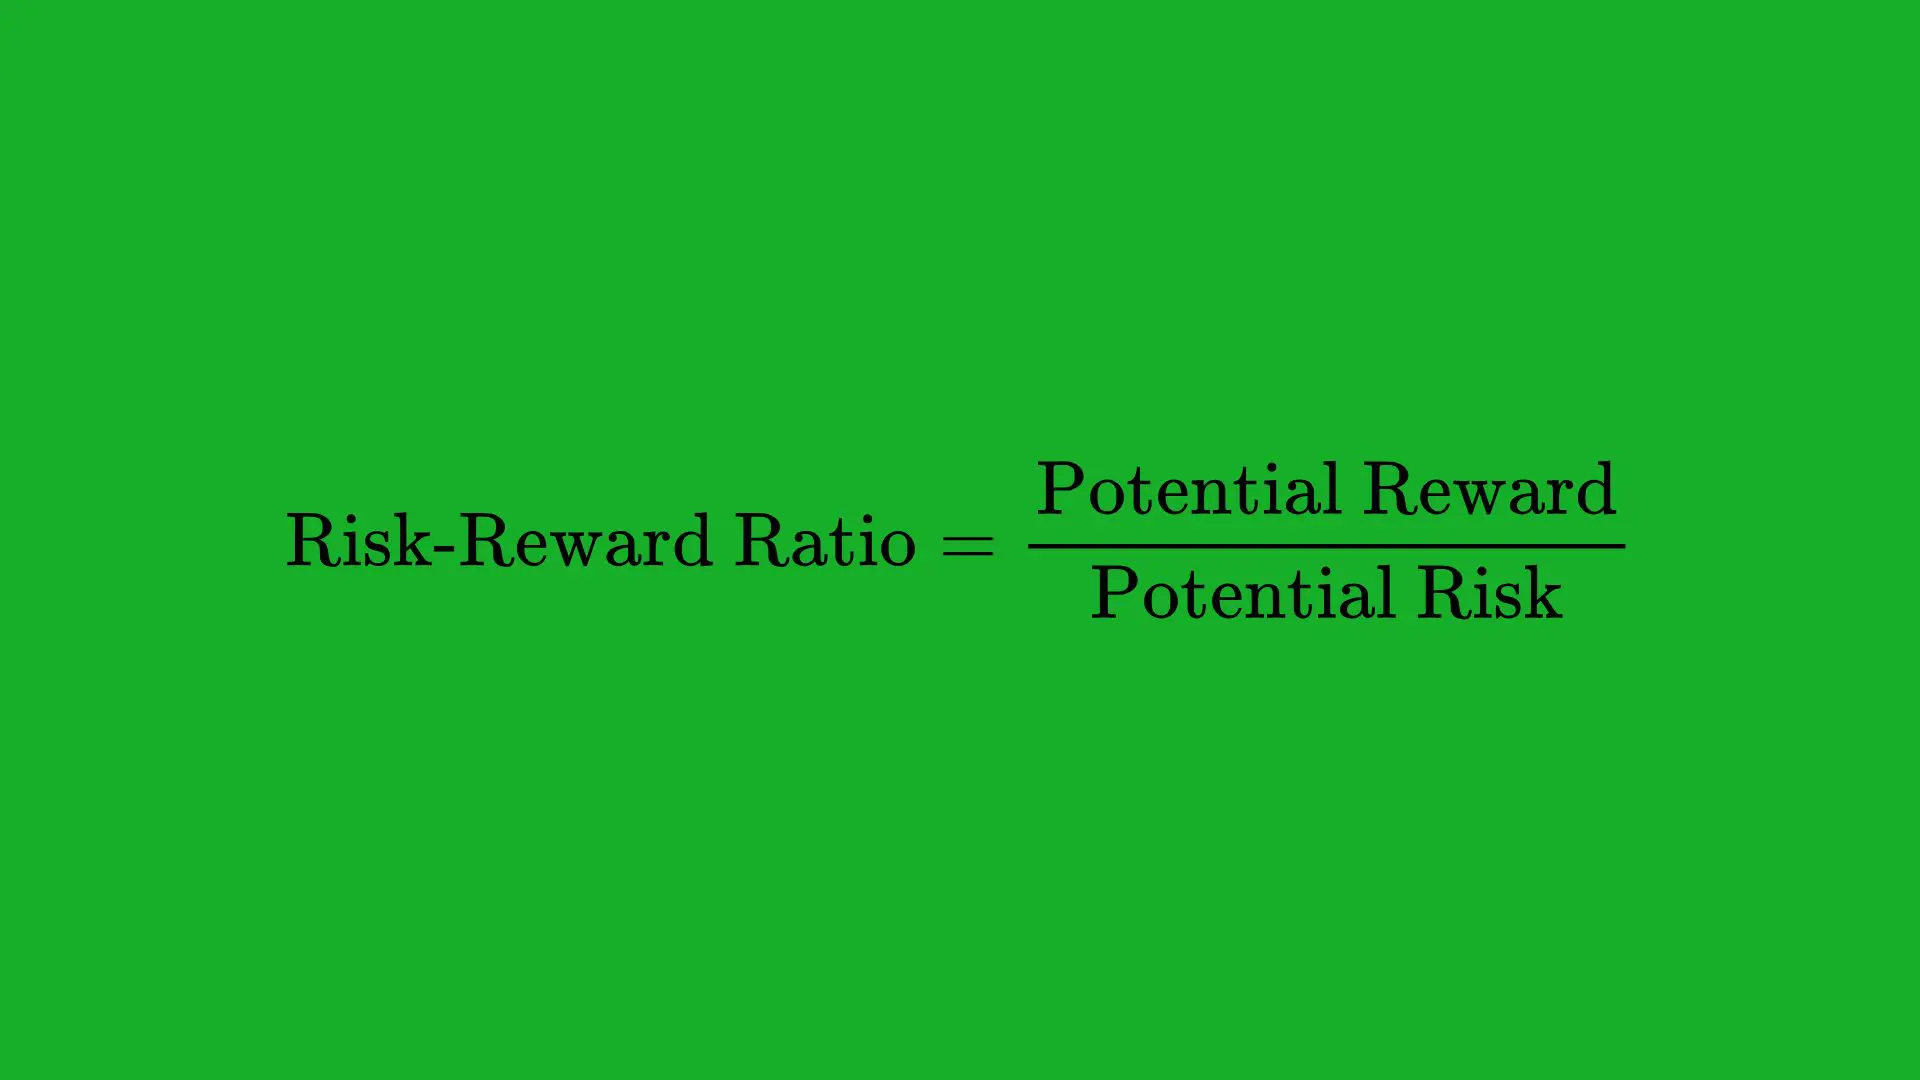
- If you risk $100 per trade (the potential loss) and aim to make $300 (the potential profit), your RRR is 1:3.
Why RRR Matters
- Guiding Trade Entries and Exits: The RRR informs where you set your stop loss and take-profit targets. By maintaining a favorable ratio (like 1:2 or 1:3), you can ensure that a few winning trades can cover your losses.
- Defining Strategy Viability: If your strategy can’t consistently achieve a certain RRR, you may need to either adjust your entry criteria or refine your exit rules.
Balancing RRR with Win Rate
A higher RRR usually means you aim for bigger wins relative to the risk, which can sometimes reduce your win rate because you’re waiting for larger moves. Conversely, a lower RRR might increase your win rate but reduce your potential profit on each trade. The optimal balance depends on your trading style, market conditions, and personal risk appetite.
Practical Examples
- Swing Trader Example: A swing trader might look for RRRs of 1:2 or 1:3 because they hold trades for several days or weeks, allowing the potential profit to grow.
- Scalper Example: A scalper might settle for a 1:1 ratio but achieve a high win rate, such as 70% or higher, because they’re taking very short-term trades aiming for smaller profits each time.
How to Improve Your RRR
- Adjust Stop Loss Placement: Ensuring your stop loss is strategically placed below a support level (if you’re long) or above a resistance level (if you’re short) can help you maintain a smaller risk without getting prematurely stopped out.
- Use Trailing Stops: This helps lock in profits if the market moves in your favor, effectively improving the reward side of the ratio.
- Research Volatility: Entering trades just before anticipated price movements (e.g., after news announcements or significant technical breakouts) can help you achieve a favorable RRR.
Example Calculation
Let’s say you buy a stock at $50, and you place a stop loss at $48, risking $2 per share. Your target price is $55, aiming for a $5 gain per share. The RRR here is 5/2=2.5, which is generally considered favorable.
Key Takeaway
The Risk-Reward Ratio is an essential metric that keeps your trading plan aligned with proper risk management. Whether you shoot for big winners with a lower win rate or smaller winners with a higher win rate, balancing your RRR with your overall strategy is crucial for long-term profitability.
Metric 4: Profit Factor
What Is Profit Factor?
Profit Factor is the ratio of your total gross profits to your total gross losses. It’s a single figure that encapsulates how much you stand to gain for every dollar you risk losing.
Formula:
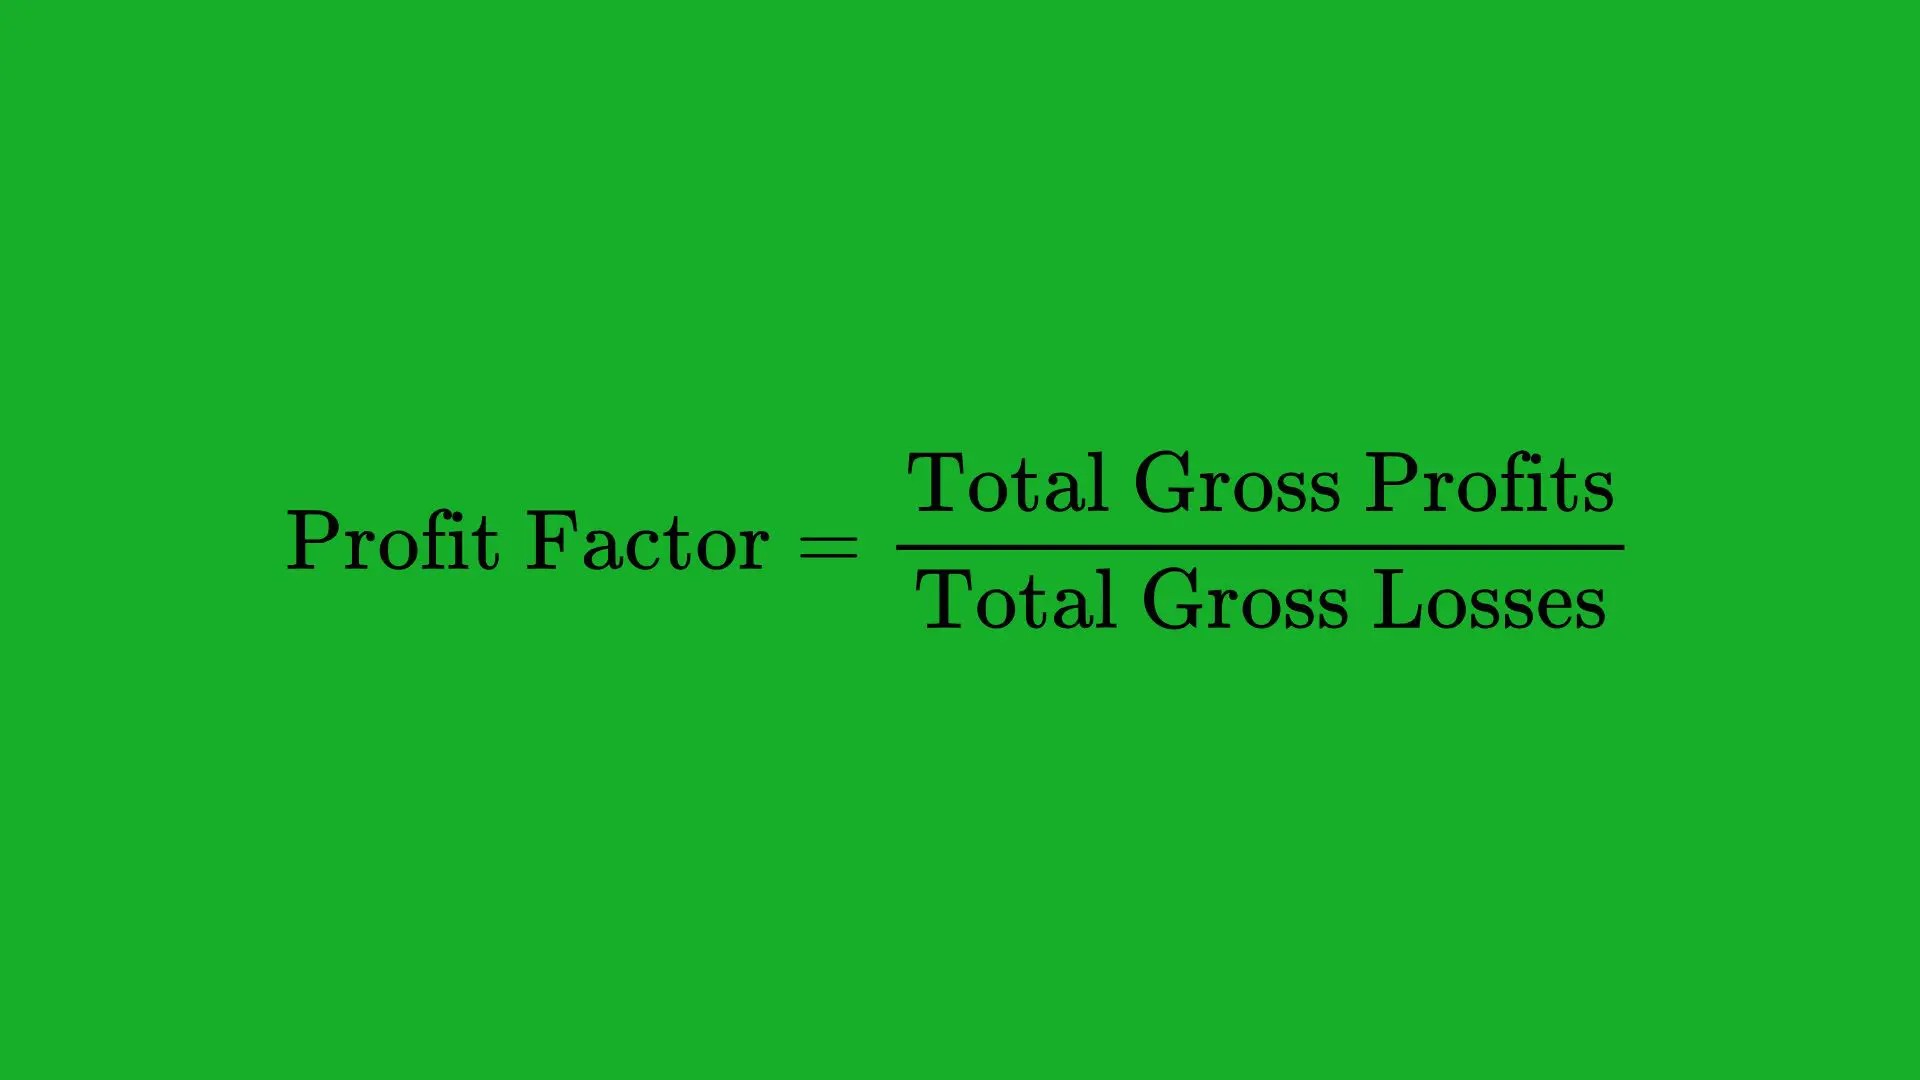
For example, if over a certain period you’ve made $10,000 in winning trades and lost $5,000 in losing trades, your Profit Factor would be 10000/5000=2.0.
Why Profit Factor Matters
- Holistic View of Profitability: Unlike win rate alone, Profit Factor automatically accounts for both the frequency and the magnitude of wins vs. losses.
- Comparative Analysis: Profit Factor lets you compare different trading strategies or time periods quickly. A Profit Factor above 1 indicates profitability, while below 1 indicates losses.
Ideal Ranges
- Above 1.5: Many traders consider a Profit Factor above 1.5 to be robust. This means for every $1 lost, you gain $1.50.
- Above 2.0: A Profit Factor above 2.0 is often viewed as excellent, but also keep in mind that extremely high readings over short periods might not be sustainable over the long run.
How to Calculate and Track
- Define a Time Period: Weekly, monthly, or quarterly.
- Total Gross Profits: Sum all the winning trades for that period.
- Total Gross Losses: Sum all the losing trades for that period.
- Divide: The ratio of total profits to total losses.
Using Profit Factor in Your Strategy
- Identify Underperforming Strategies: If a particular strategy or setup yields a Profit Factor below 1.0 consistently, it might be time to refine or discard it.
- Optimize Position Sizing: A strong Profit Factor can justify scaling up position size, provided other risk management measures (like Maximum Drawdown) remain within acceptable levels.
- Confirm Strategy Edge: A stable and consistently above-1 Profit Factor across different market conditions is a good sign your trading approach has a real edge.
Example
Imagine you run two different strategies over the same timeframe:
- Strategy A: Generates $8,000 in gross profits and $4,000 in gross losses → Profit Factor = 2.0
- Strategy B: Generates $15,000 in gross profits and $12,000 in gross losses → Profit Factor = 1.25
Even though Strategy B made more total profit, its Profit Factor is lower, indicating it carries relatively higher risk for lower net gain. This difference might prompt you to allocate more capital to Strategy A.
Key Takeaway
Profit Factor quickly summarizes if your trading approach is financially viable. It’s more comprehensive than just looking at wins or losses in isolation, as it captures the relationship between how much you gain when right and how much you lose when wrong.
Metric 5: Expectancy
What Is Expectancy?
Expectancy tells you the average amount you can expect to win (or lose) per trade over the long run. It combines your win rate and the average size of your wins and losses into a single metric.
Formula: Expectancy=(W×AW)−(L×AL)\text{Expectancy} = (W \times A_W) – (L \times A_L)
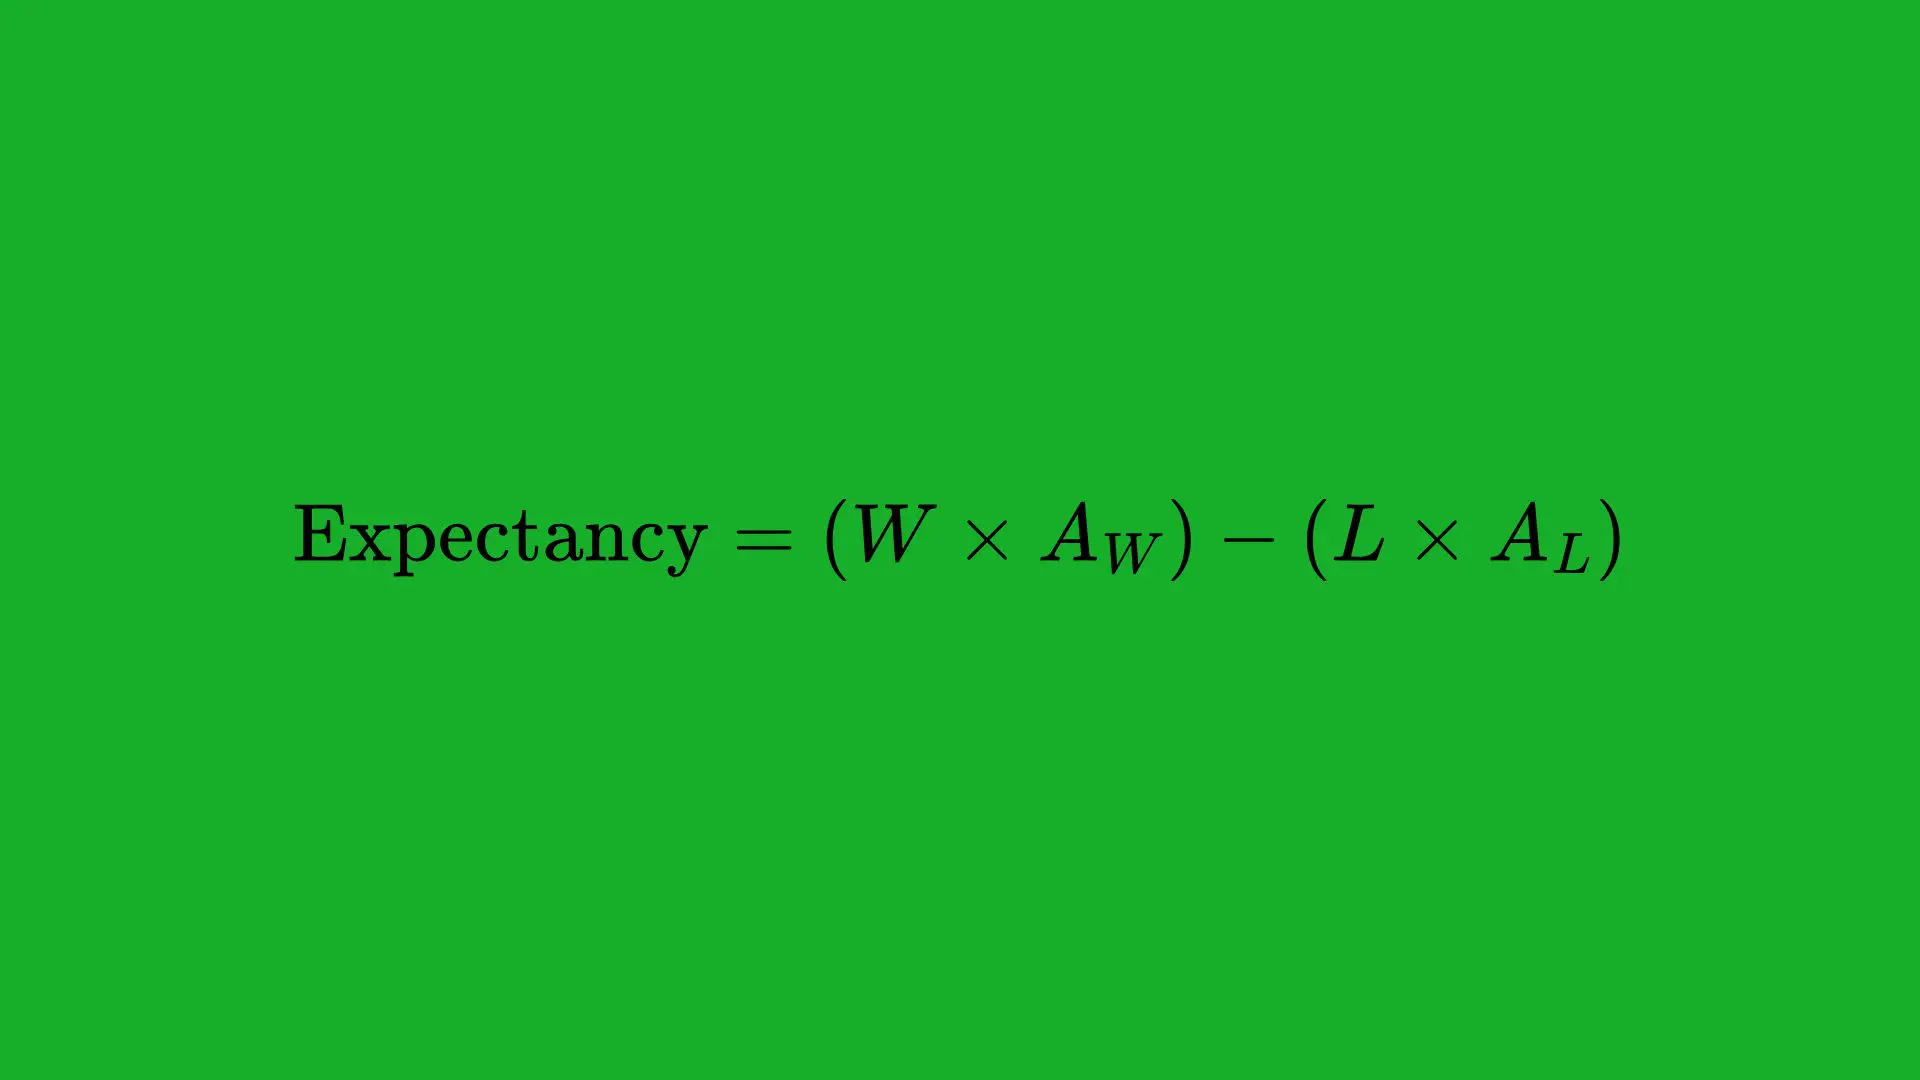
Where:
W = Win Rate (as a decimal),
L = Loss Rate (as a decimal) = (1 – W),
Aw = Average Winner,
AL = Average Loser.
For instance, if your Win Rate is 60% (0.60), your Average Winner is $100, your Loss Rate is 40% (0.40), and your Average Loser is $80, your Expectancy would be (0.60×100)−(0.40×80)=60−32=$28. This means you can expect to make $28 on average per trade in the long run.
Why Expectancy Matters
- Long-Term Viability: A positive expectancy is essential for any trading system to be profitable over a large number of trades.
- Risk Assessment: If your expectancy is low or negative, you’ll likely lose money over time, even if you have a string of short-term wins.
- Benchmark for Improvement: Tracking expectancy over time helps you see if your tweaks and improvements to a strategy are genuinely making it more profitable.
How to Calculate
- Gather Data: You need your Win Rate, Loss Rate, Average Winner, and Average Loser.
- Apply the Formula: Plug your numbers in.
- Update Regularly: Recalculate expectancy as market conditions change or when you change your strategy.
How to Improve Expectancy
- Increase Your Average Winner: Look for ways to maximize profits on good trades. Could you let trades run longer or scale out gradually?
- Reduce Your Average Loser: Implement stricter stops or exit signals to cut losers short.
- Boost Your Win Rate: Refine entries, trade only in favorable market conditions, or use additional indicators to filter out poor setups.
Example of Expectancy in Action
Let’s say you analyze a three-month trading period. You find:
- Win Rate: 50%
- Average Winner: $200
- Average Loser: $150
Your Expectancy calculation would be: (0.50×200)−(0.50×150)=100−75=$25
In this scenario, for every trade you take, you can anticipate about $25 in profit on average. This tells you that your system has a positive edge.
Key Takeaway
Expectancy cuts straight to the heart of profitability. Regardless of how many trades you win or lose, if your expectancy is positive, you have a viable system that should generate profits over a large sample of trades. Conversely, a negative expectancy indicates that you’ll likely lose money in the long run unless you make significant adjustments.
Metric 6: Maximum Drawdown
What Is Maximum Drawdown?
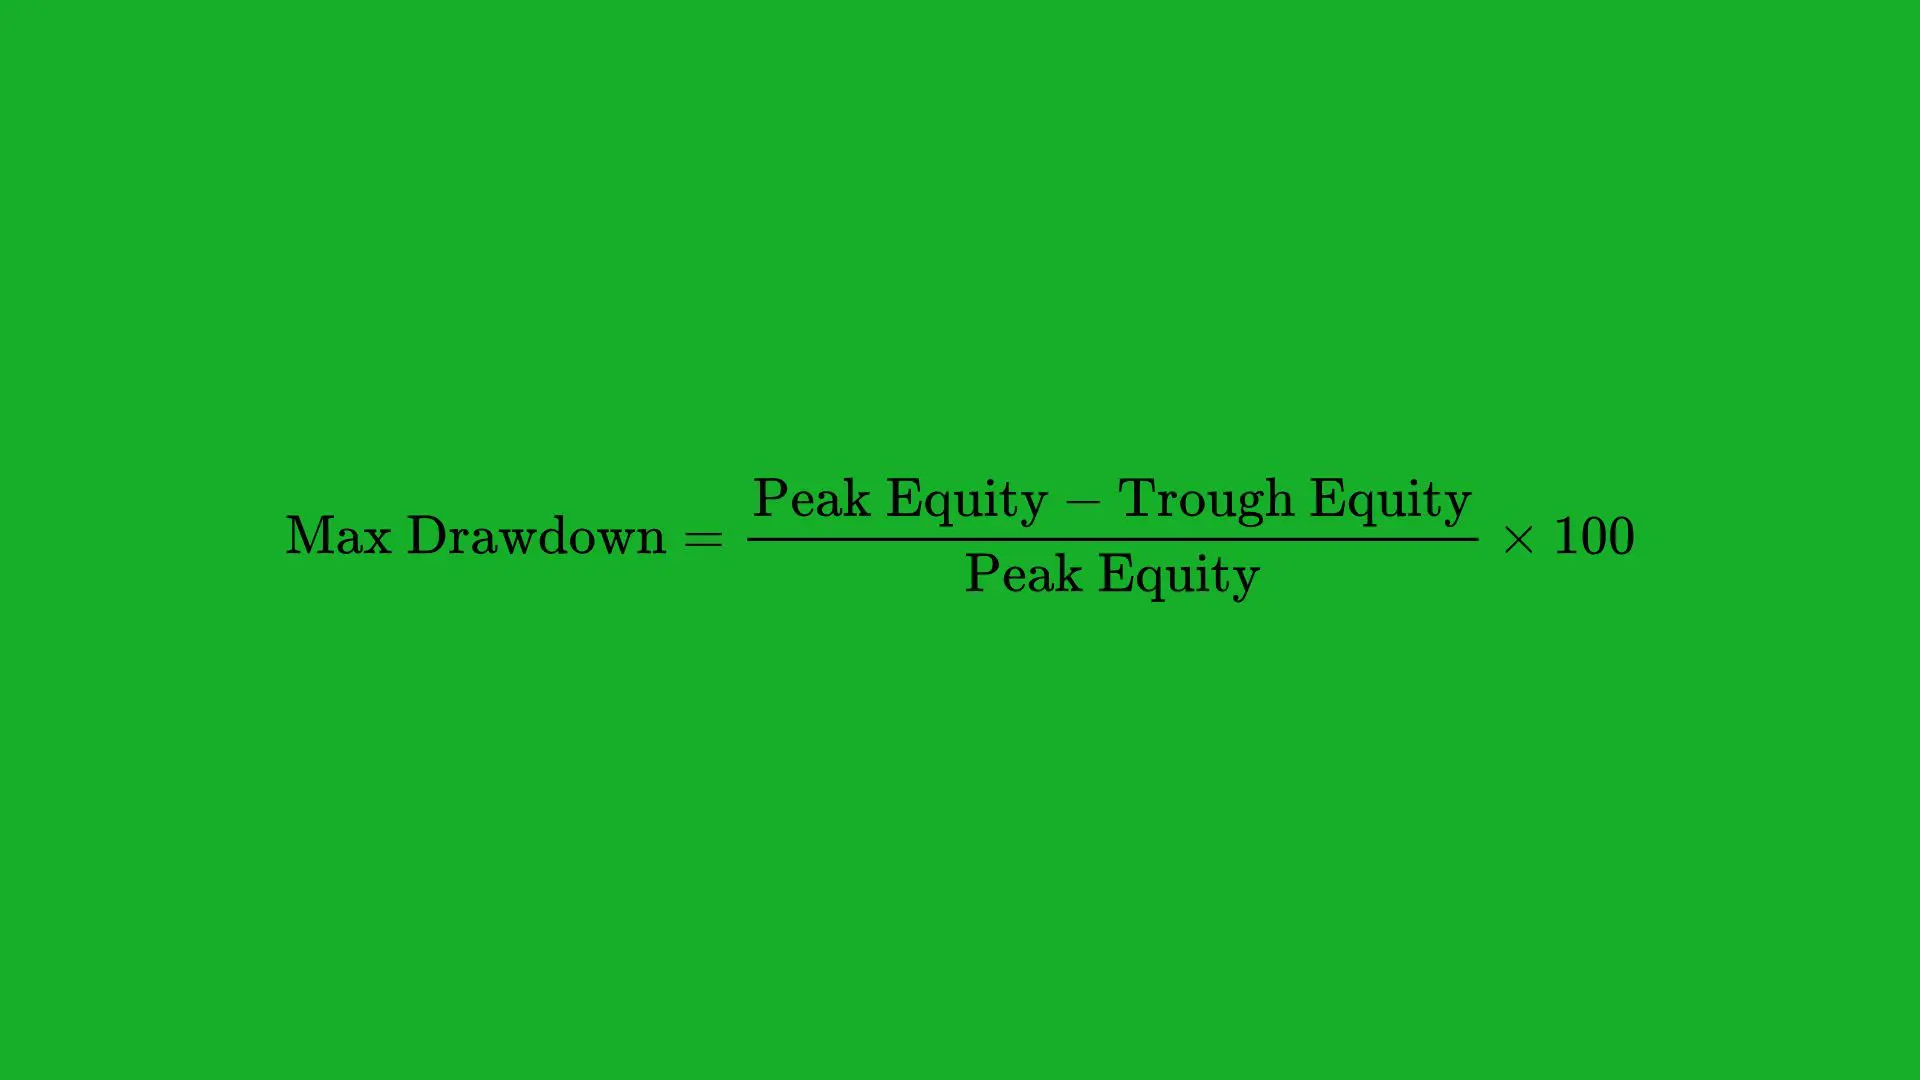
Maximum Drawdown (Max DD) measures the largest drop in your trading account’s value from its highest point to the lowest point over a specific time frame. It captures the worst-case scenario in terms of your account’s equity retracements.
- Example: If your trading account grows from $10,000 to $15,000 and then falls to $12,000 before going back up, the drawdown from the peak of $15,000 to $12,000 is $3,000, which is a 20% drawdown.
Why Maximum Drawdown Matters
- Risk Tolerance: Max DD is a critical risk metric. It shows whether you can psychologically handle the potential losses and if your trading strategy is sustainable.
- Capital Preservation: Large drawdowns can be hard to recover from. A 50% drawdown requires a 100% gain to get back to even.
- Strategy Comparison: If Strategy A has a Max DD of 10% while Strategy B has 30%, you might lean towards Strategy A if both have similar returns.
How to Calculate Maximum Drawdown
- Track Your Equity Over Time: Record your account balance regularly (daily, weekly, or after each trade).
- Identify Peaks and Troughs: Look for the highest equity point, then find the subsequent lowest point.
- Compute the Difference and Percentage: Subtract the trough from the peak, then divide by the peak and multiply by 100 to get a percentage.
Controlling and Minimizing Drawdowns
- Position Sizing: Reducing the size of each trade can limit the damage in losing streaks.
- Diversification: Spreading risk across multiple assets or uncorrelated markets can lower the impact of a single losing trade or market downturn.
- Using Stop Losses: Strict stop-loss rules can prevent catastrophic losses that lead to large drawdowns.
Example
Suppose over six months, your account goes like this:
- Start: $10,000
- Peak: $15,000
- Then drops to $11,000
- Goes back up to $16,000
- Then dips to $13,000 before heading to $18,000
There are two significant drawdowns here:
- From $15,000 to $11,000 (a $4,000 drop, 26.7% drawdown)
- From $16,000 to $13,000 (a $3,000 drop, 18.8% drawdown)
The Maximum Drawdown is 26.7%, which occurred in the first drop. This is crucial information: a trader experiencing a 26.7% drawdown might need strong mental fortitude to stick with the strategy and recover.
Key Takeaway
Maximum Drawdown is crucial for understanding the downside risk of your trading strategy. Keeping your drawdowns within manageable limits ensures longevity in the markets and preserves the capital needed to capitalize on profitable opportunities.
Metric 7: Sharpe Ratio
What Is the Sharpe Ratio?
Developed by Nobel laureate William F. Sharpe, the Sharpe Ratio measures the risk-adjusted return of your trading strategy. It helps you understand how much excess return you’re generating for each unit of risk you’re taking.
Formula (simplified):
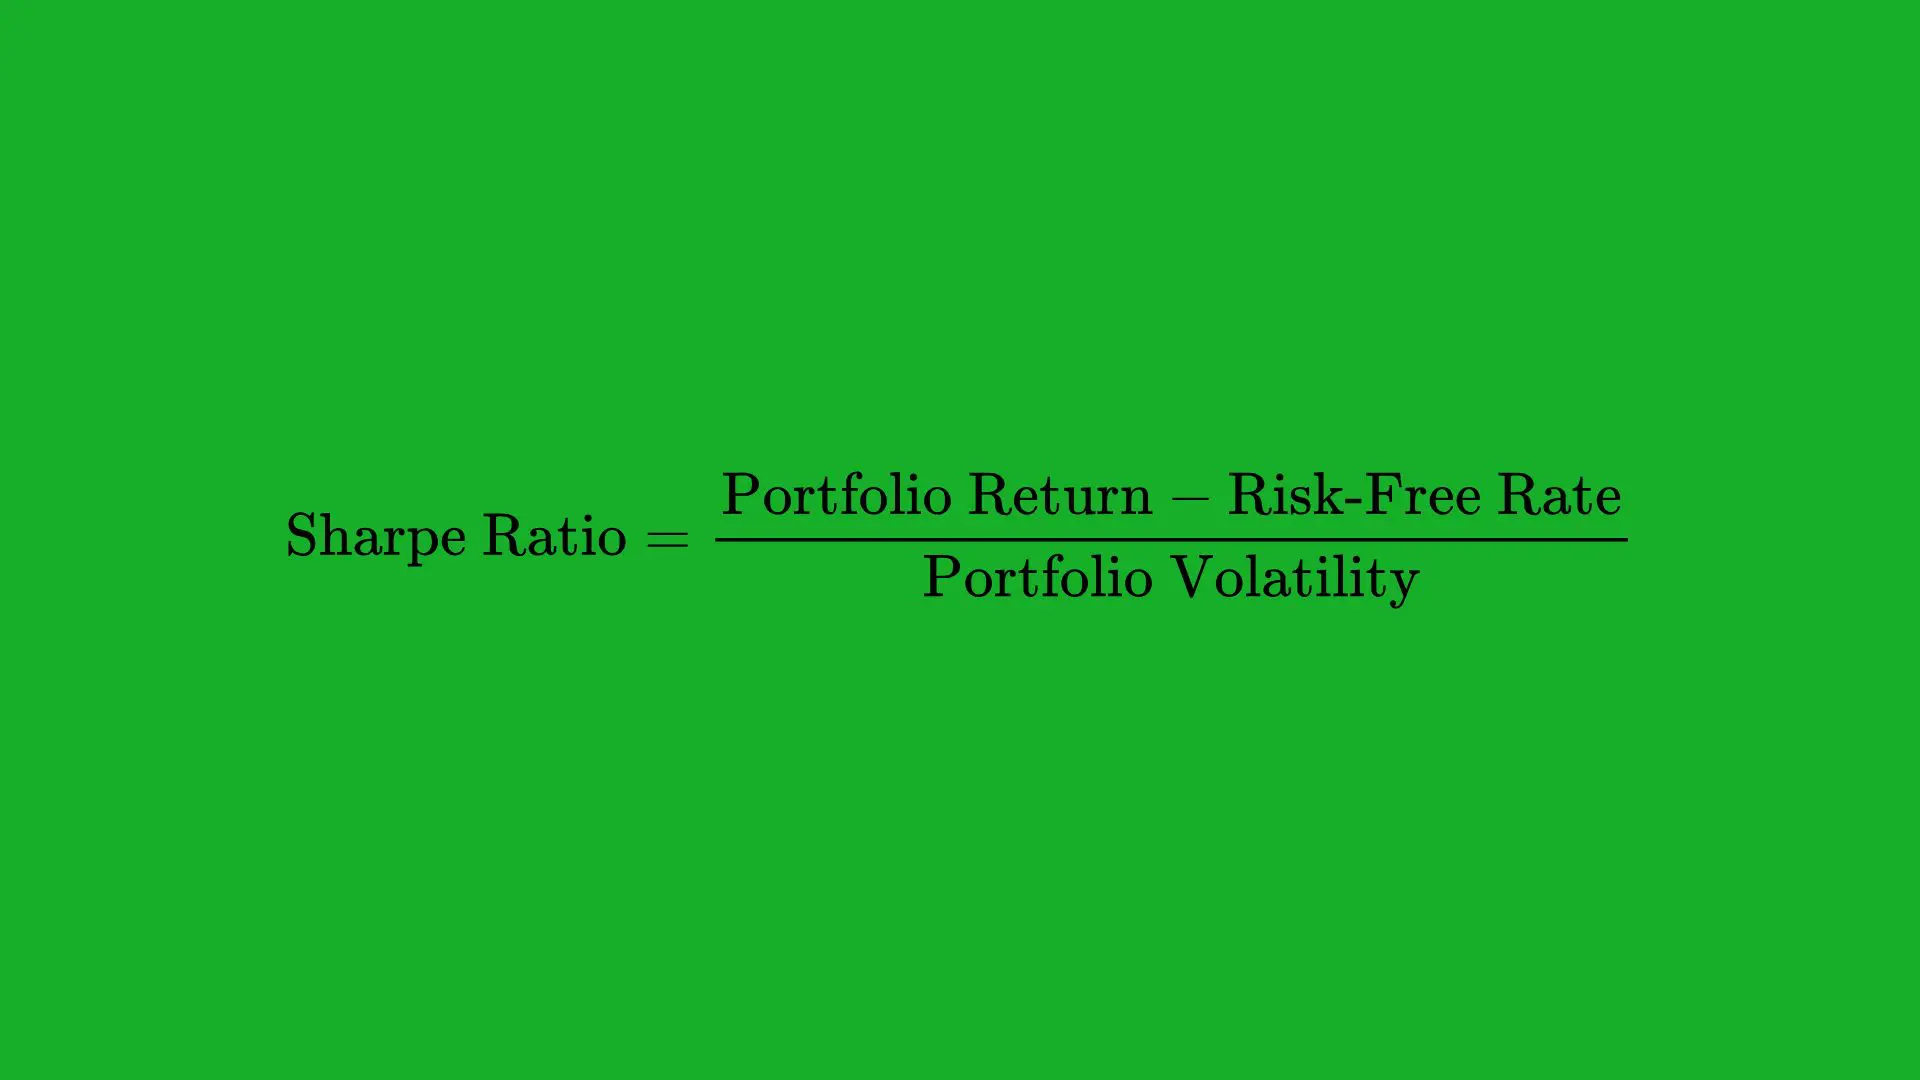
- Portfolio Return: The average return of your trading strategy or portfolio.
- Risk-Free Rate: Often taken as the yield on a U.S. Treasury bill or similar safe asset.
- Portfolio Volatility: Usually the standard deviation of the strategy’s returns.
Why Sharpe Ratio Matters
- Risk-Adjusted Return: The Sharpe Ratio tells you not just how much you made, but also how consistent and volatile your returns were.
- Comparisons: You can compare different strategies or different asset classes using the Sharpe Ratio, even if their absolute returns differ.
Ideal Values
- Above 1.0: Generally considered decent.
- Above 2.0: Often viewed as very good, indicating strong risk-adjusted returns.
- Above 3.0: Exceptional, though it could indicate a strategy or market condition that may not be sustainable forever.
How to Calculate and Interpret
- Calculate Average Return: Sum up your periodic returns (weekly or monthly) and divide by the number of periods.
- Determine Risk-Free Rate: Use a benchmark, such as a short-term government bond yield.
- Measure Standard Deviation: Compute the volatility (standard deviation) of the returns.
- Apply the Formula: Subtract the risk-free rate from your average returns, then divide by the volatility.
A higher Sharpe Ratio suggests that for every unit of risk (volatility) you’re taking, you’re getting a higher return. A negative Sharpe Ratio implies that your returns are lower than the risk-free rate when considering volatility, which is generally a bad sign for your strategy.
Example
Let’s assume:
- Annualized return of your strategy: 15%
- Risk-free rate: 2%
- Standard deviation of your strategy’s returns: 10%
Your Sharpe Ratio would be: (15%−2%)/10%=(13%/10%)=1.3
A 1.3 Sharpe Ratio indicates your strategy is earning 1.3 units of return for each unit of risk, which is considered respectable in many market environments.
Key Takeaway
The Sharpe Ratio provides a quick, quantitative measure of how effectively your strategy turns risk into reward. It’s especially useful when comparing multiple trading systems or investment options, allowing you to pick the one that offers better risk-adjusted performance.
Metric 8: Sortino Ratio
What Is the Sortino Ratio?
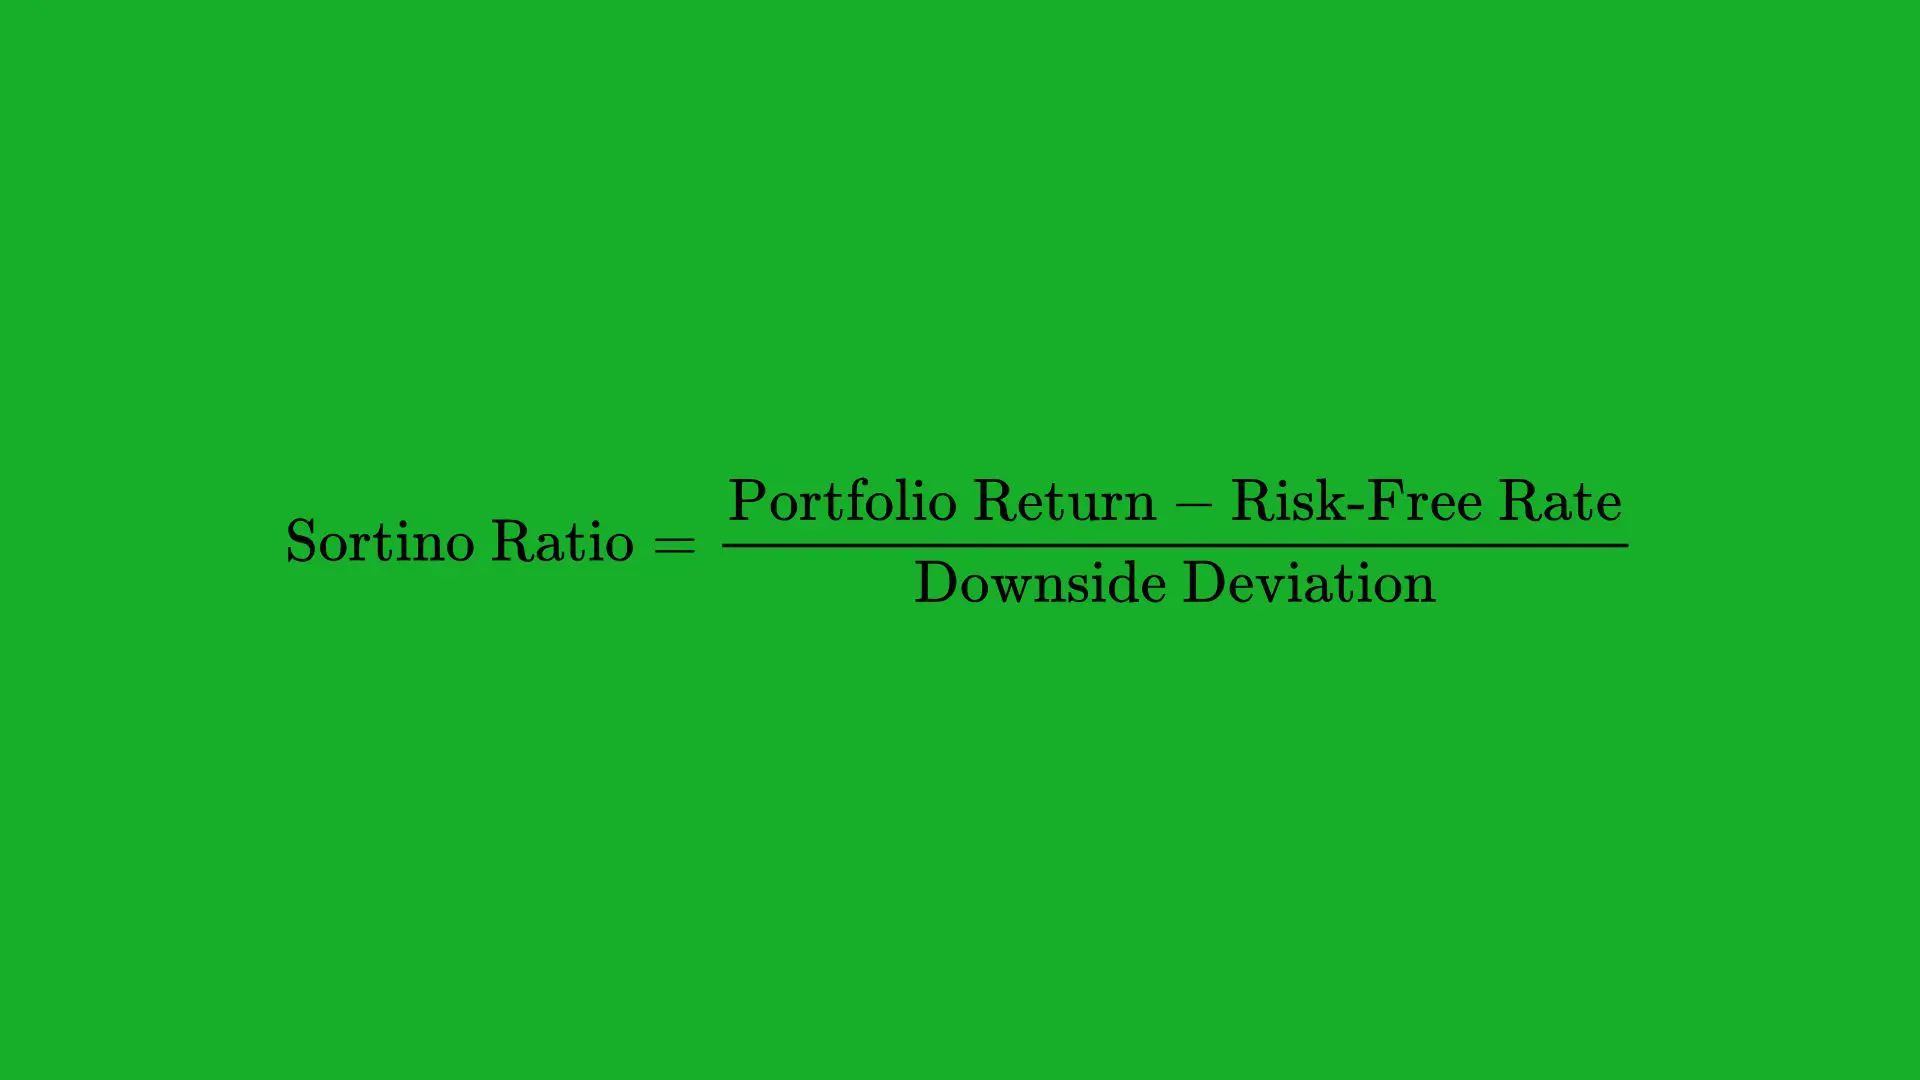
The Sortino Ratio is a variant of the Sharpe Ratio that focuses specifically on downside risk instead of overall volatility. It measures risk-adjusted returns but penalizes only the downside volatility (negative returns), ignoring upward price fluctuations.
- Formula (simplified):
Why Sortino Ratio Matters
- More Accurate for Traders: Many traders believe standard deviation (used in Sharpe Ratio) is not the best measure of risk, because it includes both upside and downside volatility. Traders typically only fear downside volatility.
- Pinpoints Downside: By focusing on downside deviation, the Sortino Ratio tells you how well the strategy performs during negative returns or drawdowns.
Ideal Values
- Above 1.0: Indicates acceptable performance, given the downside risk taken.
- Above 2.0 or 3.0: Shows very strong performance, but again, extremely high ratios might not be sustainable.
How to Calculate Downside Deviation
- Isolate Negative Returns: Look at only the periods with negative returns relative to a target or risk-free rate.
- Compute Variance: Square the negative returns, sum them, and divide by the number of periods.
- Take the Square Root: This gives you the standard deviation of negative returns.
Using Sortino Ratio
- Compare Similar Strategies: If you have two strategies with similar returns but different exposures to downturns, the one with the higher Sortino Ratio is preferable.
- Identify Resilience: A high Sortino Ratio can indicate that a strategy is particularly good at avoiding or mitigating deep drawdowns.
Example
Suppose your trading system returns 12% annually, the risk-free rate is 2%, and your downside deviation (standard deviation of negative returns) is 5%.
The Sortino Ratio would be: (12%−2%)/5%=(10%/5%)=2.0
A 2.0 Sortino Ratio suggests your strategy is producing returns that are twice the magnitude of the downside risk, which is often considered an excellent risk-adjusted return profile.
Key Takeaway
The Sortino Ratio refines risk-adjusted performance analysis by emphasizing only the “bad” volatility. It’s a particularly relevant metric for traders who want a better gauge of how their strategy performs when the market or their trades are trending downward, thus providing a more tailored view of risk management.
Metric 9: Trading Frequency
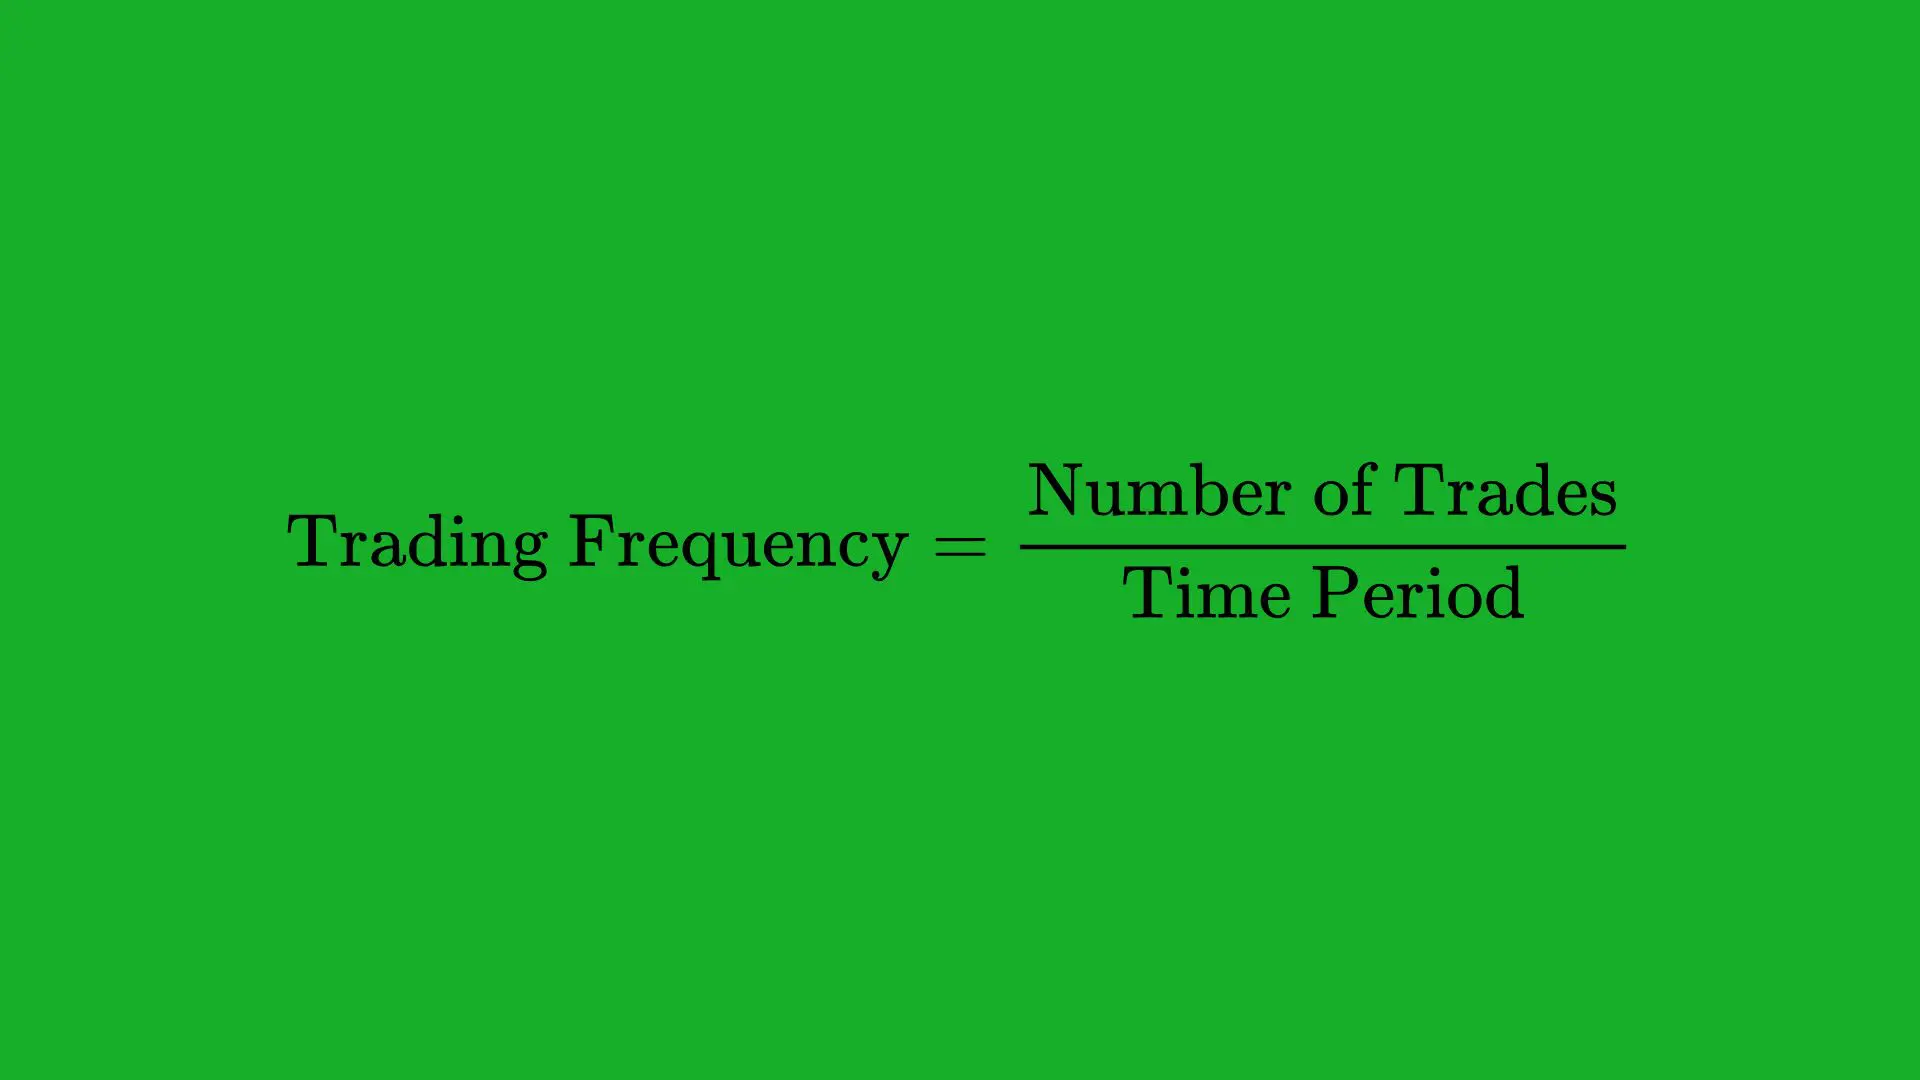
What Is Trading Frequency?
Trading Frequency refers to how often you enter or exit the market. It can be measured as trades per day, trades per week, or trades per month. While not a direct profitability metric, trading frequency heavily influences transaction costs, psychological strain, and the sustainability of your trading.
Why It Matters
- Transaction Costs: Frequent traders can accumulate substantial commissions, fees, and slippage. If your average profit per trade is small but your trading frequency is high, fees can quickly erode profits.
- Emotional Stress: High-frequency strategies demand constant monitoring of the markets, which can lead to psychological fatigue. Over-trading often results in poor decision-making.
- Scalability: If your trading strategy relies on frequent entries and exits, scaling up the strategy (in terms of capital or instruments) might become more difficult due to liquidity constraints.
How to Track and Optimize
- Count Trades: Simply track how many trades you place in a given period.
- Combine With Other Metrics: Compare your frequency with your win rate, average profit per trade, and profitability measures. Sometimes trading less can yield better results if it filters out subpar setups.
- Use Automation: If you employ automated systems, ensure your frequency is aligned with your bandwidth for analysis and execution. This might involve coded filters to reduce over-trading.
Balancing Act
- Low-Frequency (Position/Swing Trading): Fewer trades, potentially larger profits per trade, but you must endure longer holding periods. Can be more emotionally stable, but requires patience.
- High-Frequency (Day Trading/Scalping): Numerous trades, smaller profits per trade, higher fees and potential slippage. Requires strict discipline and robust technology.
Example
Let’s say you realize you’re making 20 trades per day on average as a day trader. While that might be normal for some, you notice that 50% of those trades are impulse trades that occur outside of your best strategy setups. As a result, your overall profitability suffers due to excessive commissions. By cutting down to 10 trades per day and sticking only to high-probability setups, you could see a noticeable improvement in net profits.
Key Takeaway
Trading Frequency is a crucial but often overlooked metric. Striking the right balance—ensuring you’re not missing out on opportunities but also not over-trading—is key to achieving consistent and sustainable performance in the market.
Metric 10: Equity Curve and Growth Rate

What Is the Equity Curve?
Your Equity Curve is a line graph that represents the value of your trading account over time. It’s essentially the running total of your account balance as you book profits and losses on each trade.
Why the Equity Curve Matters
- Visual Overview: An equity curve provides a quick snapshot of your overall profitability and how it evolves over time.
- Psychological Comfort: A steady, upward-trending equity curve can boost confidence, while a wildly fluctuating one can signal issues with risk or strategy.
- Trend Analysis: By analyzing the slope (growth rate) and drawdowns on your equity curve, you can see if your strategy is consistent or prone to high volatility.
Growth Rate
Growth Rate is the speed at which your account is growing (or shrinking). It can be measured daily, weekly, monthly, or annually. For instance, you might express an account’s growth as a percentage gain per month or on an annualized basis.
How to Track Equity Curve and Growth Rate
- Record Each Trade: Update your spreadsheet or trading software after each trade, noting the new account balance.
- Chart the Balance: Use charting tools (even a simple spreadsheet graph) to visualize the account balance over time.
- Calculate Periodic Returns: To measure growth rate, note your starting balance for the period and your ending balance, then compute the percentage difference.
Interpretation
- Smooth Uptrend: Suggests a consistent and profitable strategy with manageable drawdowns.
- Jagged Curve: Indicates volatility. Large spikes can mean big wins but also big losses, which can be psychologically taxing and financially risky.
- Flat Periods: May indicate sideways performance—time to reevaluate whether market conditions have changed or if your strategy needs an adjustment.
Example
Imagine you track your account balance at the end of each week for a year. In the first quarter, the equity curve shows steady growth from $10,000 to $12,000. In the second quarter, you see a fluctuation between $11,500 and $13,500, indicating some volatility. By the year’s end, you land at $15,000. Observing the curve can help you pinpoint exactly when the volatility occurred, perhaps leading you to analyze which trades or market conditions contributed to it.
Key Takeaway
Monitoring your Equity Curve and Growth Rate ties all other metrics together into a cohesive narrative. It’s the final proof of whether your trading approach—balancing risk, reward, frequency, and other factors—is effective over time.
FAQ: Trading Metrics for Success
1. What are trading metrics, and why are they important?
Trading metrics are quantitative measures used to analyze a trader’s performance, risk, and profitability. They help traders identify strengths, weaknesses, and areas for improvement, leading to consistent success.
2. Which trading metric is the most critical to track?
While all metrics have their importance, the combination of Win Rate, Risk-Reward Ratio, and Expectancy provides a comprehensive view of strategy effectiveness.
3. How do I know if my Risk-Reward Ratio is good?
A good Risk-Reward Ratio generally exceeds 1:2, meaning you aim to earn at least $2 for every $1 risked. The ideal ratio depends on your strategy and win rate.
4. What is the difference between the Sharpe Ratio and the Sortino Ratio?
The Sharpe Ratio measures risk-adjusted returns using overall volatility, while the Sortino Ratio focuses only on downside volatility, making it more relevant for traders concerned about losses.
5. How often should I review my trading metrics?
It’s best to review metrics weekly, monthly, and quarterly to monitor progress and adapt to changing market conditions. Frequent reviews help maintain discipline and refine strategies.
6. Can I automate the tracking of trading metrics?
Yes, many trading platforms and journals, such as Myfxbook or Edgewonk, allow for automated metric tracking, saving time and ensuring accuracy.
Conclusion: Building a Metrics-Oriented Trading Mindset

Why a Metrics-Oriented Approach Is Essential
Trading is not just about finding “winning trades” or reading the tape; it’s about consistent performance grounded in data-driven decision-making. When you know your Win Rate, Average Winner vs. Average Loser, Risk-Reward Ratio, Profit Factor, Expectancy, Maximum Drawdown, Sharpe Ratio, Sortino Ratio, Trading Frequency, and Equity Curve/Growth Rate, you have a clear, quantifiable framework for evaluating your strategies.
The Bigger Picture
- Continuous Improvement: Metrics give you benchmarks. You can test changes to your strategy and see if they improve or worsen your performance in a measurable way.
- Emotional Control: Numbers provide objectivity. When trades go wrong, refer to your historical metrics to ground your decisions instead of letting fear or greed take over.
- Risk Management: By focusing on metrics like Maximum Drawdown and Sortino Ratio, you ensure your downside risk stays within comfortable limits. Capital preservation is the backbone of longevity in trading.
- Portfolio and Strategy Diversification: Using metrics, you can determine which strategies perform best under certain market conditions. This knowledge can help you diversify properly and reduce overall portfolio risk.
Action Steps for Traders
- Set Up a Tracking System: Whether it’s Excel, Google Sheets, or specialized trading journal software, make sure you consistently log every trade.
- Regularly Review Metrics: Weekly, monthly, or quarterly, schedule a “metrics review.” Note any drastic changes, and trace them back to specific market conditions or strategic modifications.
- Iterate and Optimize: Use the insights from your metrics to refine your entry and exit criteria, risk management rules, and portfolio allocation.
- Stay Adaptable: Market conditions change (e.g., volatile vs. trending, bullish vs. bearish). Keep tabs on how your metrics shift in different environments, and adapt strategies accordingly.
- Keep Psychological Factors in Check: Metrics are tools, but the trader behind the wheel matters just as much. Maintain discipline, manage emotional swings, and follow a well-defined plan.
Final Thoughts
In the journey towards consistent profitability, knowing your numbers is paramount. By systematically measuring, analyzing, and acting on these 10 essential trading metrics, you set yourself apart from the crowd of traders who rely solely on gut feeling or untested “holy grail” setups. A metrics-oriented approach transforms trading from a gamble into a structured endeavor, offering you the best possible odds of navigating the turbulent waters of the financial markets successfully.
Remember, each trade is a small piece of the broader puzzle. Your ultimate success depends not on any single trade, but on the sum total of your decisions, informed by the metrics that keep you accountable, disciplined, and profitable over the long run. Whether you’re a newcomer or a seasoned trader, integrating these metrics into your routine can profoundly enhance both your trading results and your confidence in the markets.

