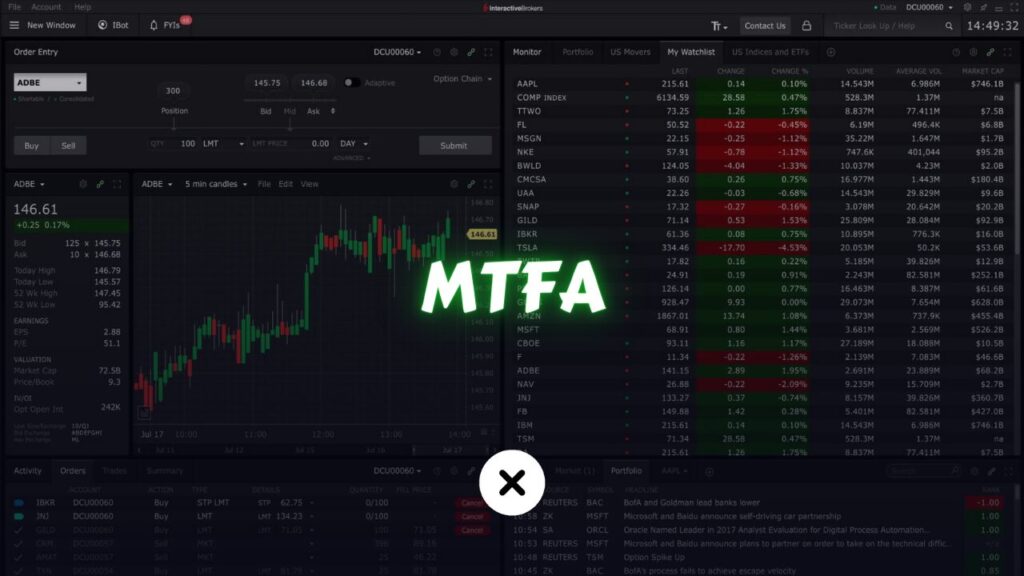
Multi-time frame analysis (often abbreviated as MTF analysis) is a powerful technique used by many successful traders to gain deeper insights into market behavior. By looking at multiple time frames simultaneously, traders can get a broader perspective of price trends, market momentum, and potential trading opportunities.
In this comprehensive guide, we will delve into every aspect of multi-time frame analysis, from basic concepts to advanced strategies. We will explore the importance of multi-time frame analysis, how to choose the appropriate time frames, the step-by-step process of combining them, and much more. Whether you are a novice trader or a professional seeking to refine your approach, this guide aims to help you master multi-time frame analysis and incorporate it seamlessly into your trading strategy.
Table of Contents
What is Multi-Time Frame Analysis?
Defining Multi-Time Frame Analysis
Multi-time frame analysis involves examining the same asset—be it a stock, currency pair, cryptocurrency, or commodity—across multiple time frames (e.g., daily, weekly, monthly charts). The core idea is that each time frame provides a different perspective:
- Shorter time frames (like the 1-minute or 5-minute chart) show immediate price action and short-term trends.
- Medium time frames (like the 1-hour or 4-hour chart) offer a mid-term perspective.
- Longer time frames (like daily, weekly, or monthly charts) reveal the broader, long-term trend and overall market sentiment.
By combining these views, traders can more accurately identify the primary trend, locate ideal trade entries and exits, and manage their risk more effectively. Multi-time frame analysis thus provides a cohesive map of market behavior.
Historical Context
While the concept of multiple time frames is not new, its application has become more accessible with modern charting platforms like TradingView. In the past, traders often relied on printed charts or limited digital data, making it cumbersome to switch between time frames. Today, advanced trading platforms allow you to set up multiple charts side by side, each displaying a different time frame, making multi-time frame analysis more efficient and precise.
Why Multi-Time Frame Analysis is Important

A Broader Perspective
One of the main benefits of multi-time frame analysis is gaining a broader perspective of market conditions. A single time frame can be misleading. For example, you might see a bullish pattern on a 15-minute chart, only to discover that the overall trend on the daily chart is strongly bearish. Having conflicting biases can lead to unprofitable trades and emotional strain.
By examining higher time frames (e.g., daily or weekly), you gain insight into the main direction of the market. Then you can zoom into lower time frames (e.g., 1-hour or 15-minute) to time your entry and exit points in alignment with the bigger trend.
Better Risk Management
When you know the larger trend, you can design your trade entries to align with that trend, reducing the probability of counter-trend trades that carry higher risk. You can also set more meaningful stop-loss levels by looking at key support and resistance zones identified on higher time frames.
Enhanced Trend Confirmation
Multi-time frame analysis helps confirm trends. If multiple time frames are pointing to the same direction—such as bullish signals across weekly, daily, and 4-hour charts—the likelihood of a successful trade in that direction increases. This layered approach acts like a built-in filter, reducing false signals that may appear on a single chart alone.
Refined Entry and Exit Points
Using smaller time frames, traders can fine-tune their entries and exits based on short-term price movements. After identifying the broader trend on higher time frames, you can switch to a lower time frame to pinpoint optimal market entries or early exit signals. This combination improves both risk management and profit potential.
Core Principles of Multi-Time Frame Analysis

1. The Trend is Your Friend
In multi-time frame analysis, the saying “the trend is your friend” applies to each chosen time frame. A trader would ideally look for alignment: if the monthly and weekly charts are showing an uptrend, it might be wise to only seek buying opportunities on lower time frames like the daily or 4-hour chart.
2. Ensure Alignment of Signals
You want signals from multiple time frames to converge. If your higher time frame suggests a bullish trend, but your medium time frame suggests a reversal, that’s a red flag. You might wait for the medium time frame to confirm the higher time frame’s trend before you commit capital.
3. Focus on Relevant Time Frames
Not all time frames are equally relevant to all trading styles. A scalper might use 1-minute, 5-minute, and 15-minute charts, whereas a swing trader might rely on 4-hour, daily, and weekly charts. Focus on time frames that align with your trading goals and strategies to avoid information overload.
4. Consistency in Analysis
Stay consistent in how you analyze time frames. If you evaluate moving averages on one time frame, use them on the other time frames as well to maintain uniformity. This consistency allows you to systematically observe how these indicators behave across different perspectives.
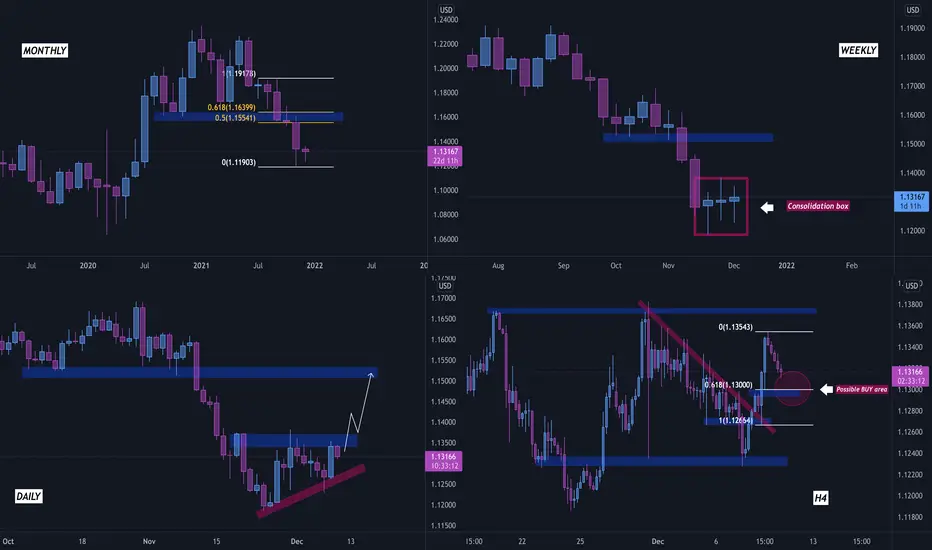
Choosing the Right Time Frames
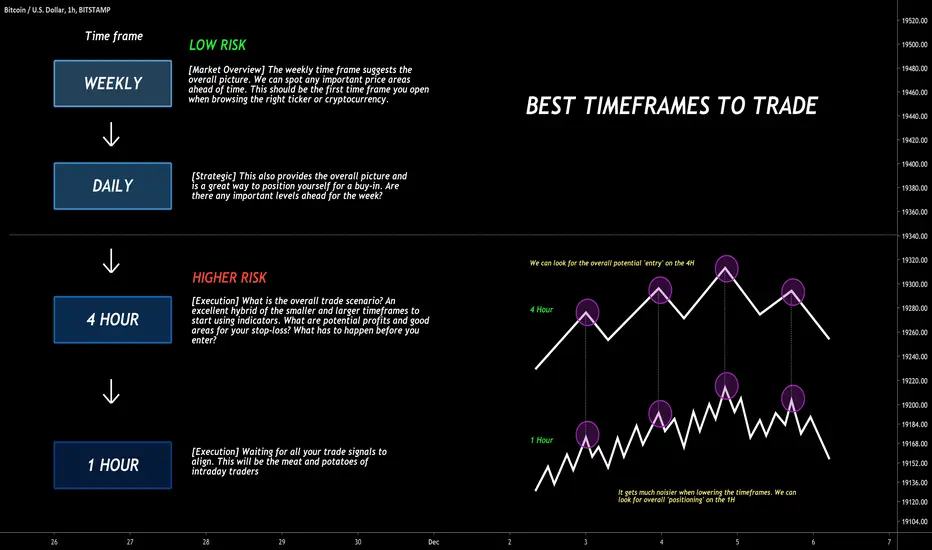
The choice of time frames is crucial, as it directly affects the type of signals you will observe and the trades you will consider. Typically, traders choose three core time frames:
- Long-Term (High Time Frame)
Examples include weekly or daily charts. This time frame helps define the primary trend and key support/resistance levels. - Intermediate-Term (Medium Time Frame)
Examples include 4-hour or 1-hour charts. This is where you refine your view of the trend. You check if the intermediate trend aligns with the primary trend. - Short-Term (Low Time Frame)
Examples include 15-minute or 5-minute charts. These charts help you time your entries and exits with precision.
Matching Time Frames to Your Trading Style
- Scalpers: Tend to use very short time frames like 1-minute, 5-minute, and 15-minute charts.
- Day Traders: Often use 15-minute, 1-hour, and 4-hour charts.
- Swing Traders: Typically analyze 4-hour, daily, and weekly charts.
- Position Traders/Investors: Might focus on daily, weekly, and monthly charts to capture larger price moves.
It’s important to recognize that there is no one-size-fits-all approach. The best time frames are those that align with your trading objectives, risk tolerance, and schedule.
Example of Time Frame Selection
Imagine you are a swing trader who holds positions for a few days to a few weeks. A typical set of charts might be:
- Primary Trend Chart: Weekly.
- Secondary Trend Chart: Daily.
- Entry/Exit Chart: 4-hour or 1-hour.
You would first look at the weekly chart to identify the big picture trend (is the market making higher highs and higher lows or lower highs and lower lows?). Next, you’d refine your analysis on the daily chart, looking for confirmation of that trend or potential reversal signals. Finally, you’d zoom in to the 4-hour chart to time your entry and set precise stop-loss and take-profit levels.
Top-Down vs Bottom-Up Approaches

The Top-Down Approach
The most common method to conduct multi-time frame analysis is the top-down approach. Here’s how it typically works:
- Start with the highest relevant time frame: Identify the overall trend direction, major support/resistance zones, and any key patterns (e.g., head and shoulders, double top, triangle formations).
- Move to a medium time frame: Confirm the trend established in the higher time frame. Look for intermediate patterns and signals that align with the bigger picture.
- Finalize with a lower time frame: Pinpoint precise entry and exit points, or watch for short-term momentum shifts that might signal the best time to enter or exit in accordance with the higher time frame trends.
This approach ensures you are trading in the direction of the dominant trend. It also helps prevent you from getting bogged down by lower time frame “noise” before confirming the overarching market direction.
The Bottom-Up Approach
The bottom-up approach is less common but can be useful under certain circumstances. Traders start with a lower time frame, such as a 15-minute chart, to identify a short-term trend or pattern. Then they move up to higher time frames to see if that pattern is part of a larger move or if it conflicts with it.
While it’s possible to find success using the bottom-up approach, it can be riskier. You may identify a seemingly profitable pattern on a low time frame, only to discover that the overall market structure on a higher time frame is unfavorable. This mismatch often leads to trades that work temporarily but fail to produce significant gains or even result in losses as the larger time frame exerts its influence.
Integrating MTF Analysis into Different Trading Styles
Each trading style—whether day trading, swing trading, position trading, or scalping—can benefit from multi-time frame analysis. The key is to select time frames that complement each style’s objectives and typical holding periods.
Day Trading
- Typical time frames: 1-minute, 5-minute, 15-minute, 1-hour charts.
- Process: A day trader might use the 1-hour chart to identify the near-term trend or key support/resistance, then switch to 5-minute or 15-minute charts to zero in on entries and exits.
- Example: If the 1-hour chart shows an uptrend, the day trader looks for bullish patterns (like higher lows) on the 5-minute chart to time an entry.
Swing Trading
- Typical time frames: 4-hour, daily, weekly.
- Process: Swing traders start with the weekly chart for the big picture, move to the daily for clarity on trends and patterns, and then use the 4-hour chart to time their trades.
- Example: If the weekly chart shows a strong uptrend, the daily chart might confirm a pullback to a support level, and the 4-hour chart can show the exact entry point once the price forms a bullish candlestick pattern.
Position Trading
- Typical time frames: Daily, weekly, monthly.
- Process: Position traders are more concerned with macro trends and fundamental factors. They use daily charts to monitor shorter-term fluctuations, weekly charts to confirm mid-term trends, and monthly charts to identify very long-term support/resistance and trend directions.
- Example: A position trader might watch for a multi-month ascending channel on the weekly chart, confirm it on the monthly chart, and look for a breakout on the daily chart as an entry signal.
Scalping
- Typical time frames: 1-minute, 5-minute, 15-minute.
- Process: Scalpers need very quick entries and exits, so they rely on the 1-minute or 5-minute chart for actual trades. They might glance at the 15-minute chart to confirm micro-trends or short-lived momentum shifts.
- Example: If the 15-minute chart shows a strong bullish momentum, the scalper might jump down to the 1-minute chart to find a quick pullback entry.
Technical Indicators for Multi-Time Frame Analysis
A range of technical indicators can be used effectively in multi-time frame analysis. However, their utility lies in how consistently you apply them across the different time frames. Below are some of the most common indicators and tools.
Moving Averages
Moving averages (MAs) are a foundational tool for identifying trend direction and strength. Common types include:
- Simple Moving Average (SMA)
- Exponential Moving Average (EMA)
How to Use:
- Identify the trend on a higher time frame using a 50-day or 200-day SMA or EMA.
- On a medium time frame, watch how the price interacts with the moving average: above it (uptrend) or below it (downtrend).
- On a lower time frame, look for crossovers or bounces off the moving average for precise entries.
MACD (Moving Average Convergence Divergence)
MACD is a momentum indicator that tracks the relationship between two moving averages of a security’s price. It consists of the MACD line, Signal line, and a histogram.
How to Use:
- On higher time frames (like daily or weekly), use MACD to confirm the overall trend direction. If MACD is above zero, it indicates bullish momentum; below zero indicates bearish momentum.
- On lower time frames (like 4-hour or 1-hour), use MACD crossovers or divergences to time entries.
RSI and Stochastics
Relative Strength Index (RSI) and Stochastic Oscillator are common indicators for gauging overbought or oversold conditions.
How to Use:
- Check if the weekly RSI is in overbought territory (>70) or oversold territory (<30).
- If the higher time frame RSI indicates a bullish environment but the lower time frame RSI is oversold, it could be an ideal time to enter a long position.
Support and Resistance Levels
Support and resistance levels tend to be more reliable on higher time frames because they represent significant market consensus points.
How to Use:
- Identify major support and resistance zones on a daily or weekly chart.
- Drop to an hourly or 15-minute chart to watch how the price behaves around these levels.
- Look for candlestick patterns like pin bars, engulfing bars, or doji candles that confirm a bounce or break near these zones.
Candlestick Patterns
Candlestick patterns offer visual cues about market sentiment and potential reversals. Common patterns include:
- Doji
- Hammer
- Shooting Star
- Engulfing Patterns
How to Use:
- On a higher time frame, spot overall trend and potential reversal zones.
- On a lower time frame, look for candlestick confirmation to time entries or exits, especially around higher time frame support/resistance.
Step-by-Step Example of MTF Analysis
Let’s walk through a simplified step-by-step example of how a trader might conduct multi-time frame analysis for a swing trade. Assume we’re looking at a popular stock (e.g., Apple Inc.):
- Long-Term Trend (Weekly Chart)
- Pull up the weekly chart to identify the broader trend.
- Notice that the stock has been making higher highs and higher lows for several months. The 50-week moving average is sloping upward.
- This indicates a strong bullish trend.
- Intermediate Trend (Daily Chart)
- Switch to the daily chart to observe any short-term corrections or consolidations.
- You see a recent pullback from a local high, retracing around 38.2% of the latest leg up (using Fibonacci Retracement).
- You also identify a support level that coincides with the 50-day moving average.
- Entry Signal (4-Hour Chart)
- Zoom in to the 4-hour chart to look for a precise entry.
- Price is hovering around the support level seen on the daily chart.
- The RSI on the 4-hour chart shows oversold conditions, and a bullish engulfing candle forms, indicating a potential move higher.
- Placing the Trade
- Based on the alignment across weekly, daily, and 4-hour charts, you decide to go long.
- Set a stop-loss just below the identified support on the daily chart to protect against a deeper retracement.
- Establish a take-profit target aligned with the previous swing high, adjusting risk/reward to an acceptable ratio (e.g., 1:2 or 1:3).
- Trade Management
- Monitor the position on the daily chart for broader trend updates.
- If the price breaks through another resistance level confirmed on the weekly chart, consider partial profit-taking or tightening your stop-loss.
- Continue to check the 4-hour chart for signs of momentum weakening, such as bearish divergences on MACD or RSI.
Through this step-by-step approach, you seamlessly integrate multiple time frames into a cohesive strategy, aligning your entries and exits with the overall market narrative.
Risk Management and Position Sizing

A robust trading strategy is incomplete without a clear risk management plan. Multi-time frame analysis can guide you to better risk management in several ways:
- Stop-Loss Placement: By identifying major support/resistance on higher time frames, you can place your stop-loss orders with more confidence and less guesswork.
- Position Sizing: Knowing the volatility levels on different time frames can help you decide how large or small your position should be. For instance, if the daily chart shows larger average true range (ATR) compared to the weekly, you might adjust your position size accordingly.
- Risk-to-Reward Ratio: By aligning your take-profit levels with higher time frame resistance (for a long trade) or support (for a short trade), you can more accurately gauge potential reward relative to your risk.
Practical Example
If you notice that the weekly support level for a stock is $100 and your entry is at $110, you might place your stop-loss just below $100 (e.g., at $98 or $99). Meanwhile, your take-profit could be at $130 if the next major resistance on the weekly chart is around that area. Hence, your risk per share is roughly $12, with a potential reward of $20, resulting in a favorable risk-to-reward ratio of about 1:1.67.
Common Pitfalls and Mistakes
1. Overcomplicating the Analysis
Traders often fall into the trap of watching too many time frames—like 8 or 10 different charts. This can lead to “analysis paralysis,” where too much conflicting information results in indecision or missed opportunities. Stick to two or three well-chosen time frames that match your style.
2. Ignoring High Time Frame Trends
Some traders get enamored with short-term price action and forget to check the higher time frames. Entering trades that go against the weekly trend when you’re trading on a daily chart can lead to consistent losses.
3. Poorly Aligned Indicators
Using conflicting indicators across different time frames can create confusion. If you rely on moving averages to gauge trends on the daily chart but switch to entirely different indicators (like Bollinger Bands or Ichimoku) for the 4-hour chart, you might miss out on synergy and clarity.
4. Emotional Trading
Even with a solid multi-time frame analysis, emotional biases like fear or greed can tempt traders to deviate from their plan. Sticking to a well-defined strategy and risk management plan is crucial for success.
5. Neglecting Fundamental Factors
While technical analysis is vital, ignoring fundamental news and data—especially for stocks or currencies—can be dangerous. Sudden earnings announcements, economic reports, or geopolitical events can override even the best technical setups.
Real-World Examples
1. Stock Market Example
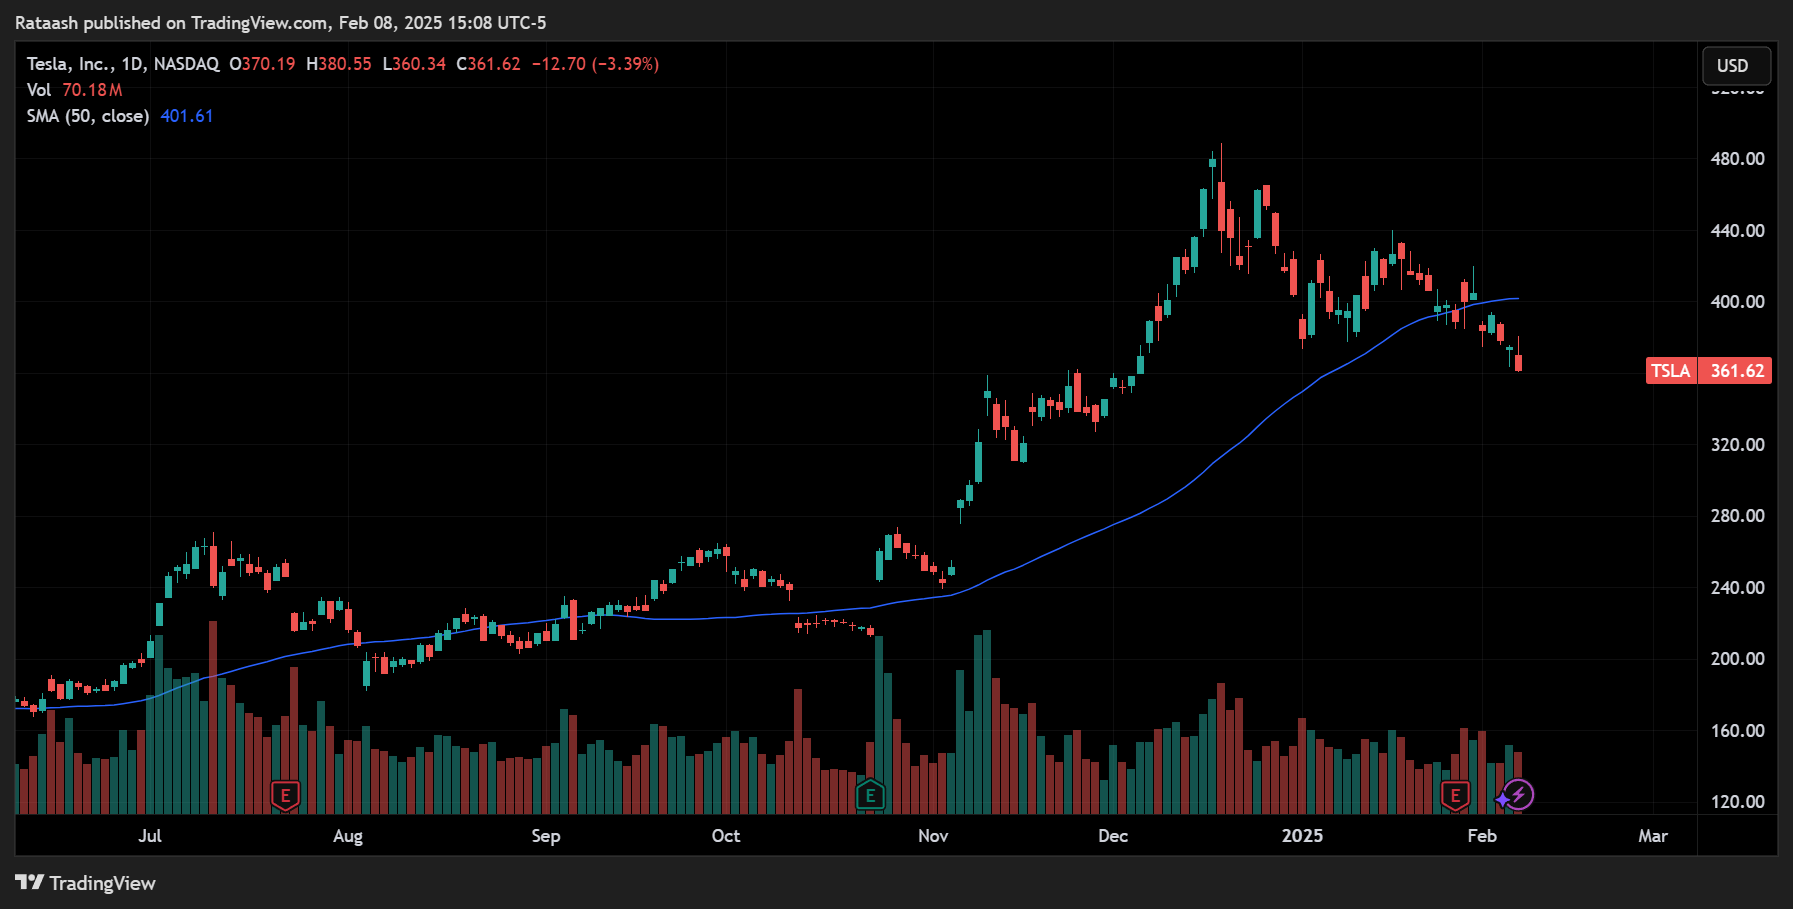
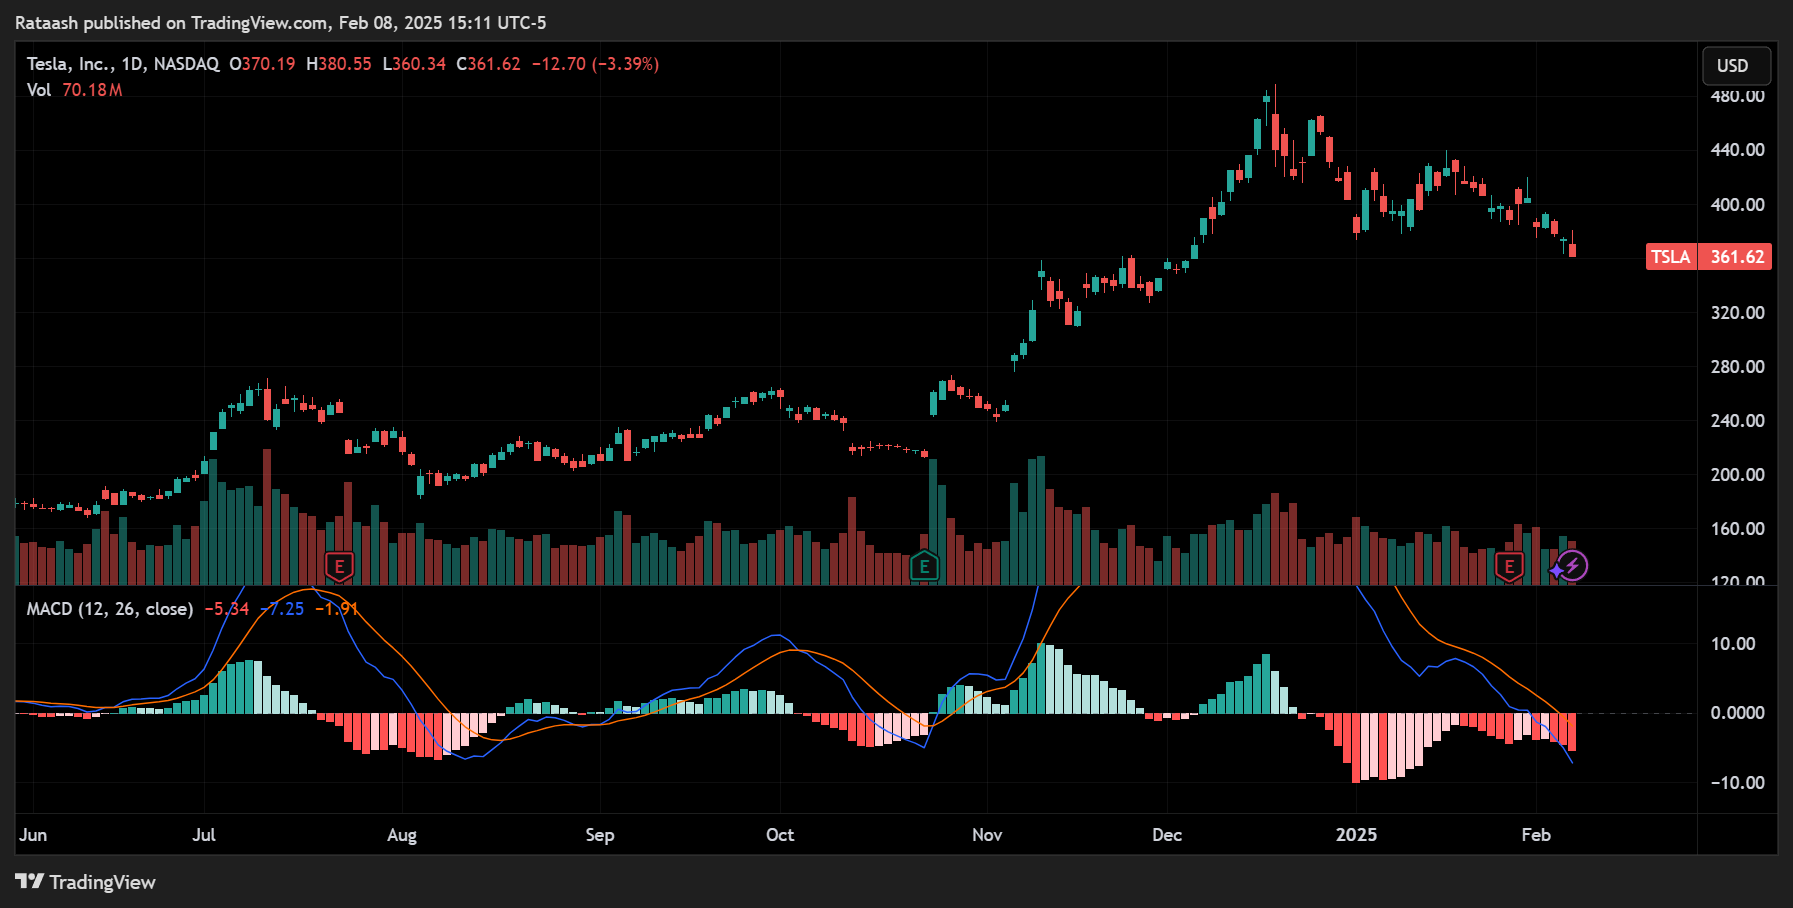
Scenario: A trader is analyzing Tesla (TSLA) for a swing trade.
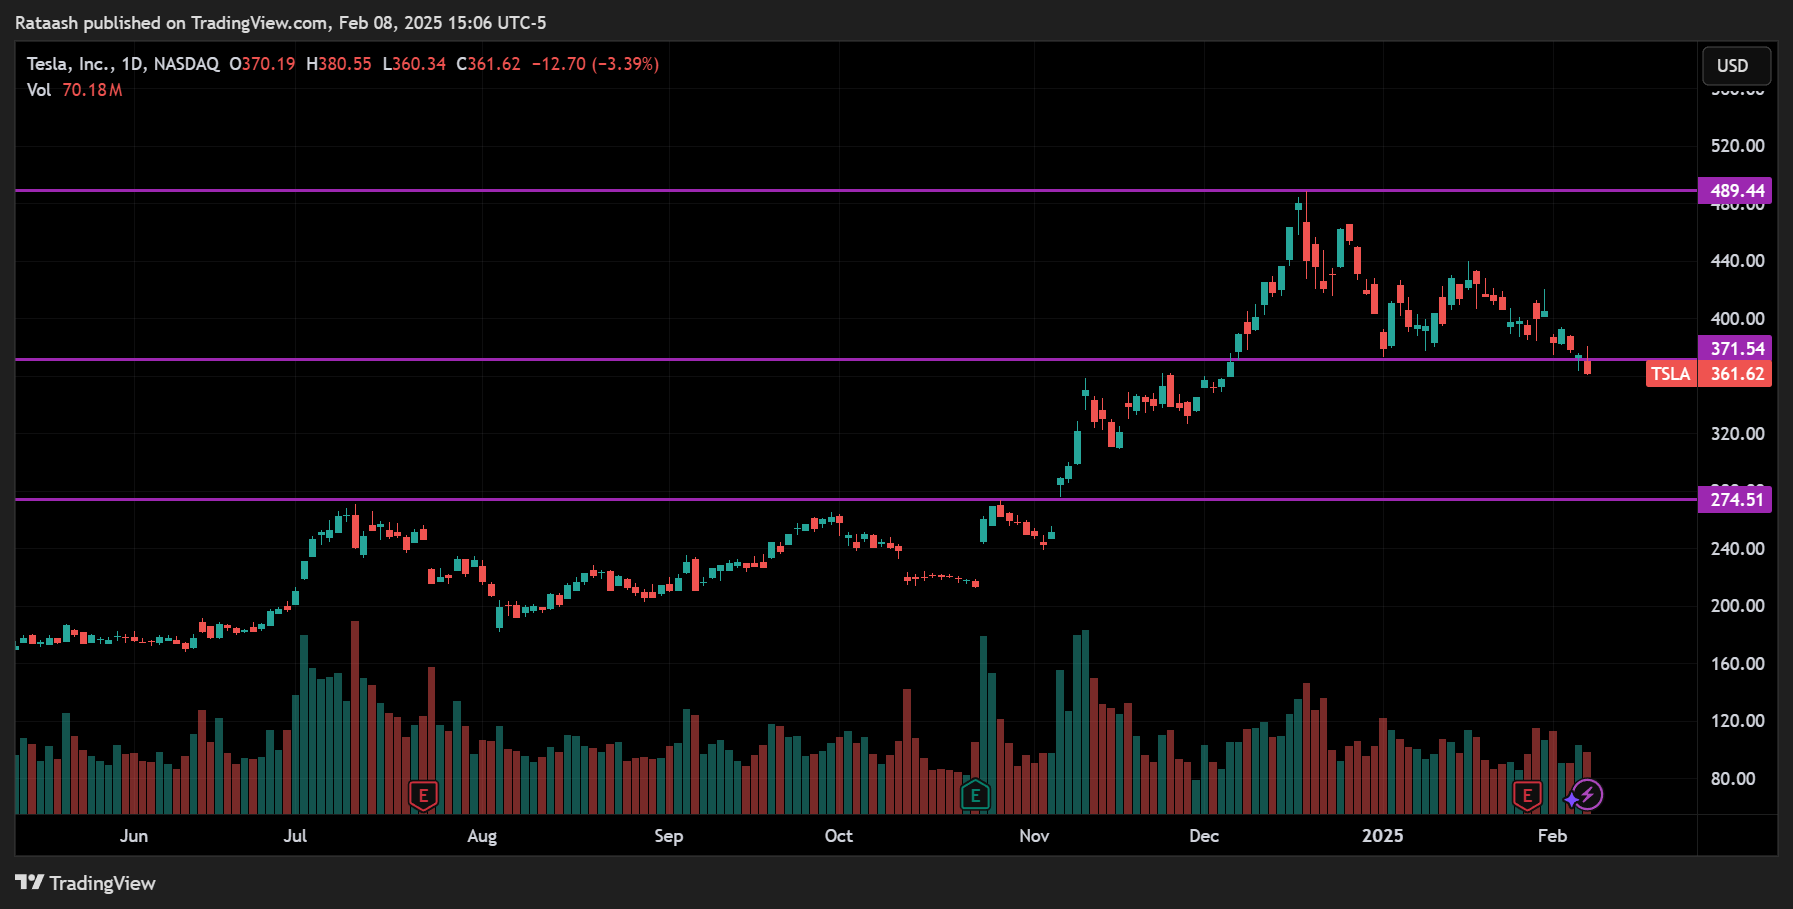
- Weekly Chart: The trader observes a clear long-term uptrend with higher highs, supported by an upward-sloping 50-week moving average.
- Daily Chart: The stock recently pulled back to a strong support level around a former breakout point.
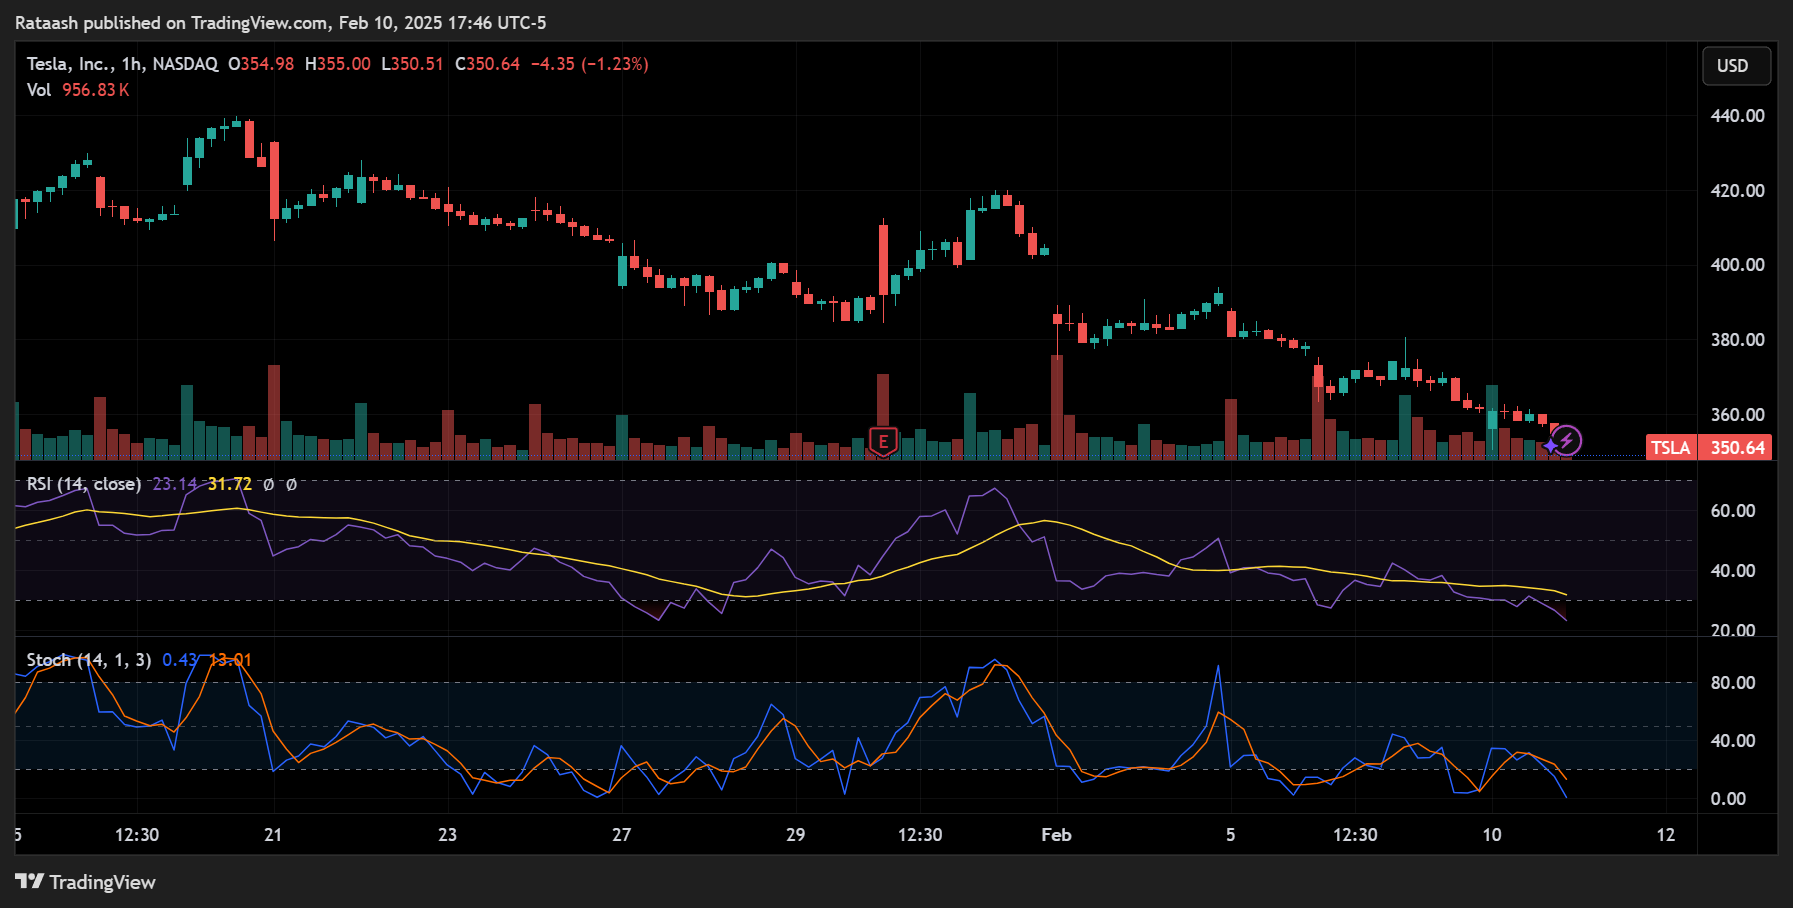
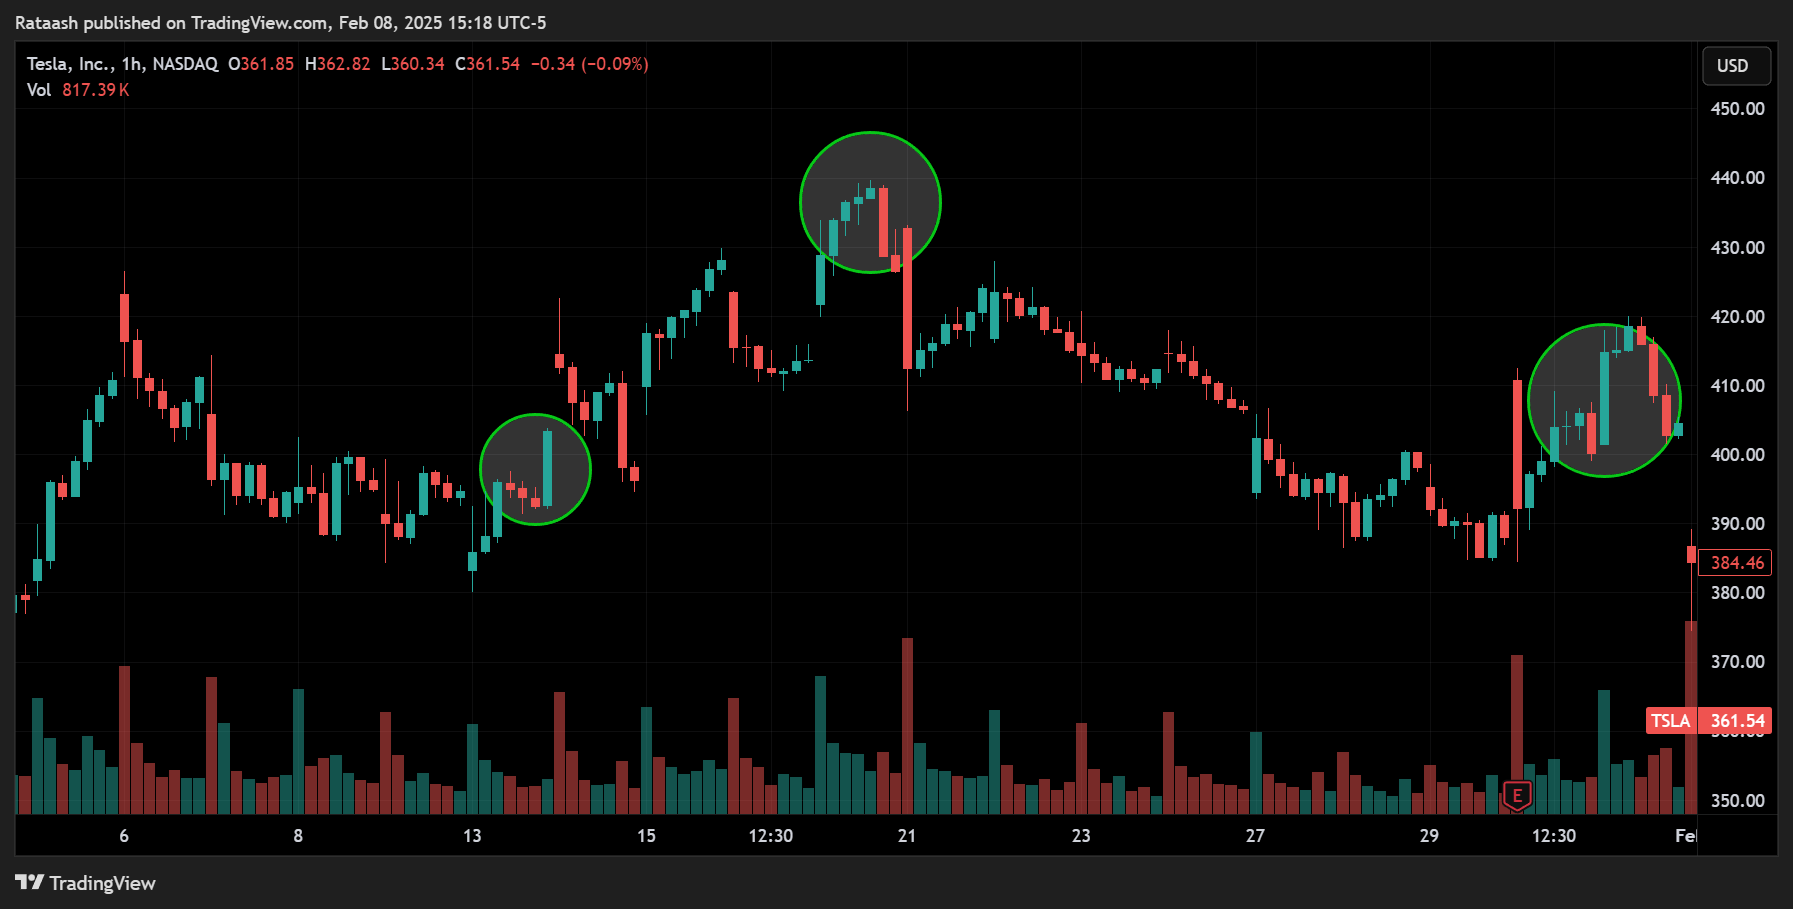
- 4-Hour Chart: The trader notices a bullish engulfing candle forming, with RSI climbing from oversold territory.
- Trade Decision: The trader goes long, aligning all three time frames and placing a stop-loss under the daily support level.
2. Forex Market Example
Scenario: A trader is interested in trading the EUR/USD currency pair on a short-term basis.
- Daily Chart: Shows a long-standing downtrend, with the price making consistent lower highs.
- 4-Hour Chart: Price briefly rallied but formed a double-top, suggesting the correction may be over.
- 1-Hour Chart: The pair broke below a key support line, giving a sell signal.
- Trade Decision: The trader shorts EUR/USD, setting a stop-loss above the 4-hour double-top and a take-profit at a daily support zone.
3. Cryptocurrency Example
Scenario: A trader wants to catch a short-term move in Bitcoin (BTC).
- Weekly Chart: Shows a long-term uptrend, but with substantial volatility around certain price levels.
- Daily Chart: Bitcoin has been consolidating in a sideways range, forming a triangle pattern.
- 4-Hour Chart: Breaks out from the triangle with high volume, and RSI signals strong momentum.
- Trade Decision: The trader buys Bitcoin, placing a stop-loss below the breakout area on the 4-hour chart, and targets a level identified on the daily chart as the next resistance.
Tips for Effective Multi-Time Frame Trading
- Start with Fewer Time Frames
Begin with two time frames (e.g., daily and 4-hour) if you are new to multi-time frame analysis. Add a third time frame once you feel comfortable. - Use Confluence
Look for multiple signs of confirmation—such as a bounce off a moving average, a support/resistance zone, and an oversold RSI reading across two or more time frames. - Maintain a Trading Journal
Record every trade setup, including insights from all chosen time frames. This helps you understand what works best for your style and refine your strategy over time. - Set Alerts
Most modern trading platforms allow you to set alerts when price crosses specific levels. This is particularly helpful if you need to monitor multiple charts. Setting alerts ensures you don’t miss crucial entry/exit signals. - Stay Disciplined
Have a clear trading plan that specifies how you will use each time frame. Avoid deviating from your plan under emotional pressure or market noise. - Check News and Fundamentals
Significant news events can overshadow technical signals, especially in forex or stocks around earnings season. Always be aware of major economic releases or company announcements. - Practice with Demo Accounts
If you’re new to multi-time frame analysis, consider practicing on a demo account. This allows you to refine your approach without risking real capital. - Learn to Spot Trend Changes Early
Pay attention to smaller time frames for clues of a potential trend reversal that might later appear on higher time frames. This can help you exit trades earlier or reverse your bias in time. - Use Tools Wisely
Avoid adding too many indicators. Strive for a clean chart that focuses on key metrics or tools you truly understand and trust. - Periodically Review Higher Time Frames
Even if you primarily trade off a 15-minute or 1-hour chart, glance at the daily or weekly chart regularly to see if any major trend shifts are underway.
Conclusion
Multi-time frame analysis is a robust method that grants traders deeper insight and higher confidence in their trading decisions. By layering perspectives from higher, medium, and lower time frames, you can better align your trades with dominant market trends, refine your entries and exits, and effectively manage risk.
- Alignment: Always ensure that your chosen time frames align well with your trading style. Scalpers typically stick to lower time frames, whereas swing or position traders look at higher time frames.
- Consistency: Apply your indicators and methods consistently across all charts to avoid confusion.
- Confirmation: Seek multiple forms of confirmation—moving averages, RSI, MACD, candlestick patterns, or support/resistance—to validate trade setups.
- Risk Management: Use multi-time frame analysis to identify stronger support/resistance for stop-loss placement and to set realistic profit targets.
By following the principles outlined in this guide, you can begin or continue your journey toward mastering multi-time frame analysis. Over time, the integration of this technique into your trading strategy can significantly improve your probability of success, helping you catch more accurate signals and avoid costly pitfalls. Whether you are a short-term scalper or a long-term position trader, multi-time frame analysis offers a comprehensive view that can boost the effectiveness of any trading strategy.
Final Thoughts
Remember that trading involves probabilities, not certainties. Multi-time frame analysis is not a magic bullet but rather a tool to enhance your decision-making process. Combine it with disciplined risk management, a solid understanding of market psychology, and ongoing practice. Continual learning and adaptation are key in the ever-evolving financial markets. By thoroughly mastering multi-time frame analysis, you’ll stand a far better chance of achieving consistent profitability and long-term success in your trading endeavors.