Volume-Weighted Average Price (VWAP) is a widely recognized technical analysis tool that traders and investors use to gauge the average price at which a security (typically a stock) has traded throughout the day, based on both volume and price. When used effectively, VWAP can help identify trading opportunities, measure market sentiment, and guide execution strategies. In this comprehensive guide, we will explore everything you need to know about the VWAP indicator—from its underlying concept and calculation, to practical applications, risk management considerations, and how it compares to other popular technical indicators. By the end of this article, you’ll have all the information you need to harness the full potential of the VWAP indicator in your trading endeavors.
Table of Contents
Understanding the Volume-Weighted Average Price (VWAP)
Before diving into the calculations and applications of VWAP, let’s start by understanding its basic definition and why it matters in stock trading.
Definition:
The Volume-Weighted Average Price (VWAP) is a single-day indicator that calculates a stock’s average price by weighting each price point by the volume traded at that price. In simpler terms, it tells you where most of the trading occurred at a fair average price, considering how many shares were exchanged at each price level during the day.
Historical Background:
VWAP was first introduced as an institutional trading benchmark in the late 1980s. Large trading firms, mutual funds, and pension funds needed a fair reference point to evaluate how well their trades were executed relative to the day’s overall price activity. Over time, retail traders also adopted VWAP because it provides a clear, data-driven picture of a stock’s intraday trend and potential support/resistance points.
Relevance in Trading:
- Price Benchmark: VWAP gives traders an idea of whether the stock is trading above or below its “fair” average price.
- Execution Quality: Institutional traders often compare their fill prices to VWAP to measure how well they executed large orders.
- Support/Resistance: Many traders see VWAP as a dynamic support or resistance level, because large institutions watch it too.
- Market Sentiment: Price action relative to the VWAP line can be indicative of bullish or bearish sentiment intraday.
By understanding VWAP, traders can gain insights into intraday trends that they might miss by simply looking at candlesticks or other simple moving averages.
How Does the VWAP Indicator Work?
The VWAP indicator works by combining price data with trade volume. Consider each trade as having two components:
- The trade price
- The size (or volume) of that trade
While a simple average price (like an arithmetic mean of prices) gives equal weight to every price point, VWAP places heavier weight on prices where more volume has transacted. So, if a large number of shares trade at a particular price, that price will heavily influence the final VWAP figure for the day.
Intraday Cumulative Calculation:
- Throughout the trading day, with each new trade or each new time interval (often on a per-minute basis), VWAP is recalculated cumulatively.
- At the start of the trading session, VWAP begins with the first trade of the day. As more trades execute, the volume and price of each trade are factored into the running calculation.
- By the end of the day, the VWAP reflects a comprehensive volume-weighted average price for all intraday price action.
Why It Matters:
- The VWAP visually shows you how the “fair price” of a stock evolves intraday as more trades are executed.
- A consistent slope upward may confirm a bullish intraday trend, while a downward slope often signifies a bearish intraday environment.
In essence, the VWAP indicator works as a lens through which you can evaluate intraday price moves in the context of volume, rather than relying on price alone.
The Importance of VWAP in Stock Trading
VWAP is used extensively by both large institutions and individual traders. Here are some of the main reasons it has become such a cornerstone in technical analysis:
- Fair Price Analysis:
VWAP gives you a straightforward view of the “fair” or “consensus” price for a stock throughout a session. If a stock is trading above VWAP, that indicates bullish momentum. Conversely, trading below VWAP suggests bearish momentum. - Benchmarking Trades:
- Institutional desks often judge the performance of their trading algorithms by comparing their average fill price against the day’s VWAP. Executing buys below VWAP or sells above VWAP is typically seen as favorable, indicating better-than-average execution.
- Retail traders can similarly use VWAP to gauge if they got a good fill price.
- Support and Resistance Identification:
VWAP can act as a dynamic support or resistance level. Many algorithmic programs are coded to buy near or below VWAP and sell near or above VWAP, which can amplify price reactions around the VWAP line. - Short-Term Trend Confirmation:
VWAP lines often exhibit smooth, responsive movements that confirm short-term trends more reliably than simple or exponential moving averages. The heavier weighting on high-volume price points tends to reduce the noise that sometimes accompanies solely price-based indicators. - Risk Management:
Since VWAP is a single-day indicator, intraday traders use it to set stop-loss orders, identify pivot points, and manage trades. A break below VWAP might prompt a trader to exit a long position, or a bounce off VWAP might be an entry signal.
Overall, VWAP serves as a critical piece in the puzzle of technical and intraday trading analysis, especially for those looking to confirm price trends and enter trades at potentially more advantageous prices.
Calculating VWAP: A Step-by-Step Guide
Although most trading platforms automatically calculate and plot VWAP for you, understanding how it’s derived can provide deeper insights into its strengths and limitations. Here’s the step-by-step breakdown:
1. Define Your Time Frame
VWAP is typically calculated from the market open until the current time within the same trading day. Each interval can be 1 minute, 5 minutes, or any intraday increment that suits your strategy, although 1-minute or even tick-based intervals are quite common for accuracy.
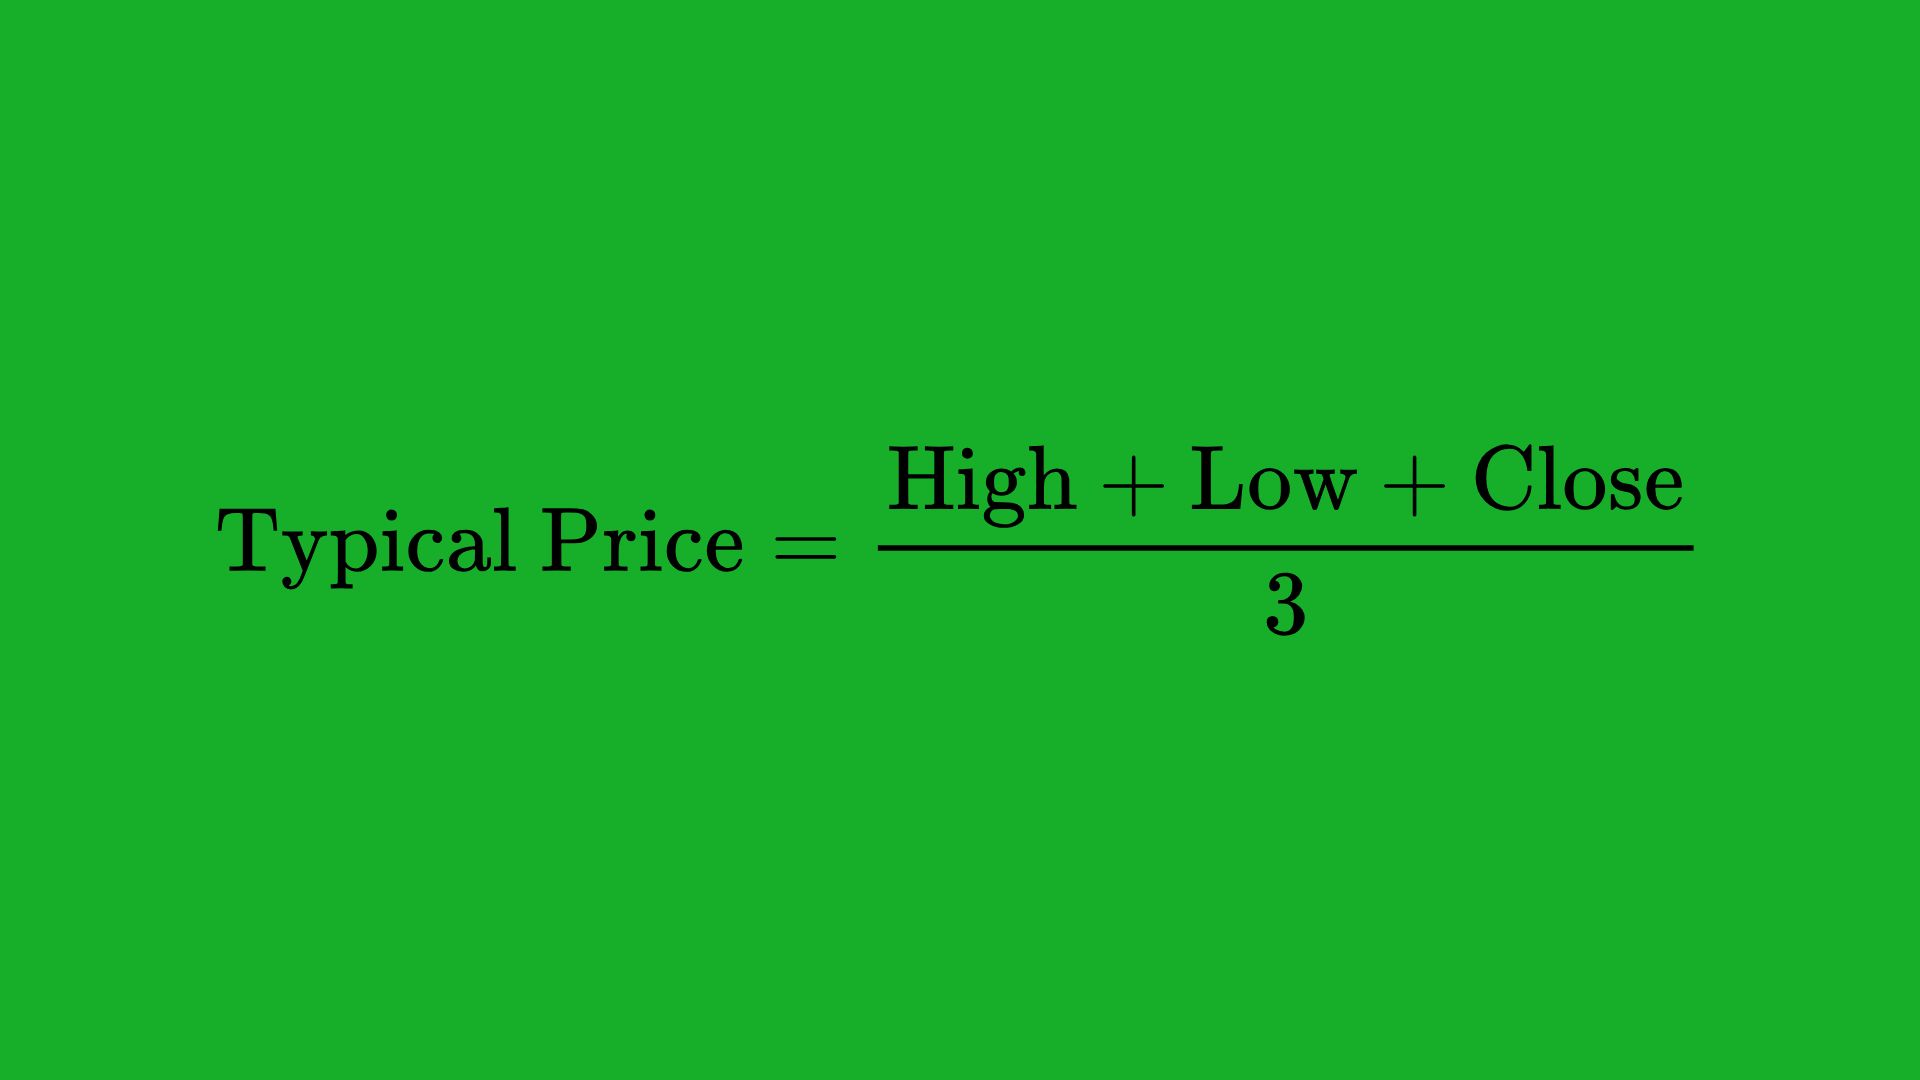
2. Calculate the Typical Price for Each Interval
The typical price (TP) is generally the average of the high, low, and close prices for that interval:
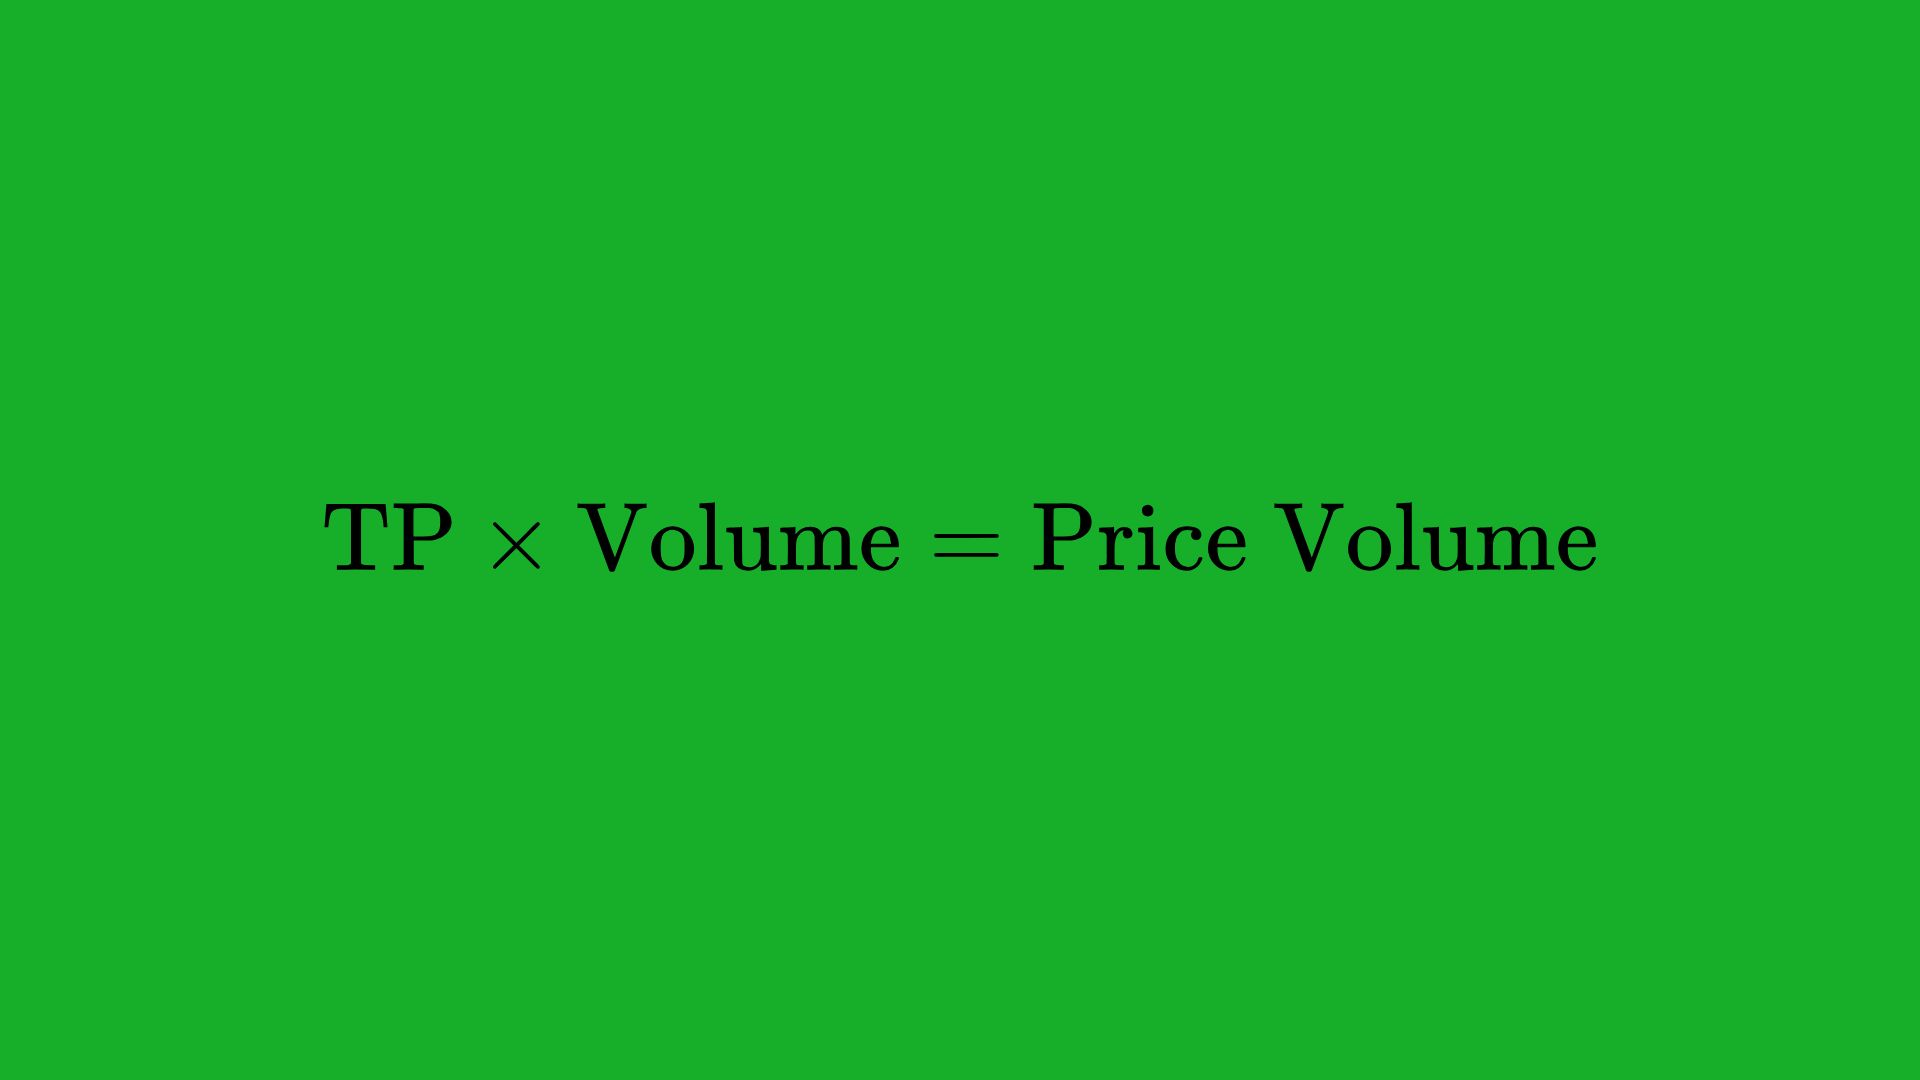
3. Multiply the Typical Price by Volume
For each interval, multiply the typical price by the volume for that interval:
4. Create a Cumulative Sum
Keep a running total (cumulative sum) of both the Price Volume and the Volume from the start of the day up to each interval.
5. Divide the Cumulative Price Volume by the Cumulative Volume
For interval ii, the VWAP is:
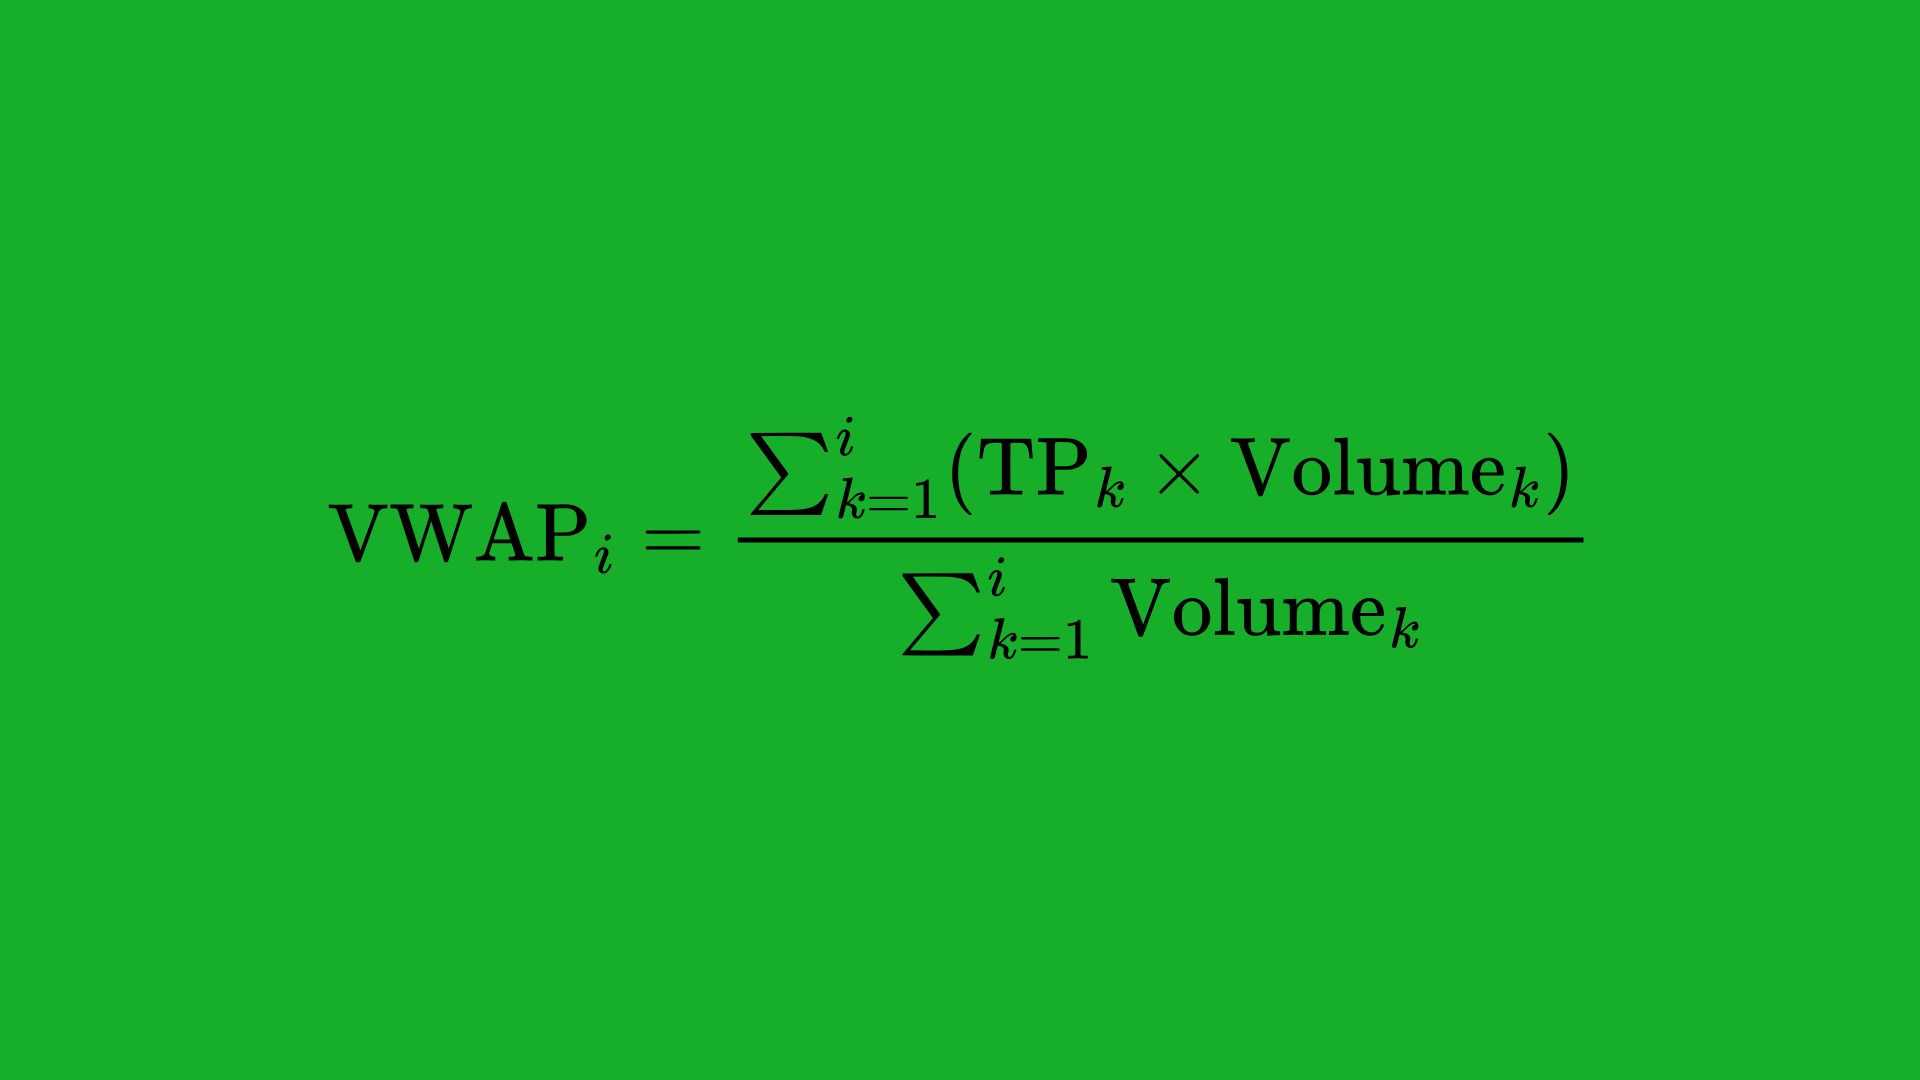
6. Plot or Display the Results
The running VWAP value is typically plotted on a chart as a line that updates with each new interval, providing a continuous intraday reference.
An Example of VWAP Calculation
Suppose you have 5-minute intervals. For interval 1 (the first 5 minutes of the trading day):
- High = $100, Low = $99, Close = $99.5
- Volume = 10,000 shares
- Typical Price = (100 + 99 + 99.5) / 3 = 99.5
Price Volume = 99.5 × 10,000 = 995,000
At the second 5-minute interval, you add the new Price Volume and Volume to your cumulative totals and then compute the ratio. As each interval passes, the new VWAP data point is calculated cumulatively, tracking the day’s evolving volume-weighted average price.
Intraday vs Multi-Day VWAP
Intraday VWAP:
- Reset Each Day: Traditionally, VWAP is calculated fresh at the start of each trading day because it’s designed to give a day-specific benchmark.
- Short-Term Focus: Most day traders and intraday scalpers focus on intraday VWAP because it’s highly responsive to immediate market conditions.
Multi-Day VWAP:
- Extended Calculation: Some traders choose to extend VWAP over multiple days. This can be done by continuously summing volume and price-volume data without resetting each day.
- Different Perspective: A multi-day VWAP might provide a broader trend perspective but dilutes the intraday responsiveness.
- Institutional Use Cases: Big funds executing large orders over several days might refer to multi-day or even anchored VWAP calculations for strategic decisions.
For most traders—especially day traders—intraday VWAP remains the gold standard. If you’re a swing trader, multi-day or anchored VWAP (discussed later) might provide more relevant insights into price averages over longer periods.
Common VWAP-Based Strategies
VWAP can be employed as both a standalone indicator or combined with other technical tools. Below are some popular strategies used by both retail and professional traders.
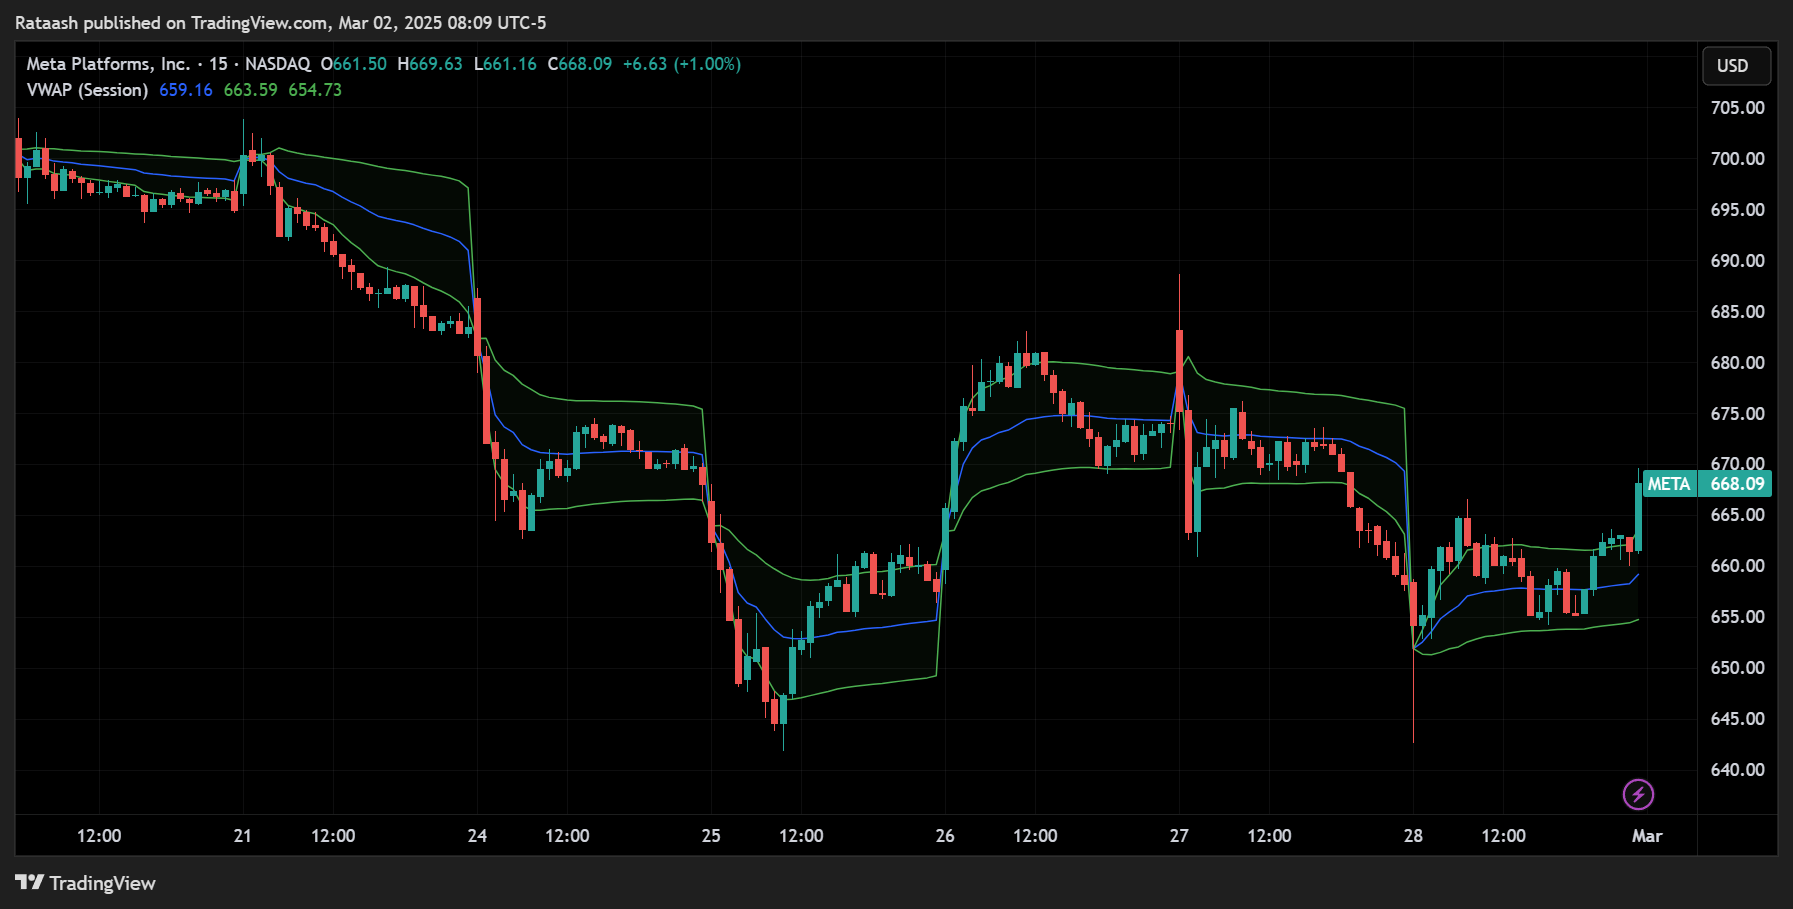
VWAP as a Support and Resistance Indicator
- Above VWAP (Bullish): When the price is consistently trading above VWAP, it suggests buying pressure dominates, and the VWAP often acts as a support level.
- Below VWAP (Bearish): Conversely, if the price remains below VWAP, it often indicates selling pressure, making the VWAP line a potential resistance zone.
Trade Example:
- If a stock is trading above VWAP and pulls back to VWAP, some traders will look to buy at or near the VWAP line, expecting a bounce.
- Similarly, if the stock rallies up toward VWAP from below, short sellers might use it as a potential entry, anticipating that the resistance holds.
Mean Reversion Using VWAP
Mean reversion strategies assume that the price tends to revert to its average or “fair” price. For intraday traders:
- Identify Extremes: Look for price to deviate significantly from VWAP.
- Entry Signal: Enter a trade when you see signs that the price has started to revert back toward VWAP, such as a shift in momentum or a reversal candlestick pattern.
- Profit Target: Usually, the mean (VWAP) is the profit target.
This strategy is particularly common in choppy or range-bound market conditions.
VWAP Breakouts
Traders also look for breakouts above or below the VWAP line:
- Bullish Breakout: Price crossing and holding above VWAP can signal a potential intraday uptrend. Traders may enter a long position with the VWAP line serving as a support reference for stop-loss placement.
- Bearish Breakdown: Price breaking below VWAP (after trading above it) can signal a possible trend shift to the downside.
Execution Strategies and Algorithms
Many institutional trading algorithms incorporate VWAP in different ways:
- VWAP Execution (VWAP Algo): The algo tries to execute large orders in such a way that the final execution price is close to the day’s VWAP.
- Guaranteed VWAP: Some brokers offer “Guaranteed VWAP” executions to their clients, essentially promising to fill an order at or better than VWAP.
For retail traders, understanding how VWAP algos function can provide an edge—being mindful of when large institutional orders are likely to transact near the VWAP line.
Comparing VWAP to Other Indicators
VWAP is often compared to common moving averages and volume-based tools. Here’s how it stacks up:
Simple Moving Average (SMA) vs VWAP
- SMA: Calculates the average price of a security over a specific number of periods (e.g., 20 periods).
- VWAP: Averages price over one trading day, weighting each price by its traded volume.
Key difference: The SMA doesn’t account for how many shares are traded at each price, whereas VWAP does. This makes VWAP more responsive to price levels that experience higher trading activity.
Exponential Moving Average (EMA) vs VWAP
- EMA: Puts more weight on recent price data, adapting more quickly to price changes than an SMA.
- VWAP: Focuses on volume weighting rather than time weighting.
Key difference: Both EMA and VWAP are more responsive than an SMA, but in different ways—EMA emphasizes recent prices, while VWAP emphasizes high-volume price points.
Volume Profile vs VWAP

- Volume Profile: Shows the amount of volume traded at specific price levels over a given period, often displayed as a histogram on the chart’s vertical axis.
- VWAP: A single line that represents an average price for the day, weighted by volume.
Key difference: Volume Profile reveals exactly how much volume occurred at each price level, offering broader context of support/resistance. VWAP is more like a rolling benchmark that aggregates all intraday trading into a single average line.
Practical Tips for Using VWAP
- Pair VWAP with Other Indicators: Although VWAP can stand alone, many traders also look at Relative Strength Index (RSI), Moving Averages, or candlestick patterns for additional confirmation.
- Focus on High Volume Periods: VWAP is particularly useful during times of high trading activity (like market open), as large volume trades will push the VWAP in a meaningful way.
- Avoid Low Volume Stocks: In thinly traded securities, VWAP can become less reliable because each trade can disproportionately shift the line.
- Consider Time of Day: The first and last hours of trading often see higher volumes, which can move VWAP considerably.
- Recalibrate at the Open: Remember that VWAP resets daily, so you’ll have to pay close attention to how the VWAP develops within the first minutes or hours of a new trading session.
Risk Management and VWAP
Even though VWAP can provide valuable insights, prudent risk management remains crucial. Here are some ways to integrate VWAP into your risk management approach:
- Setting Stop-Loss Levels:
- If you’re going long above VWAP, consider placing a stop-loss slightly below the VWAP line. If the stock falls significantly below VWAP, it may indicate a change in intraday sentiment.
- For short trades below VWAP, a stop-loss slightly above VWAP can serve as a protective measure.
- Position Sizing:
- Because VWAP is volume-weighted, sudden spikes or drops in volume can shift the VWAP line quickly during volatile sessions. Adjust your position size to account for potentially larger intraday price swings.
- Avoid Over-Leveraging:
- While VWAP can guide entries and exits, no indicator is foolproof. Combine it with broader market analysis, fundamental factors, and a disciplined money management plan to ensure you’re not taking on excessive risk.
- Combine With Longer-Term Indicators:
- For swing traders or position traders, using multi-day VWAP or Anchored VWAP can provide a broader perspective. This can help confirm whether intraday moves align with the stock’s longer-term trajectory.
Examples of Real-World VWAP Applications
Let’s look at two hypothetical scenarios to illustrate how traders might use VWAP:
Example 1: Intraday Long Trade
- Stock: XYZ Corp
- Scenario: The stock opens at $50, spikes to $52 within the first 30 minutes (high volume), then pulls back to $51 where the intraday VWAP currently sits.
- Analysis: If the stock has a bullish catalyst (such as positive earnings), a trader might look for a bounce off VWAP at $51 to go long. The rationale is that most buyers up to this point have an average position around $51, suggesting there’s a strong chance of renewed support.
- Stop-Loss: Placed slightly below $51 (e.g., $50.75). If the stock falls below VWAP, it may indicate failing intraday momentum.
- Profit Target: The previous high of $52 or a new breakout above that level.
Example 2: Intraday Short Trade
- Stock: ABC Inc
- Scenario: The stock is trading around $100 at the open. Shortly after, it drops to $98 on high volume, bringing the VWAP down to around $99. A rebound from $98 meets VWAP at $99, where the price stalls.
- Analysis: A short seller may initiate a position around $99, expecting the VWAP to act as intraday resistance and the downward momentum to continue.
- Stop-Loss: Placed slightly above VWAP (e.g., $99.50). If the stock pushes well above $99, it may invalidate the bearish trade idea.
- Profit Target: A retest of the $98 area, or further decline if the negative momentum intensifies.
In both examples, VWAP serves as a central reference point around which trades are planned and managed, illustrating the practical application of this indicator in intraday settings.
Common Mistakes and How to Avoid Them
While VWAP is a powerful indicator, several pitfalls can hinder its effectiveness if not addressed properly:
- Treating VWAP as a Standalone Signal for All Trades:
- Mistake: Solely relying on VWAP for buy/sell decisions without considering market context, news, or other technical indicators.
- Solution: Always combine VWAP with a broader market perspective, news flow, and at least one confirming indicator or candlestick pattern.
- Not Adjusting Strategies for Low-Volume Stocks:
- Mistake: Applying the same VWAP strategy to thinly traded stocks with low liquidity.
- Solution: Focus on moderately or heavily traded stocks where VWAP readings are more reliable.
- Ignoring Time Frames:
- Mistake: Failing to remember that VWAP resets daily (unless using anchored or multi-day VWAP).
- Solution: Adapt your strategies to your time horizon. Day traders should always reset their VWAP analysis each morning.
- Overtrading Small Deviations:
- Mistake: Jumping in and out of trades on tiny moves around the VWAP, leading to excessive trading costs and whipsaws.
- Solution: Observe how the price behaves near VWAP and wait for clear signs of support/resistance before placing a trade.
- Poor Stop Placement:
- Mistake: Placing stops arbitrarily far from or too close to VWAP, leading to undue risk or frequent stop-outs.
- Solution: Base stop placement on a combination of VWAP level, recent price action, and volatility measures (e.g., Average True Range).
By avoiding these common mistakes, you can better harness the VWAP indicator’s strength as a reliable intraday guide.
Advanced VWAP Concepts
While the basic VWAP is calculated from the market open to the current intraday session, several advanced variations and extensions exist to suit different trading styles and objectives.
Anchored VWAP

Anchored VWAP (AVWAP) is calculated from a specific starting point in time that the trader chooses, rather than automatically resetting at the market open.
Use Cases:
- Significant Events: Traders often anchor the VWAP to the date/time of a major event, such as earnings releases, mergers, acquisitions, or major technical breakouts.
- Longer-Term Analysis: Swing traders or position traders might anchor the VWAP to the start of a quarter, year, or another critical date for a broader analysis of a stock’s price trend.
How to Use:
- Once you pick the anchoring point, the indicator calculates VWAP cumulatively from that moment forward.
- This can highlight the average price participants have paid since a significant event, which can be a strong level of support or resistance.
Displaced VWAP
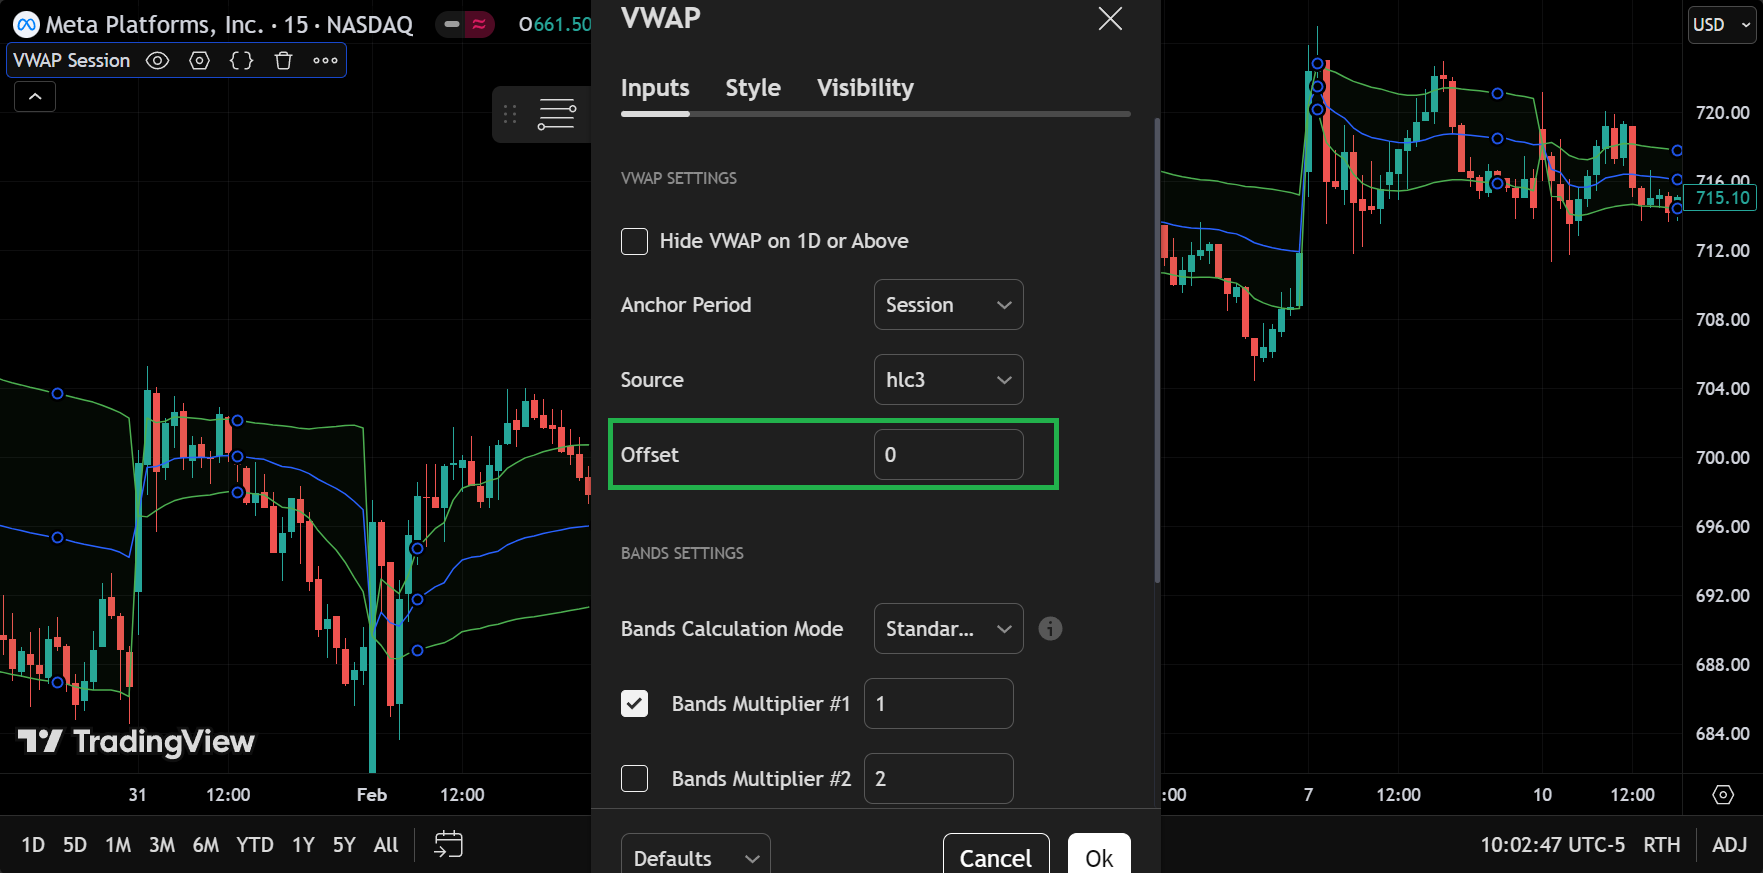
Displaced VWAP shifts the standard VWAP line forward or backward by a certain number of bars or time intervals.
Rationale:
- Sometimes traders want to see how VWAP might look if it lagged or led price action by a set amount of time.
- This technique can help detect divergences or confirm short-term trends that might otherwise be obscured.
Considerations:
- Displacing VWAP is more of an experimental technique and is far less common than standard or anchored VWAP.
- Use caution and back-test thoroughly before employing displaced VWAP in live trading.
VWAP Standard Deviations (Bollinger-Style Bands)
Just as Bollinger Bands apply standard deviations around a moving average, you can add standard deviations around VWAP to identify potential overbought and oversold conditions intraday.
Implementation:
- Compute the VWAP for each interval.
- Calculate the standard deviation of price relative to VWAP over a chosen window (e.g., 20 or 30 intervals).
- Plot upper and lower bands around VWAP at multiples of that standard deviation (e.g., ±1 SD, ±2 SD).
How to Use:
- If price significantly deviates above the upper band, it might be overbought on an intraday basis, suggesting a reversion back toward VWAP.
- If price drops below the lower band, it could be oversold, hinting at an upward reversal.
- This approach can add another layer of analysis, especially for mean reversion traders.
Summary and Final Thoughts
VWAP (Volume-Weighted Average Price) is an indispensable tool for day traders, swing traders, and institutional players alike. It offers a unique perspective that incorporates both price and volume, allowing for a more robust assessment of intraday trends. From identifying support and resistance levels to optimizing trade execution and measuring performance, VWAP is a versatile indicator that can be adapted to various strategies and market conditions.
Key Takeaways
- Intraday Benchmark: VWAP resets at each market open (unless you anchor or extend it) and serves as a reliable gauge for that day’s average price.
- Volume Integration: By weighting prices by volume, VWAP offers a more comprehensive picture than simple or exponential moving averages that rely on time weighting.
- Institutional Relevance: It’s the go-to benchmark for large institutions to evaluate execution quality, thus creating self-fulfilling levels of support and resistance.
- Multiple Strategies: VWAP can be used for trend-following, mean reversion, and breakout strategies, as well as advanced concepts like Anchored VWAP and VWAP bands.
- Risk Management: Combining VWAP with disciplined position sizing, stop placement, and supplementary technical/fundamental analysis can significantly enhance your trading outcomes.
Putting It All Together
Successful trading often involves layering multiple tools and insights—price action, fundamental catalysts, broader market context, and selective use of indicators. Within this framework, VWAP excels as an intraday benchmark that keeps your focus on where the majority of volume is transacting, rather than solely on price fluctuations. By understanding and applying VWAP in different ways—whether for quick scalps in a volatile market open or for intraday swing positions—you can gain a competitive edge in timing entries, exits, and overall market positioning.
As with any technical tool, VWAP is not a magic bullet, but when combined with solid research, risk management, and a disciplined trading plan, it can be a powerful weapon in your arsenal. Whether you’re a retail day trader taking advantage of small price movements or an institutional player managing large block trades, understanding the nuances of VWAP is critical for staying in sync with the market’s intraday flow.