The equity markets hold immense potential but can feel like an overwhelming maze of data. With thousands of stocks available on major exchanges, how do you pinpoint the right opportunities tailored to your trading or investment strategy?
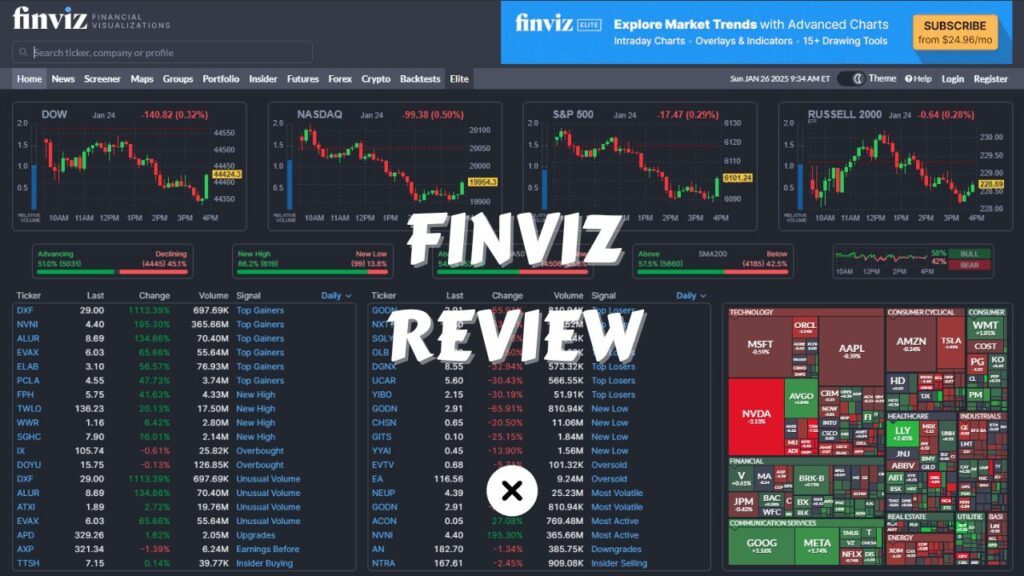
Enter Finviz, short for “Financial Visualizations.” In this Finviz review, we explore a platform celebrated for its user-friendly, data-rich interface. Over the years, Finviz has earned its reputation as a trusted tool for traders and investors seeking to simplify the process of discovering, analyzing, and monitoring stocks.
This comprehensive review dives into Finviz’s robust screening tools and diverse features, showing how it can revolutionize your research process and help you identify the best stocks to trade. Whether you’re a seasoned trader, a long-term investor, or simply curious about navigating the stock market, this guide equips you with everything you need to make the most of Finviz.
What Is Finviz?
Finviz is a web-based platform offering a range of tools to help traders and investors interpret market data more efficiently. Founded in 2007, Finviz’s mission from the start has been to provide easy-to-digest visual representations of financial information.
While Finviz is perhaps most famous for its Stock Screener, the platform also includes:
- Heat Maps providing quick overviews of market trends.
- Insider trading data that can hint at corporate sentiment.
- News aggregation from multiple sources, giving you real-time updates on your favorite stocks.
- Charting for technical analysis.
- Portfolio tracking to consolidate and monitor your holdings.
Finviz’s differentiation lies in its user-friendly layout, broad coverage of both fundamental and technical metrics, and the ability to visually parse large sets of data. Whether your focus is short-term price action or long-term value, Finviz has enough flexibility to cater to different trading styles.
Why a Comprehensive Stock Screening Platform Matters
Before diving headfirst into Finviz’s specifics, it’s vital to understand why screening platforms are so valuable:
- Efficiency: Stock screeners narrow down thousands of options to a manageable subset, saving you hours of manual research.
- Consistency: By applying consistent filters—like P/E ratio < 15 or RSI < 30—you reduce emotional biases in your decision-making.
- Time-Saving: You can quickly run multiple scans for different strategies (e.g., momentum vs. value) without combing through each chart individually.
- Scalability: As your investing or trading interests broaden to new sectors or asset classes, the right screener can adapt by offering filters for these new areas.
- Data Consolidation: A comprehensive screener merges multiple data points (fundamental, technical, and even news) into one location, making your research process more cohesive.
Given the above, Finviz aims to excel in all these areas. Let’s explore how.
Core Finviz Features
Finviz is more than a stock screener; it is a data aggregator, visualizer, and analysis toolkit. Below is an in-depth look at each of its core features, explaining how you can use them to refine your stock selection process.
1. The Finviz Stock Screener
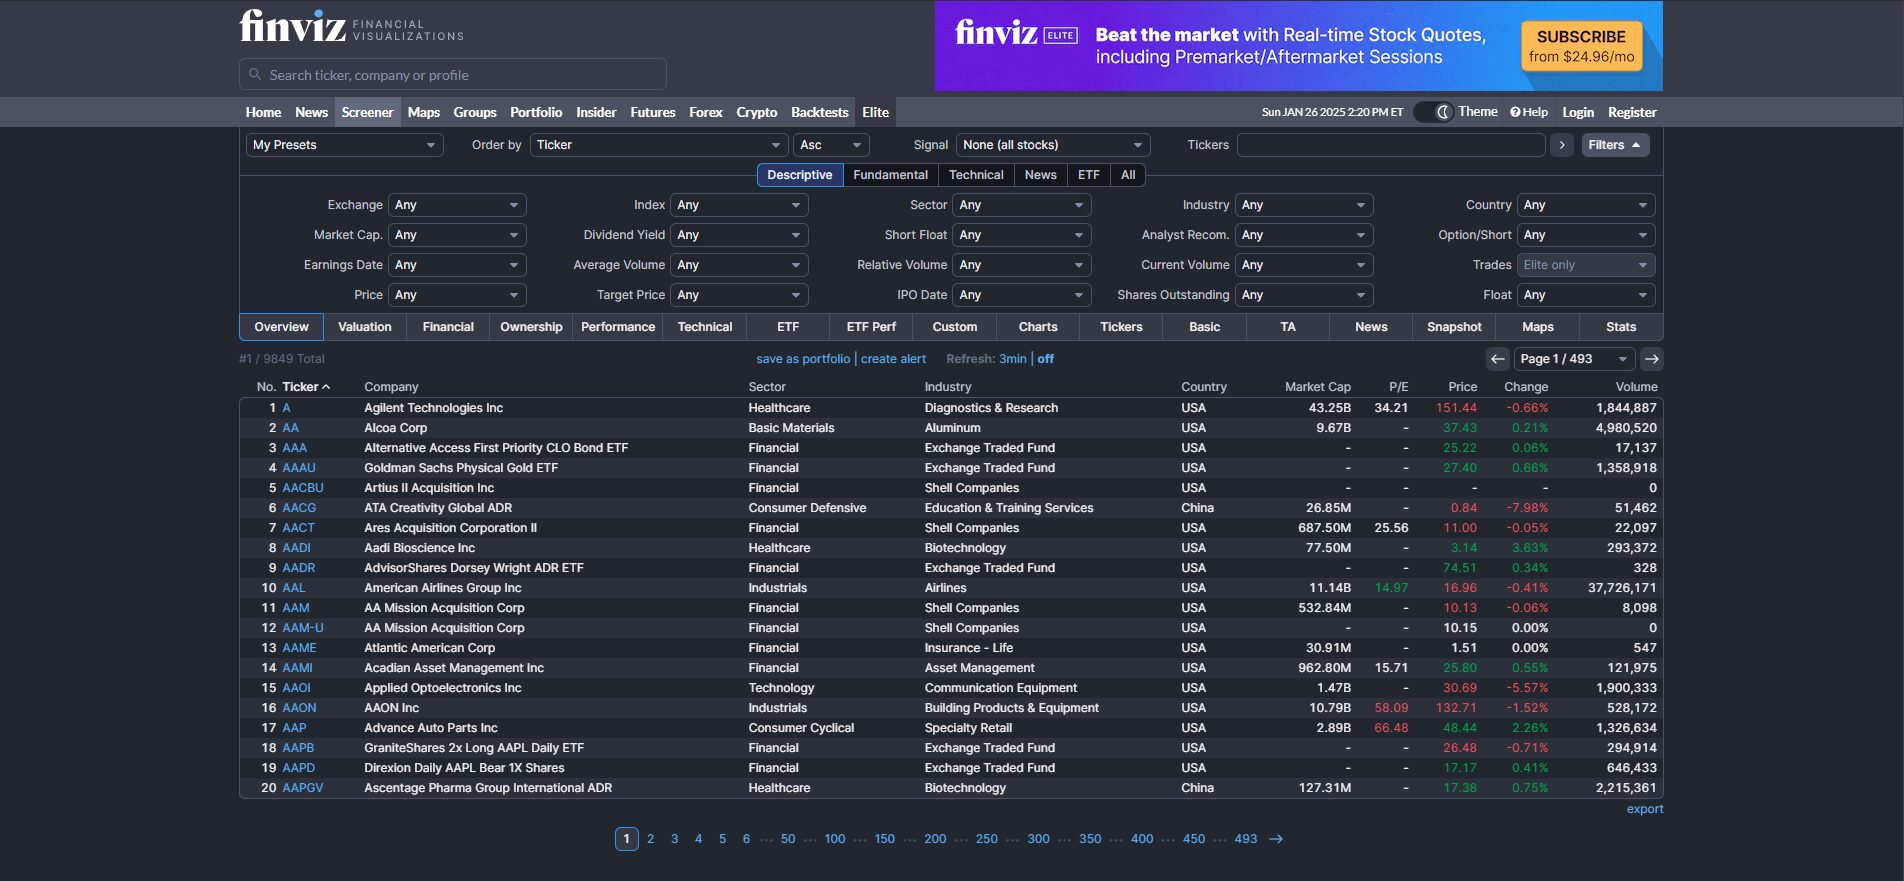
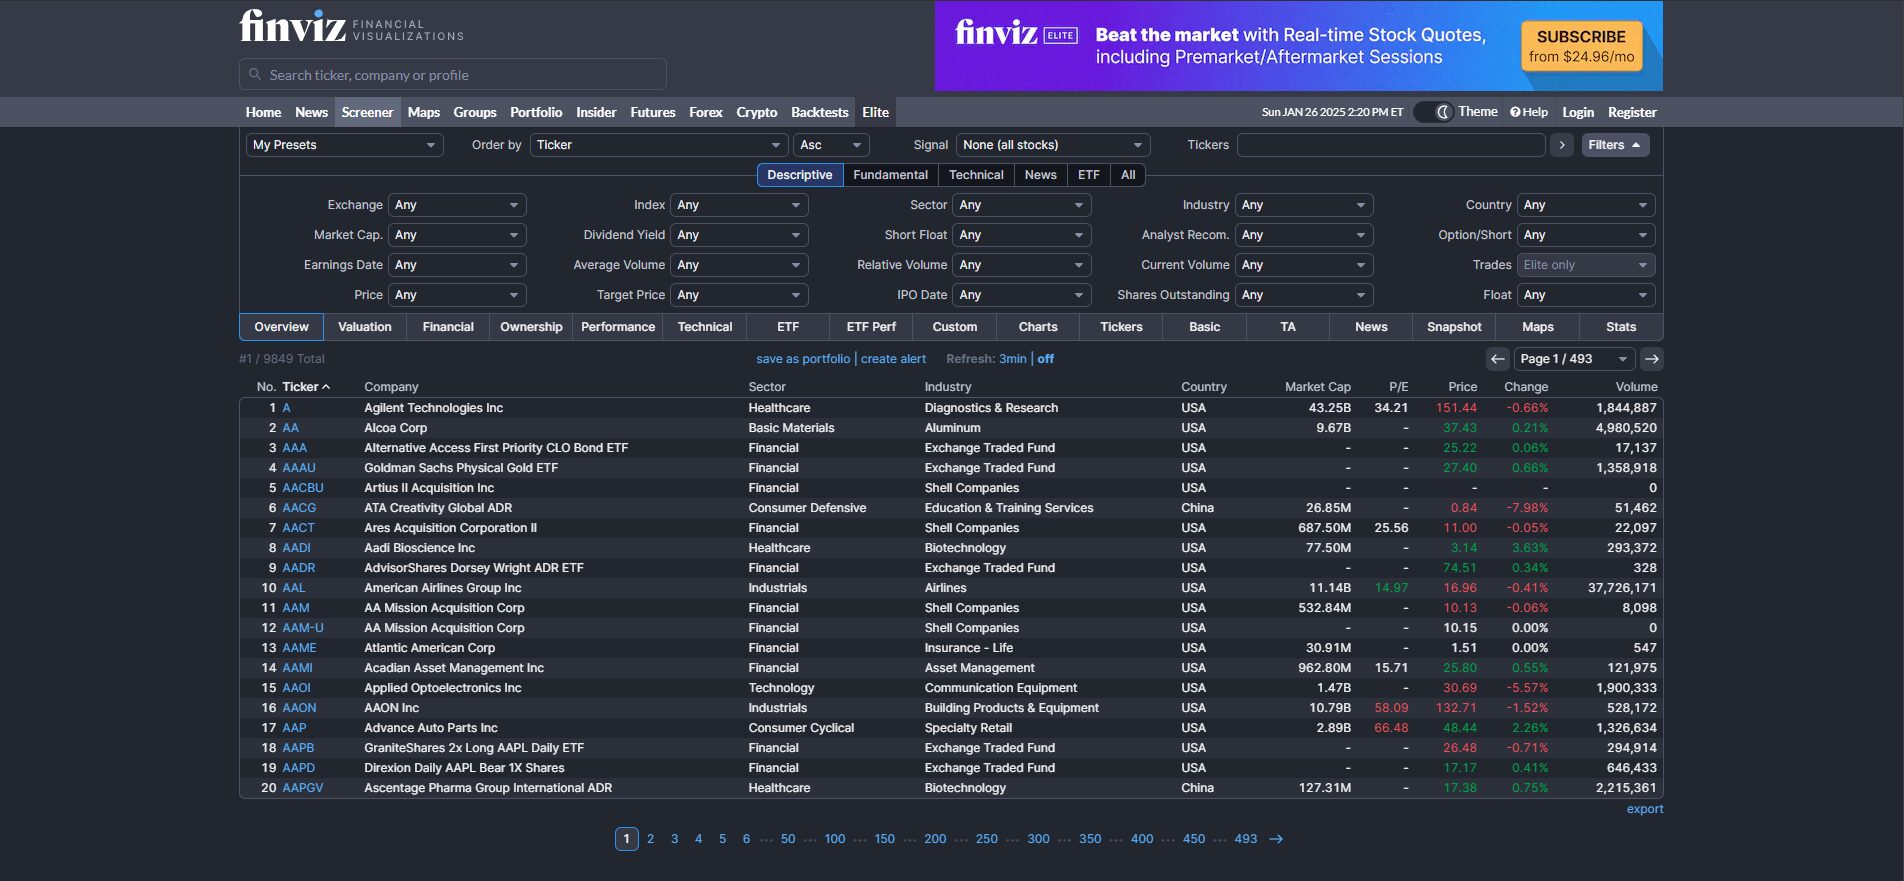
The Stock Screener is Finviz’s flagship feature. It allows you to slice and dice the stock market using dozens of filters. These filters are divided into three main categories:
- Descriptive: Market cap, sector, country, float short, average volume, etc.
- Fundamental: P/E ratio, Price-to-Book (P/B), EPS growth, Dividend yield, Return on Equity (ROE), etc.
- Technical: RSI, Performance over various time frames, 50-day moving average, 200-day moving average, candlestick patterns, etc.
Key Advantages of the Finviz Screener:
- Depth and Breadth of Metrics: You can combine as many metrics as you want. For example, searching for a large-cap healthcare stock with a P/E under 20, RSI under 40, and 50-day MA above 200-day MA is completely feasible.
- Quick Visual Snapshots: Once you set your criteria, the screener instantly displays the matching stocks. Each row in the results includes relevant data, and you can even toggle small charts.
- Sorting and Exporting: You can sort results by any column, from market cap to volume to dividend yield. In the Elite version, you can export these results into Excel or CSV files for deeper analysis.
Ultimately, the Finviz Stock Screener can serve as the starting point for nearly every strategy, whether you’re looking for undervalued dividend payers or high-flying momentum names.
2. Heat Maps: A Bird’s-Eye View of the Market

One of Finviz’s most visually striking features is the Heat Map. This is essentially a color-coded representation of how stocks (often grouped by sector) are performing. Red indicates negative performance for the day, while green indicates positive performance. The intensity of the color correlates to the magnitude of the price move.
How Heat Maps Help:
- Immediate Sector Performance: At a glance, you can see which sectors—like technology, healthcare, financials—are outperforming or lagging.
- Identify Market-Wide Trends: If the Heat Map is predominantly green, you might infer bullish sentiment. Conversely, widespread red can signal a market downturn.
- Spotting Outliers: Sometimes a single stock in an otherwise red sector will be bright green, indicating a unique catalyst pushing that stock higher.
You can customize the Heat Map view by focusing on specific indices like the S&P 500 or by highlighting a particular filter (e.g., P/E ranges). This intuitive approach to visual data is what sets Finviz apart from many competitors.
3. Charting Capabilities

Charts are a trader’s best friend, and Finviz provides:
- Daily, Weekly, and Monthly Charts: Perfect for short-term and long-term analysis.
- Multiple Technical Indicators: You can overlay moving averages, MACD, RSI, Bollinger Bands, volume indicators, and more.
- Candlestick and Line Charts: Switch between different chart styles based on your preference or strategy.
Although Finviz’s charting system may not be as advanced as dedicated platforms like TradingView or Thinkorswim, it’s sufficient for quick technical checks. The Elite version offers intraday data, which is crucial if you’re a day or swing trader requiring near-real-time insights.
4. News Aggregation and Market Insights

Finviz aggregates news from a variety of reputable sources—such as Bloomberg, Reuters, CNBC, and major finance publications—then organizes these headlines under each stock’s page. This serves as a quick way to gauge recent developments:
- Earnings Reports: Find out if a company beat or missed estimates.
- Analyst Upgrades/Downgrades: Check who changed their price targets or recommendations.
- Company-Specific Announcements: Mergers, acquisitions, major contracts, or product launches can all be found in this feed.
For momentum and swing traders, these aggregated headlines can help confirm whether a strong move is driven by news catalysts or simply speculation.
5. Insider Trading Data
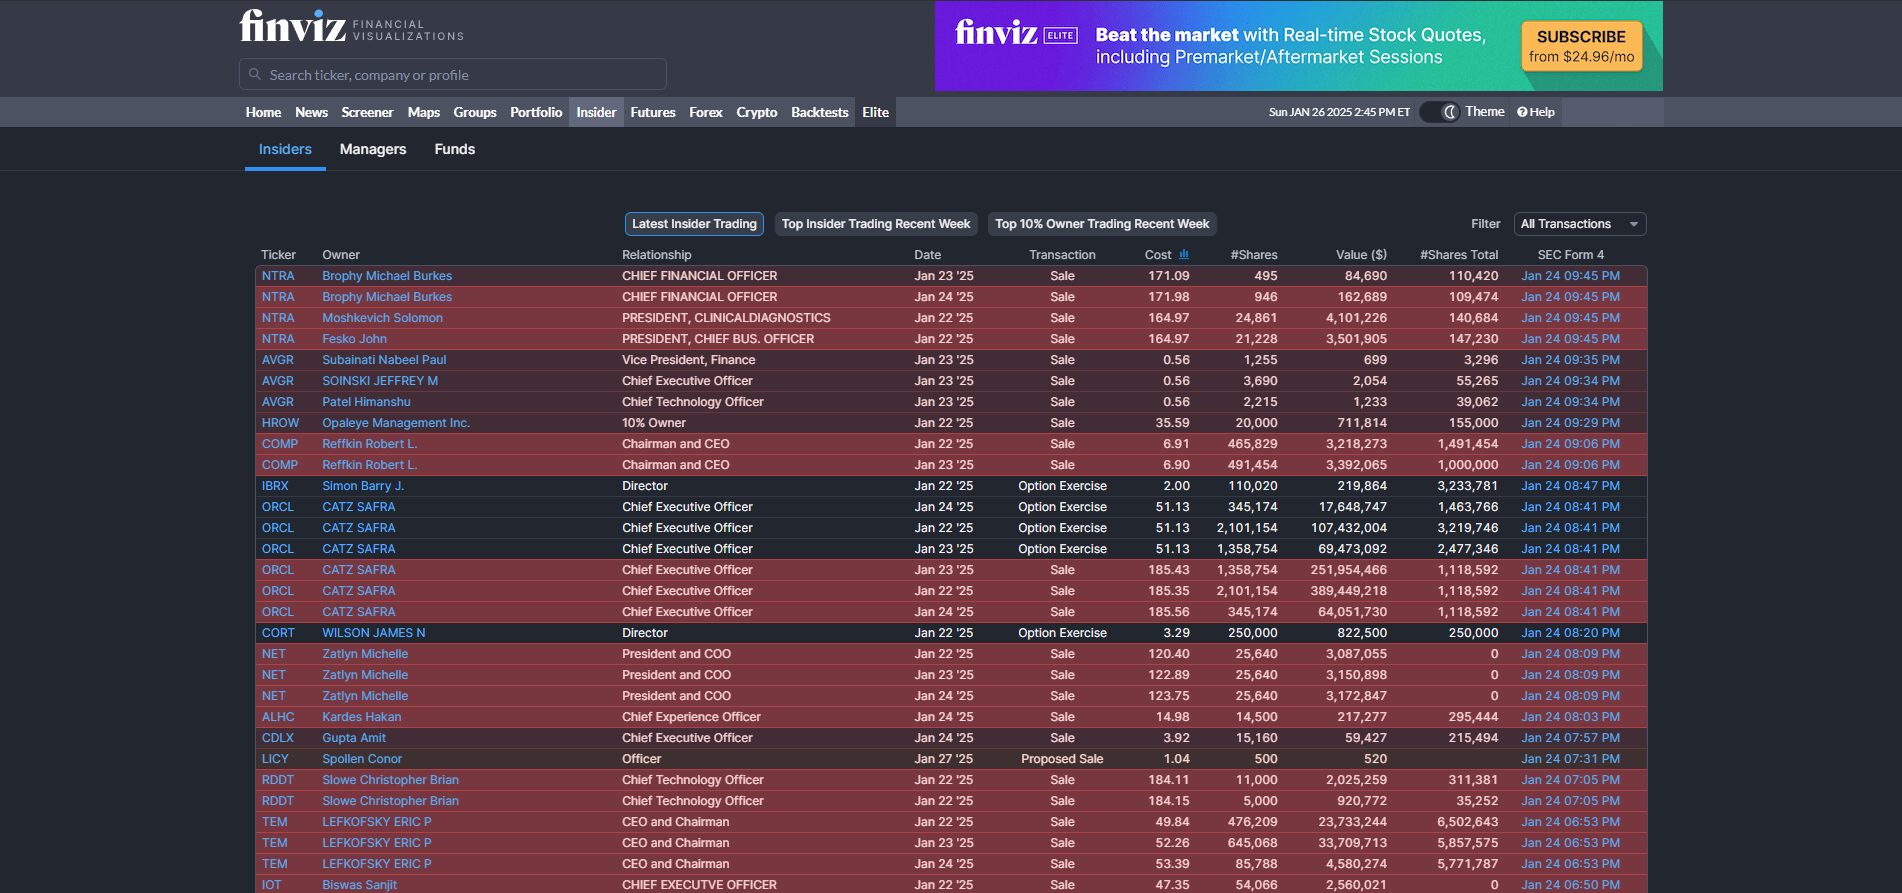
Tracking insider trading—the buying and selling of shares by corporate insiders (executives, directors, major shareholders)—can yield powerful insights:
- Insider Buying: Often interpreted as a sign that those with deeper knowledge of the company believe the current price is undervalued or that the outlook is strong.
- Insider Selling: Can be trickier to interpret because insiders sell for multiple reasons (taxes, diversification, personal needs), but heavy or cluster selling may indicate caution.
Finviz consolidates these insider transactions in a dedicated section, listing details such as:
- Name and Position: Which insider is trading.
- Transaction Type: Buy or sell, along with the number of shares and transaction value.
- Transaction Date: When the buy/sell occurred.
Having this data at your fingertips can complement both fundamental and technical analysis, especially for mid- to long-term investors.
6. Portfolio Tracking and Watchlists

Maintaining a watchlist is essential if you like to monitor specific stocks or entire sectors before entering a position. Finviz allows you to:
- Add Stocks to a watchlist directly from the screener or a stock’s detail page.
- Customize Views: See price changes, fundamental metrics, or technical signals for each stock in your watchlist.
- Track Performance: Keep tabs on daily percentage moves or average cost if you’re also using it as a portfolio tracker.
While Finviz’s portfolio features are not as advanced as some dedicated broker or portfolio-management platforms, they’re adequate for a snapshot of how your picks are performing over time.
7. Futures, Forex, and Crypto Overviews
In addition to equities, Finviz provides market snapshots for:
- Futures: Indices (S&P, Dow, NASDAQ), commodities (gold, oil, natural gas), and more.
- Forex Pairs: Major currency pairs like EUR/USD, GBP/USD, USD/JPY, etc.
- Cryptocurrencies: Basic data on major coins such as Bitcoin, Ethereum, and Litecoin.
These snapshots can help you gauge broader macroeconomic trends. For instance, if energy futures are rallying, you might anticipate stronger moves in energy stocks. Though the in-depth analytics are still primarily equity-focused, these overviews broaden Finviz’s utility for multi-asset traders.
Finviz Elite vs Free Version
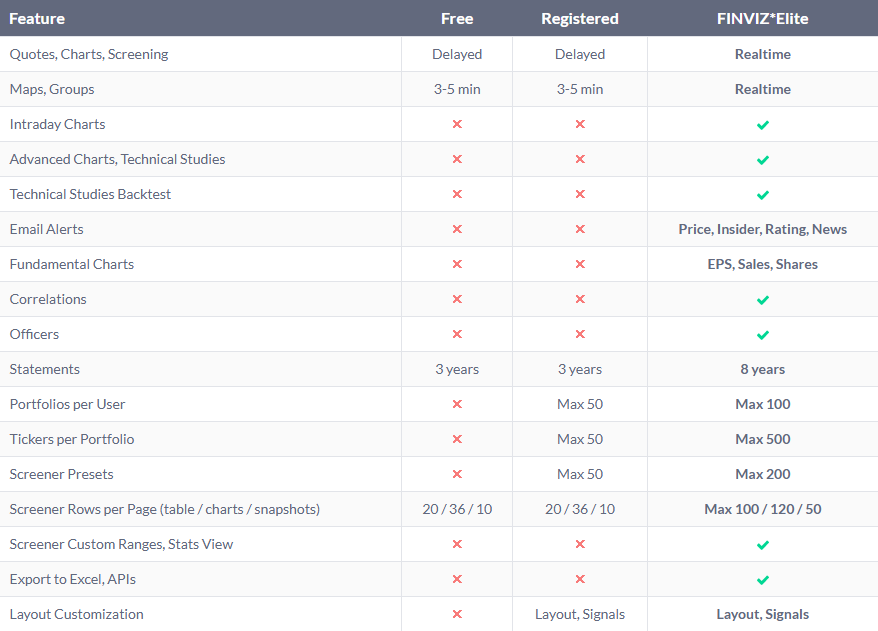
A common question is whether upgrading to Finviz Elite is worth it. Here’s a direct comparison:
Free Version
- Delayed Data: Typically 15-20 minutes behind real-time quotes.
- Limited Intraday Charting: Charts update but are not fully real-time.
- Ads: Banner and sidebar ads can be somewhat distracting.
- Basic Screeners: You still get access to the core filters but with limited customization for intraday scans.
- Single Watchlist: Enough for many casual users, but might feel restrictive for more active traders.
Finviz Elite
- Real-Time Data: Crucial for day traders and active swing traders.
- Advanced Intraday Charts: Minute-by-minute updates and advanced drawing tools.
- Fewer or No Ads: An ad-free experience for smoother navigation.
- Extended Screener Options: Intraday scanning, more advanced filter combinations, and the ability to backtest certain strategies.
- Multiple Watchlists & Portfolio Tracking: Ideal if you need segmented watchlists by strategy or sector.
- Alerts: Ability to set price or volume alerts that notify you via email.
Who Should Upgrade?
- Active Day Traders or Frequent Swing Traders: Real-time data and intraday scanning are critical for intraday decision-making.
- Serious Enthusiasts: If you monitor multiple portfolios or prefer advanced scanning features.
- Those Who Dislike Ads: An uninterrupted experience can be worth the cost for some users.
On the other hand, if you’re a long-term investor or an occasional trader, the free version may be sufficient. It still offers a wealth of information, albeit with delayed data.
Step-by-Step: Using Finviz to Find the Best Stocks
Now that you understand the main features, let’s walk through how to actually use Finviz. The following is a detailed, step-by-step guide to get you from “just browsing” to “actionable ideas.”
1. Accessing and Setting Up
- Visit Finviz.com: You’ll land on a homepage that provides a broad market overview—major indices, top gainers/losers, and big headlines of the day.
- Register (Optional but Recommended): Click on “Register” in the top right corner. You’ll be prompted to provide an email and password. Registration allows you to save filters and watchlists.
- Log In: If you have an account, log in to sync your saved screens and portfolio details.
2. Navigating the Screener Interface

Look for the “Screener” tab at the top of Finviz’s page. Clicking it will present three sub-tabs:
- Descriptive: Market cap, sector, country, float, average volume, etc.
- Fundamental: Various valuation and growth metrics (P/E, PEG, EPS growth).
- Technical: Indicators related to price movement, volume, and trend (RSI, moving averages, etc.).
These tabs contain drop-down filters where you can pick criteria like “Mid Cap,” “P/E < 20,” or “RSI Oversold.”
3. Applying Filters and Criteria
Let’s say you’re a momentum trader looking for stocks in a clear uptrend:
- Descriptive:
- Price > $5 (to avoid penny stocks)
- Average Volume > 1M (to ensure liquidity)
- Fundamental:
- EPS Growth (Past 5 Years) > 10% (indicating some fundamental momentum)
- Technical:
- 50-Day Simple Moving Average (SMA) > 200-Day SMA (classic golden cross scenario)
- Performance (Month) > 5% (showing recent strength)
Finviz will instantly show you the stocks that meet these criteria.
4. Refining Your Results
After the initial filter, you might see dozens or even hundreds of tickers. To refine:
- Sort by: Volume, relative volume, or price performance to see the strongest movers or the most actively traded stocks at the top.
- Narrow Sector: Maybe you only want technology or healthcare. In the Descriptive tab, set “Sector” to “Technology” or “Healthcare” to further focus your results.
Review the table, paying attention to ticker symbols, company names, sector, industry, market cap, and key metrics. Clicking on any ticker takes you to a dedicated stock page with charts, news, insider transactions, and detailed fundamentals.
5. Saving and Managing Custom Screens
If you’re logged in:
- Click “Save Screen”: Name your filter (e.g., “Momentum – Golden Cross”).
- Access Later: Under your account settings or on the screener page, you can load saved screens instantly.
- Create Multiple Screens: For example, one screen for dividend stocks, another for oversold reversal plays, etc.
Having these screens bookmarked saves time. It also ensures consistency in how you look for stocks, which can help refine your trading approach over time.
Diving Deeper: Maximizing Finviz’s Feature Set
Beyond the basics, Finviz offers advanced functionalities to help you drill down further and make more informed trading decisions.
1. Advanced Screener Tips
- Combine Fundamental and Technical Filters: Don’t limit yourself to a single category. If you’re a growth investor who also values strong chart setups, mix high EPS growth with RSI or moving average criteria.
- Experiment with Different Time Frames: For performance metrics, you can filter by daily, weekly, monthly, quarterly, or yearly performance. This helps you find either short bursts of momentum or sustained, long-term outperformance.
- Use Descriptive Overlays: Instead of just searching by P/E, try overlaying metrics like short float or institutional ownership. A heavily shorted stock with strong fundamentals could be a candidate for a short squeeze.
2. Leveraging Heat Maps for Sector Analysis
To access the Heat Map:
- Click “Maps” on the top navigation bar.
- Customize: You can choose to view a map of the S&P 500, the entire market, or specific ETFs.
- Fine-Tune: Use color-coding not just for performance but also for metrics like P/E ratio or market cap.
How to Use Heat Maps Strategically:
- Identify Trends: If technology is predominantly green, dig into that sector’s best performers.
- Spot Laggards: A single bright red stock in a green sector might be in trouble, or it may represent a shorting opportunity if there’s a fundamental reason behind its underperformance.
3. Using Insider Data for Additional Clues
Finviz’s “Insider” section is accessible via a tab on the main menu or from each stock’s dedicated page. Here, you can:
- Filter by Insider Transactions: For instance, only view insider buys over $100,000.
- Look for Patterns: Multiple insiders buying within a short period can be more convincing than a single insider making a small purchase.
- Compare with Fundamentals: If a fundamentally strong company has heavy insider buying, it might reinforce the bullish outlook.
4. Building and Monitoring Portfolios
In both the Free and Elite versions, you can create a basic portfolio or watchlist:
- Adding Symbols: From the screener results, you can hover over the ticker and find an option to add it to a watchlist or portfolio.
- Tracking Performance: Finviz shows daily/weekly/monthly changes, letting you quickly see if your picks align with your targets.
- Using Portfolios as a Sandbox: Maintain a “hypothetical” or “paper trading” portfolio to test strategies without risking real capital.
5. Real-Time Scans and Alerts (Elite)
Finviz Elite users enjoy real-time quotes and can set alerts. For example, you could set an alert if a stock in your watchlist crosses above its 50-day moving average or experiences an unusual intraday volume spike.
How Alerts Enhance Trading:
- Timely Notifications: You don’t have to constantly stare at the screen.
- Automated Tracking: If you’re looking for breakouts or breakdowns, an alert can notify you the moment a key level is breached.
6. Backtesting and Historical Data
While Finviz is not a full-scale backtesting platform like some specialized services, Finviz Elite does allow for certain historical scans and performance tracking. You can check how a screen’s results performed over specific timeframes, although the functionality is somewhat limited compared to professional algorithmic backtesting tools.
Popular Use Cases and Example Screens
To illustrate how Finviz’s features come together, here are several common strategies and the corresponding filters you might use.
1. Momentum Trading
Objective: Find stocks on strong upward trends with robust volume.
- Filter Criteria:
- Price > $10
- Average Volume > 1M
- Performance (Month) > 10%
- 50-Day SMA > 200-Day SMA
Why It Works: This filter finds stocks that are both liquid and moving strongly higher in recent weeks, ideal for momentum plays.
2. Swing Trading
Objective: Identify stocks likely to move over a few days to weeks.
- Filter Criteria:
- RSI (14) between 40–60 (neutral, but prime for a breakout or breakdown)
- EPS Growth (Quarter over Quarter) > 15%
- Market Cap > $2B
- Price above 50-Day SMA but below 52-Week High
Why It Works: This helps you spot stocks in mild uptrends (above 50-day average) that haven’t hit extreme overbought or oversold levels.
3. Value Investing
Objective: Locate undervalued companies with solid fundamentals.
- Filter Criteria:
- P/E < 15
- PEG < 1
- Dividend Yield > 2%
- Debt/Equity < 1
Why It Works: Low valuation metrics (P/E, PEG) combined with manageable debt and a decent dividend yield often indicate a relatively stable, potentially undervalued stock.
4. Dividend Investing
Objective: Build a stable income portfolio with reliable yields.
- Filter Criteria:
- Dividend Yield > 3%
- Payout Ratio < 60%
- Market Cap > $10B
- Beta < 1
Why It Works: Ensuring a lower payout ratio and a sizable market cap can mitigate risk, while a higher yield meets the income requirement.
5. Day Trading
Objective: Find intraday opportunities with high volatility and volume.
- Filter Criteria (often used in Elite for real-time data):
- Average Volume > 2M
- Relative Volume > 2
- Price under $50
- Performance (Day) > 3% or < –3% (looking for big intraday movers)
Why It Works: Day traders thrive on volatility and liquidity; these filters point to stocks that are actively moving with enough volume to jump in and out quickly.
Pros and Cons of Finviz
Even the best platforms have limitations. Here’s a straightforward list of Finviz’s advantages and drawbacks.
Pros
- Intuitive Interface: Easy navigation and visually appealing layouts.
- Comprehensive Screening: Scores of fundamental and technical filters to combine.
- Heat Maps: Provides an instant, color-coded snapshot of sector performance.
- Insider Trading Data: Helpful extra layer of analysis.
- News Aggregation: Consolidates headlines for each stock into a single feed.
- Free Version is Feature-Rich: You get a lot of utility without paying.
Cons
- Delayed Data in Free Version: Real-time quotes require an Elite subscription.
- Limited Advanced Charting: More specialized charting platforms like TradingView offer superior drawing tools and customization.
- No Dedicated Mobile App: Although the website is mobile-friendly, some traders prefer standalone apps.
- Learning Curve: The breadth of filters can be overwhelming for complete beginners.
Integrating Finviz with Other Trading Tools
Finviz excels at scanning and initial research, but you might want to incorporate other tools for a well-rounded trading workflow:
- TradingView or Thinkorswim: For advanced charting, custom indicators, and more robust alert systems.
- Broker Platforms: Most brokers (e.g., TD Ameritrade, Interactive Brokers, E*TRADE) offer direct execution, which Finviz does not.
- Yahoo Finance: For extended fundamental analysis like earnings transcripts, historical financials, and analyst coverage.
- Seeking Alpha or TipRanks: For in-depth articles, analysis, and consensus ratings.
By combining Finviz’s screening capabilities with these platforms, you get the best of both worlds: efficient idea generation and advanced charting or fundamental deep dives.
Common Mistakes and Best Practices
Even with a tool as user-friendly as Finviz, there are pitfalls. Here’s how to avoid them:
- Overfitting Screens: Combining too many filters can yield no results or stocks that are so narrowly defined you miss out on broader market opportunities.
- Ignoring Liquidity: Always pay attention to average and current volume. Even the best-looking chart is worthless if you can’t enter or exit easily.
- Failing to Confirm News: Finviz’s news feed is a great starting point, but always verify important announcements through multiple sources or official company press releases.
- No Risk Management: A screener finds candidates; it doesn’t manage your stop-losses or position sizes. Always use prudent risk controls.
- Skipping Fundamental Checks: Technical filters are powerful, but verifying a company’s fundamental health helps ensure that you’re not trading a stock prone to sudden collapses.
Best Practices:
- Start with broader filters, then narrow as you see fit.
- Maintain a trading journal to track which filters lead to the most profitable trades.
- Check both daily and weekly charts to confirm multi-timeframe alignment.
- Leverage the Heat Maps to understand sector movements before diving into individual stocks.
Finviz Alternatives
While Finviz is one of the top stock screeners available, there are several other platforms that cater to specific needs and trading styles. Here’s a look at some noteworthy alternatives, including TradingView:
- TradingView: Known for its advanced charting tools, social trading community, and custom indicators, TradingView is an excellent alternative for traders who focus on technical analysis. It allows you to create and share strategies while offering real-time data and alerts. Its user-friendly interface makes it ideal for both beginners and experienced traders.
- Trade Ideas: Focused on AI-driven real-time scanning, Trade Ideas is a go-to platform for intraday traders. Its automated trading strategies and real-time idea generation make it particularly valuable for active traders who rely on speed and precision.
- Stock Rover: Best suited for long-term investors, Stock Rover shines with its robust fundamental analysis tools. It offers detailed comparisons of financial metrics, making it ideal for those who prioritize deep dives into company fundamentals and long-term portfolio building.
- MarketSmith (by IBD): Designed with growth investors in mind, MarketSmith specializes in identifying stocks following the CAN SLIM methodology. It’s a premium tool for those who focus on finding high-growth opportunities using a systematic approach.
- Yahoo Finance Screener: A free and straightforward option, Yahoo Finance Screener offers basic fundamental filters. While limited in scope compared to Finviz, it’s a solid starting point for casual investors seeking simple stock analysis.
Choosing the Right Tool
Each platform has its strengths:
- TradingView is unmatched for charting and strategy sharing.
- Trade Ideas excels in real-time scanning and AI-powered insights.
- Stock Rover is perfect for fundamental research.
- MarketSmith is tailored for growth investors.
- Yahoo Finance provides a no-cost, beginner-friendly solution.
That said, Finviz remains an exceptional middle ground, offering a balanced mix of fundamental and technical screening capabilities with a user-friendly design. Whether you prioritize real-time data, detailed fundamentals, or customizable charts, the right platform depends on your trading style and goals.
Conclusion
Finviz stands out in a crowded field of stock screening tools by delivering a user-friendly interface packed with powerful features from comprehensive filters to Heat Maps and insider data. Its versatility makes it a solid choice whether you’re a day trader, momentum player, value investor, or a long-term dividend seeker.
- Ease of Use: Even newcomers can quickly learn how to apply filters and interpret results.
- Feature Depth: The platform caters to both fundamental and technical analysts.
- Elite vs. Free: Real-time data in Elite is invaluable for active traders, but the free version is robust enough for many casual or longer-term investors.
By blending Finviz’s efficient screening with your own trading experience, risk management protocols, and potentially a more advanced charting or broker platform, you create a holistic trading ecosystem. In a market where speed and accuracy matter, having a tool like Finviz in your arsenal can significantly improve your ability to discover the best stocks to trade—often before they become obvious to everyone else.
Final Tip
Don’t limit Finviz to just screening. Make sure you’re taking advantage of its additional resources like insider trading data, Heat Maps, and news aggregation. The next time you spot a ticker that meets your criteria, do a quick check of insider buys, skim the recent headlines, and see how its sector peers are performing. This multi-faceted approach often separates random picks from truly high-probability trade ideas.
Disclaimer: The information provided here is for educational purposes only and should not be considered financial or investment advice. Always perform your own due diligence or consult a licensed financial advisor before making any trading or investment decisions.
