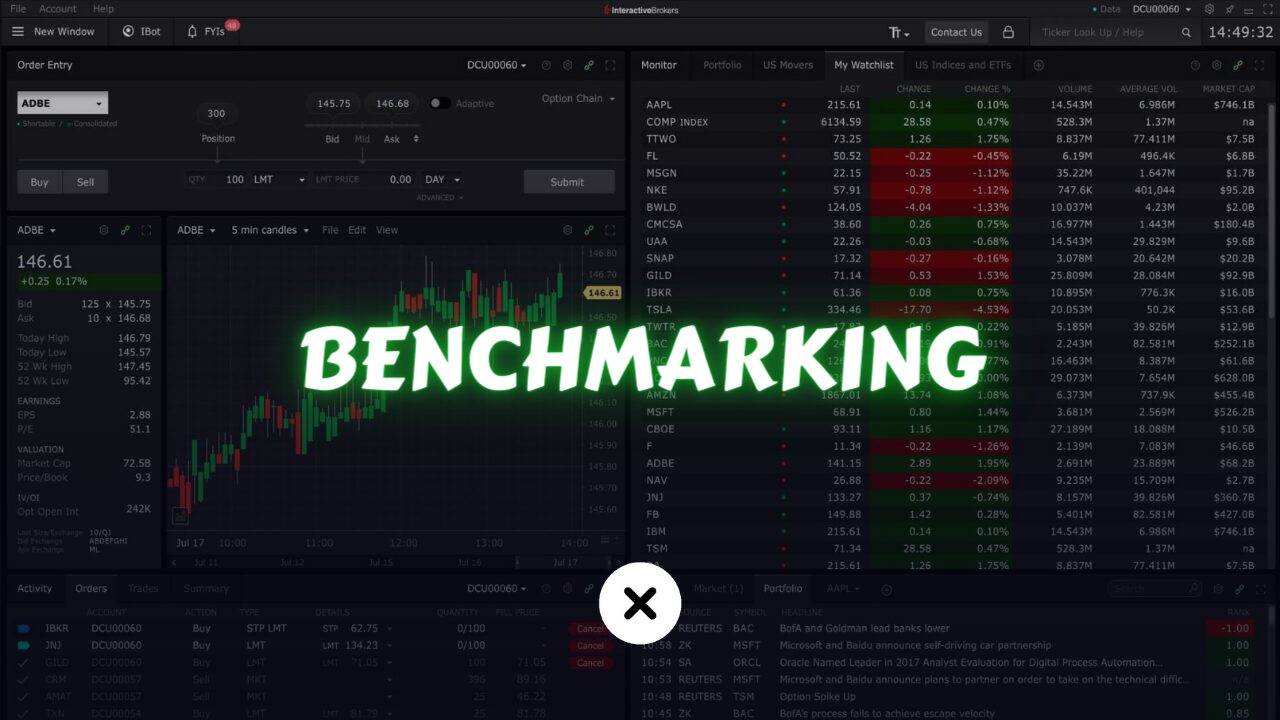
In the fast-paced world of finance, where every choice can change destinies, benchmarking is vital. It acts like a map, leading investors, fund managers, and financial experts through the maze of markets, helping them make smart choices and reduce risks. Essentially, benchmarking means comparing how well your investments and plans are doing compared to a standard. It lets people see if their investments and strategies are working as they should.
Benchmarking is widely recognized as a favored method for conducting fundamental analysis.
Let’s dig into the details of benchmarking in finance and see why it’s so important in managing investments.
What is Benchmarking?
Benchmarking in finance refers to the process of comparing the financial performance, metrics, or characteristics of a company or investment against a predefined benchmark. The benchmark serves as a standard or reference point against which the financial performance of a company or investment is evaluated.
In finance, benchmarking is commonly used in various areas, including investment management, portfolio analysis, and performance evaluation. The benchmark can be an index, such as the S&P 500 for the overall stock market, or a specific index representing a particular sector or asset class.
The purpose of benchmarking in finance is to assess how well a company or investment is performing relative to its peers or the broader market. By comparing financial ratios, key performance indicators, or other relevant metrics to the benchmark, analysts and investors can gain insights into the relative strengths, weaknesses, and opportunities for improvement.
For example, in investment management, benchmarking is used to evaluate the performance of a portfolio or investment strategy against a designated benchmark. If a portfolio outperforms the benchmark, it indicates that the portfolio manager has generated above-average returns. On the other hand, underperformance against the benchmark may prompt a reevaluation of the investment approach or asset allocation.
Benchmarking also helps investors and analysts identify investment opportunities and trends. By comparing financial metrics of different companies within the same industry or sector to a benchmark, they can identify undervalued or overvalued stocks and make more informed investment decisions.
Overall, benchmarking in finance provides a standardized way to measure and evaluate the financial performance of companies, investments, or portfolios. It enables comparisons, identifies areas for improvement, and assists in making informed financial decisions based on relative performance.
Types of Benchmarks
Market Indices: Market indices are the most commonly used benchmarks in finance. These indices track the performance of a specific segment of the market, such as stocks, bonds, or commodities. Examples include the Dow Jones Industrial Average (DJIA), the NASDAQ Composite Index, and the Russell 2000 Index.
Peer Group Comparisons: In peer group benchmarking, investments are compared against similar funds or portfolios within the same asset class or investment style. This type of benchmarking is particularly relevant for mutual funds, hedge funds, and other managed investment vehicles.
Absolute Benchmarks: Absolute benchmarks, also known as hurdle rates, represent a predetermined rate of return that an investment must exceed to be considered successful. These benchmarks are often used in performance evaluations for individual securities or investment strategies.
Customized Benchmarks: Sometimes, standard benchmarks may not accurately reflect the objectives or constraints of a particular investment strategy. In such cases, investors may opt to create custom benchmarks tailored to their specific requirements.
Example:
Let’s take a look at the banking sector.
Big institutions like major banks, investment managers, fund managers, and mutual funds often have a document called a prospectus. This paper lays out the rules and limits on how they can invest their clients’ money. Inside the prospectus, they specify how much money they can put into different parts of the economy. For example, they might say they’ll put 30% of the money into banks, 20% into tech companies, and 10% into bonds. No matter which part of the economy they invest in, they have to follow the rules in their prospectus.
Within these rules, a portfolio manager is in charge of a group of experts called analysts. These analysts’ main job is to find banks that they think will do really well. Let’s say they’re looking at Bank of America (BAC), Citigroup (C), Royal Bank, and TD. They want to find banks that are worth more than they’re being sold for and will probably go up in value over time. To do this, they use a method called benchmarking.
The analysts will carefully compare these banks. They’ll look at things like how much money the banks are making compared to their stock price (P/E ratio). BAC has a P/E ratio of 12, Citigroup has a P/E ratio of 15, TD has a P/E ratio of 28, and Royal Bank has a P/E ratio of 14. They’ll also check how much money the banks pay out to their investors (dividend yield). BAC pays out 4%, Citigroup and TD don’t pay dividends, and Royal Bank pays out 3%. They’ll also look at other important numbers specific to banks. Their goal is to find out which bank’s stock is worth more than it’s being sold for.
| P/E | DIVIDEND % | |
| BAC | 12 | 4% |
| C | 15 | 0 |
| RY | 14 | 3% |
| TD | 28 | 0 |
If these were the only numbers available, the analysts would probably think Bank of America is the best choice to invest in because investors are only paying $12 for every dollar the company makes. So, they’d add Bank of America to their portfolio because they think it’s worth more than its current price.
But let’s say, after a while, maybe a year later, the new numbers come out. Now, BAC’s number goes up to 20, Citigroup’s goes down to 13, Royal Bank’s goes up to 18, and TD’s goes up to 22. Now, Bank of America seems like it’s priced higher compared to before because investors are now paying $20 for every dollar the company makes.
When the portfolio manager gets this info from the analysts, they’ll decide to sell Bank of America from their portfolio. On the other hand, they’d see Citigroup as a good chance to buy because investors are only paying 13 times the company’s earnings, which means it’s a better deal.
| P/E | DIVIDEND % | |
| BAC | 20 | 4% |
| C | 13 | 0 |
| RY | 18 | 3% |
| TD | 22 | 0 |
Benchmarking is quite popular with big institutions because they have to follow a prospectus. This document tells them how much money they can put into different parts of the economy. They have to keep a set amount of money in each part to stop them from putting too much money into one area, like putting 50% of their money into one thing.
So, these institutions regularly sell stocks that have done well or are now worth more than they should be, while looking for cheaper stocks to buy. They keep doing this over and over, deciding what to buy and sell based on looking at how companies are doing.
Understanding this is important because it helps spot good investment chances. For example, if you see a part of the economy where one company is worth a lot less than it should be and a lot of big institutions own it, it might mean they’ll start buying it soon. But if a company in the same part of the economy suddenly becomes worth more than it should be, it might mean the big institutions will start selling it.
But benchmarking doesn’t work the same for every part of the economy. For example, it’s not great for the biotech industry because one company can suddenly release a new drug and its stock price goes up a lot. In cases like this, just looking at how much money the company is making isn’t enough. You need to think about what might happen with their new drugs and the company’s future. And the tech industry is tricky for benchmarking because tech companies can come out with new things anytime, making it risky to only use normal benchmarking methods. But for industries like banking or utilities, benchmarking is easier because it’s simpler to see how well they’re doing.
Challenges and Considerations
While benchmarking offers numerous benefits, it comes with its own set of challenges and considerations:
Selection Bias: Choosing an appropriate benchmark requires careful consideration of factors such as investment objectives, asset class, and risk profile. Failing to select a suitable benchmark can lead to misleading performance comparisons and flawed decision-making.
Benchmark Drift: Over time, benchmarks may deviate from the original investment mandate due to changes in market conditions, index composition, or investment strategy. Monitoring for benchmark drift is essential to ensure meaningful performance comparisons.
Data Quality and Availability: Accurate benchmarking relies on reliable data sources and consistent calculation methodologies. Data discrepancies or incomplete information can undermine the integrity of performance analysis.
Benchmark Interpretation: Simply comparing investment returns to a benchmark may not provide a comprehensive understanding of performance drivers. Factors such as style drift, sector exposure, and timing effects must be considered when interpreting benchmark-relative performance.
Conclusion
In the complex and competitive landscape of finance, benchmarking serves as a compass, guiding investment decisions and performance evaluation. Whether assessing the performance of a mutual fund, analyzing the risk-adjusted returns of a portfolio, or formulating investment strategies, benchmarking provides valuable insights into financial markets. By understanding the nuances of benchmarking and addressing its challenges, investors and financial professionals can harness its power to navigate the uncertainties of the financial world and achieve their investment objectives.
