What are Financial Ratios?
Financial ratios are analytical tools used to evaluate the financial performance and position of a company. They involve comparing different financial variables to assess the company’s profitability, liquidity, solvency, efficiency, and market valuation.
Calculating financial ratios involves extracting relevant data from a company’s financial statements, such as the balance sheet, income statement, and cash flow statement.
The formula for each ratio may vary depending on the specific metric being analyzed. While some ratios are straightforward to calculate, others may require more complex formulas or adjustments to ensure accurate interpretation.
Different Types of Financial Ratios
Financial ratios encompass a diverse range of metrics, each offering unique insights into different facets of a company’s financial standing.
Some of the key categories of financial ratios include:
Activity Ratios:
Activity ratios measure a company’s efficiency in managing its assets and resources. They assess how well a company utilizes its inventory, receivables, and payables, as well as its ability to generate sales and turnover assets. Examples of activity ratios include inventory turnover ratio, accounts receivable turnover ratio, and accounts payable turnover ratio.
Liquidity Ratios:
Liquidity ratios evaluate a company’s ability to meet its short-term financial obligations. They indicate the company’s ability to convert its assets into cash to cover its immediate liabilities. Common liquidity ratios include the current ratio, quick ratio, and cash ratio.
Solvency Ratios:
Solvency ratios assess a company’s long-term financial stability and its ability to meet its long-term debt obligations. These ratios provide insights into the company’s leverage, capital structure, and overall financial risk. Examples of solvency ratios include the debt-to-equity ratio, interest coverage ratio, and debt ratio.
Profitability Ratios:
Profitability ratios measure a company’s ability to generate profits relative to its revenue, assets, and equity. These ratios provide insights into the company’s profitability, efficiency, and overall financial performance. Examples of profitability ratios include gross profit margin, net profit margin, return on assets (ROA), and return on equity (ROE).
Valuation Ratios:
Valuation ratios help investors assess the attractiveness of a company’s stock by comparing its market price to its fundamental values. These ratios are commonly used in equity valuation and can help determine whether a stock is overvalued or undervalued. Examples of valuation ratios include price-to-earnings (P/E) ratio, price-to-book (P/B) ratio, and dividend yield.
How to Use Financial Ratios?
Financial ratios play a crucial role in stock trading by providing investors with valuable insights and decision-making tools.
Here are some practical applications of financial ratios in stock trading:
Comparative Analysis:
Investors can compare financial ratios across companies within the same industry or sector to identify trends, benchmark performance, and uncover potential investment opportunities. By analyzing how a company’s ratios stack up against its peers, traders can assess its relative strength and competitive position in the market.
Fundamental Analysis:
Financial ratios form the cornerstone of fundamental analysis, a method used to evaluate the intrinsic value of a stock based on its underlying financial factors. By scrutinizing a company’s financial statements and calculating relevant ratios, investors can assess its overall health, growth prospects, and investment potential.
Risk Assessment:
Financial ratios provide valuable insights into a company’s financial risk profile, helping investors assess the likelihood of default or financial distress. By examining solvency ratios, liquidity ratios, and debt metrics, traders can gauge the level of risk associated with an investment and adjust their portfolio accordingly.
Decision Making:
Financial ratios serve as decision-making tools for investors, guiding their buy, sell, or hold decisions based on the underlying financial fundamentals of a company. Whether evaluating a potential investment or re-evaluating an existing position, traders rely on financial ratios to make informed choices aligned with their investment objectives and risk tolerance.
Financial ratios have a big effect on companies, especially when things are changing. If there’s news that changes a company’s fundamentals and its financial ratios, it can really change the stock price.
Unlike looking at charts, looking at the basics of a company is more powerful. So, when something big happens to a company’s basics, it’s more important than any chart analysis.
Since there are lots of financial ratios, it’s helpful to look at each one on its own with examples. This is the best way to really understand them.
What is Shares Outstanding?
Let’s think about three different companies: ABC, DEF, and XYZ.
Imagine all three companies, ABC, DEF, and XYZ, had their first time selling shares to the public (IPOs). ABC sold its shares for $1.5 each, offering 30 million shares in total. DEF also sold its shares for $1.5 each, but they had 90 million shares to offer. Similarly, XYZ sold its shares for $1.5 each, with a total of 10 million shares available.
Initial Public Offering(IPO)
When a company decides to go public and requires capital, they approach a firm and initiate an Initial Public Offering (IPO) to sell their shares in the primary market. Typically, the underwriting firm assesses various factors, including the company’s fundamentals, to determine the price and quantity of shares they can offer to the company. This evaluation varies among different companies.
Here you can find detailed information about IPO.
Debt / Liabilities of a Company
After their IPOs, let’s look at the loans each company got. ABC got a $2 million loan from a bank, DEF got a $5 million loan, and XYZ got a $3 million loan.
This is how companies usually do it. They start by selling shares to get money and might also get loans. Selling shares means they’re getting money in exchange for a piece of ownership, while getting loans adds to what they owe. Altogether, these things make up their total value.
Assets = Liabilities + Equity
| ABC | DEF | XYZ | |
| SHARES OUTSTANDING | 30M | 90M | 10M |
| IPO | $1.5 | $1.5 | $1.5 |
| DEBT | $2M | $5M | $3M |
Now, let’s dive into creating simple financial statements for these companies.
The first statement we’ll look at is the balance sheet. As mentioned before, this statement has three main parts: assets, liabilities, and equity.
First up, let’s figure out the equity for Company ABC. To do this, we can calculate it based on the sale of 30 million shares at $1.5 each. That adds up to $45 million in equity. Also, ABC got a $2 million loan from the bank, which goes under liabilities since it’s money they owe.
According to the accounting rule, assets should equal liabilities plus equity. So, $2 million (liabilities) + $45 million (equity) equals $47 million. That means Company ABC has $47 million in assets, like cash, buildings, or machinery.
Now onto the second company, DEF, which had 90 million shares. By multiplying 90 million shares by $1.5 per share, we get $135 million in equity. DEF also got a $5 million loan, which counts as their liabilities. So, the total assets for Company DEF come to $140 million.
Lastly, let’s talk about the third company, XYZ. They only sold 10 million shares at $1.5 each, making their equity $15 million. Plus, they have $3 million in liabilities. Altogether, their total assets add up to $18 million.
| ABC | DEF | XYZ | |
| ASSETS | $47M | $140M | $18M |
| LIABILITIES | $2M | $5M | $3M |
| EQUITY | $45M | $135M | $15M |
This is a basic example of a starting balance sheet for these companies. It gives a simple overview of where they stand financially to begin with.
As the year goes on, these companies will do different things like selling stuff or providing services. When the year ends, they’ll need to make a report called an income statement. This report shows how much money they made or lost during that year.
Now, let’s look at a sample income statement.
Let’s say Company ABC made $2 million in profit, Company DEF earned $5 million, and Company XYZ got $1 million.
| ABC | DEF | XYZ | |
| NET INCOME | $2M | $5M | $1M |
Now, let’s imagine that these companies paid out dividends (money given to the shareholders of the company), which will show up in the cash flow statement.
Even though the cash flow statement has lots of parts, we’ll just look at dividends for this example. Dividends will be shown as a negative number because it means cash is leaving the company.
Company ABC gave $2 million in dividends to its shareholders, Company DEF gave $1 million, but Company XYZ didn’t pay any dividends to its shareholders.
| ABC | DEF | XYZ | |
| DIVIDENDS | $-2M | $-1M | – |
Now, let’s update the balance sheet to show how the companies stand after one year of operations.
First, let’s look at Company ABC. They started with $45 million in equity. After making $2 million in profit, they gave it all to their shareholders as dividends. So, their equity stays the same. They still owe $2 million in debt, as they haven’t paid back any loans. That means their total assets, which is what they owe plus what they own, remains at $47 million.
Now onto Company DEF. They began with $135 million in equity. After making $5 million in profit, they gave $1 million of that to their shareholders and kept the rest, so their equity went up by $4 million to $139 million. They still owe $5 million in debt. So, their total assets have gone up to $144 million.
Lastly, let’s talk about Company XYZ. They started with $15 million in equity. After making $1 million in profit, they didn’t give any of it to their shareholders. So, their equity went up to $16 million. They still owe $3 million in debt. So, their total assets are now $19 million.
| ABC | DEF | XYZ | |
| ASSETS | $47M | $144M | $19M |
| LIABILITIES | $2M | $5M | $3M |
| EQUITY | $45M | $139M | $16M |
Looking at the updated balance sheet, it’s not easy to figure out which company is doing better. There are lots of things to think about. These companies are different in size and how much money they make, so comparing them directly is hard.
To understand them better, we often use ratios from their financial statements. By looking at these ratios and comparing them, we can get a better idea of how they’re doing and make smarter judgments about them.
Now, let’s talk about the prices these companies are selling for on the market. Company ABC is selling for $2, Company DEF for $2.5, and Company XYZ for $5. It’s worth mentioning that these prices can go up and down over time. But these changes in price don’t directly change how much the company is worth, because the worth of the company was decided when they first sold their shares in the IPO.
However, these market prices do affect how much the stock is worth when people buy or sell it, because investors are trading at these market prices.
What is Market Capitalization?
So, what’s the market cap of these companies?
Market capitalization, often called market cap, tells us how much a company is worth in the stock market. We figure it out by multiplying the current market price of a company’s shares by how many shares they have out there.
Market cap gives us an idea of how big a company is, and we use it to put companies in different groups, like large-cap, mid-cap, and small-cap.
Small-cap stocks are usually worth between $300 million and $2 billion. Medium-cap stocks are between $2 billion and $10 billion, and large-cap stocks are over $10 billion in value.
Here’s the math:
Market Cap = Current Market Price per Share x Total Number of Shares Outstanding
If Company ABC has 30 million shares and each one is selling for $2, we can find its market cap by multiplying the current price per share by the total number of shares. So, for ABC, it would be $60 million, because $2 times 30 million shares equals $60 million.
Now, for Company DEF, their stock price is $2.5, and they have 90 million shares out there. So, their market cap would be $225 million.
Lastly, Company XYZ has 10 million shares and they’re trading at $5 each. That means their market cap would be $50 million.
| # | ABC | DEF | XYZ |
| MARKET PRICE | $2 | $2.5 | $5 |
| MARKET CAP | $60M | $225M | $50M |
What is Book Value of a Company?
Now, let’s talk about book value. What is it?
Book value, also called net asset value, is a financial number that shows how much a company is worth. We find it by taking away all the money a company owes from all the stuff it owns. So, book value is the value of a company’s things that would be left over if it paid off all its debts.
Here’s how we calculate it:
Book Value = Total Assets – Total Liabilities
Book value helps us see how much a company’s stuff is worth after we take away what it owes. We usually see it on the balance sheet, in the equity section.
Investors and experts use book value to understand how healthy a company’s finances are. It shows how much would be left for shareholders if the company had to sell everything.
For our companies, let’s see:
Company ABC has $47 million in assets and owes $2 million. So, its book value is $45 million. Company DEF has $144 million in assets and owes $5 million. So, its book value is $139 million. And for Company XYZ, it has $19 million in assets and owes $3 million. So, its book value is $16 million.
| ABC | DEF | XYZ | |
| MARKET PRICE | $2 | $2.5 | $5 |
| MARKET CAP | $60M | $225M | $50M |
| BOOK VALUE | $45M | $139M | $16M |
Here’s why the book value and equity are the same in this case: Our balance sheet is simple, and all the stuff a company owns is things we can touch and see. But in real life, companies might have things they own that we can’t touch, like ideas or reputation.
Take Apple Inc., for example. Just the name “Apple” is worth a lot. Things like brand reputation, ideas, or patents can make a company worth more, and these things aren’t fully shown in the book value alone.
What is Book Value per Share?
When we look at a company’s book value, we see the total value of the whole company, not how much each person who owns shares would get. To fix this, investors often use a number called book value per share.
Book value per share is a ratio that shows how much a company is worth for each share of its stock. It tells us how much of the company’s value is tied to each share.
To find book value per share, we divide the total value of the company (book value) by how many shares there are. Here’s the formula:
Book Value per Share = Total Book Value / Total Number of Shares Outstanding
Book value per share shows how much of the company’s stuff each shareholder would get if the company had to sell everything. Investors use it to see if a company’s stock is a good deal compared to what it’s selling for on the market.
In our examples:
For Company ABC, with a book value of $45 million and 30 million shares, the book value per share is $1.5. For Company DEF, with a book value of $139 million and 90 million shares, the book value per share is around $1.54. For Company XYZ, with a book value of $16 million and 10 million shares, the book value per share is $1.6.
| ABC | DEF | XYZ | |
| MARKET PRICE | $2 | $2.5 | $5 |
| MARKET CAP | $60M | $225M | $50M |
| BOOK VALUE | $45M | $139M | $16M |
| BOOK PER SHARE | $1.5 | $1.54 | $1.6 |
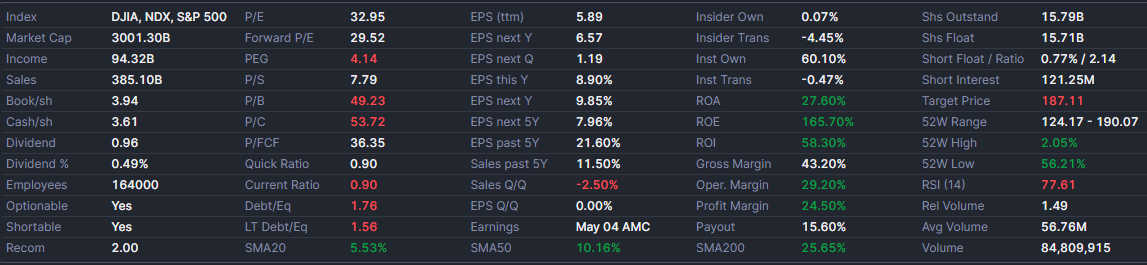
At the time of writing this article Apple’s book value per share ratio is 3.94, but its stock is trading at $190. This might seem odd—why is a high-priced stock’s book value relatively low? Well, that’s because a stock’s market value isn’t just about its book value. It also reflects what investors think the company will earn in the future. For Apple, the high stock price shows that people trust it’ll make big profits down the line. So, a stock’s market price can be way higher than its book value because investors believe in the company’s future success.
A company’s value isn’t just about what it’s worth now; it’s also about what it could earn later. That’s why some companies, even if they’re not making profits yet, are still worth a lot. Investors think they’ll start raking in cash in the future, and that’s why their value is high. In other words, a company’s price isn’t just about what it’s worth today; it’s also about what people think it’ll be worth tomorrow. So, even if a company’s not making much now, it could still be worth a ton based on what folks expect it’ll make later.
Usually, a company’s stock price never drops below its book value per share. If it does, it means the company could sell everything, pay its debts, and still have cash left over for shareholders. But that’s rare. If a stock’s price goes under its book value, investors see it as a chance to buy low and sell high later. They jump in, and the price goes back up. These situations don’t happen often, but when they do, they don’t last long because investors quickly swoop in to grab the cheap stock.
What is Price to Book(P/B)?
Just looking at the book value per share can be misleading because it doesn’t think about the stock’s price.
Let’s go back to our example. XYZ might have a higher book value per share than ABC and DEF, but buying one share of XYZ costs $5, while one share of DEF is $2.5. So, with the same amount of money, you can buy two shares of DEF, which would give you more book value than buying one share of XYZ.
To really understand what’s going on, we need to find the price-to-book ratio. This ratio tells us how the stock’s price compares to its book value.
The price-to-book (P/B) ratio is calculated by dividing the market price per share by the book value per share.
P/B Ratio = Market Price per Share / Book Value per Share
Investors and experts use this ratio to see if a stock is selling for more or less than what it’s worth on paper. A P/B ratio above 1 means the market thinks the company’s worth more than its books say. A P/B ratio below 1 means the market thinks the company’s worth less.
In our example:
For Company ABC, with a market price of $2 per share and a book value of $1.5 per share, the P/B ratio is about $1.33. This means for every $1.33 you pay, you get $1 of book value.
For Company DEF, with a market price of $2.5 per share and a book value of $1.54 per share, the P/B ratio is about $1.62. So, you’re paying $1.62 to get $1 of book value.
For Company XYZ, with a market price of $5 per share and a book value of $1.6 per share, the P/B ratio is about $3.13.
Based on the P/B ratio, Company ABC seems like the better deal because its ratio is the lowest. That means for every $1.33 you pay, you get $1 of book value. DEF and XYZ have higher ratios, which means you’re paying more for each unit of book value. So, ABC looks like the better choice.
| ABC | DEF | XYZ | |
| MARKET PRICE | $2 | $2.5 | $5 |
| MARKET CAP | $60M | $225M | $50M |
| BOOK VALUE | $45M | $139M | $16M |
| BOOK PER SHARE | $1.5 | $1.54 | $1.6 |
| PRICE TO BOOK | $1.33 | $1.62 | $3.13 |
Once again, if we examine Apple’s price-to-book (P/B) ratio, it stands at 49.23.(may change in the future) This indicates that investors are willing to pay approximately 49 times the book value per dollar. In other words, for each dollar of book value Apple possesses, investors are valuing it at 49 dollars in the market.
What is Earnings per Share(EPS)?
This is the much-awaited number that comes out every three months, catching the interest of both investors and analysts.
At the close of each quarter, the income statement doesn’t just show how much money a company made overall—it also gives us earnings per share (EPS). Investors are keen to know how much a company earned, but what really matters is the earnings per share. That tells us how much profit each share of stock is bringing in.
Earnings per share (EPS) is a money measure that shows how much of a company’s profit goes to each share of common stock. To find it, we divide the company’s net earnings or net income by the total number of shares out there.
EPS = Earnings / Total Number of Shares Outstanding
For Company ABC, they made $2 million in earnings, and there are 30 million shares out there. So, their EPS is $0.0666 per share.
Company DEF made $5 million in earnings, and they have 90 million shares out there. Their EPS comes to $0.0555 per share.
And for Company XYZ, they earned $1 million, and there are 10 million shares out there. That gives them an EPS of $0.1 per share.
| ABC | DEF | XYZ | |
| MARKET PRICE | $2 | $2.5 | $5 |
| MARKET CAP | $60M | $225M | $50M |
| BOOK VALUE | $45M | $139M | $16M |
| BOOK PER SHARE | $1.5 | $1.54 | $1.6 |
| PRICE TO BOOK | $1.33 | $1.62 | $3.13 |
| EPS | $0.066 | $0.055 | $0.1 |
So, looking at the earnings per share (EPS), it seems like XYZ is doing the best out of the three companies.
Earnings are what people pay the most attention to, and usually, when a company does better than people thought, the stock price goes up. But if it does worse, the stock price usually goes down.
Just looking at EPS might not be enough because it doesn’t think about the stock’s price. To really understand what’s going on, we need to check out the Price-to-Earnings (P/E) ratio.
What is Price to Earnings(P/E)?
The Price-to-Earnings (P/E) ratio is a way to see if a company’s stock is priced fairly compared to its earnings. To figure it out, we divide the market price per share by the earnings per share (EPS).
Price to Earnings (P/E) = Market Price per Share / Earnings per Share(EPS)
The P/E ratio tells us how much investors are ready to pay for every dollar the company earns.
A high P/E ratio means investors are expecting big things from the company in the future, so they’re okay with paying more for the stock. But a low P/E ratio could mean investors aren’t as hopeful about the company’s future.
For example:
For Company ABC, with a stock price of $2 and an EPS of $0.066, the P/E ratio is about 30. That means investors are paying 30 times the company’s earnings for each dollar earned.
For Company DEF, trading at $2.5 with an EPS of $0.055, the P/E ratio is about 45. So, investors are paying $45 for every dollar the company earns.
And for Company XYZ, trading at $5 with an EPS of $0.1, the P/E ratio is 50. That shows investors are paying $50 for each dollar the company earns.
| ABC | DEF | XYZ | |
| MARKET PRICE | $2 | $2.5 | $5 |
| MARKET CAP | $60M | $225M | $50M |
| BOOK VALUE | $45M | $139M | $16M |
| BOOK PER SHARE | $1.5 | $1.54 | $1.6 |
| PRICE TO BOOK | $1.33 | $1.62 | $3.13 |
| EPS | $0.066 | $0.055 | $0.1 |
| P/E | 30 | 45 | 50 |
At first glance, it might seem like company XYZ is the best because it has a higher EPS. But when you look at the stock price, things change. XYZ’s stock is pricey, and for the same amount of money, you could buy two shares of DEF or two and a half shares of ABC. So, you need to think about the price when you’re comparing the companies. Considering the price, it’s clear that at XYZ, investors are paying 50 times the earnings, at DEF they’re paying 45 times, and at ABC, it’s only 30 times. In this situation, ABC looks like the better option because it gives you more earnings for the price you pay.
What is Return on Equity(ROE)?
Return on Equity (ROE) is a financial measure that tells us how well a company is using its shareholders’ money to make profits. It shows how efficiently a company turns shareholders’ investments into earnings.
To find ROE, you divide the net income (or earnings) by the shareholders’ equity and then multiply by 100 to get a percentage.
ROE = (Net Income / Shareholders’ Equity) * 100
ROE helps us see how good a company is at making profits compared to the money its shareholders put in. A higher ROE means the company is using its equity well to make profits, while a lower ROE might mean the company isn’t making as much profit or isn’t using its shareholders’ money effectively.
For example:
For Company ABC, they made $2 million in earnings, and their equity was $45 million. So, when we divide $2 million by $45 million and multiply by 100, we get an ROE of 4.4%.
Now, let’s look at Company DEF. They earned $5 million, and their initial equity was $135 million. So, their ROE is 3.7%.
And for Company XYZ, they earned $1 million, and their initial equity was $15 million. So, their ROE is 6.6%. Out of these three companies, XYZ had the highest ROE.
| ABC | DEF | XYZ | |
| MARKET PRICE | $2 | $2.5 | $5 |
| MARKET CAP | $60M | $225M | $50M |
| BOOK VALUE | $45M | $139M | $16M |
| BOOK PER SHARE | $1.5 | $1.54 | $1.6 |
| PRICE TO BOOK | $1.33 | $1.62 | $3.13 |
| EPS | $0.066 | $0.055 | $0.1 |
| P/E | 30 | 45 | 50 |
| ROE | 4.4% | 3.7% | 6.6% |
We look at ROE because companies can fund their profits using either their own money (equity) or borrowed money (debt). When a company leans more on borrowed money and still makes big profits, it benefits the shareholders more because the borrowed money helps the company grow. So, the return on equity goes up a lot because the profits are made with borrowed money instead of just the shareholders’ own money. But the people who lent the money (debt holders) still get their interest payments, no matter how well the company does.
Looking at these three companies, Company ABC and DEF don’t rely much on borrowed money compared to their own money. But Company XYZ has a lot of debt compared to its own money, showing it depends heavily on borrowing to run. If the company does really well, the shareholders will get a bigger return. But if it does badly, it still has to pay the debt holders, which could hurt the shareholders’ returns.
It’s crucial to stress that we look at return on equity because in the end, what matters most is how much the shareholders will get back.
What are Dividends?
Dividends are when a company shares some of its profits with its shareholders. When a company makes money, it can decide what to do with it. One choice is to put the money back into the company for growth. Another option is to give some of it to shareholders as dividends.
Usually, dividends are paid in cash, but they can also be given as more shares of stock or other types of property. The amount of dividends each shareholder gets is decided by the company’s board of directors. They look at things like how the company is doing financially, its future plans, and its rules about dividends.
It’s worth noting that not all companies pay dividends. Some, especially those focused on growing, might put all their profits back into the company to help it grow and make shareholders’ investments worth more. These companies might spend their money on things like research, buying other companies, or paying off debts, instead of giving out dividends.
In our example, we talked about Company ABC giving out $2 million in dividends. To find out how much each shareholder gets, we divide the $2 million by the total number of shares. So, $2 million divided by 30 million shares means each shareholder gets $0.06 in dividends.
For Company DEF, even though they earned $5 million, they only gave out $1 million in dividends. So, when we divide that by the total number of shareholders, which is 90 million, each shareholder gets about $0.01. If you had 1 share, you’d get one cent, and if you had 100 shares, you’d get one dollar in dividends.
Company XYZ decided not to give out any dividends at all.
| ABC | DEF | XYZ | |
| MARKET PRICE | $2 | $2.5 | $5 |
| MARKET CAP | $60M | $225M | $50M |
| BOOK VALUE | $45M | $139M | $16M |
| BOOK PER SHARE | $1.5 | $1.54 | $1.6 |
| PRICE TO BOOK | $1.33 | $1.62 | $3.13 |
| EPS | $0.066 | $0.055 | $0.1 |
| P/E | 30 | 45 | 50 |
| ROE | 4.4% | 3.7% | 6.6% |
| DIVIDENDS | $0.06 | $0.01 | – |
As we said before, just looking at how much a company pays in dividends isn’t enough. You also need to think about the stock price. That’s why it’s better to look at something called the dividend yield.
What is Dividend Yield?
Dividend yield, a financial measure that indicates how much a company pays in dividends relative to its stock price, is calculated by dividing the annual dividend per share by the current stock price, and then expressing the result as a percentage.
Here’s the formula:
Dividend Yield = (Annual Dividend per Share / Stock Price) x 100
So, for example, with company ABC, if you receive $0.06 per share in dividends and the stock price is $2, the calculation would be (0.06 / 2) * 100 = 3%. This means you would earn a 3% return on your investment through dividends over the year.
For company DEF, if you’re receiving $0.01 per share in dividends and the stock price is $2.5, the dividend yield would be 0.4%.
| ABC | DEF | XYZ | |
| MARKET PRICE | $2 | $2.5 | $5 |
| MARKET CAP | $60M | $225M | $50M |
| BOOK VALUE | $45M | $139M | $16M |
| BOOK PER SHARE | $1.5 | $1.54 | $1.6 |
| PRICE TO BOOK | $1.33 | $1.62 | $3.13 |
| EPS | $0.066 | $0.055 | $0.1 |
| P/E | 30 | 45 | 50 |
| ROE | 4.4% | 3.7% | 6.6% |
| DIVIDENDS | $0.06 | $0.01 | – |
| DIVIDEND YIELD | 3% | 0.4% | – |
When we look at these ratios, we can compare the companies. But it’s essential to remember that companies vary, like growth ones and value ones. So, which one’s best depends on your investment strategy or what you prefer. Growth and value companies have distinct traits and metrics valued in unique ways.
Growth Companies vs Value Companies
We can classify companies into two categories: growth companies and value companies.
Growth companies are all about future expansion, not immediate profits. They might not be making big money right now, but the plan is for them to grow a lot in the future. So, instead of giving out dividends to shareholders, they put their earnings back into growing the business.
Think of a biotech company working on a new drug. Even if it’s not profitable yet, its main goal is to get that drug out and do well in the market. That’s what makes it a growth company – it’s all about growing and making profits later, not right away.
Growth companies usually have high price-to-earnings (P/E) ratios, showing that investors are willing to pay more for their potential to grow.
Now, value companies are different. They’ve got solid fundamentals and strong financial indicators. You’ll see things like a reasonable price-to-earnings (P/E) ratio, a good price-to-book ratio, and a nice dividend yield. Unlike growth companies, value companies have been around for a while, making profits consistently.
Value companies are valued based on what they’re earning now and their assets, not just what they might earn in the future. Investors like them because they’re already doing well in their industries and making profits steadily. Unlike growth companies, they’re not expected to grow a lot in the future.
Imagine you own a restaurant and you’ve made a million bucks in profits. Now, do you want to put that money into opening another restaurant, hoping to grow even more? Or do you want to take the cash out?
If you’re running a growth-focused restaurant, you’ll probably keep that money in the business. You see a chance for more success in the future, so you’re reinvesting the profits to make your restaurant business bigger.
But if you’ve got a value-focused restaurant, it means you’re already doing well, and there’s not much room left to grow. So, you’ll likely take the money out of the business. Your main goal is to keep making a profit right now, not necessarily to expand.
So, when we look at company ABC, it seems more like a value company. Its low price-to-book ratio and low price-to-earnings ratio point to that. Plus, ABC pays out a nice dividend, which fits with being a value-focused company.
Now, company XYZ is different. It’s got a high price-to-book ratio and a high price-to-earnings ratio, which suggests it might be more of a growth company.
Conclusion
Among the many metrics out there, these ones are super important because most people in the market pay close attention to them. That’s why they can have a big impact on stock prices compared to other metrics. The idea is that by focusing on these metrics, traders can better predict how the market will move and make smart decisions based on what most other traders are looking at.
Different trading strategies use these metrics in different ways to make decisions. Learning about these strategies will help you understand how to use the metrics effectively. But for now, it’s key to really get what these metrics mean and why they matter. Once you’ve got that down, you’ll be ready to apply them to different trading strategies.
If you want to check out these metrics for stocks, I recommend using finviz. It’s a great website where you can filter stocks based on the specific metrics you’re interested in, giving you a customized way to analyze them.