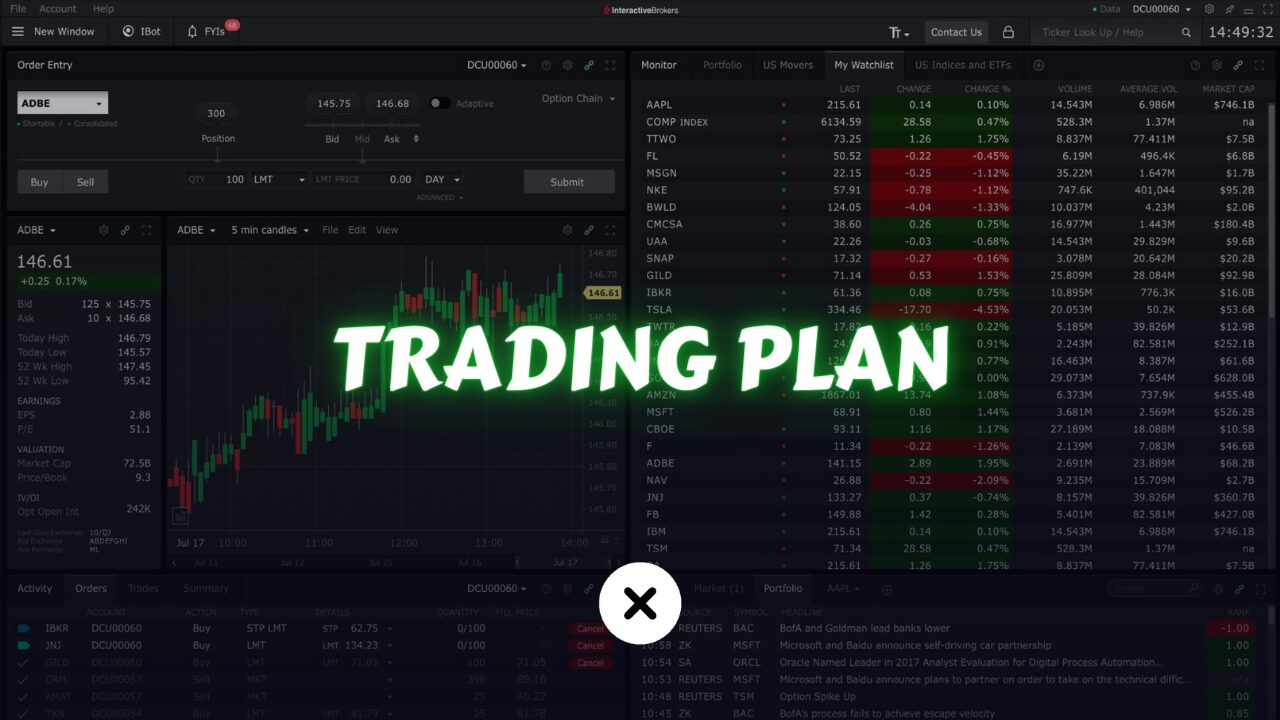
Building a trading plan is an essential step for any trader, whether you’re a beginner or a professional. A well-constructed trading plan serves as a roadmap to guide your trading activities, helping you to make informed decisions and maintain discipline. This guide will walk you through the key components of a robust trading plan and provide practical tips to ensure its effectiveness.
What is a Trading Plan?
A trading plan consists of a defined set of parameters that outline your trading strategy.
A trading strategy is like the big picture that explains the logic, risk management, methods, how you put it into action, and testing it out. A trading plan is a piece of your trading strategy. Some folks might mix up trading strategy and trading plan, but they’re actually two separate things.
Having a well-organized trading plan is just as important as anything else. No matter how skilled or smart you are, not having a strong trading plan will lower your chances of success. This idea is simple and hard to argue with.
When you’re trading, you’re up against some really smart and rich people worldwide. To handle this, it’s crucial to come in with a solid plan. Write down this trading plan and refine it carefully. This is important because emotions can mess things up during trading. Even if you think you’re logical, emotions can mess with your thinking. So, the trick is to write down your trading plan and stick to it when you’re trading.
That’s why, for every trading strategy you want to use, it’s crucial to create a trading plan for it. This plan will lay out exactly how you’ll put that strategy into action.
Make sure you establish your trading plan when you’re not actively trading, like when you’re feeling calm and thinking clearly.
What are the Essential Components of a Trading Plan?
Strategy:
Basically, it’s mostly a name, but it can also give you a clue about what your trading plan is all about. For example, it might talk about things like the dividend cut model, market opening gaps, or SMA crossovers.
Trading Style:
Is your way about swing trading, day trading, or holding onto positions for a long time? This basically sorts out how you trade. This difference is really important because, let’s say you’re in a day trading position that starts going the wrong way, feelings might make you switch from day trading to swing trading. Instead of stopping losses, you might hold onto the trade, which could mean even bigger losses. This shows how important it is to clearly say what style your strategy is. If it’s a day trading position, it has to be finished by the end of the trading day.
Strategy Type:
In our earlier lessons, we got to know the main types of strategies: mean-reverting strategies and momentum strategies. These descriptions tell us what each strategy is about. To explain more, a mean-reverting strategy is about making the most of price changes that go up and down, while a momentum strategy is about prices moving steadily in one direction.
Holding Period:
This is about “how long should I keep my position,” where you decide the shortest and longest times you’ll hold onto a position. For example, in day trading, you might keep a position for at least a few minutes and at most three hours. Imagine a situation where three hours have gone by, the trade hasn’t reached the desired take profit level yet, but it’s still going well. It’s really important to close the trade when the three-hour mark hits, even if the trade is still doing okay. Following your plan like this is super important. No matter what’s going on, you have to close the trade as your plan says, even if it means missing out on chances.
Asset Selection:
Which stocks or assets will you pick for this strategy? We know there are lots of stocks out there, but not all of them work well with every strategy. Some work better with certain strategies, while others don’t. So, you have to check your assets carefully to find the ones that work best with your strategy and decide how you’ll choose them. For example, you might look for things like high institutional ownership, low P/E ratios, or recent 52-week highs. How you pick stocks depends on the specific features of your strategy.
Entry Signal:
Basically, this is the thing that tells you to start a trade for your strategy. For example, if a stock hits its highest point in 52 weeks, there’s a crossover of moving averages, the RSI changes direction, or certain patterns show up on the chart, any of these could be a sign to start a trade. What signals you look for depends on the strategy you’re using. So, the entry signal could be anything.
Entry Style:
How do you enter your position? Do you use one market order, put in a limit order, or go for multiple entries? You have to decide how you’ll start a trade, based on the strategy you’re using.
Take Profit Signal:
At what point do you exit the trade to secure your profits? For instance, this could involve the trade reaching a specific percentage gain, encountering support or resistance levels, or when a trend undergoes a reversal, among other factors. This decision is, once again, strategy-dependent.
Take Profit Style:
How do you exit your trade to realize profits? Do you employ a limit order, execute a single market order, or opt for multiple exits? This approach also depends on the specific strategy you’re using.
Position Sizing:
What is your approach to entering a single trade? Is it a singular entry or do you use multiple entries, incorporating scaling-in or averaging-in techniques? Additionally, what level of risk is associated with each individual trade? Moreover, if you’re employing multiple entries for a single trade, how does the risk for each entry within that trade compare?
Follow the link to learn more about Position sizing.
Stop Loss:
At what point do you decide to cut your losses if the trade goes against you? What is the upper limit for potential financial loss on a single trade?
What is your strategy for managing losses, and what are the exit criteria you’ve established for your positions? For instance, if the trend is disrupted, you choose to exit the trade, or if support or resistance levels are breached, you opt to cut the loss. Following these rules, the stop loss price is then determined.
Bail-Out Indicators:
“Bailout indicators” refer to specific triggers that prompt you to exit a position, irrespective of whether you’re in a profitable or losing situation. These triggers could be related to fundamental events or news that unfold in the market.
Below is an illustrative game plan for a forex strategy based on Bollinger Bands:
| STRATEGY | BOLL BANDS |
| TRADING STYLE | DAY-TRADING |
| STRATEGY TYPE | MEAN-REVERSION |
| HOLDING PERIOD | FEW MINS TO CURRENT SESSION END |
| ASSET SELECTION | EURUSD |
| ENTRY SIGNAL | PRICE REACHING 3RD STD BANDS ON 15MIN CHART |
| ENTRY STYLE | SINGLE MARKET ENTRY |
| TAKE PROFIT SIGNAL | PRICE REACHING MIDDLE BAND ON 15MIN CHART |
| TAKE PROFIT STYLE | SINGLE LIMIT ORDER |
| POSITION SIZING | SINGLE ENTRY 2% RISK |
| STOP LOSS | 2% RISK, PRICE BREAKING NEAR SUPPORT/RESISTANCE |
| BAIL OUT INDICATORS | STONG FUNDAMENTAL NEWS |
With this method, you’ll see how each strategy creates a custom plan that’s perfect for its needs and how you want to use it. So, it’s important to make a plan that fits both the strategy and how you trade. This plan should match your style of trading and work well with your life.

In this area, following a trading plan is what helps you succeed in the long run. Even Jesse Livermore, a famous trader, had big wins and losses because he didn’t always stick to his own rules. He admitted this himself in the book “Reminiscences of a Stock Operator.”
Conclusion
Building a trading plan is not a one-time task but an ongoing process. It requires careful planning, continuous learning, and regular updates. By following these steps, you can create a comprehensive trading plan that serves as a strong foundation for your trading strategy, helping you to achieve your financial goals while managing risks effectively. Remember, the key to successful trading lies in preparation, discipline, and the ability to adapt to changing market conditions.
