In our previous article, we discussed trading strategies and why having a strategy is crucial for success in trading. In this article, we are going to learn how to come up with a trading strategy and how to create your own.
What is a Trading Strategy?
A trading strategy is a systematic plan developed by traders to achieve profitable returns in the financial markets. It encompasses a set of rules and criteria that guide decision-making processes, including when to enter and exit trades, how to manage risk, and how to allocate capital, the logic behind the strategy, and many others.
Trading strategies can vary a lot depending on a trader’s goals and preferences. The two main types are momentum and mean-reversion. Momentum strategies aim to catch trends as prices move in one direction, while mean-reversion strategies aim to profit from price fluctuations, meaning prices going up and down. Each type has different subtypes. Here are some common approaches:
Trend Following: This strategy involves identifying and following the direction of a prevailing market trend, whether upward (bullish) or downward (bearish).
Swing Trading: Swing traders seek to profit from short-to-medium-term price movements within a larger trend, holding positions for a few days to several weeks.
Scalping: Scalpers execute multiple trades within a very short time frame, often seconds to minutes, aiming to profit from small price movements.
Arbitrage: Arbitrageurs exploit price discrepancies between different markets or assets to lock in profits with minimal risk.
Quantitative Strategies: Quantitative strategies use mathematical models and algorithms to analyze market data and execute trades. These strategies often involve complex statistical methods and are commonly used in algorithmic and high-frequency trading.
Sentiment Strategies: Sentiment strategies gauge market sentiment by analyzing data from news sources, social media, and other public information. Traders use this information to make decisions based on the collective mood of the market participants.
Fundamental Trading: Traders using fundamental analysis base their decisions on the underlying financial health and performance of companies or economies, analyzing factors such as earnings reports, economic indicators, and geopolitical events.
Technical Trading: Technical traders rely on charts, patterns, and technical indicators to analyze past price movements and identify potential future trends.
Successful trading requires discipline, risk management, and following the chosen strategy’s rules.
Traders often backtest their strategies using historical data to assess their effectiveness before implementing them in live markets. Additionally, strategies may need to be adjusted over time to adapt to changing market conditions.
How to Come up with a Trading Strategy?
Now, you can come to the conclusion that following a strategy is the only way to succeed in trading, but how do you come up with one?
You have many options for finding trading strategies: searching online, reading books, or creating your own. Google can be incredibly helpful because knowing the name of a strategy is key to finding more information about it. Staying updated with market news, perhaps through platforms like Yahoo Finance, is essential.
If you’re interested in quantitative strategies, books like Ernest P. Chan’s “Quantitative Trading” and “Algorithmic Trading” are great resources. Once you’re familiar with market trends, you’ll start noticing keywords that can guide your research into specific strategies. While not every strategy may work perfectly, you can refine and adapt them through study and adjustment of their parameters. Remember, the real hard work in trading happens during research and testing, not when executing trades. When you’re trading, you’re simply following a plan you’ve already prepared.
Here are some websites and blogs for finding and learning about trading strategies:
Quantpedia: Quantpedia is a platform that provides a comprehensive database of quantitative trading strategies. It offers a wide range of strategies categorized by asset class, factor, and performance metrics, making it a valuable resource for traders looking for new ideas.
QuantConnect: QuantConnect is a cloud-based algorithmic trading platform that allows users to develop, backtest, and deploy trading strategies. It offers a community-driven library of trading algorithms and provides tools for strategy development using C#, Python, and other programming languages.
QuantStart: QuantStart is an educational platform that offers tutorials, articles, and code examples for quantitative finance and algorithmic trading. It covers topics such as data analysis, statistical modeling, and algorithm development, making it a useful resource for traders seeking to learn and implement quantitative strategies.
QuantInsti: QuantInsti is an institute that offers courses and certification programs in quantitative finance and algorithmic trading. Its website provides educational content, research papers, and insights into quantitative trading strategies, making it a valuable resource for traders looking to deepen their understanding of quantitative finance.
EP Chan’s Blog: EP Chan’s blog is a valuable resource for traders interested in quantitative trading strategies. Authored by Ernest P. Chan himself, the blog covers a wide range of topics related to algorithmic trading, quantitative finance, and market analysis. EP Chan shares insights into trading strategies, risk management techniques, and statistical analysis methods based on his extensive experience in the field. Readers can find articles, research papers, and practical guidance on developing and implementing quantitative trading strategies. EP Chan’s blog serves as an insightful platform for traders looking to enhance their knowledge and skills in quantitative finance and algorithmic trading.
xlearn: Your ultimate destination for all things related to the financial markets. Whether you’re new to trading or an experienced investor, xlearn offers comprehensive tutorials covering everything from financial markets and trading to investing strategies. Our beginner-friendly approach ensures that everyone can grasp complex concepts with ease.
How to Create a Trading Strategy?
Now, before I delve into the actual process of creating a strategy and making it work in the real market, I want to discuss a few key points about trading and how it works.
Firstly, trading is like a game where if you gain a penny, someone else loses it, and if you lose a dollar, someone else gains it.
It’s tough to always be right and make money—only about 1% of traders manage it or even less. These successful traders aren’t just regular folks; they’re big banks, hedge funds, or specialized trading firms with lots of resources.
Since we don’t have their resources, the best we can do is increase the likelihood of winning whenever we trade. Even if we lose occasionally, we can still end up making money. This is what having a positive expectancy means.
The first thing we wanna do is to come up with an idea that makes sense, in other words, find a method to make money with logic.
So, for that, you need to understand why prices change. We have already talked about order books and how prices change in the financial market. We know it’s because of the orders that people send to the market that drive the prices. It’s the supply and demand between buyers and sellers that make the price move, and this is what some people refer to as price action trading.
So, the best thing you can do is to base your strategy on this. Find inefficiencies in this supply and demand mechanism and take advantage of them to make money. How do you do that? Well, you can start with the order book.
You know, an order book is a tool used by exchanges to match up all the orders for a specific stock. These orders are sent to various ECNs and exchanges and are all included in the book. This is where most of a company’s shares are exchanged. But, just so you know, there are off-market transactions where shares are exchanged directly between individuals. However, these are usually large orders and are mostly carried out by insiders and institutions.
Now, you can notice patterns in how prices change in the order book. If these patterns occur frequently, you can create a strategy based on them. For example, you can engage in market making, where you buy and sell at the bid and ask prices to provide liquidity for stock and profit from it. You can also take advantage of the fee structures of Electronic Communication Networks (ECNs) by quickly buying and selling stocks on different ECNs at the same price to profit from their fee structures.
However, these strategies require very low latency, meaning minimal delay in executing trades. Nowadays, these types of strategies are primarily carried out by High-Frequency Trading (HFT) firms because they have the lowest latency among all market participants. They are the only ones fast enough to execute these strategies and profit from them.
Now, you might wonder why I’m discussing these strategies if they’re mainly for institutions. Well, understanding these types of strategies can greatly improve your trading decisions. Plus, who knows, maybe you could even become an institution yourself. But the main reason I’m talking about this is because you need to know who you’re competing against when you delve into lower and lower time frames. The order book represents the lowest level of trading time frame. By understanding what’s happening in the order book, you can be cautious with your trades.
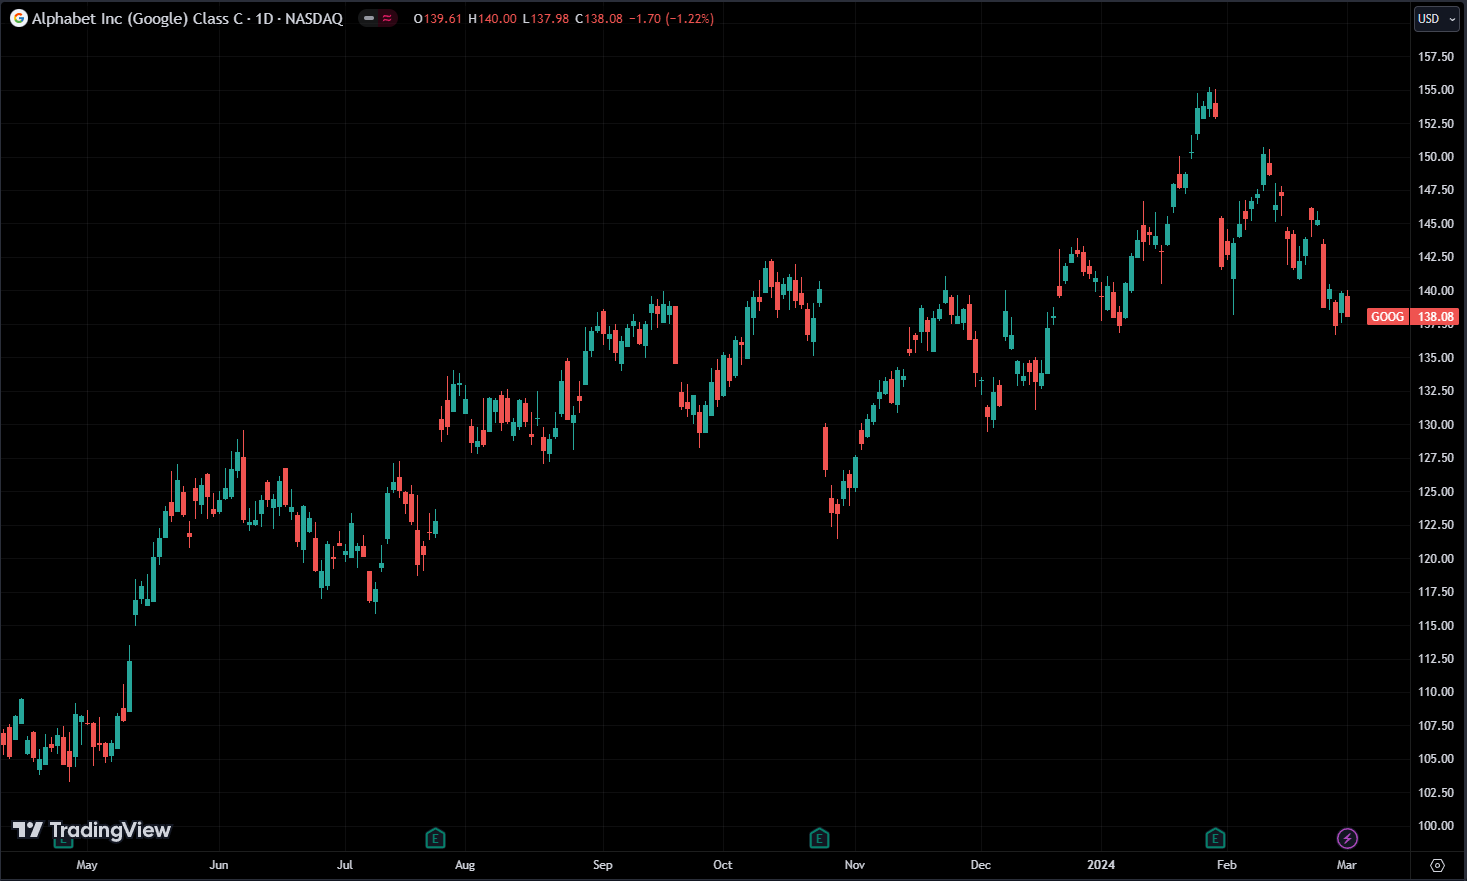
The second method involves using charts and observing pure price action. When you look at a chart without any indicators or drawings, you might notice a pattern in how prices move. They tend to zigzag, meaning they don’t move in a straight line even when they’re trending. Prices go up and down because buyers eventually need to sell, and sellers need to buy. So, this zigzag pattern is always present in trading, and you need to figure out when it’s going to zig and when it’s going to zag. Do you follow me?
Next up are patterns in charts. Sometimes, prices can be in a momentum phase, either going up or crashing down. Other times, they might be in a mean reversion phase, where the price reaches a level and then bounces back, repeating this pattern. Occasionally, you might even notice specific patterns, like prices tending to stick around certain support and resistance levels. When you spot these kinds of patterns, you can develop a strategy based on them.
One thing to remember when trading chart patterns is that not all patterns work reliably. Even patterns with a logical basis, like double tops bottoms, or triangles, are just a matter of probability.
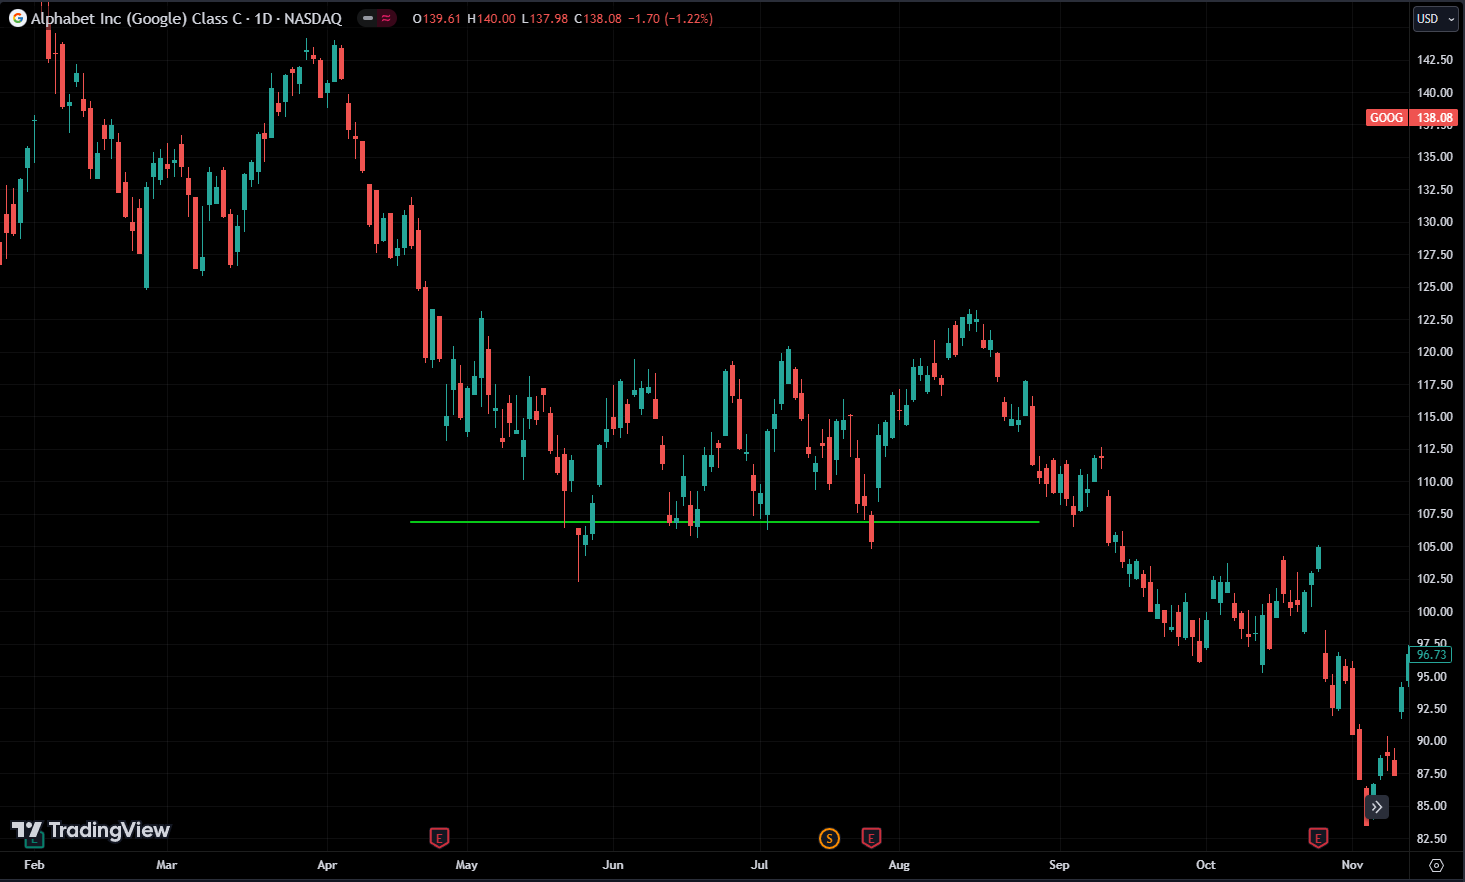
They only work sometimes, and most of the time, they’ll only work if they’re plainly visible to you without you actively searching for them. That’s because if it’s clear to you, it’s likely clear to others too, and they’ll place orders expecting those movements, which eventually affects prices as anticipated. It’s kind of like a self-fulfilling prophecy.
Keep in mind that these patterns only work on occasion, and for them to be effective, all traders need to recognize them. Something that only you know or figure out on your own won’t be effective.
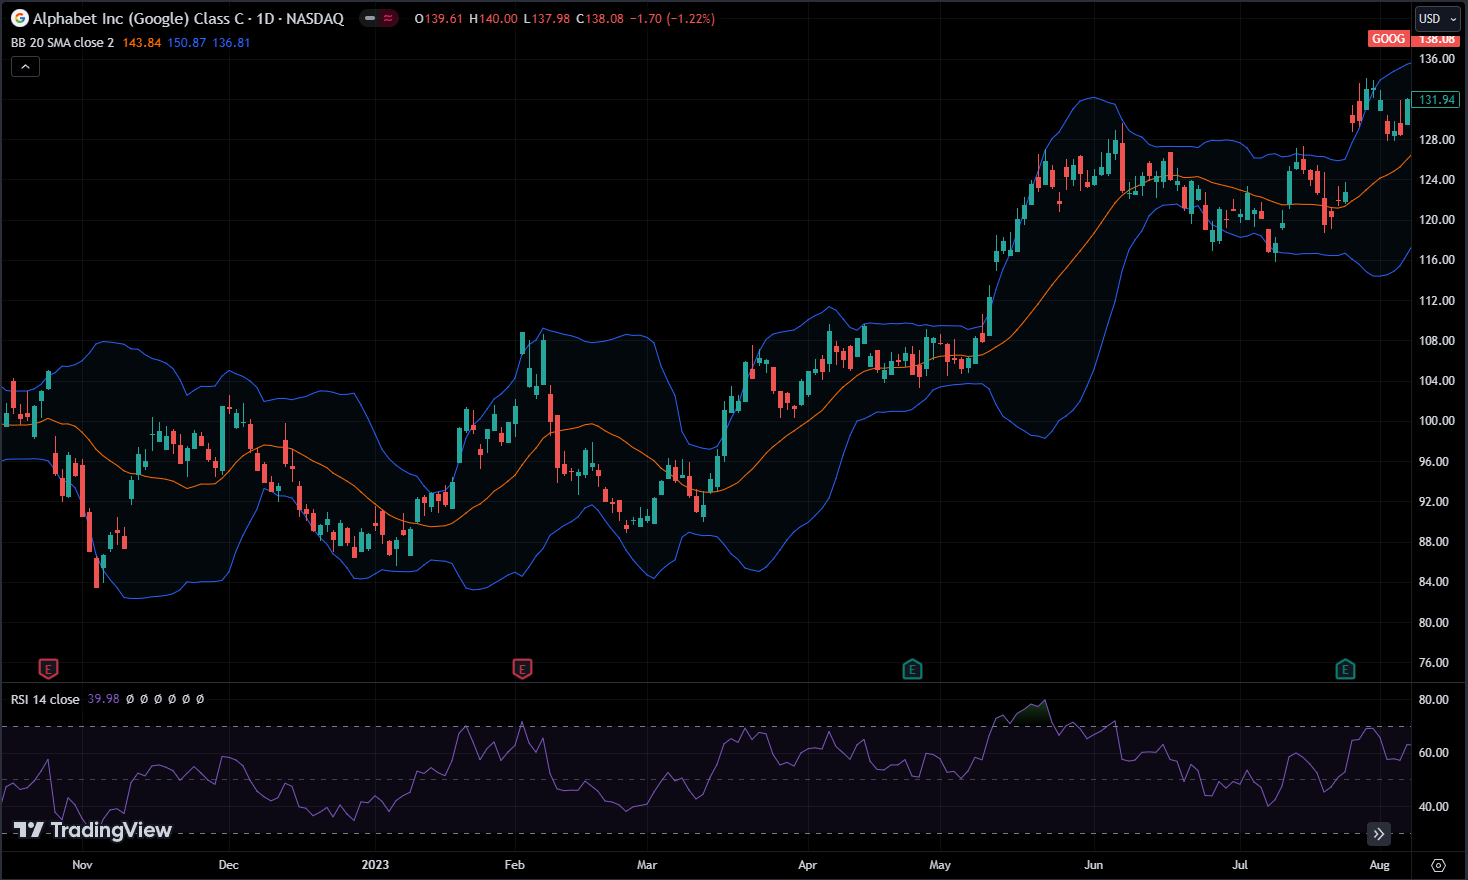
it’s the same with technical indicators, some indicators you come up with are unlikely to work because other people won’t trade based on that indicator, so there is no one to support the price movement. so the price won’t move as you expect it. so if you want to use an indicator, you must pick something that most people know and use. something like RSI, Bollinger Bands, VWAP, and Moving Averages are very popular indicators and used by most traders, so if you can find some recurring patterns with these indicators you can make a strategy out of it.
You can explore various timeframes to search for patterns. The big picture, or higher timeframe, indicates where prices are heading, while shorter timeframes reveal how they’re moving. By combining all of these perspectives, you can develop a wide range of trading strategies.
However, remember that no strategy works indefinitely. You’ll need to tweak its parameters to keep it effective in different market conditions. Sometimes, certain strategies stop working altogether. So, you should always be on the lookout for new strategies.
Apart from that, you can also utilize advanced mathematical algorithms and statistical concepts to profit from trading. This method is known as quantitative analysis. It involves using math and statistics to assess the value of stocks and trade accordingly. A course on quantitative analysis will be available soon on xlearn. pairs trading is an example of this type of approach.
You can also use fundamental data to evaluate companies and make trades based on that. The most common approaches in fundamental analysis include benchmarking, trend analysis, earnings, discounting models, and even event-based approaches such as CEO resignations or insider selling. There are many more approaches available, and you can learn more about fundamental analysis in the fundamental analysis module.
You can use any of these methods to identify patterns when they occur and develop a strategy based on them. The pattern could be anything, but it has to make sense and happen repeatedly.
So that being said, now let’s talk about the steps to come up with a trading strategy.
Developing a Trading Strategy
Developing a trading strategy is a comprehensive process that requires careful consideration and planning. Here are the essential steps involved:
Define Your Objectives:
Begin by establishing your financial goals, risk tolerance, time horizon, and preferred trading style. Understanding these factors will help shape your strategy to align with your specific needs and preferences.
What I mean by this is, do you want to day trade or swing trade, and what level of risk are you willing to accept, and how much is your trading capital? By knowing these factors, you can look for something that aligns with them, because there are a bunch of options out there, and it’s hard for you to look at all of them and find something that works. So, with this, you can focus on ideas that align with your preferences and skip others.
Conduct Research:
Dive into learning about different trading strategies and analyze historical market data. This research will provide valuable insights into the performance of various strategies under different market conditions.
While doing this, you can discover something new or maybe something slightly different from what’s already out there. Who knows, maybe it could work. You have the market data, so play with it. You have to find something that works, and nobody’s going to hand it to you on a silver platter. You have to do your research, conduct experiments, and figure out what’s effective and what’s not.
Try exploring different areas such as technical analysis, fundamental analysis, quantitative analysis, event-based trading ideas, hedging ideas, and more. By the end of your research, you should have at least one idea that you believe could work.
Choose a Strategy:
Once you decide on an idea, the next step is to turn it into a strategy. This means you have to write down what it’s going to do, its risk management plan, position sizing, trading approaches, how you choose the stocks, and whatever else your idea is based on.
If you want to work on a strategy that’s already out there, you still have to write down its requirements and how it works. Because at the end of the day, you’re the one who’s going to trade this strategy, and you need to know all about it. If you don’t, you’re going to lose money. That’s the problem with trading: if you’re wrong, then you have to pay the price.
Develop Rules & Trading Plan:
Establish clear entry and exit criteria, position sizing rules, risk management parameters, and other essential guidelines for implementing your chosen strategy. These rules will serve as a roadmap for your trading activities and help maintain consistency in your approach.
You need to have a trading plan, because when trading, you shouldn’t be making decisions; the decision should come from your trading plan. You simply follow the plan because if you don’t, emotions won’t let you do what is right. For instance, you may hesitate to close a position if it goes against you. A trading plan helps you make the right decision.
Example of a Trading Plan:
| STRATEGY | BOLL BANDS |
| TRADING STYLE | DAY-TRADING |
| STRATEGY TYPE | MEAN-REVERSION |
| HOLDING PERIOD | FEW MINS TO CURRENT SESSION END |
| ASSET SELECTION | EURUSD |
| ENTRY SIGNAL | PRICE REACHING 3RD STD BANDS ON 15MIN CHART |
| ENTRY STYLE | SINGLE MARKET ENTRY |
| TAKE PROFIT SIGNAL | PRICE REACHING MIDDLE BAND ON 15MIN CHART |
| TAKE PROFIT STYLE | SINGLE LIMIT ORDER |
| POSITION SIZING | SINGLE ENTRY 2% RISK |
| STOP LOSS | 2% RISK, PRICE BREAKING NEAR SUPPORT/RESISTANCE |
| BAIL OUT INDICATORS | STONG FUNDAMENTAL NEWS |
Backtest:
Once you’ve developed the strategy and the trading plan, the next step is to test it with historical market data to see how it has performed in the past. Use historical market data to thoroughly backtest your strategy. This involves simulating trades based on your strategy’s rules and examining the outcomes. Backtesting helps assess the effectiveness of your strategy and pinpoint any potential weaknesses or areas for improvement.
Optimize:
You can use historical market data to optimize your trading strategy’s parameters. For example, if you set the stop loss at -3% and find that trades often hit the stop loss at around -2.5%, you can adjust your stop loss to -2.5%. By doing this, you can increase your position size and potentially make more money than you could with a -3% stop loss. This is just one example; optimization can involve adjusting various parameters such as position size, stop losses, take profit levels, holding time, entry and exit methods, and more.
Paper Trading:
Practice executing trades based on your strategy in a simulated trading environment without risking real money. Paper trading allows you to gain valuable experience, refine your approach, and build confidence in your strategy before trading with actual capital.
If you are a new trader, emotions are going to play a big role in your success. By practicing to follow your trading plan with simulated money, you can be better prepared when you start trading with real capital. However, trading with real capital will still involve emotions. You have to acknowledge this and be ready for it. That’s why you have to train yourself to follow your trading plan all the time.
If you are using an automated trading system, then paper trading allows you to see if your algorithm is working correctly or not before you implement it in the real market.
Live Trading & Monitor:
If you see that paper trading is working well, then start with small capital and increase it over time. Continuously monitor the performance of your strategy in live markets and be prepared to make adjustments as needed. Market conditions are dynamic, so it’s essential to adapt your strategy accordingly to remain effective over time.
Conclusion
Remember that developing a profitable trading strategy is a continuous learning process that requires dedication, patience, and adaptability. By following these steps and remaining disciplined in your approach, you can increase your chances of achieving success in the markets.