Fundamental analysis encompasses three primary methods for analyzing stocks: trend analysis, benchmarking, and the dividend discount model. These three approaches are widely utilized by financial analysts as they are considered among the most popular and effective models available.
In this post we will learn about trend analysis.
What is Trend Analysis?
Trend analysis of financial statements in stock trading is a methodology used to assess the performance of a stock by examining its fundamental data.
As previously mentioned in relation to technical analysis, a trend signifies the direction of movement. Surprisingly, these very trends can also be utilized for analyzing financial data. This can be achieved by examining the trends present in financial ratios. and we derive those ratios from financial statements.
Example:
Let’s think about a made-up company, ABC, and its earnings per share (EPS).
Look at this: In 2010, each share earned $1. Then, in 2011, it went up to $1.10, and in 2012, it climbed to $1.20. This pattern kept going, with the number rising each year, hitting $1.30 and then $1.40. If we draw this out, we see a clear trend: EPS is going up over time. That tells us that ABC is doing better and better, making more money for each share as the years go by.
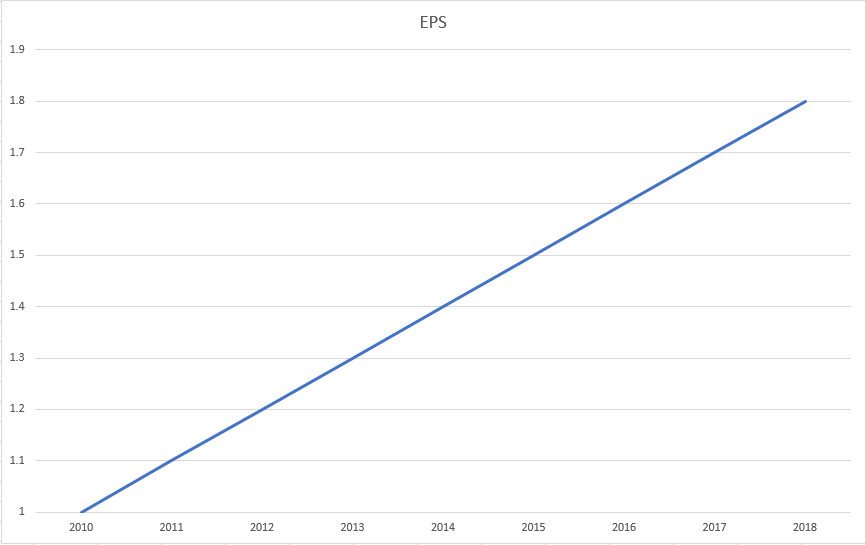
Like technical analysis, trend analysis shows that trends often keep going in the same direction. But when a trend breaks, like if in 2019, a company’s EPS drops to $1.60, it suggests a change in direction. This means that after getting better every year, the company did worse in that year. It not only stopped getting better but actually did worse than before.
In fundamental analysis, trend analysis means looking at numbers like revenue, EPS, P/E ratio, units sold, and turnover. These numbers give important clues about how a company is doing overall and where its finances are heading.
How to Use Trend Analysis?
Financial analysts employed by portfolio managers and firms focus on identifying trends that are moving in a favorable direction as a potential buy signal. If there is no discernible trend in the fundamental data, they may hesitate to make a purchase. Similarly, when deciding to sell an asset, analysts take note of instances where a positive trend in financial data suddenly breaks. Conversely, if there is a downward trend, they may refrain from making a purchase. However, if the trend reverses and shows improvement in the financials, analysts may consider initiating purchases.
As traders, our primary focus may not be conducting trend analysis for buying and selling stocks. However, it is essential for us to understand that financial analysts and portfolio managers rely on trend analysis and other factors to make informed decisions.
Therefore, as traders, we observe and analyze situations where a stock had a favorable trend that has now halted. This can lead to institutional investors liquidating their positions, as they prefer not to invest in assets without a clear trend, which they perceive as high risk. Consequently, this selling pressure can cause the stock price to decline. Conversely, the same principle applies if a stock with a negative trend suddenly shows improvement, potentially triggering buying interest.
We focus on assets that have exhibited positive trends, but if news, earnings reports, or statements reveal disappointing numbers compared to previous performance, it can present an opportunity for event-based trading. In such instances, we can enter a position based on the expectation that other market participants will soon sell their holdings, allowing us to profit from that anticipated price movement. While we may not employ trend analysis for long-term investments, understanding its significance is crucial because we are aware that other market participants rely on it. When a trend breaks, it triggers a shift in their behavior towards that particular stock, which subsequently affects supply and demand dynamics, ultimately influencing the stock’s price.
We are gonna use trend analysis to figure out what other people might do with their orders.
Where to Look for these Trends?
You have the option to visit Yahoo Finance and access the financials section for the desired stock.
Let’s consider an example of TSLA (Tesla). By navigating to the appropriate sections, you can access TSLA’s income statement, cash flow statement, and balance sheet. Furthermore, you can review both the annual and quarterly statements to gain a comprehensive understanding of the company’s financial position.
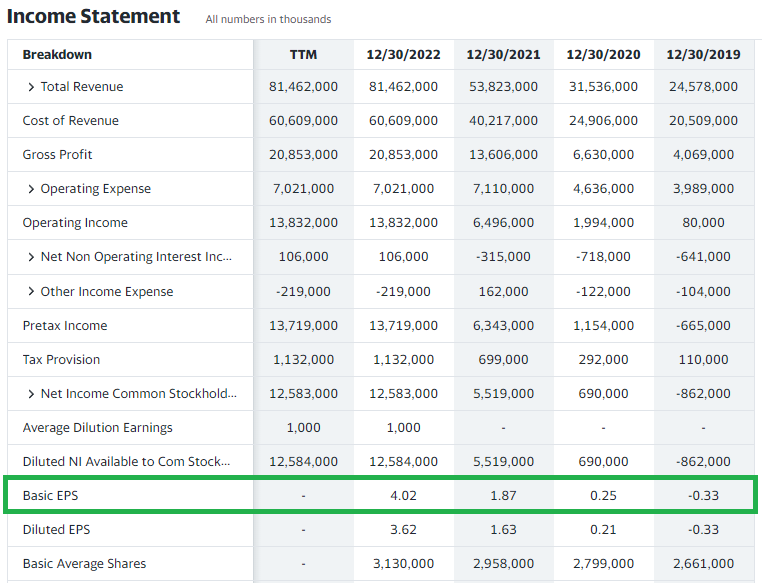
Let’s examine the earnings per share (EPS) figures. In 2019, the EPS stood at -0.33, indicating a loss. However, in 2020, it improved to 0.25, followed by a significant increase to 1.87 in 2021, and further growth to 4.02 in 2022. This pattern reveals a clear trend of consistent improvement in EPS each year, signifying a positive performance trend for the company.
When a stock is primarily owned by institutions who rely on fundamental data for decision-making, a substantial change in one of those ratios that breaks the upward trend can lead to fewer institutions buying and more institutions selling to manage portfolio risk. Consequently, as soon as the data is released and a trend break is detected, it serves as an indication to consider a short position for that stock. Conversely, when the trend breaks in the opposite direction, with more people wanting to buy than sell, it suggests a potential long indication for the stock.
Conclusion
In conclusion, trend analysis is a crucial tool in fundamental analysis, alongside benchmarking and the dividend discount model. Financial analysts rely on trend analysis to make informed decisions about buying and selling stocks. Understanding trends in financial data helps analysts identify potential buying signals and assess the overall performance of a company.
As traders, we may not always conduct trend analysis ourselves, but recognizing its importance is key to understanding market dynamics. By observing trends and analyzing financial statements, we can anticipate market movements and make informed trading decisions.
Websites like Yahoo Finance provide easy access to financial data, allowing us to track trends and make informed investment choices based on changes in fundamental metrics. Whether it’s recognizing a trend break as a signal to short a stock or identifying an upward trend as a buying opportunity, trend analysis plays a vital role in navigating the stock market.