What are market indexes? they are statistical measures that track the performance of a specific group of stocks or assets in the financial market. they are also known as indices.
They are used to gauge the overall performance of a particular segment of the market or the market as a whole.
Market indexes serve as a benchmark against which investors and financial professionals can compare the performance of their investments.
The construction of a market index involves selecting a representative sample of stocks or assets that collectively represent the performance of a particular market, industry, sector, or asset class. These selected stocks or assets are often weighted based on factors like market capitalization (market value of outstanding shares) or price, among other methodologies.
The weighting is essential to ensure that the index reflects the relative importance of each component in the overall market.
You may be familiar with names such as S&P or Dow; these are examples of what we’re discussing – they are referred to as indexes.
While numerous indexes exist, only a few hold significant importance. In this discussion, we will focus on the most crucial ones.
What is the Dow Jones Industrial Average?
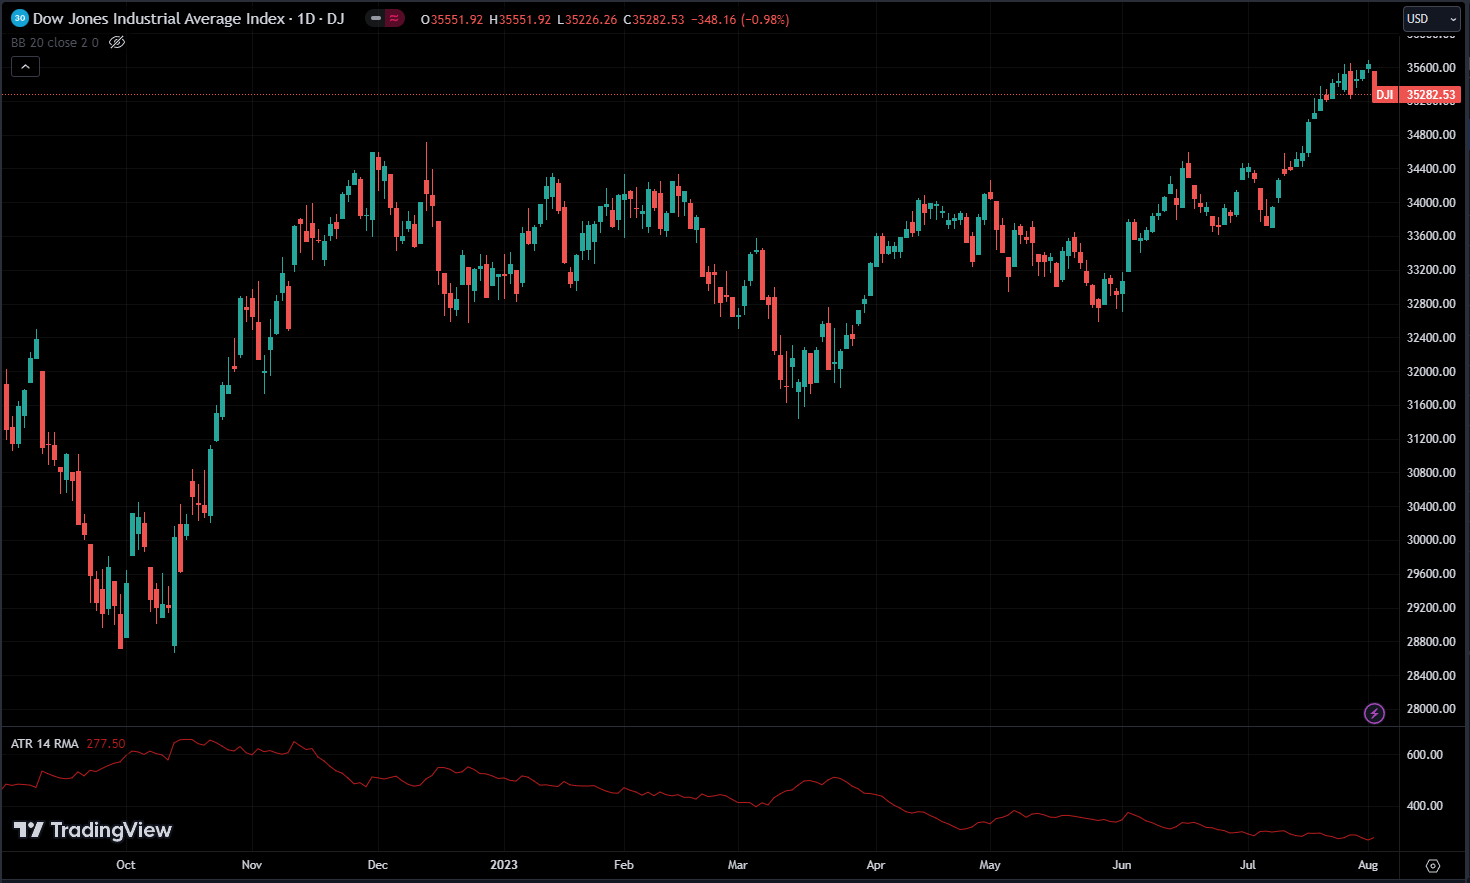
The Dow Jones Industrial Average (DJIA), often simply referred to as the Dow, is one of the oldest and most widely recognized market indexes in the world. It was created by Charles Dow, the co-founder of Dow Jones & Company, and first published on May 26, 1896. The DJIA is maintained and calculated to this day, providing valuable insights into the performance of the U.S. stock market.
The Dow is composed of 30 large, publicly traded companies that are considered industry leaders and are representative of various sectors of the U.S. economy. These companies are selected by the editors of The Wall Street Journal, which is also owned by Dow Jones & Company.
Unlike other market indexes that are weighted based on market capitalization, the Dow is a price-weighted index. This means that the component stocks’ weightings are determined by their individual share prices rather than their market values.
To calculate the Dow’s value, the sum of the share prices of the 30 companies is divided by a divisor, which adjusts for stock splits, changes in the index components, and other factors to ensure continuity and consistency over time.
The Dow includes companies from a diverse range of sectors, such as technology, finance, healthcare, retail, and industrials. Some of the companies that have historically been part of the DJIA include Apple, Microsoft, Goldman Sachs, Johnson & Johnson, Coca-Cola, and Boeing, among others.
The index is often used as a barometer of the broader U.S. stock market’s health and provides insights into the overall direction of the economy. When the Dow experiences significant movements, it tends to garner significant attention from investors, financial analysts, and the media.
What is S&P 500?

The S&P 500 index, often referred to simply as the S&P 500, is one of the most widely followed and influential market indexes in the world. It is a stock market index that tracks the performance of 500 large, publicly traded companies listed on major U.S. stock exchanges. The index is designed to represent a broad cross-section of the U.S. economy and includes companies from various sectors.
The S&P 500 index is maintained by Standard & Poor’s (S&P), a division of S&P Global, and was first introduced on March 4, 1957. The companies included in the index are carefully selected by a committee at S&P based on specific criteria, such as market capitalization, liquidity, and other factors. The goal is to create an index that provides a comprehensive and representative view of the U.S. stock market.
Unlike the Dow Jones Industrial Average (DJIA), which is a price-weighted index, the S&P 500 is a market capitalization-weighted index. This means that the components’ weightings in the index are based on their total market values, which is the share price multiplied by the number of outstanding shares. Larger companies with higher market capitalizations have a more significant impact on the index’s overall performance compared to smaller companies.
Because the S&P 500 includes 500 of the most prominent companies in the U.S., it is often considered a better representation of the overall market compared to narrower indexes. These companies come from various sectors, including technology, finance, healthcare, consumer goods, and many others, giving investors a broad view of the U.S. economy’s health and performance.
The S&P 500 index is widely used by investors, financial professionals, and the media as a benchmark for the performance of the U.S. stock market. Many mutual funds, exchange-traded funds (ETFs), and other investment products are designed to replicate or track the performance of the S&P 500, making it a popular choice for passive investing and diversifying investment portfolios.
Due to its broad coverage and extensive history, movements in the S&P 500 are closely monitored as indicators of the overall market sentiment and economic conditions. Significant changes in the index can have ripple effects on global financial markets and investor confidence. As such, the S&P 500 remains a crucial tool for evaluating market trends and making informed investment decisions.
What is Nasdaq Composite?
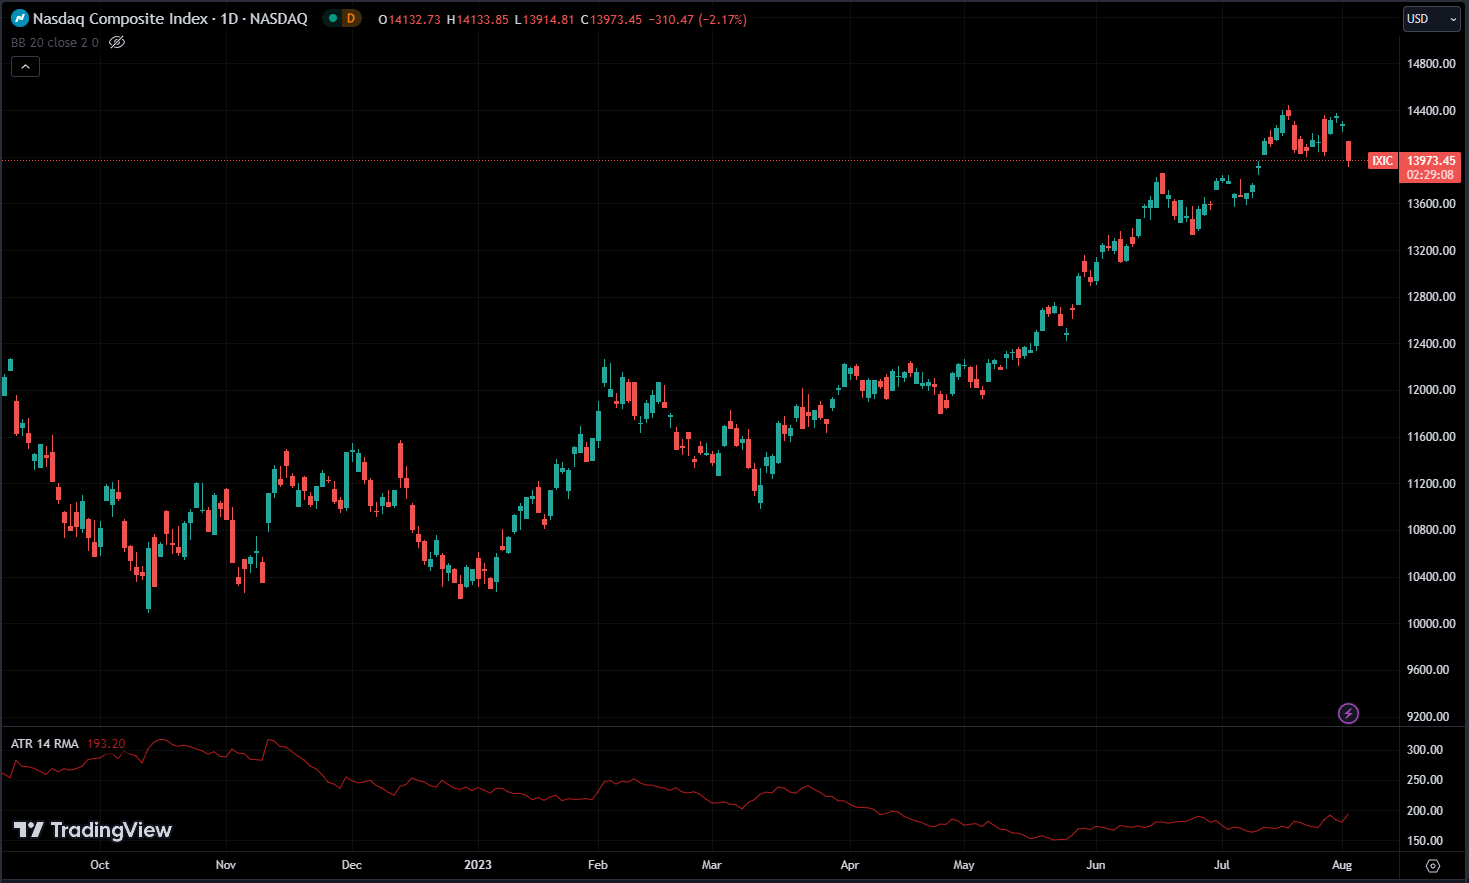
The Nasdaq Composite index, often simply referred to as the Nasdaq, is a stock market index that tracks the performance of all the companies listed on the Nasdaq stock exchange. Unlike other market indexes that focus on a specific number of large companies, the Nasdaq Composite includes a wide range of companies, making it a broader representation of the U.S. technology and growth-oriented sectors.
The Nasdaq Composite index was introduced on February 5, 1971, and is maintained by Nasdaq, Inc., the company that operates the Nasdaq stock exchange. It is a market capitalization-weighted index, similar to the S&P 500, which means that the components’ weightings are based on their total market values.
The index includes companies from various industries, but it is best known for its heavy representation of technology companies. As such, it is often viewed as a barometer of the performance of the technology sector. Many prominent technology giants, such as Apple, Microsoft, Amazon, Google (Alphabet), and Facebook, are included in the Nasdaq Composite.
In addition to technology companies, the index also encompasses companies from other sectors, including consumer discretionary, healthcare, communication services, and more. It includes both U.S.-based companies and international companies listed on the Nasdaq exchange, which contributes to its global appeal.
The Nasdaq Composite is widely followed by investors, traders, and financial professionals as it provides insights into the performance of high-growth companies and the innovation-driven segments of the market. Many investors consider the Nasdaq as an indicator of the market’s sentiment towards technology and other growth-oriented sectors.
Due to the tech-heavy composition, the Nasdaq Composite tends to be more volatile than broader market indexes like the S&P 500 or the Dow Jones Industrial Average. In periods of strong performance for technology stocks, the Nasdaq may outperform other indexes, while during market downturns, it can be more susceptible to larger declines.
The index’s influence has grown over the years, and it has become a critical benchmark for investors seeking exposure to the technology sector and for those tracking the overall performance of the U.S. stock market. Like other major market indexes, various financial products, such as ETFs and index funds, are designed to replicate the performance of the Nasdaq Composite, making it an accessible and popular choice for investment diversification.
Conclusion
A trader should always look at the S&P 500 index because it serves as a key indicator of the U.S. stock market’s overall health and sentiment. As one of the most widely followed market benchmarks, it provides valuable insights into market trends, investor behavior, and potential opportunities. The index’s composition of 500 major companies from diverse sectors offers a broad representation of the economy.
Traders can use its movements to gauge market sentiment, assess risk levels, and identify sector trends, allowing them to make more informed trading decisions and align their strategies with the broader market conditions.
