![Forex Price Action Forecast [2024.07.17]: Daily Analysis of Major FX Pairs and Economic Events - USDCAD and USDJPY Entering Downtrend
xlearnonline.com](https://xlearnonline.com/wp-content/uploads/2024/07/Forex-Analysis-2-1.jpg)
Hello, welcome to xlearn’s daily forex market analysis for day traders. This analysis focuses on price action trading.
Before we jump into the actual analysis, let’s take a look at the major economic events that could affect the market.
Key Economic Events Today
These events encompass important global news, macroeconomic reports, and economic indicators. For more details, you can check the forex factory.
- 21:30 ET: Australia will release its unemployment rate report. This report shows the percentage of people in the workforce who are unemployed and actively looking for work during the past month. It indicates the current health of the economy and may impact AUD currency pairs.
EURUSD:
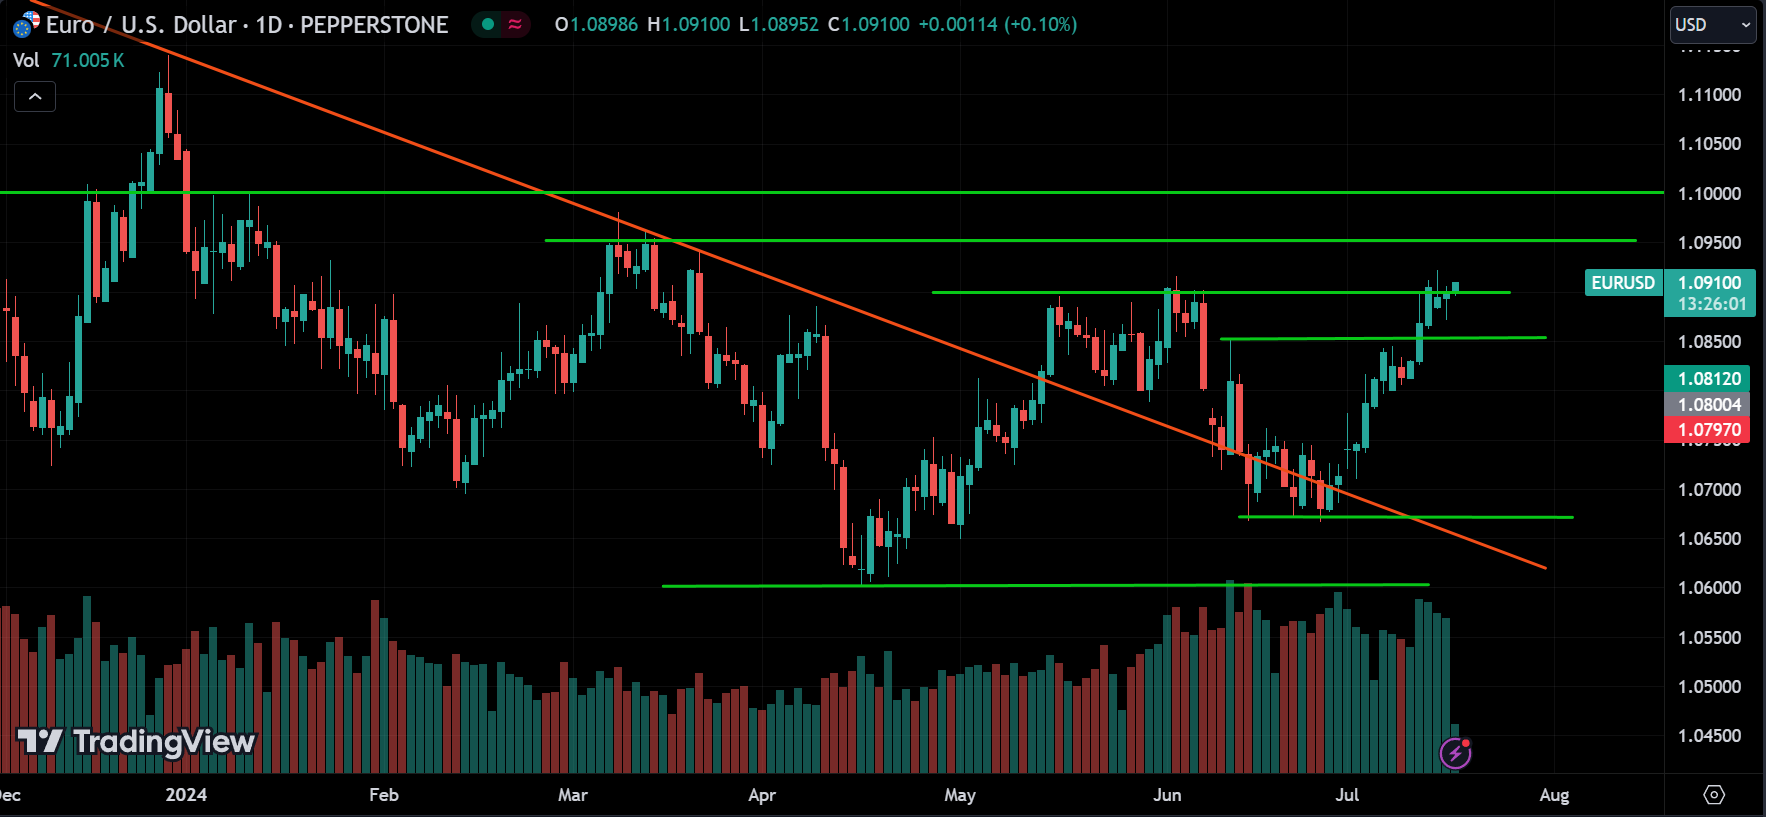
EURUSD is on an upward trend, with the next resistance level around 1.09500.
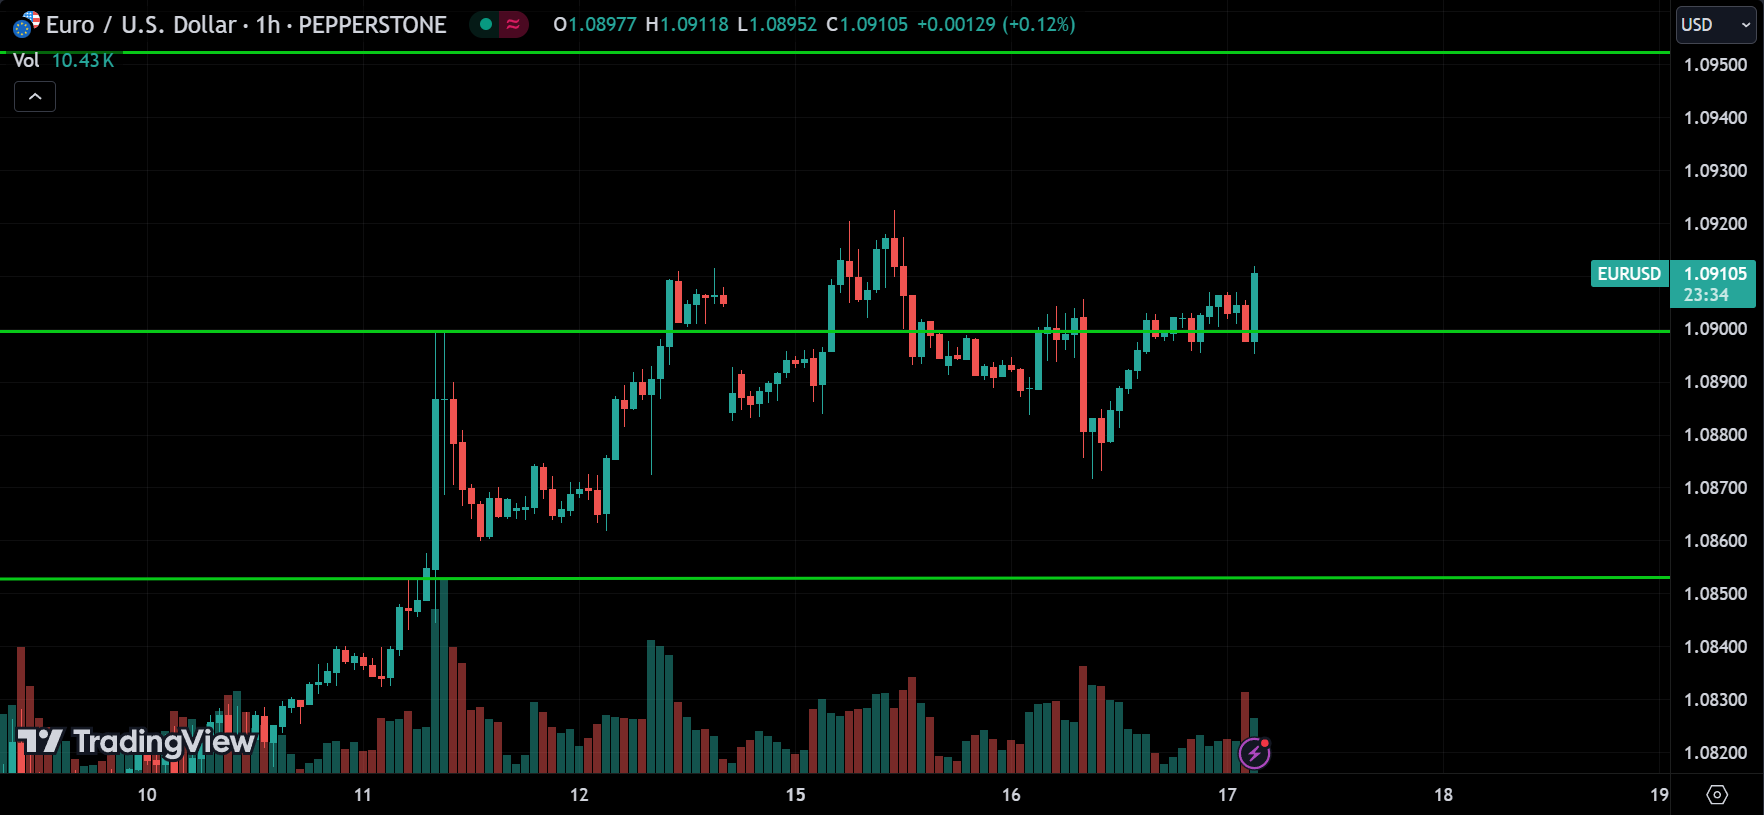
Looking at the 1-hour chart, you can see that after breaking the resistance, the price opened with a gap down, started going back up, then corrected, and is now rising again. Since the overall trend is upwards, we can expect the price to continue in this direction. However, if the price falls below this support again, it means the upward trend might not be strong enough, and a reversal could happen, so watch out for that.
USDCAD:
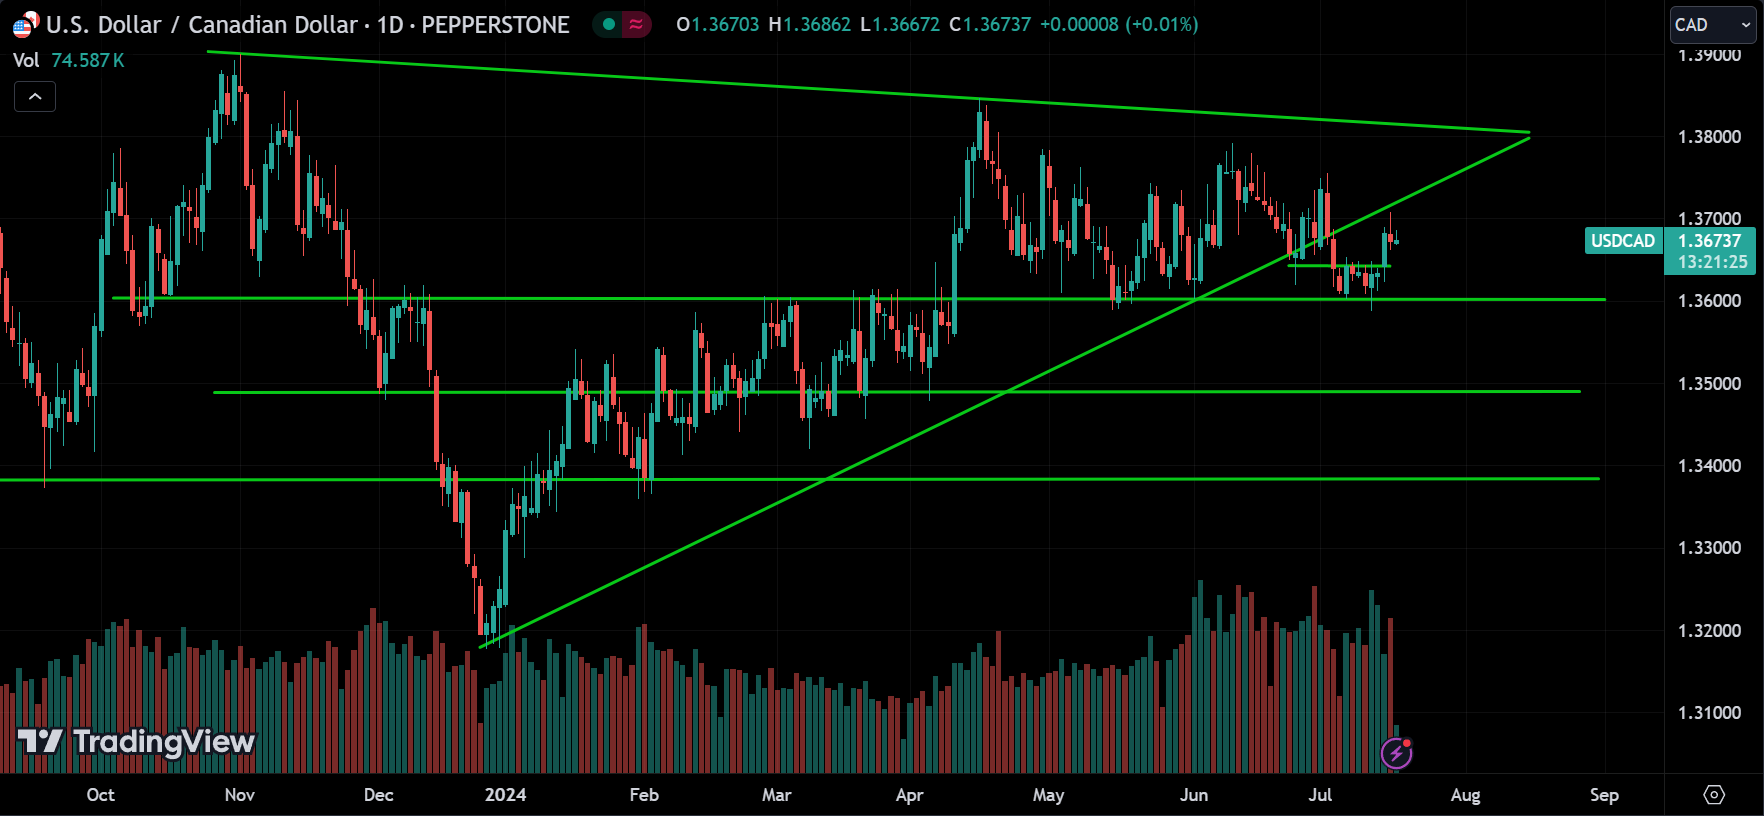
Looking at USDCAD, it broke the major support level and dropped to around 1.36000 before pulling back.
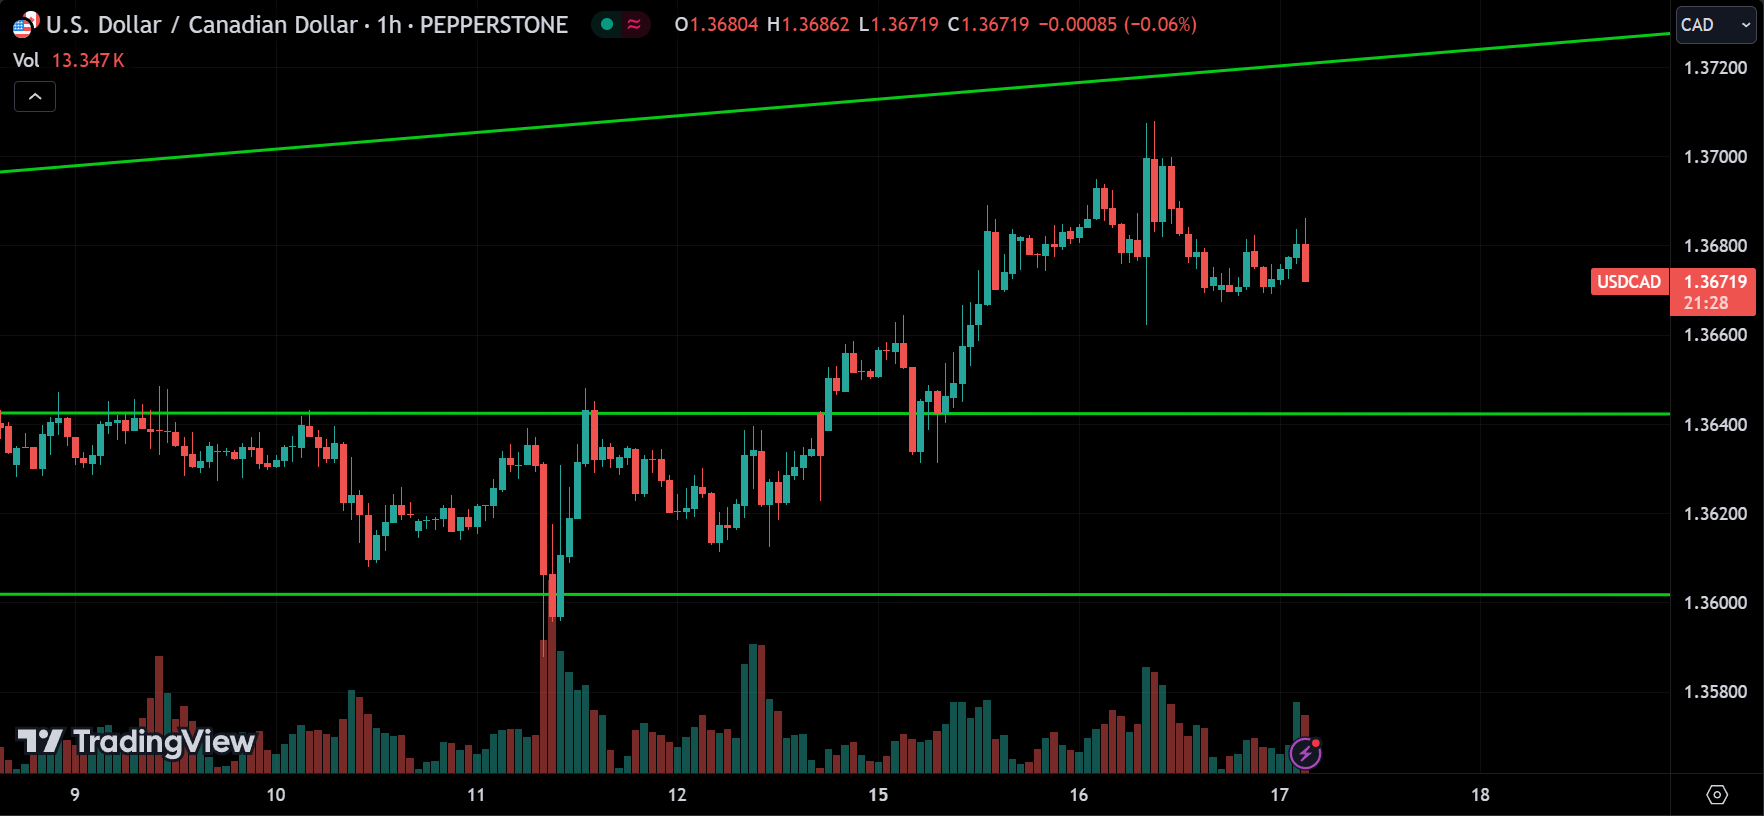
Now, in the one-hour chart, you can see that the price retested the previous broken support and started to fall. We can expect the price to drop from this level because, after the breakout, the support turned into resistance. If the price breaks below the 1.36400 level, we can expect it to go down to 1.36000.
USDJPY:
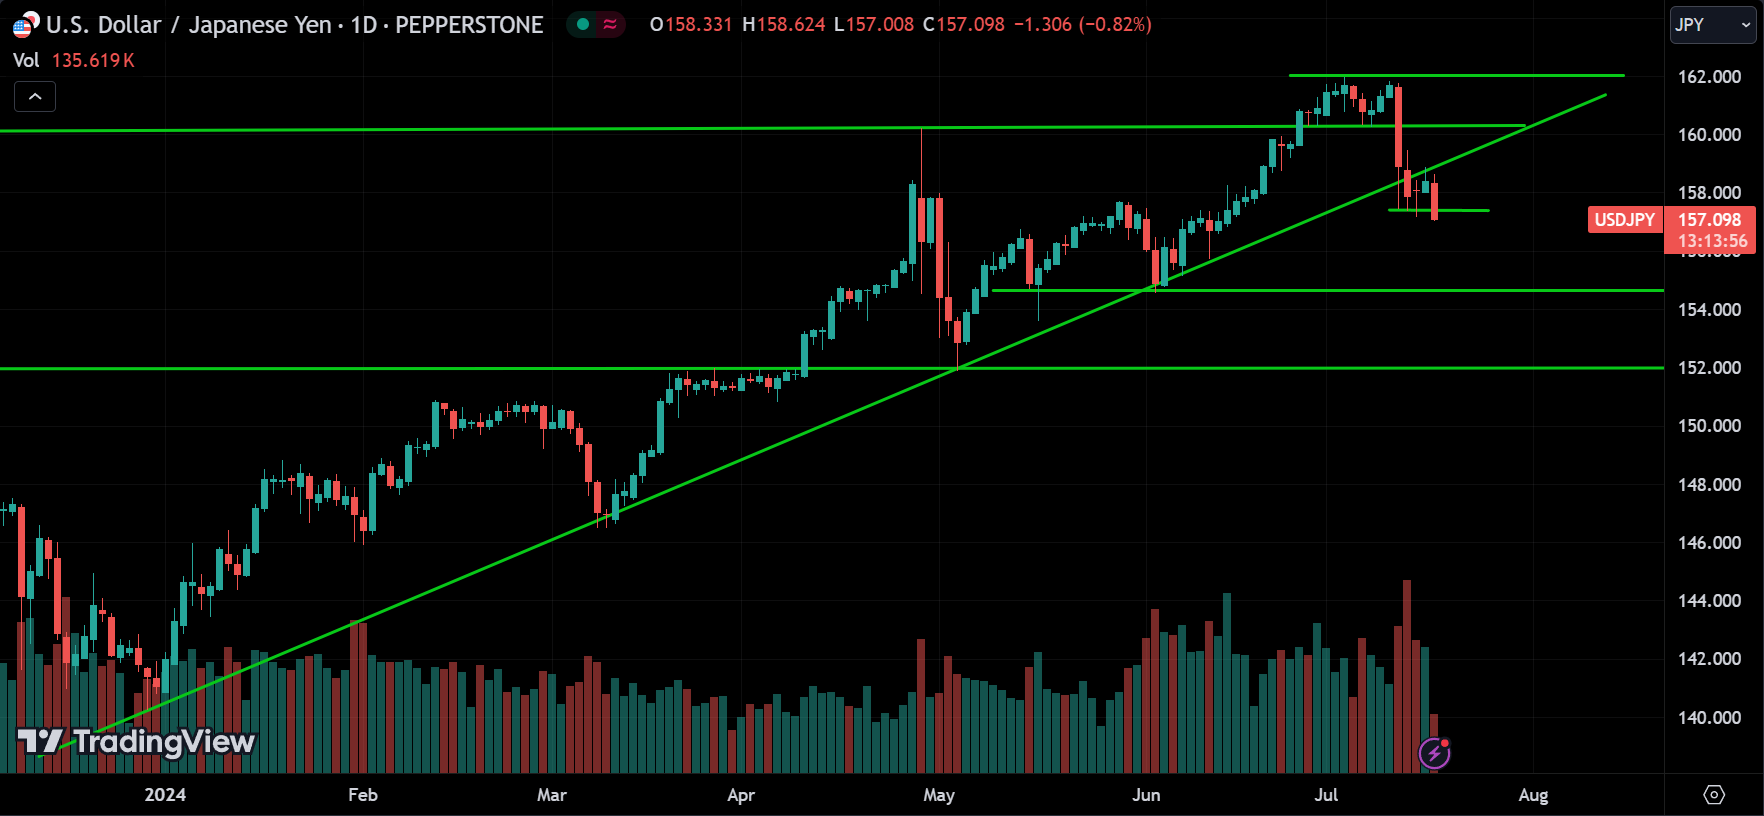
Looking at USDJPY, it broke the major support level, so it should be trending down.
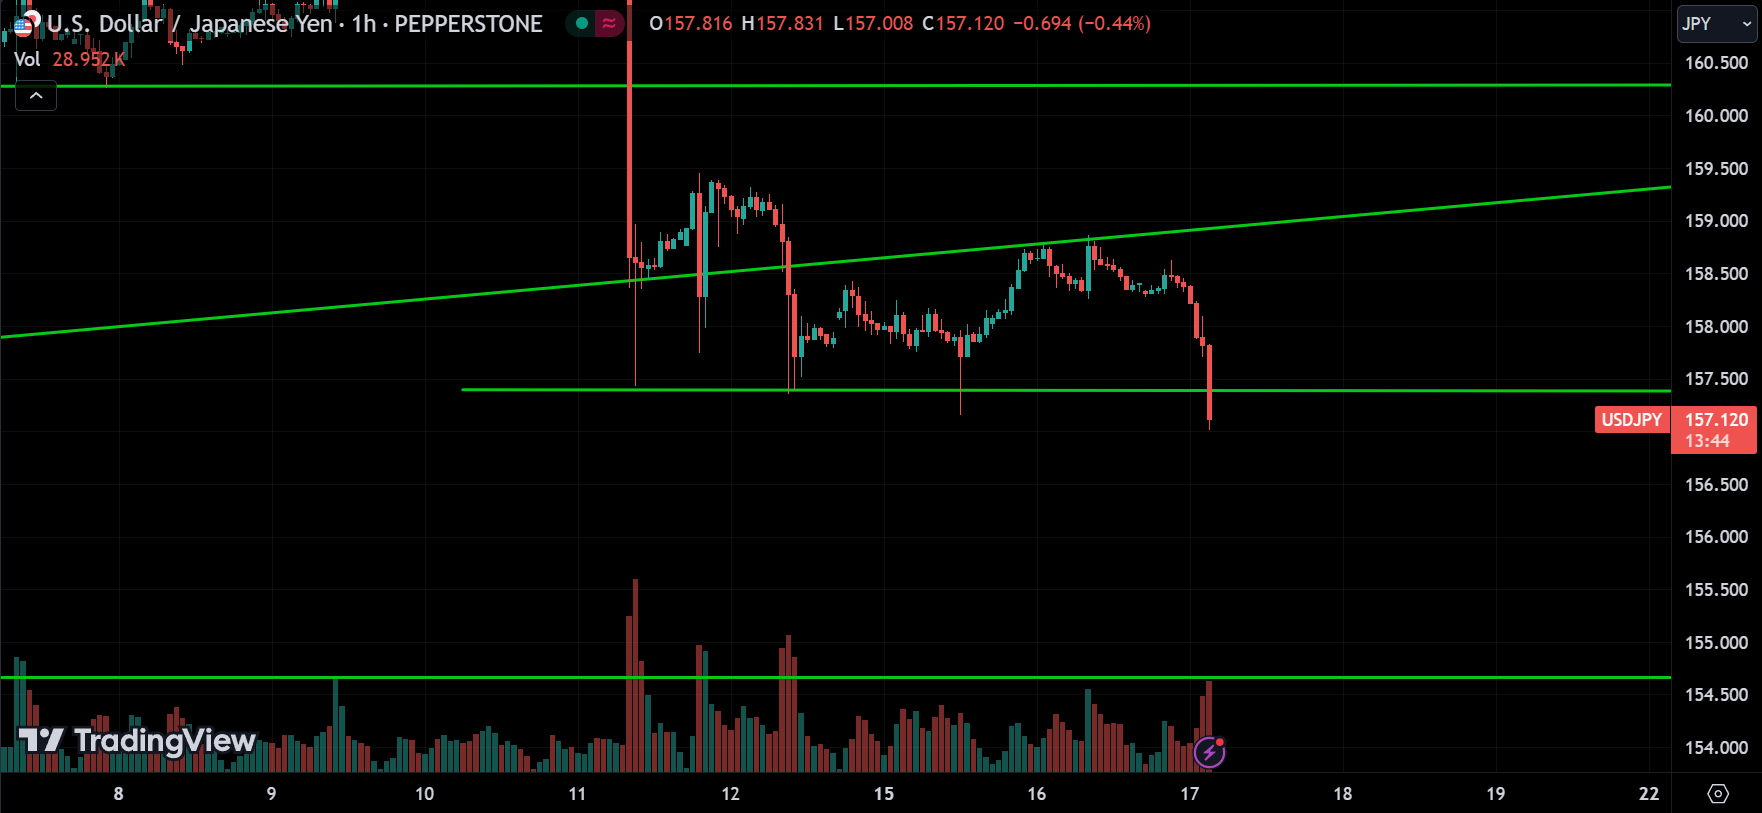
Looking at the 1-hour chart, you can see that the price broke through support around 157.500. We anticipate the price to continue dropping toward the 154.500 range. There might be a small correction along the way, but it should remain between 157.500 and 154.500.
USDCHF:
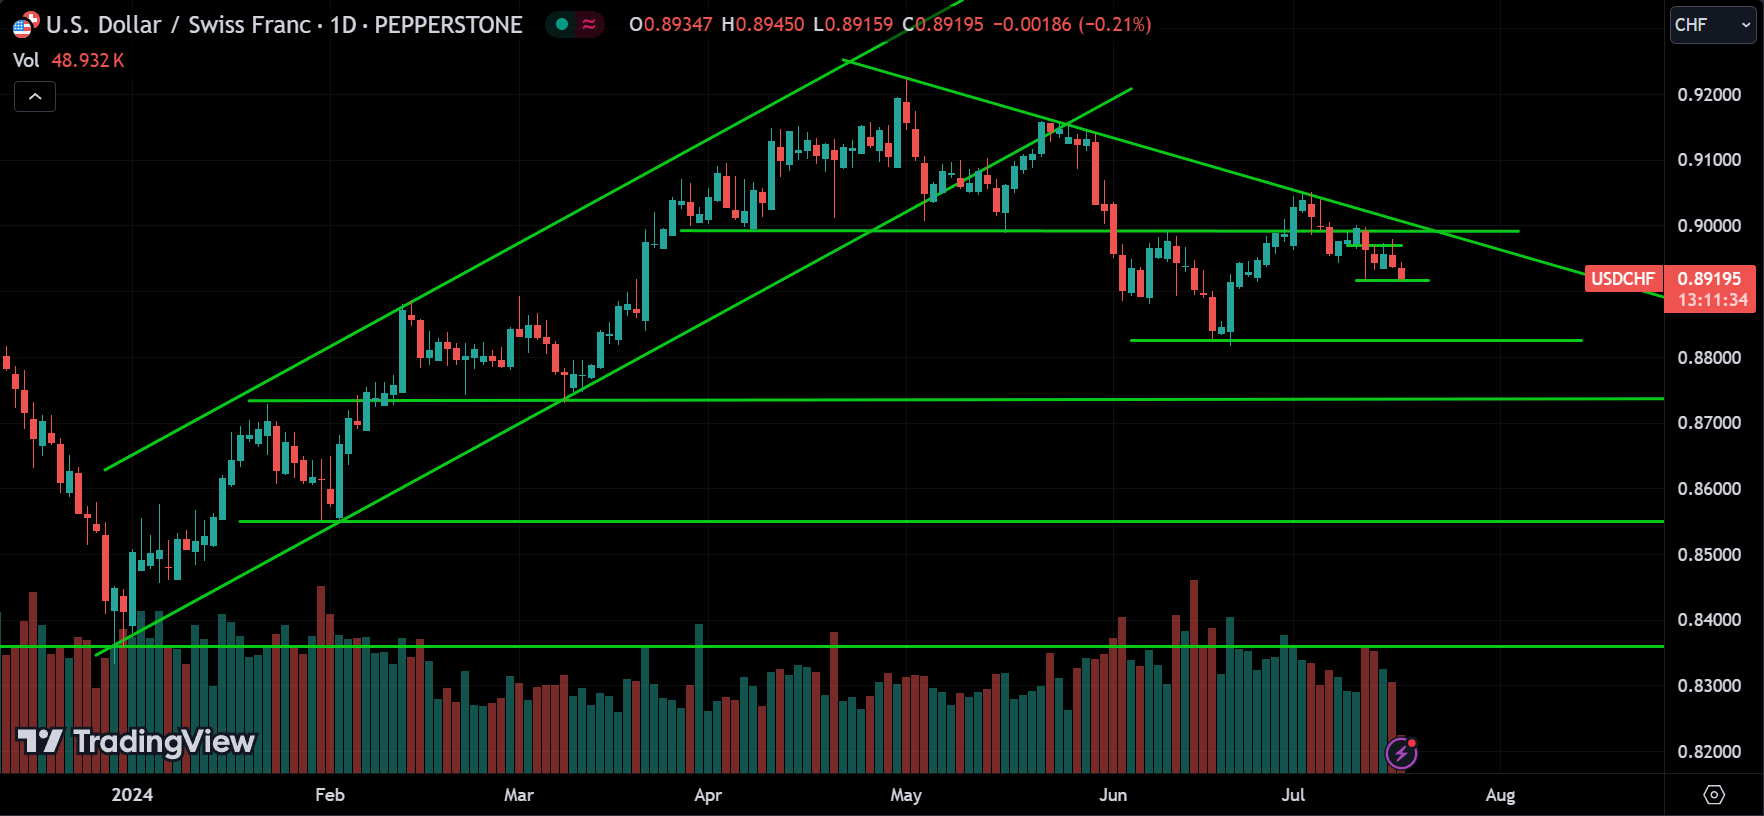
Looking at USDCHF, it’s on a downtrend and currently pulling back from resistance around 0.90000.
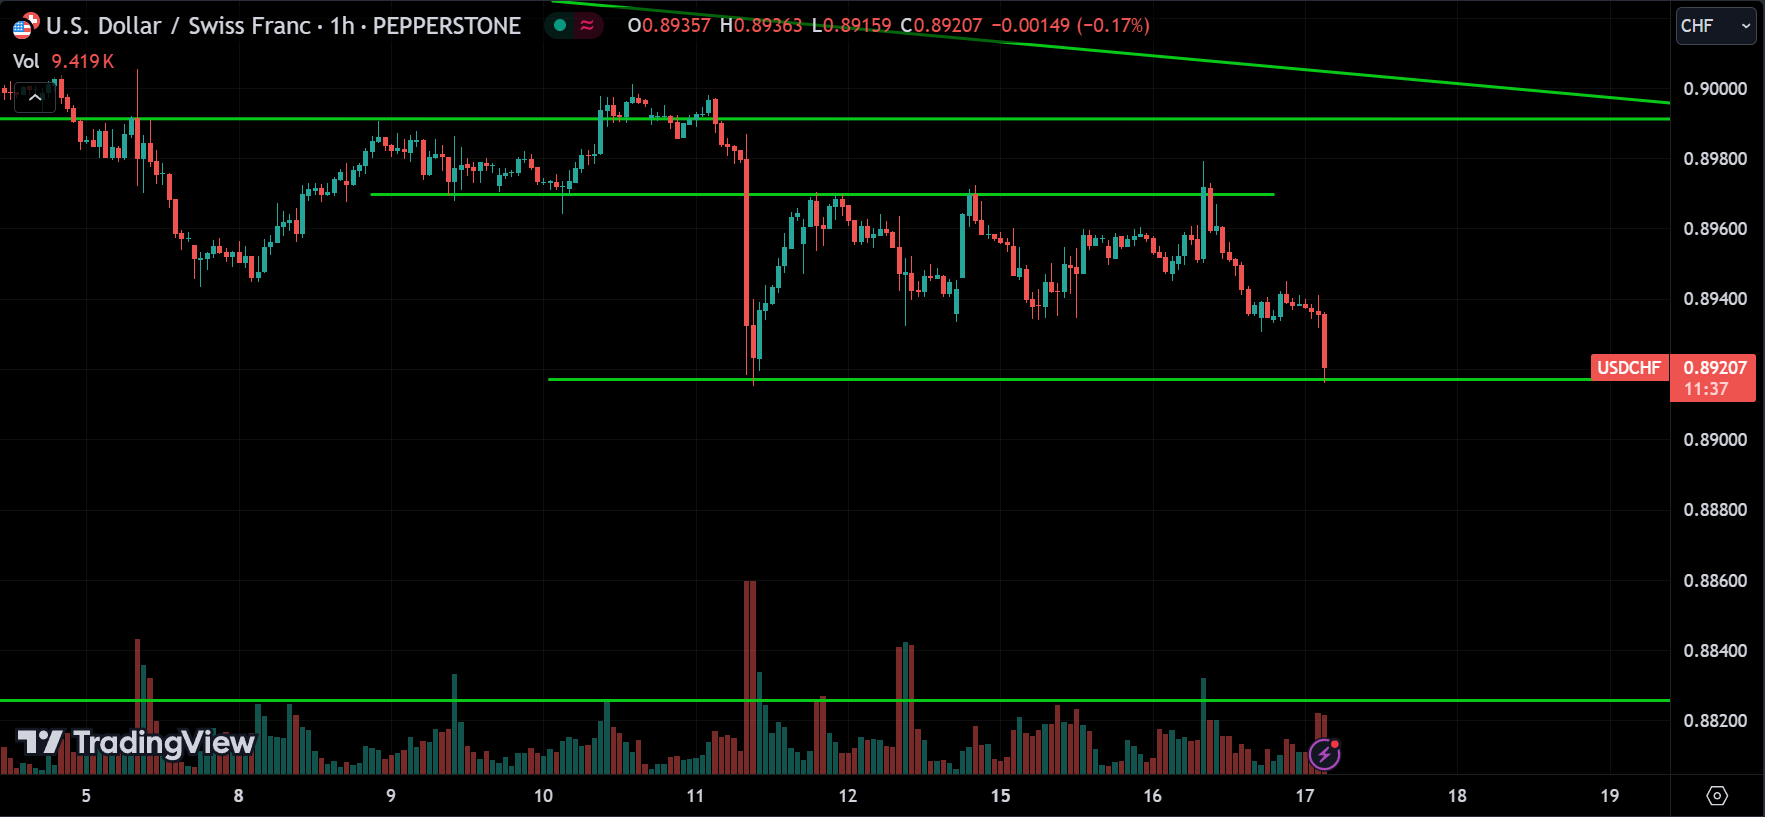
Looking at the 1-hour chart, you can see that the price is at a support level of 0.89200. If the price breaks below this level, we can expect it to drop to the next major support around 0.88200. So, wait for the breakout to confirm.
GBPUSD:
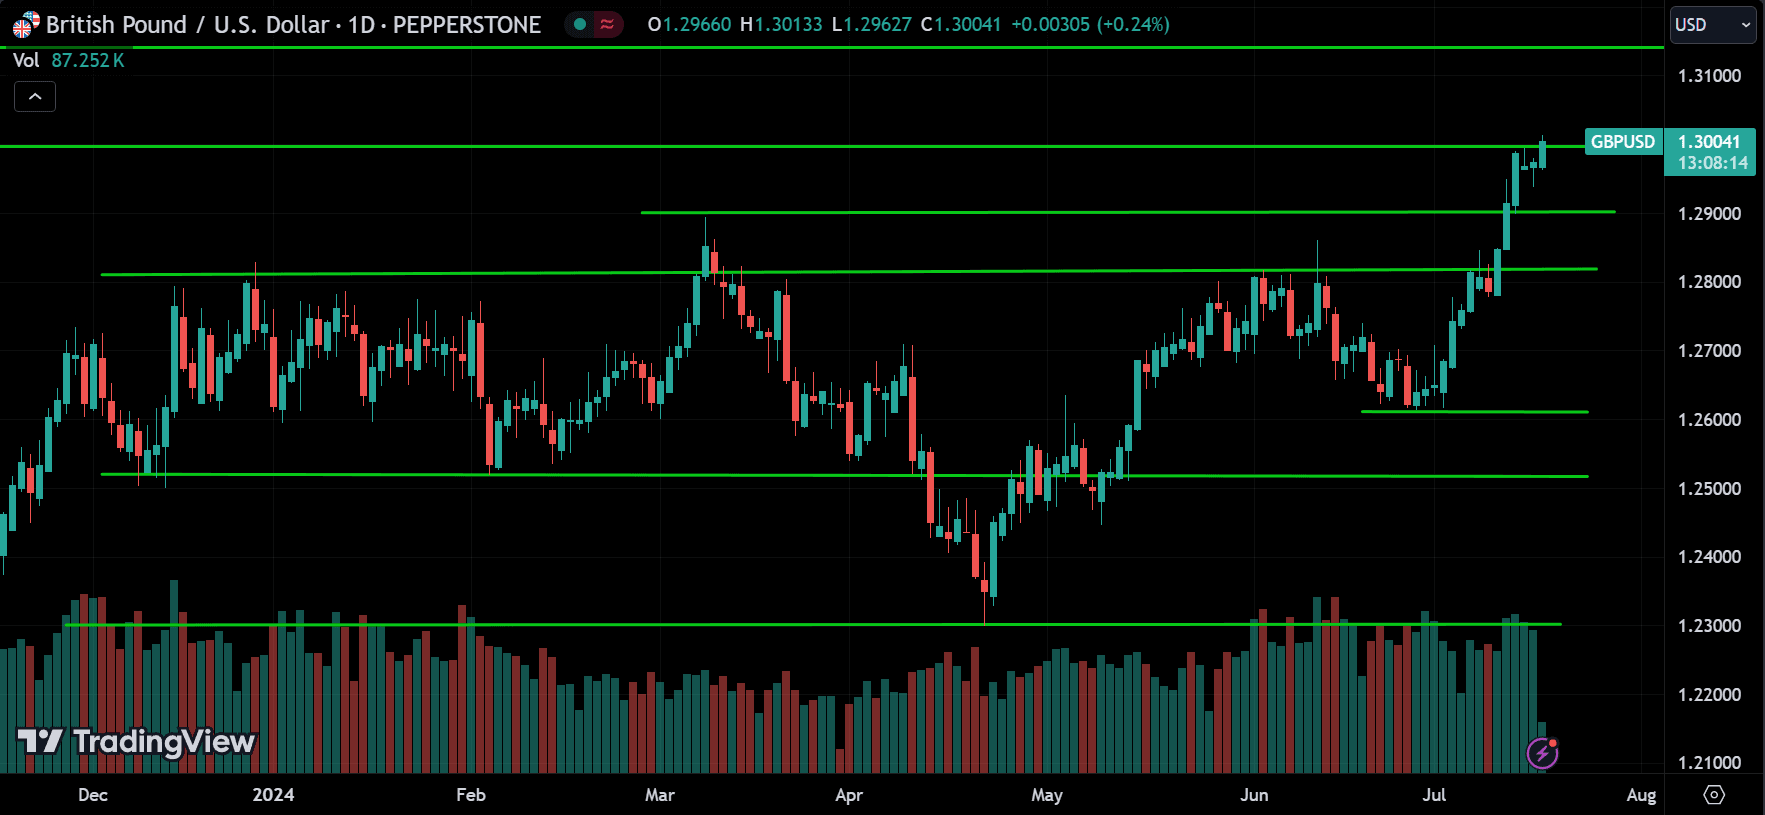
Looking at GBPUSD, it’s trending up and is now above the major resistance at 1.30000.
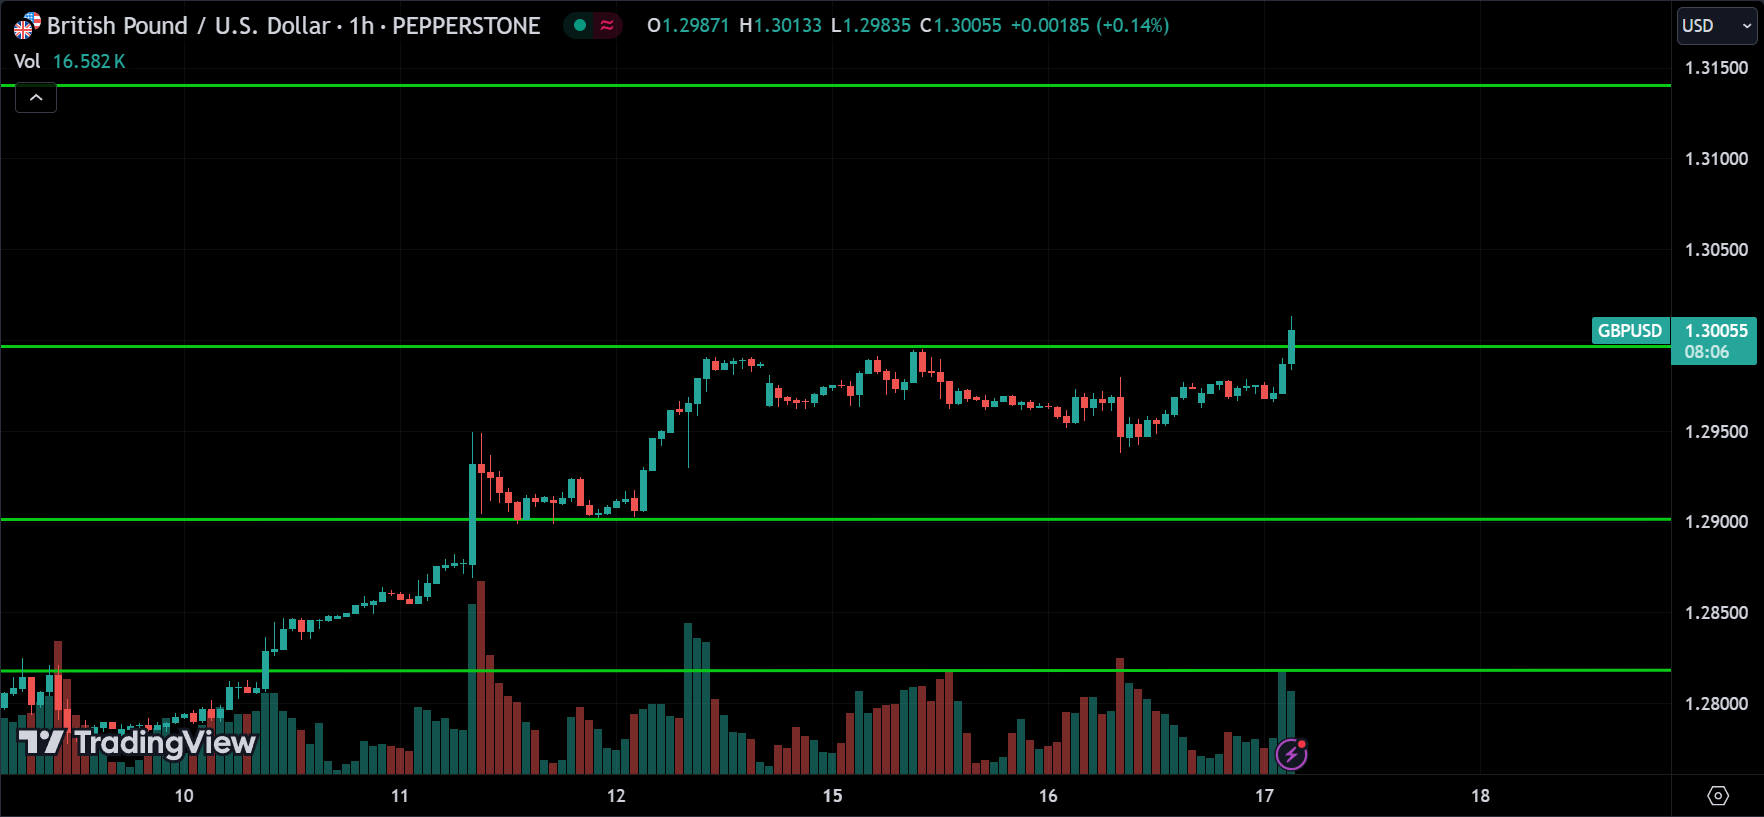
Looking at the 1-hour chart, you can see the price consolidated around the resistance for a while and then broke above it. Now, we can expect the price to continue rising towards the next resistance around 1.31500, but anticipate some pullbacks, especially around round numbers. If the price falls back below this support, the trend might be changing, so be cautious.
AUDUSD:
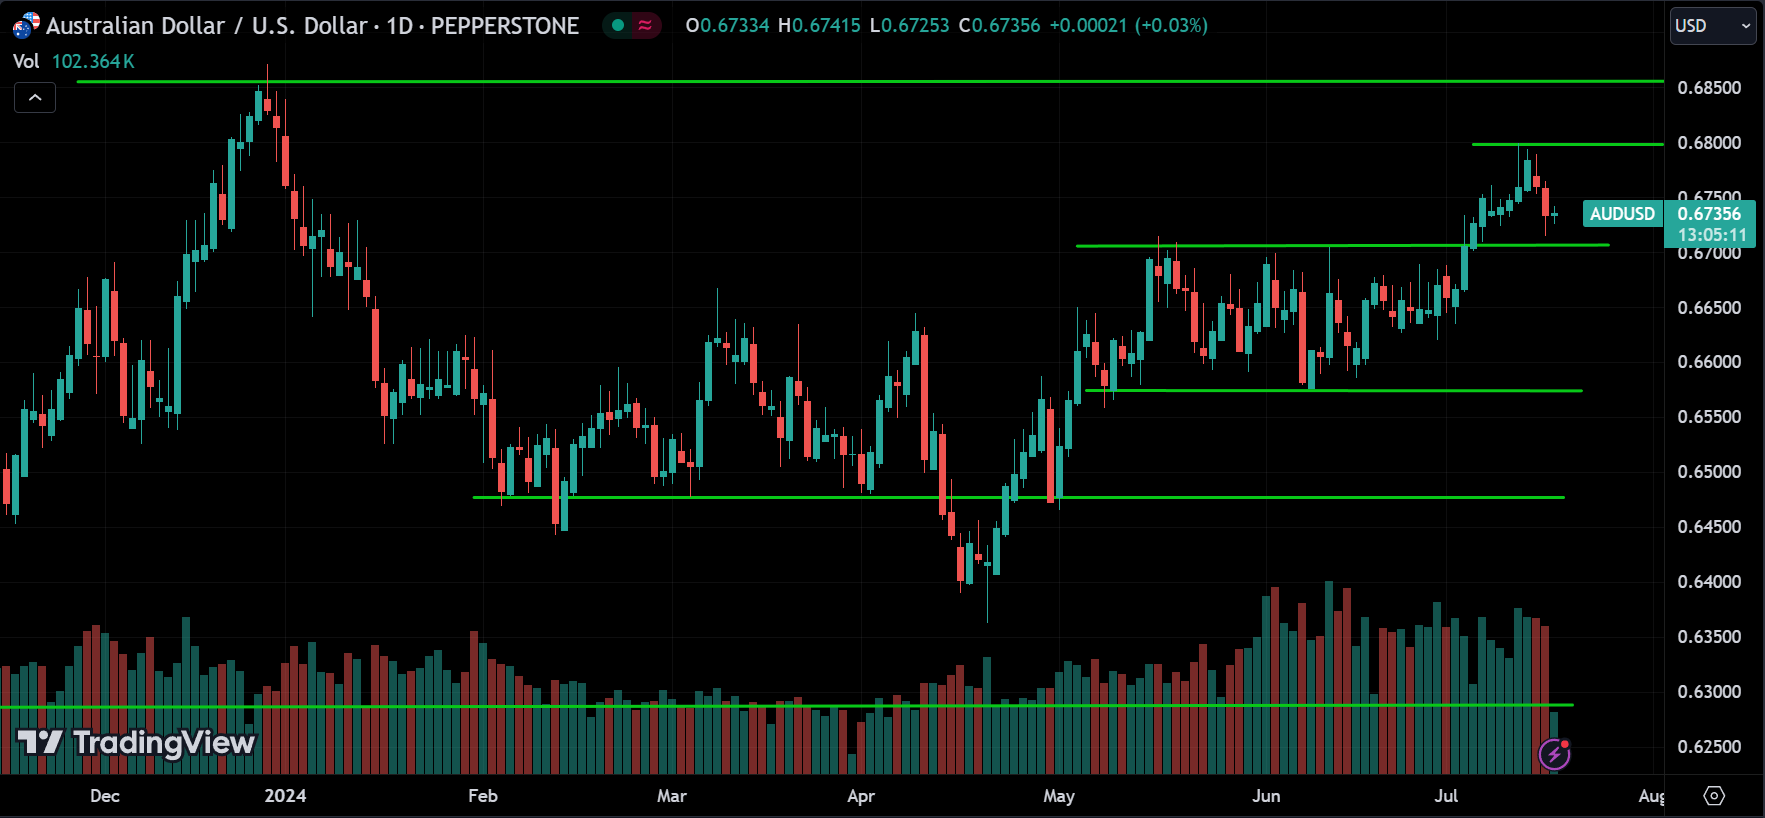
Looking at AUDUSD, it’s on an uptrend, but currently pulling back from resistance around 0.68000.
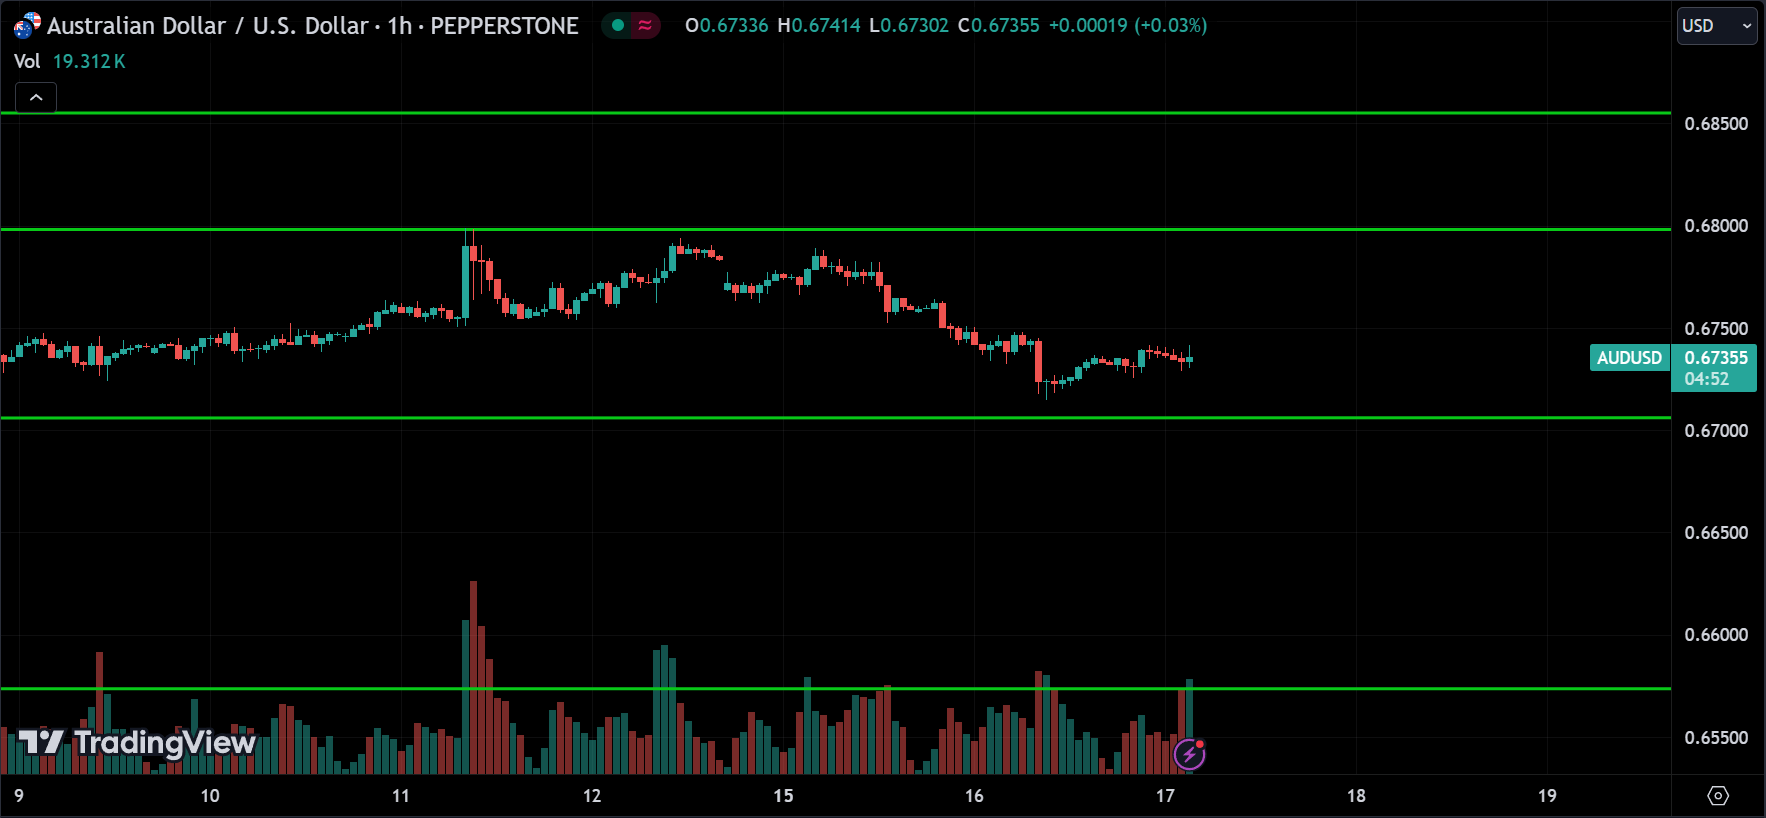
Looking at the 1-hour chart, you can see that the price is near the support level of 0.67000. Given the bullish trend, we anticipate the price to start rising from this support towards 0.68000. If it breaks above that level, we can expect further upward movement towards the next resistance. However, if the price breaks below the current support level, it might indicate a correction with potential further decline to the next support level.
NZDUSD:
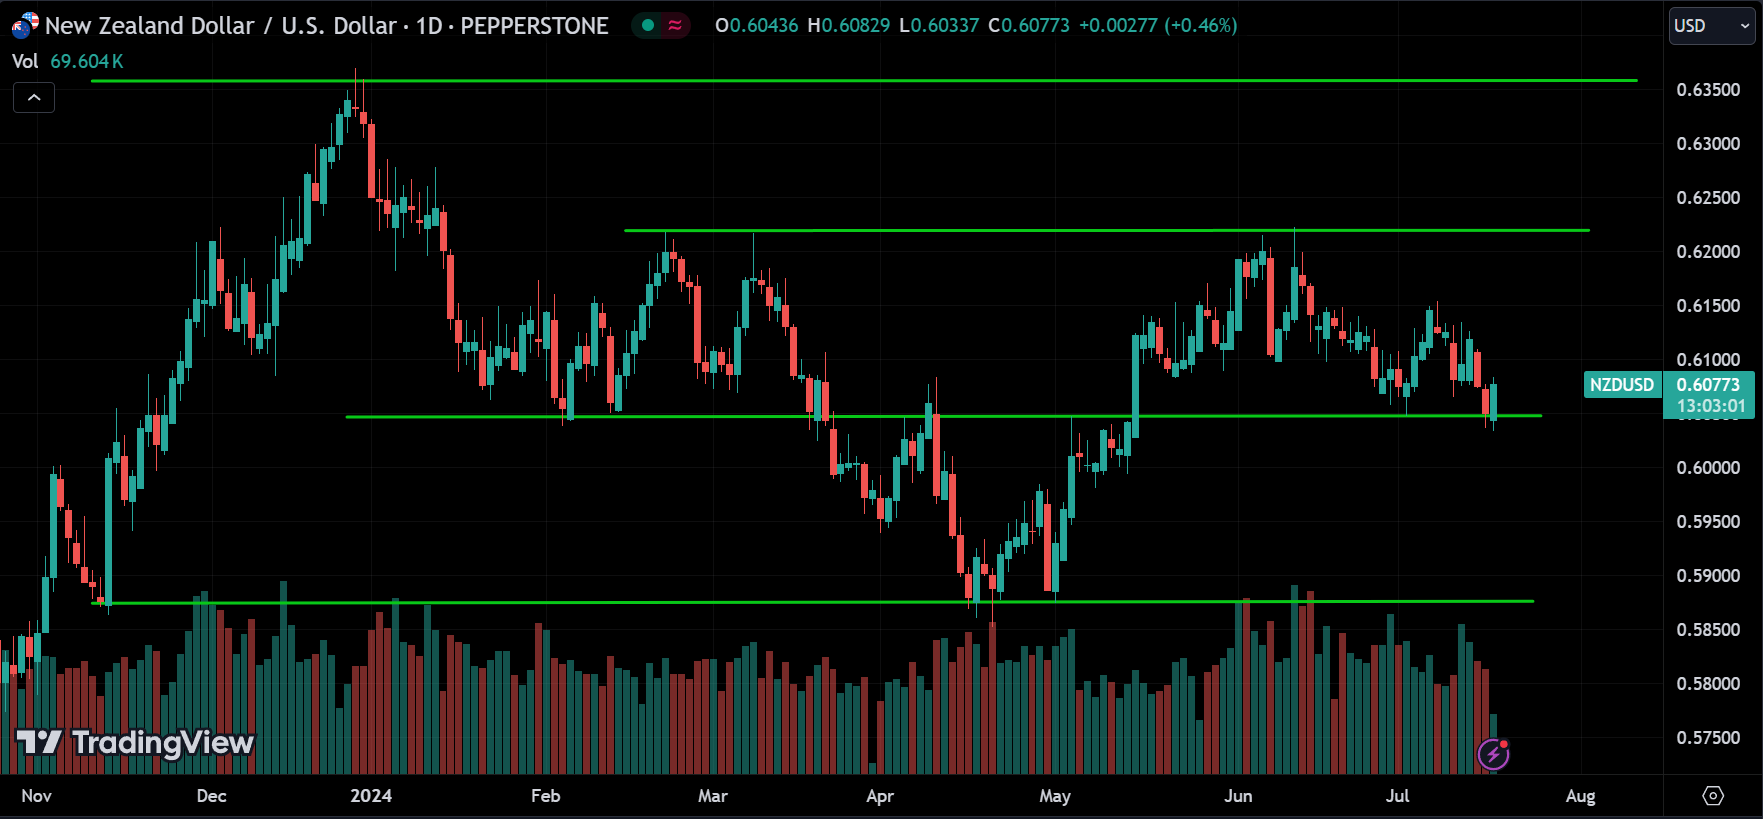
Looking at NZDUSD, it’s currently consolidating around a support level of 0.60500.
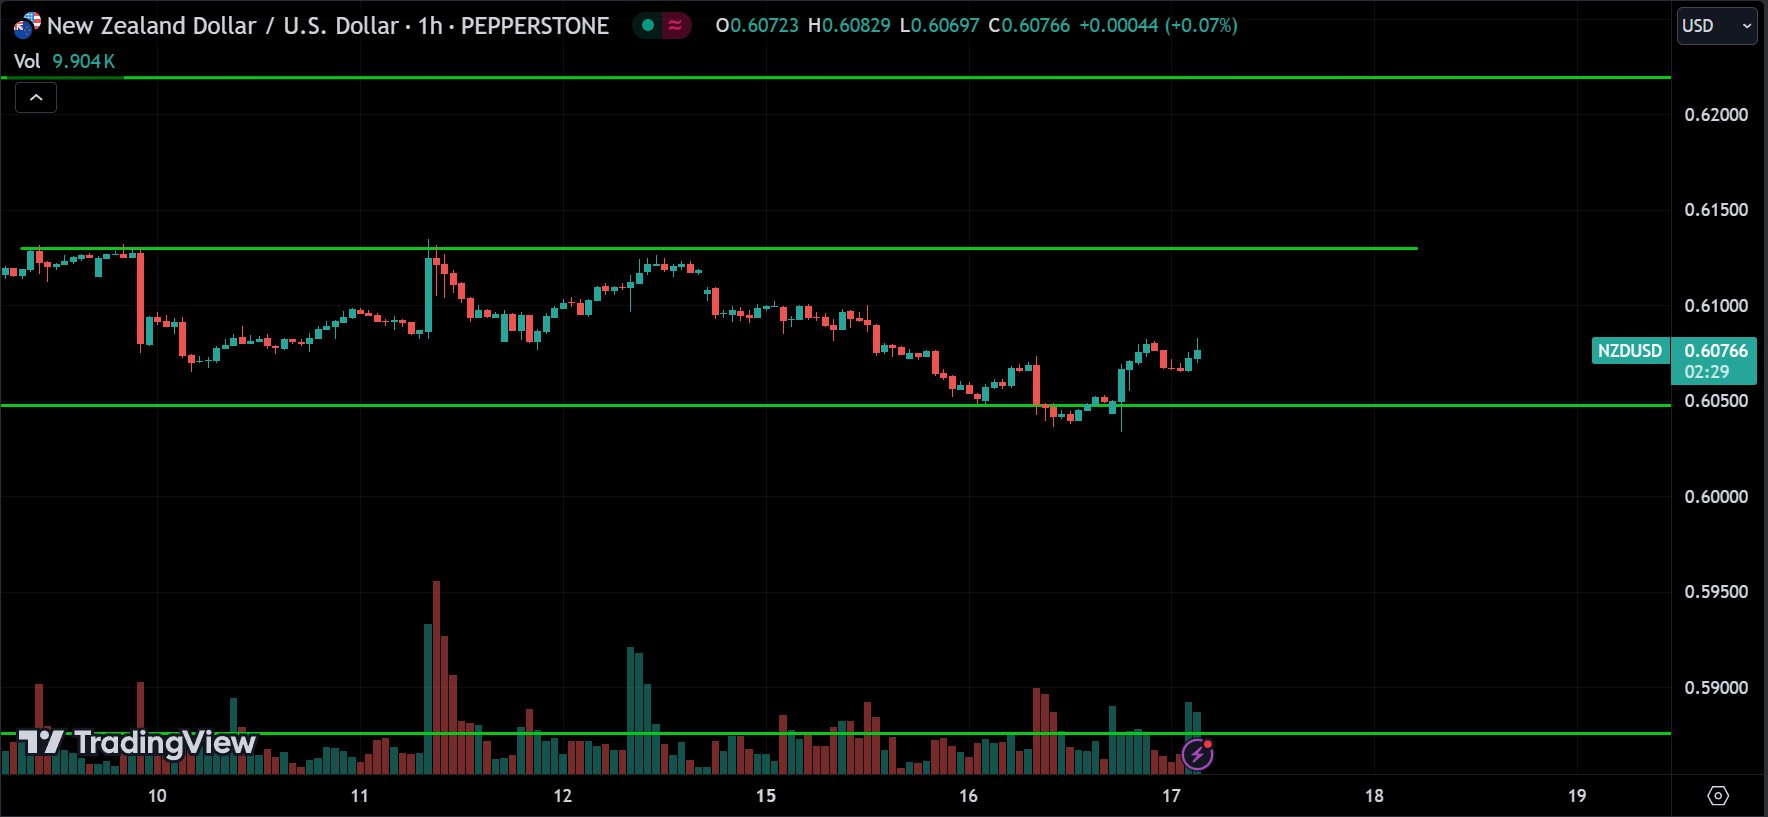
Looking at the 1-hour chart, you can see the price pulling back up from the support. We anticipate the price to rise towards the next resistance level. If that level is broken, we can expect further upward movement. However, if the price breaks below this support, it may start to fall, so be alert for any breakouts.
Conclusion & Disclaimer
Please provide your feedback on how we can improve this article. Thank you!
These analyses are here to help you understand how to analyze the market. They’re not about giving buy or sell signals. It’s simply about observing price action market behavior. I don’t recommend when to buy or sell because trading doesn’t work that way. You need a strategy to guide your decisions about when to enter or exit positions. That’s the key to making consistent profits in the financial markets over time.
The information provided in this market analysis is for educational and informational purposes only. It should not be construed as financial advice or a recommendation to buy, sell, or hold any securities or investments.
All investments involve risk, and past performance is not indicative of future results. The analysis provided may not be suitable for all investors and should be used at their own discretion.
Readers are encouraged to conduct their own research.
Trading and investing in financial markets carry inherent risks, including the risk of losing invested capital. It is important to carefully consider your investment objectives, risk tolerance, and financial situation before making any investment decisions.
GOOD LUCK✌!!!