

Macroeconomics give important clues about how well countries and the world economy are doing, affecting the prices of assets and how people feel about the market. In this article, we’ll talk about why macroeconomic reports are important for trading and look at ways to understand and use their information.
What are Macroeconomic Reports?
Macroeconomics reports encompass a wide array of data points that reflect the overall economic performance of a country or region. Key indicators include GDP growth, inflation rates, unemployment figures, consumer spending, industrial production, trade balances, and central bank policy decisions.
These reports are released at regular intervals by government agencies, central banks, and international organizations, such as the Bureau of Economic Analysis (BEA) in the United States, Eurostat in the European Union, and the International Monetary Fund (IMF).
The frequency of these reports varies; some are released monthly, quarterly, or annually, depending on the organization and scope of the report.
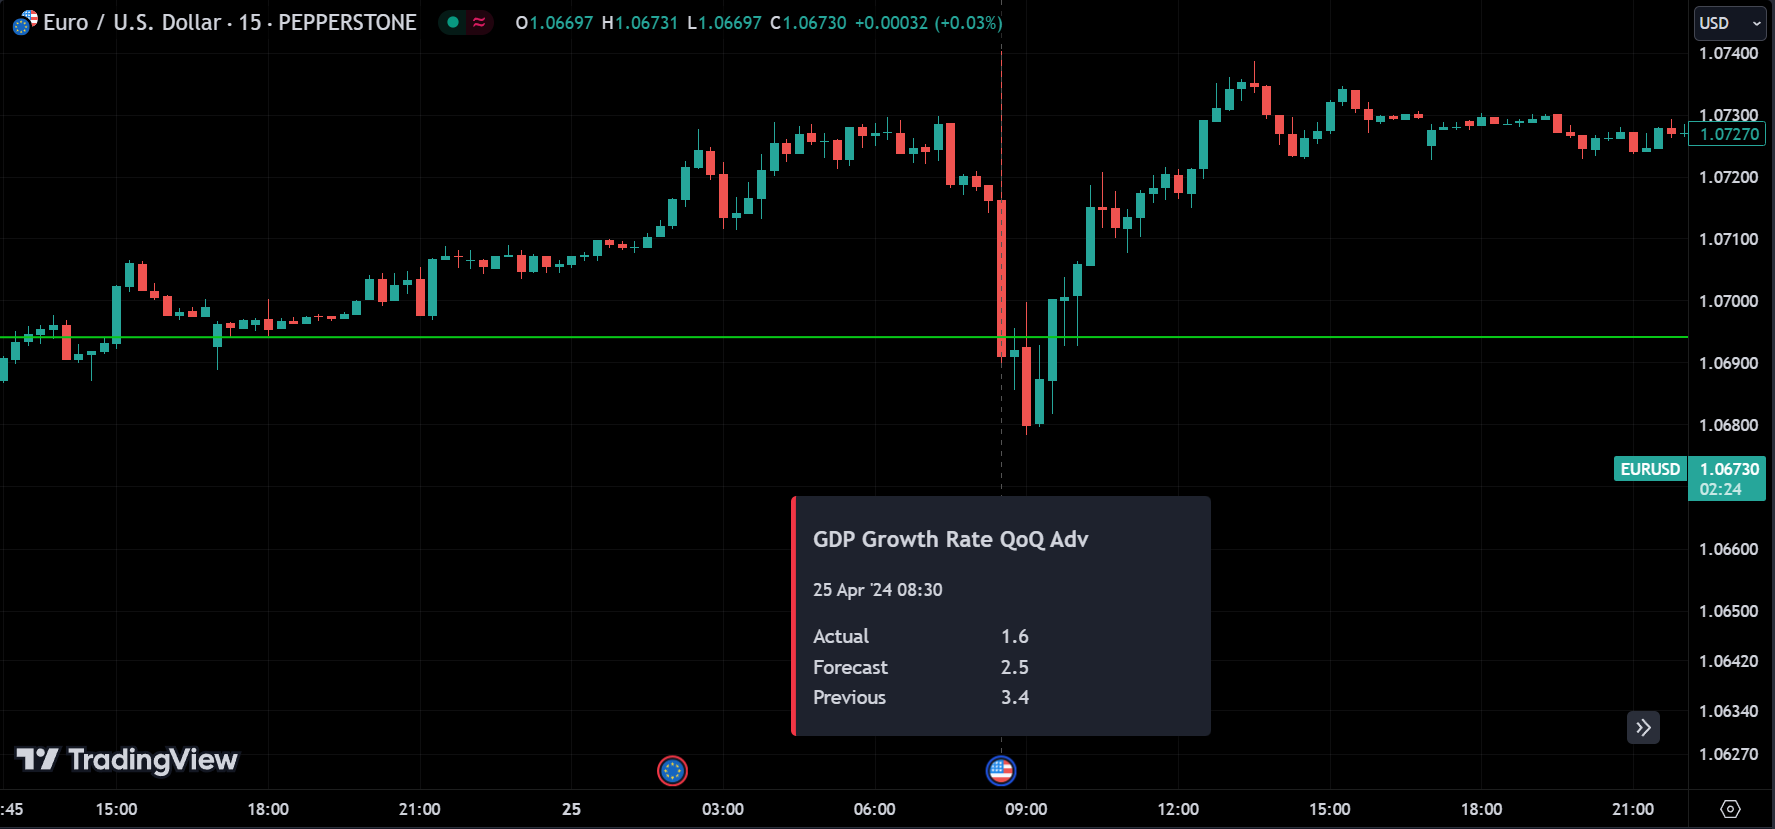
One way to find out about upcoming economic reports is by using a economic calendars provided by various sources like Bloomberg.
Macroeconomic reports, which are crucial indicators of economic health and can greatly impact financial markets.
As traders, we prioritize our attention on the reports that have the most significant impact on the markets, considering the vast number of reports being released.
Positive data, such as robust GDP growth or declining unemployment, typically leads to bullish market sentiment, prompting investors to buy stocks, bonds, and currencies. Conversely, negative indicators, such as high inflation or sluggish consumer spending, may trigger bearish reactions, causing asset prices to fall. Moreover, central bank announcements, such as changes in interest rates or monetary policy outlooks, can have profound implications for currency valuations and bond yields.
Key Components of Macroeconomics
In macroeconomics, different tools or components are used depending on the specific aspect of the economy being analyzed.
For example, when examining GDP growth, economists might focus on factors like consumer spending, investment, government spending, and net exports. On the other hand, when analyzing inflation, they might look at price indices, wage data, and monetary policy. The tools and components utilized can vary based on the particular economic indicators or phenomena under study.
Economic Indicators:
These reports present a wide range of economic indicators that help assess the overall health of the economy. Common indicators include Gross Domestic Product (GDP), inflation rate, unemployment rate, consumer price index (CPI), industrial production, trade balance, and more.
Economic Performance:
They analyze and compare economic performance over a specific period. This allows readers to understand how the economy has grown or contracted, how stable it is, and whether it is in a recession or expansion phase.
Monetary and Fiscal Policies:
Macroeconomics reports often discuss the measures taken by the government and central banks to influence the economy, such as monetary policy (interest rates, money supply) and fiscal policy (taxation, government spending).
Employment and Labor Market:
Reports may delve into the state of the labor market, employment trends, and the overall workforce participation rate, providing insights into the health of the job market.
Inflation and Price Stability:
Understanding the rate of inflation and its implications on the purchasing power of consumers and overall price stability is a crucial aspect of macroeconomics reports.
Trade and International Relations:
These reports may examine international trade dynamics, balance of payments, exchange rates, and their effects on economic growth and stability.
Business and Consumer Confidence:
Sentiment indicators are essential in gauging the confidence of businesses and consumers in the economy. Positive confidence often leads to increased investments and spending, which can stimulate economic growth.
Special Focus Areas:
Some reports might focus on specific sectors or issues that are particularly relevant or influential at a given time, such as housing markets, energy prices, or technological advancements.
Forecasts and Predictions:
Based on the analysis of the aforementioned indicators and factors, macroeconomics reports may also offer forecasts and predictions about the future trajectory of the economy.
Important Macroeconomics Reports
Not all macroeconomic reports are equally important for investors or traders. In financial markets, participants often prioritize the analysis of key economic indicators that have the most significant impact on market sentiment and asset prices.
They focus on reports that provide insights into fundamental aspects of the economy, such as GDP growth, inflation, employment, and central bank policies. These reports are closely watched because they can drive market movements and influence trading decisions.
While other macroeconomic reports may still provide valuable information, traders tend to prioritize those that have the greatest potential to affect market dynamics.
What is EIA Petroleum Status Report?
The EIA (U.S. Energy Information Administration) Petroleum Status Reports are weekly publications that provide critical data and analysis on the supply and demand dynamics of petroleum products in the United States. These reports are highly anticipated by energy traders, analysts, policymakers, and industry stakeholders, as they offer valuable insights into the current state of the U.S. petroleum market.
Key Components of the EIA Petroleum Status Reports
Crude Oil Inventories: The reports detail the levels of crude oil held in storage at various locations across the United States. This information is crucial for assessing the balance between supply and demand, which can influence oil prices.
Gasoline Inventories: They provide data on the stockpiles of gasoline in the U.S. This data is essential for tracking gasoline consumption trends, particularly during peak driving seasons.
Distillate Inventories: Distillates include diesel fuel, heating oil, and jet fuel. The reports include information on the stockpiles of these products, offering insights into the demand for various types of distillates.
Refinery Utilization: The reports include data on the operating capacity of refineries in the U.S. and the percentage of capacity in use. This information indicates the level of activity in the refining sector and its potential impact on the supply of petroleum products.
Production and Imports: They provide information on domestic crude oil production and the volume of petroleum products imported into the country. These figures are crucial for understanding the sources of supply and the degree of dependence on foreign imports.
Consumption and Demand: The reports also include data on the consumption of petroleum products in the U.S., offering insights into demand trends.
Market Implications: Analysis and commentary in the reports help readers understand the potential implications of the data on oil prices, energy markets, and overall economic conditions.
The EIA Petroleum Status Reports are released every Wednesday at 10:30 a.m. Eastern Time, with the data reflecting the previous week’s numbers. Traders and investors closely monitor these reports as they can significantly influence crude oil and refined product prices. Sudden changes in inventory levels, production, or demand can lead to significant market movements, making these reports essential tools for decision-making in the energy sector.
In essence, these reports provide insights into the petroleum inventory levels in the U.S. and abroad. The data indicates the state of supply, which, in turn, affects prices. Higher inventories suggest abundant supply, which can lead to price decreases. Conversely, lower-than-expected inventories signal reduced supply, potentially causing prices to rise.
The United States Oil Fund ETF will be significantly impacted by this report, and monitoring this ETF will provide insights into the developments in the oil industry.
Jobless Claims & Unemployment Report
Jobless claims report and unemployment report are two essential economic indicators that provide insights into the state of the labor market in a country, particularly in the United States. While they are related, they convey different aspects of employment conditions.
What is Jobless Claims Report?
The jobless claims report, also known as the weekly initial jobless claims report, is released every week by the U.S. Department of Labor’s Employment and Training Administration.
It provides information on the number of individuals who have filed for unemployment benefits for the first time during a specific week.
This report is considered a leading indicator as it gives a timely snapshot of new jobless claims, reflecting recent changes in the labor market.
An increasing number of jobless claims may indicate rising layoffs and economic challenges, while a decreasing number suggests improving economic conditions and a stronger job market.
Traders and policymakers closely monitor the jobless claims report as it can impact investor sentiment, influence monetary policy decisions, and provide valuable insights into the broader economic health.
What is Unemployment Report?
The unemployment report, often referred to as the monthly jobs report or nonfarm payrolls report, is released by the U.S. Bureau of Labor Statistics on the first Friday of each month.
It provides comprehensive data on various aspects of employment, including the unemployment rate, total number of employed individuals, labor force participation rate, and changes in nonfarm payrolls (employment in non-agricultural sectors).
The unemployment rate is the most widely watched metric in this report. It represents the percentage of the labor force that is unemployed and actively seeking employment.
The unemployment report is considered a lagging indicator since it reflects past employment conditions and changes over the course of the previous month.
Like the jobless claims report, the unemployment report is highly significant for policymakers, investors, and businesses. It helps gauge the overall health of the labor market, assess the pace of job creation or loss, and provides valuable information about the direction of the economy.
Both reports are vital tools for understanding the dynamics of the labor market and are used by various stakeholders, including central banks, policymakers, financial analysts, and investors, to make informed decisions and assess the overall economic conditions. While the jobless claims report provides a more immediate picture of new jobless filings, the unemployment report offers a broader overview of the employment situation and its impact on the economy.
What is the Housing Market Index?
The Housing Market Index (HMI) report is a monthly survey conducted by the National Association of Home Builders (NAHB) in the United States. It provides valuable insights into the sentiment and confidence levels of home builders regarding the current and future conditions in the housing market. The HMI is considered a leading indicator of the housing industry’s health and can offer valuable clues about the overall state of the economy.
Key Points about the Housing Market Index (HMI) Report
Survey Composition: The HMI survey asks home builders to rate their perceptions of three key aspects of the housing market: current sales conditions for single-family homes, sales expectations for the next six months, and the foot traffic of prospective buyers. Each component is assigned a score from 0 to 100.
Scale Interpretation: A score above 50 indicates that more home builders view conditions as positive rather than negative, implying optimism in the housing market. Conversely, a score below 50 suggests a pessimistic outlook.
Industry Health Indicator: The HMI report is regarded as an important indicator of the overall health of the housing market. It provides a pulse on builders’ confidence, which can be a leading signal of future construction activity and home sales.
Impact on Construction Activity: Positive sentiment reflected in the HMI report may lead to an increase in home construction and related economic activity. Higher confidence among home builders can spur investments in new housing projects.
Housing Market’s Economic Significance: The housing market plays a significant role in the broader economy. Strong housing market conditions can contribute to job creation, higher consumer spending, and increased economic growth.
Market Sentiment and Policy Decisions: The HMI report can influence financial markets, investor sentiment, and even government policy decisions related to housing and economic stimulus measures.
Timeliness and Release Frequency: The HMI report is released on a monthly basis, typically around the 15th of each month. Its timely release makes it valuable for tracking changes in sentiment and trends in the housing market.
The Housing Market Index report is a widely followed indicator in the real estate and financial sectors. It provides valuable information for home builders, real estate professionals, economists, policymakers, and investors to make informed decisions about housing-related investments and assess the overall health of the housing market.
What is Consumer Sentiment Index?
The Consumer Sentiment Index (CSI) report, also known as the Consumer Confidence Index (CCI), is a widely recognized economic indicator that measures the confidence and sentiment of consumers in a particular country’s economy. The index is based on surveys conducted among a representative sample of households, asking questions about their current economic conditions, financial situation, and future expectations.
Key Points about the Consumer Sentiment Index (CSI) Report
Survey Composition: The CSI report is typically based on survey responses from consumers regarding their perceptions of the current economic situation and their expectations for the future. The surveys may include questions about personal finances, job prospects, business conditions, and buying intentions.
Scale Interpretation: The index is reported as a numerical value. A higher index value indicates higher consumer confidence, signaling that consumers are optimistic about the economy. Conversely, a lower index value suggests lower consumer confidence and a more pessimistic outlook.
Consumer Spending and Economic Growth: Consumer spending is a significant driver of economic activity in many countries. High consumer confidence often leads to increased spending, which can contribute to economic growth. Conversely, low confidence may result in reduced spending and economic slowdown.
Indicator of Economic Health: The CSI report is considered a leading indicator as it provides insights into consumer behavior before actual changes in economic conditions occur. Changes in consumer sentiment can precede shifts in consumer spending and broader economic trends.
Impact on Financial Markets: The CSI report can influence financial markets, particularly sectors sensitive to consumer spending, such as retail, consumer discretionary, and travel-related industries. Positive or negative changes in consumer sentiment may lead to market volatility and impact investor sentiment.
Government Policy and Business Decisions: Policymakers and businesses pay close attention to consumer sentiment as it can influence decisions related to fiscal and monetary policies, marketing strategies, and investment planning.
Timeliness and Release Frequency: The CSI report is usually released on a monthly basis by government agencies or research organizations. Its timely release provides current information about consumer sentiment, making it valuable for tracking changes in consumer behavior and expectations.
The Consumer Sentiment Index report is an essential tool for economists, policymakers, businesses, and investors to understand consumer attitudes, anticipate potential changes in consumer spending patterns, and assess the overall health of the economy. It helps stakeholders make informed decisions and adapt their strategies based on consumer sentiment and expectations.
What is Consumer Price Index?
The Consumer Price Index (CPI) report is a regular publication that provides valuable information about inflation and changes in the cost of living for consumers. It is a key economic indicator used by governments, policymakers, businesses, and investors to monitor and understand the impact of price changes on the overall economy.
Key Points about the Consumer Price Index (CPI) Report
Measurement of Inflation: The CPI report tracks the average price changes of a fixed basket of goods and services typically consumed by urban households over time. It is a primary tool for measuring inflation, which is the rate at which the general level of prices rises in an economy.
Basket of Goods and Services: The CPI represents a representative basket of goods and services that consumers typically purchase. The basket includes items such as food, housing, transportation, healthcare, education, clothing, and more.
Weighted Components: Each category within the CPI basket is assigned a weight based on its proportionate share of the average consumer’s expenditure. The weights reflect the relative importance of different items in the index.
Base Period and Index Calculation: The CPI uses a specific period as the base period, assigning it a value of 100. The index is calculated by dividing the cost of the basket of goods and services in the current period by the cost in the base period and then multiplying by 100.
Inflation Rate Calculation: The inflation rate is derived from the percentage change in the CPI between two periods. It indicates how much prices have increased or decreased during that period. A positive inflation rate indicates rising prices, while a negative rate suggests deflation (falling prices).
Core CPI: Some CPI reports also provide a Core CPI, which excludes volatile food and energy prices. The Core CPI provides a more stable measure of underlying inflation trends.
Impact on Economy and Policy Decisions: The CPI report is crucial for policymakers as it influences their decisions on monetary policy, interest rates, and fiscal measures. It also helps businesses set prices, negotiate contracts, and forecast revenues and expenses.
Release Frequency: CPI reports are usually published monthly by government agencies or central banks. It provides up-to-date information on the state of inflation and its potential implications for the economy.
International Comparisons: Different countries calculate their own CPIs, allowing for international comparisons of inflation rates and cost-of-living differences.
The CPI report is an indispensable tool for assessing price changes, inflation trends, and the overall economic health. It helps individuals and businesses make informed decisions, adjust budgets, and understand how price fluctuations can impact their purchasing power and financial well-being.
Conclusion
As traders, it’s important to stay updated on what’s happening in the market. One good way to do this is by checking the economic calendar regularly. We keep a close eye on these planned reports and take care to protect our positions or avoid trading certain stocks on the days these reports come out.
Usually, these reports match what people expect, but sometimes they can be very different from what was predicted. This can have a big effect on the market. As traders, we might take advantage of these situations to make money, or we might play it safe by protecting our positions or not trading when we’re not sure what will happen.