![US Stock Market Today [2024.08.27]: Key Price Levels and Trends for S&P 500 & Sectors - Stocks to Watch Today: Nvidia, eBay, and Apple.
xlearnonline.com](https://xlearnonline.com/wp-content/uploads/2024/08/Fundamental-1.png)
Hello, and welcome to xlearn’s US stock market today article series. If this is your first time here, I recommend reading our guide on how to use our market analysis article before diving into this one.
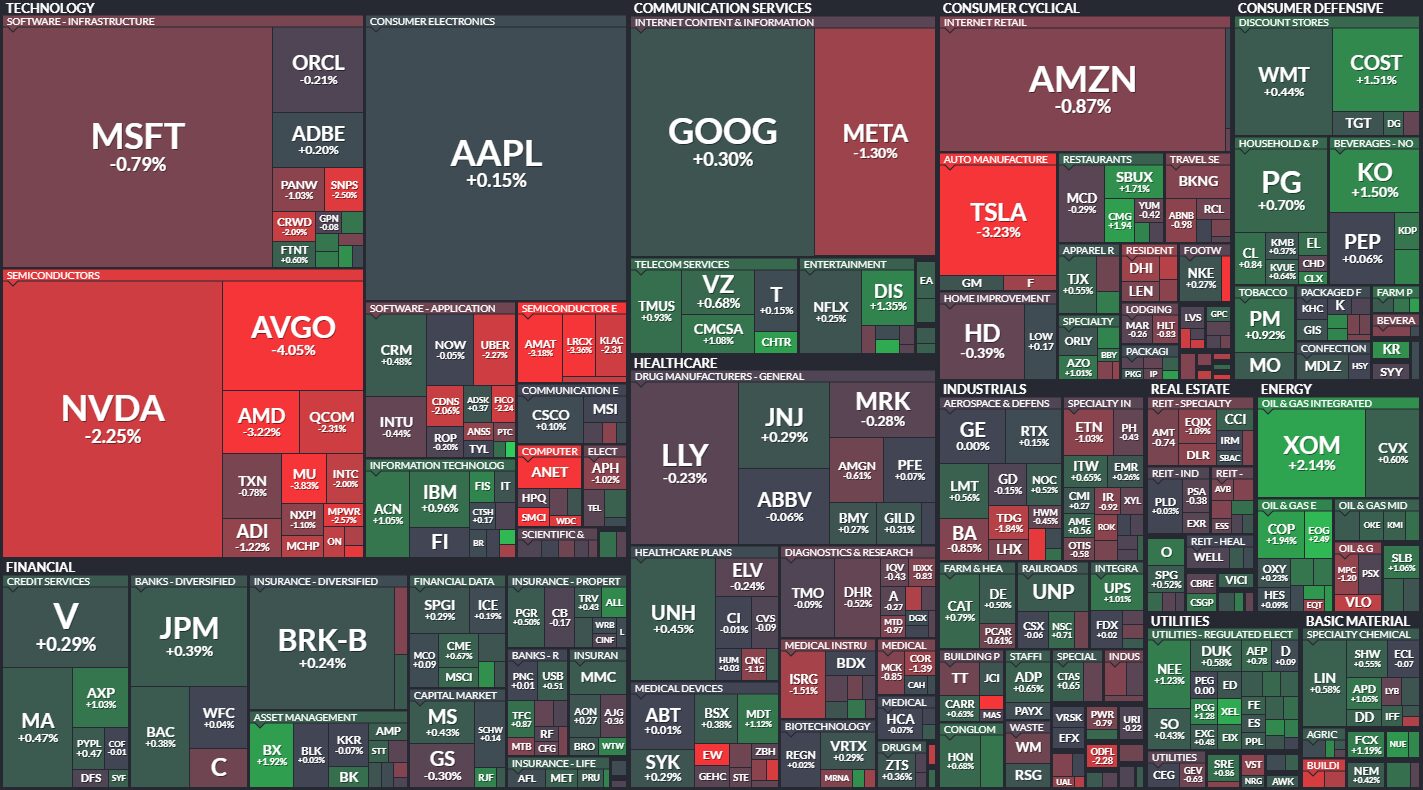
We will use a top-down approach in our analysis. First, we will analyze the overall market, focusing on the S&P 500. Then, we will analyze each sector one by one for their price action performance so we can trade stocks in those sectors with confidence. Finally, we will look at some stocks to watch for today.
Before we get into the analysis, let’s quickly review the major economic events that could impact the market.
Economic Events Today
These events include important news that could impact the stock market, macroeconomic reports, and economic indicators. For more details, you can check the bloomberg calendar & yahoo finance.
- 10:00 ET: The CB Consumer Confidence report will be released. This report shows the confidence level among surveyed households, with the previous reading at 100.3 and the forecast at 100.9. If the actual number is higher than the forecast, it’s positive for the currency. Financial confidence is a key indicator of consumer spending, which drives most of the economy.
Stocks with Earnings:
| BEFORE MARKET OPEN | AFTER MARKET CLOSE |
|---|---|
| SCSC | S |
| REX | PVH |
| HAIN | BOX |
| URG | NCNO |
| JWN | |
| SMTC | |
| AMBA | |
| TWFG | |
| WALD |
S&P 500
For more details, check out finviz.
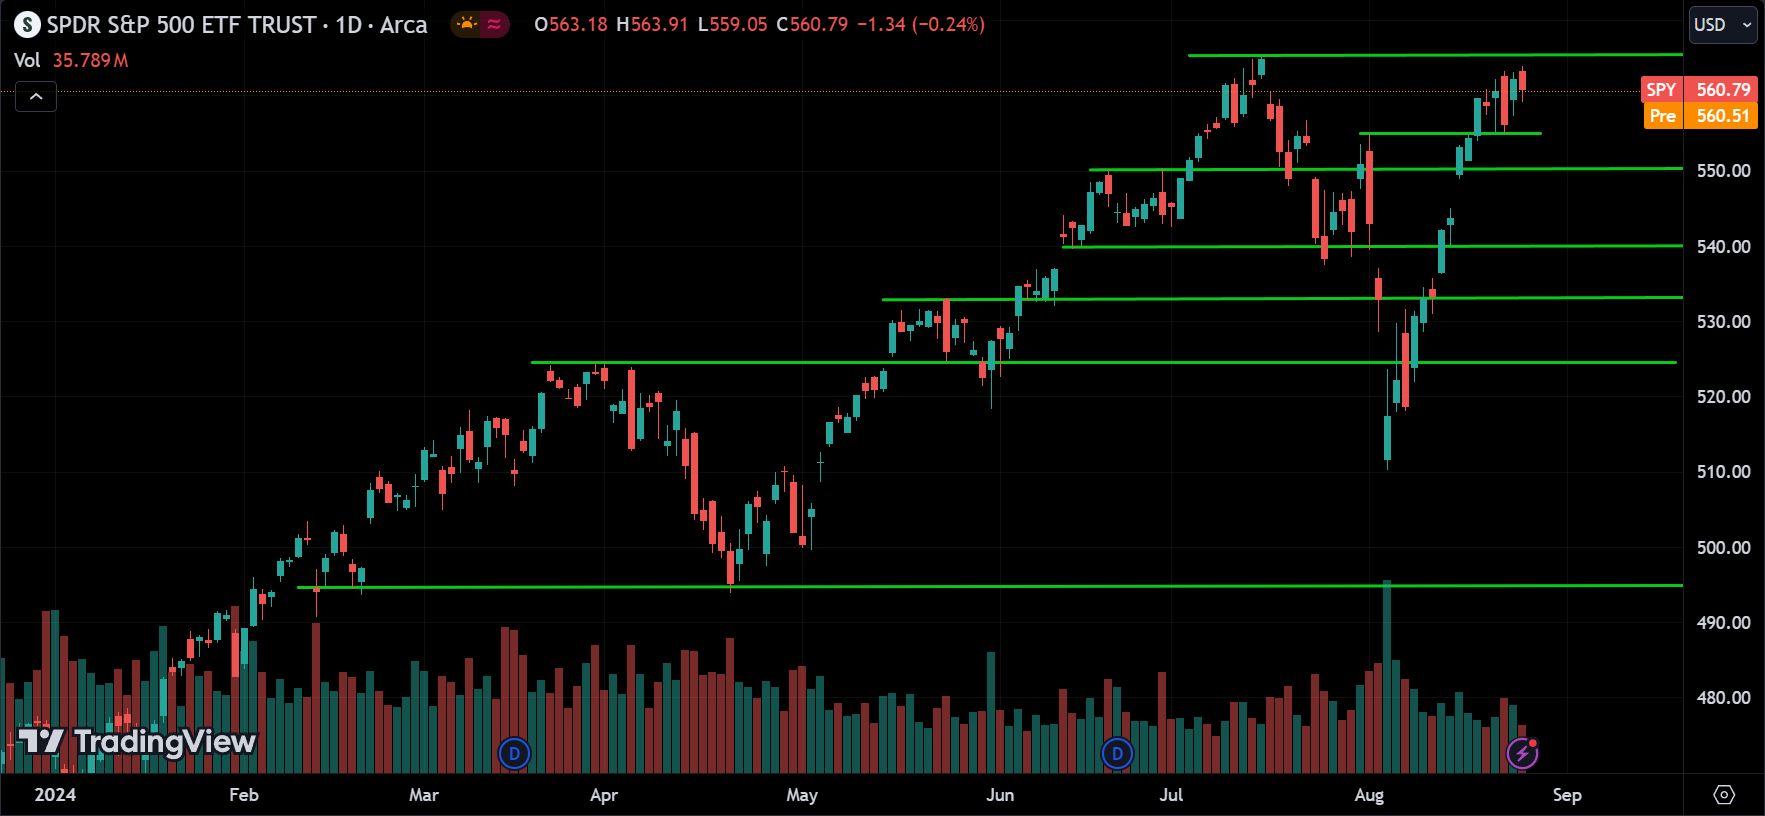
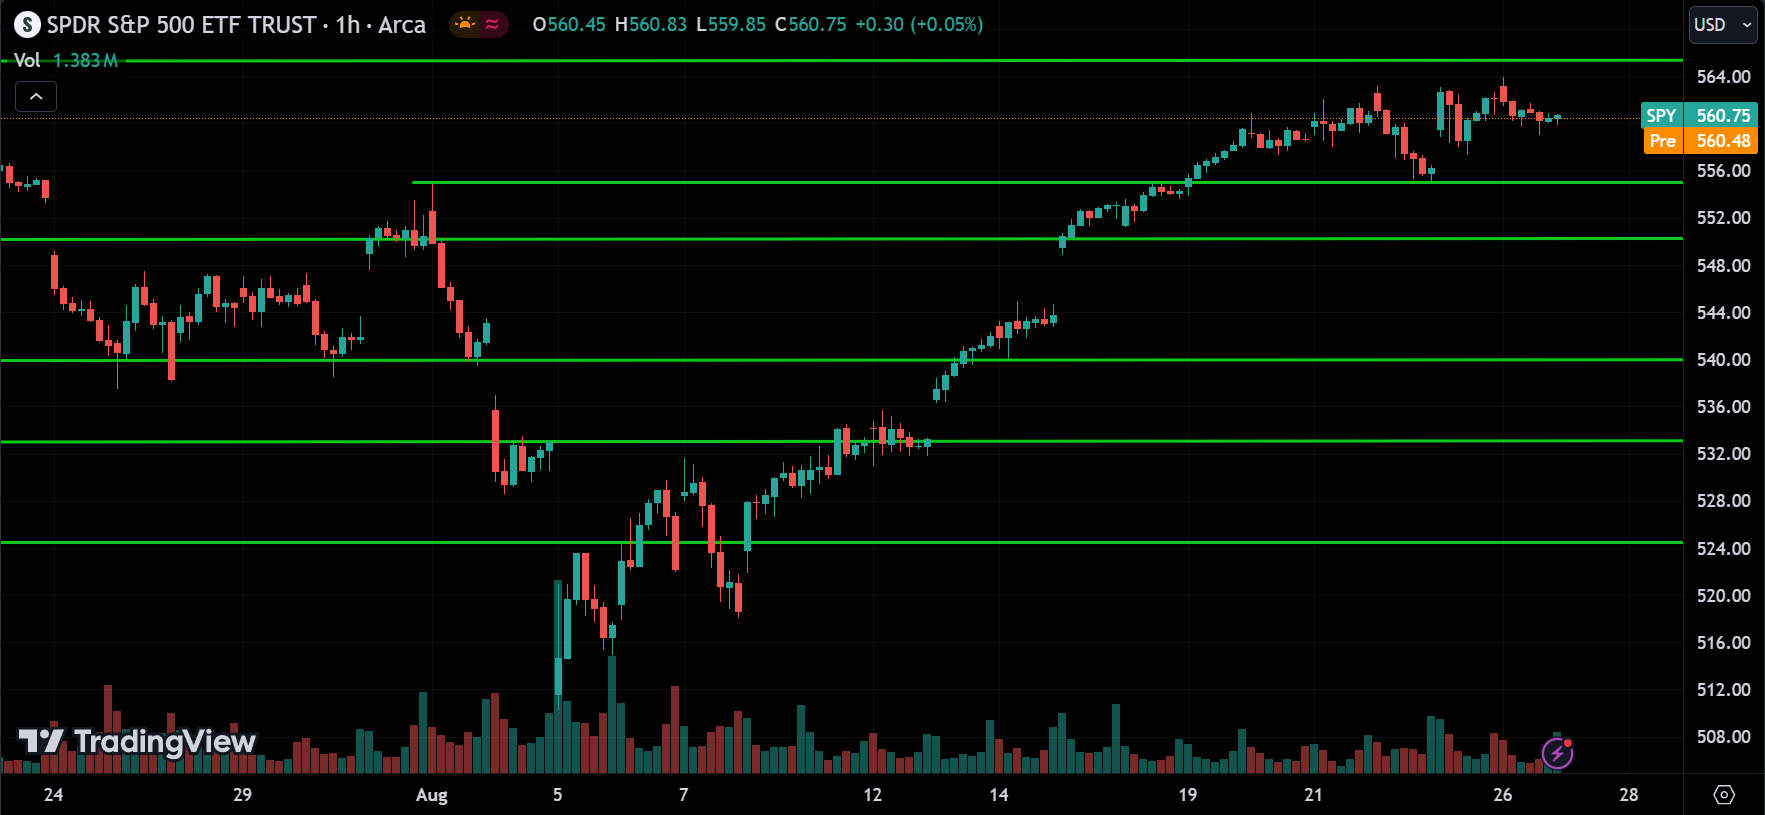
The S&P 500 is at its all-time high, with 565 acting as a resistance level. Since the market is uptrending and the Fed is signaling rate cuts starting in September, we could see the stock market enter an even stronger bullish phase. We can expect the price to break above this resistance level and continue rising. However, anything can happen, so pay attention to price action. If the price drops below the 556 support level, it could signal the start of a correction phase. Watch out for breakouts.
Consumer Staples Sector(XLP):
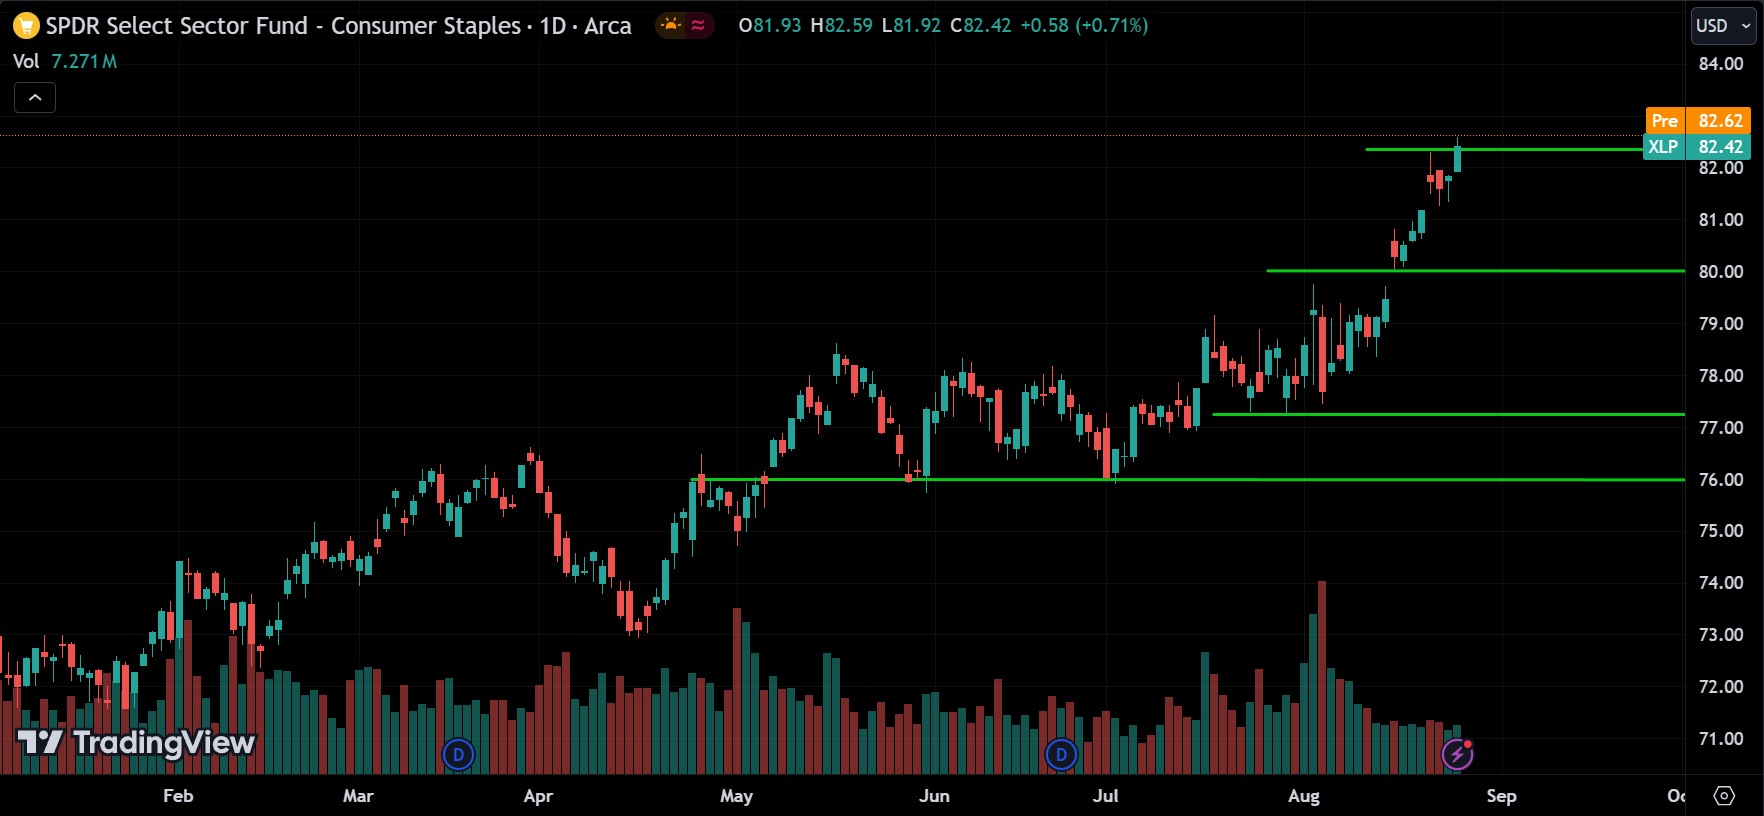
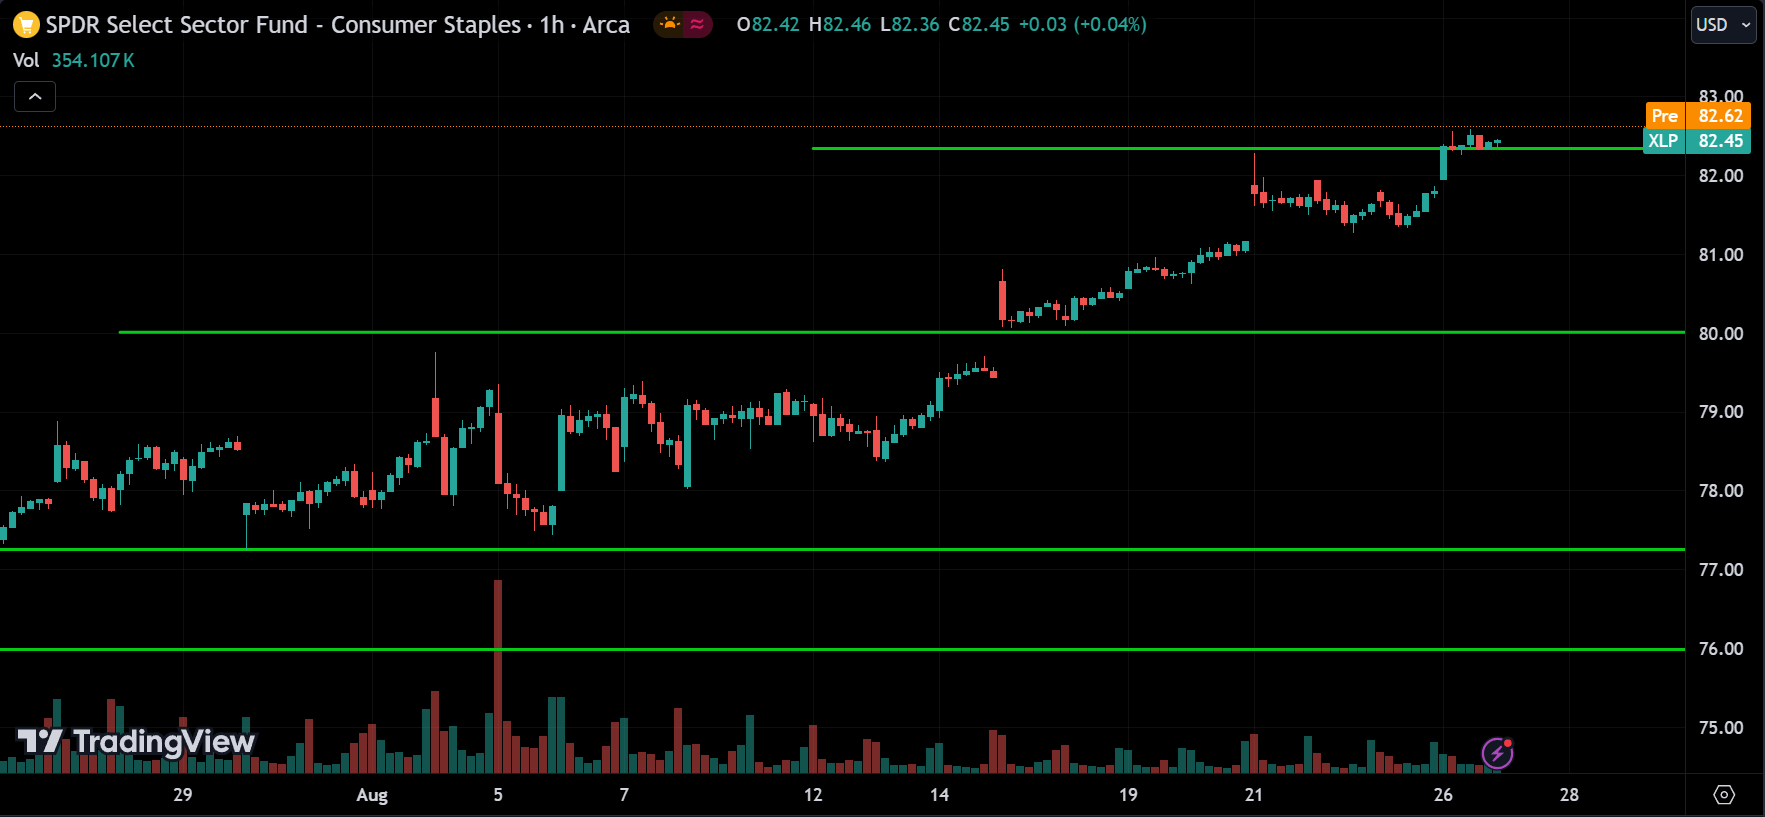
Looking at the Consumer Staples sector or XLP ETF, the price is at an all-time high, currently around 82.50. We can expect the price to keep rising and possibly make new highs. However, keep an eye out for the price dropping below 80, as that could signal a reversal or correction.
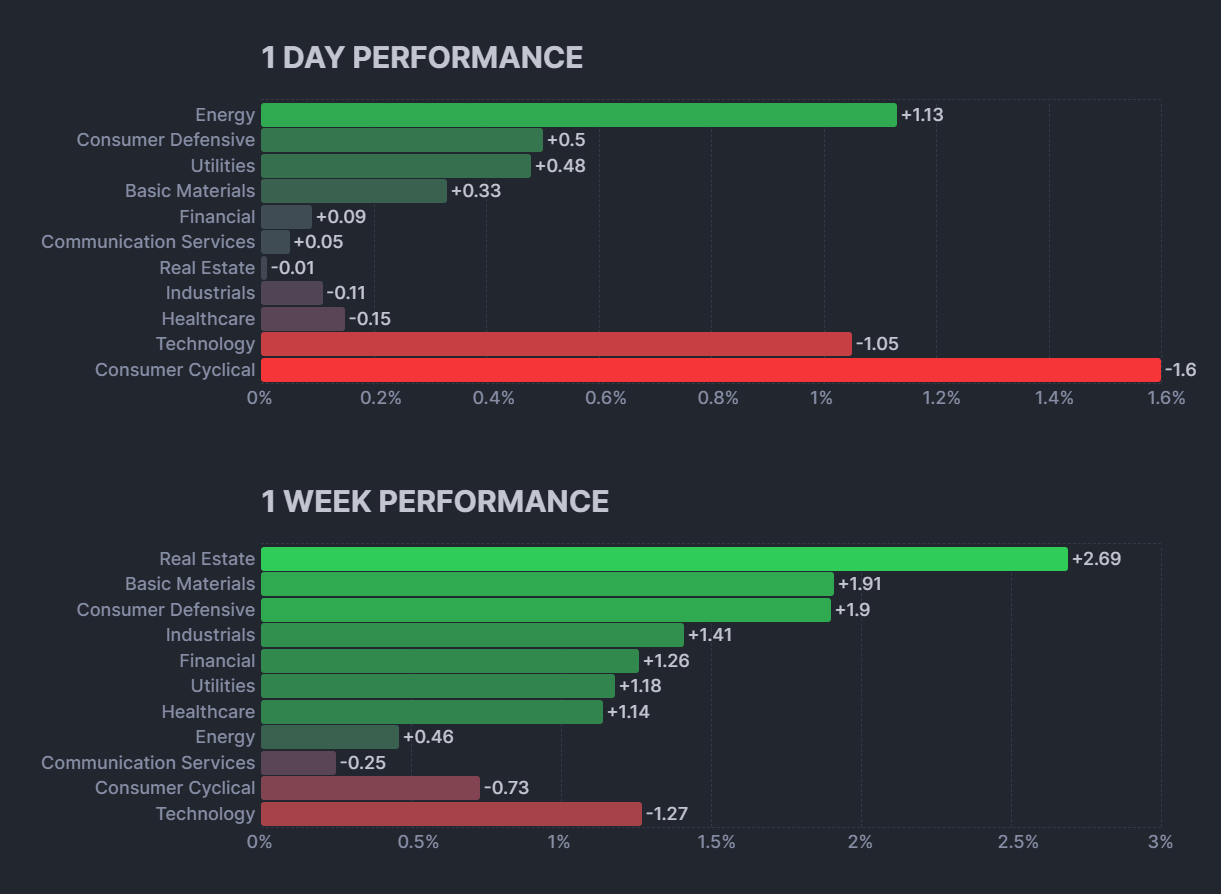
Energy Sector(XLE):
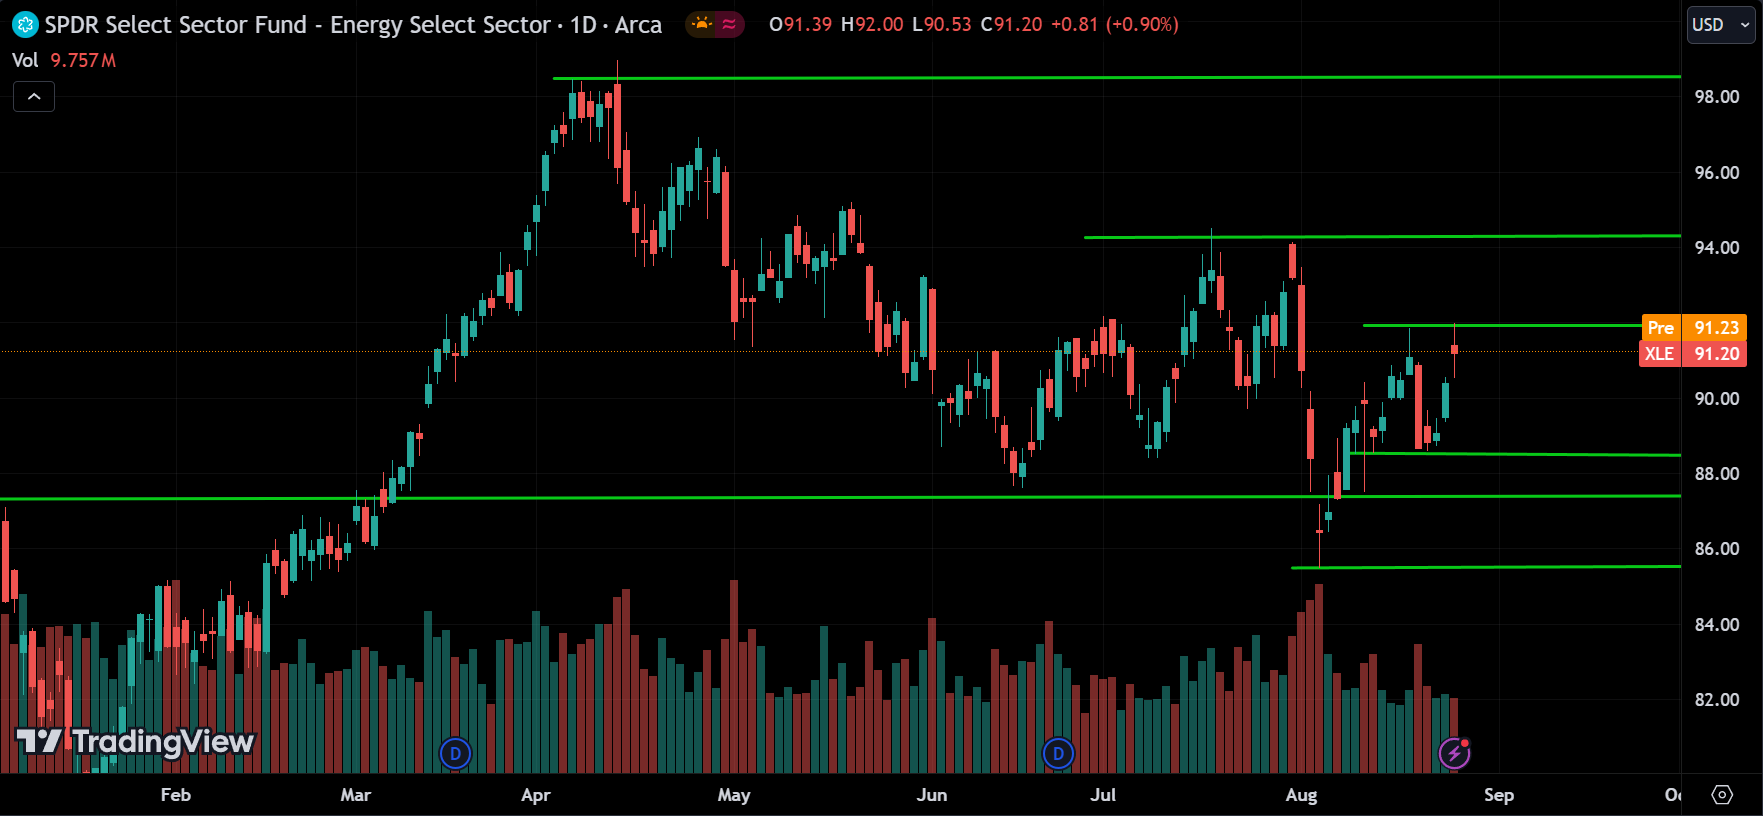
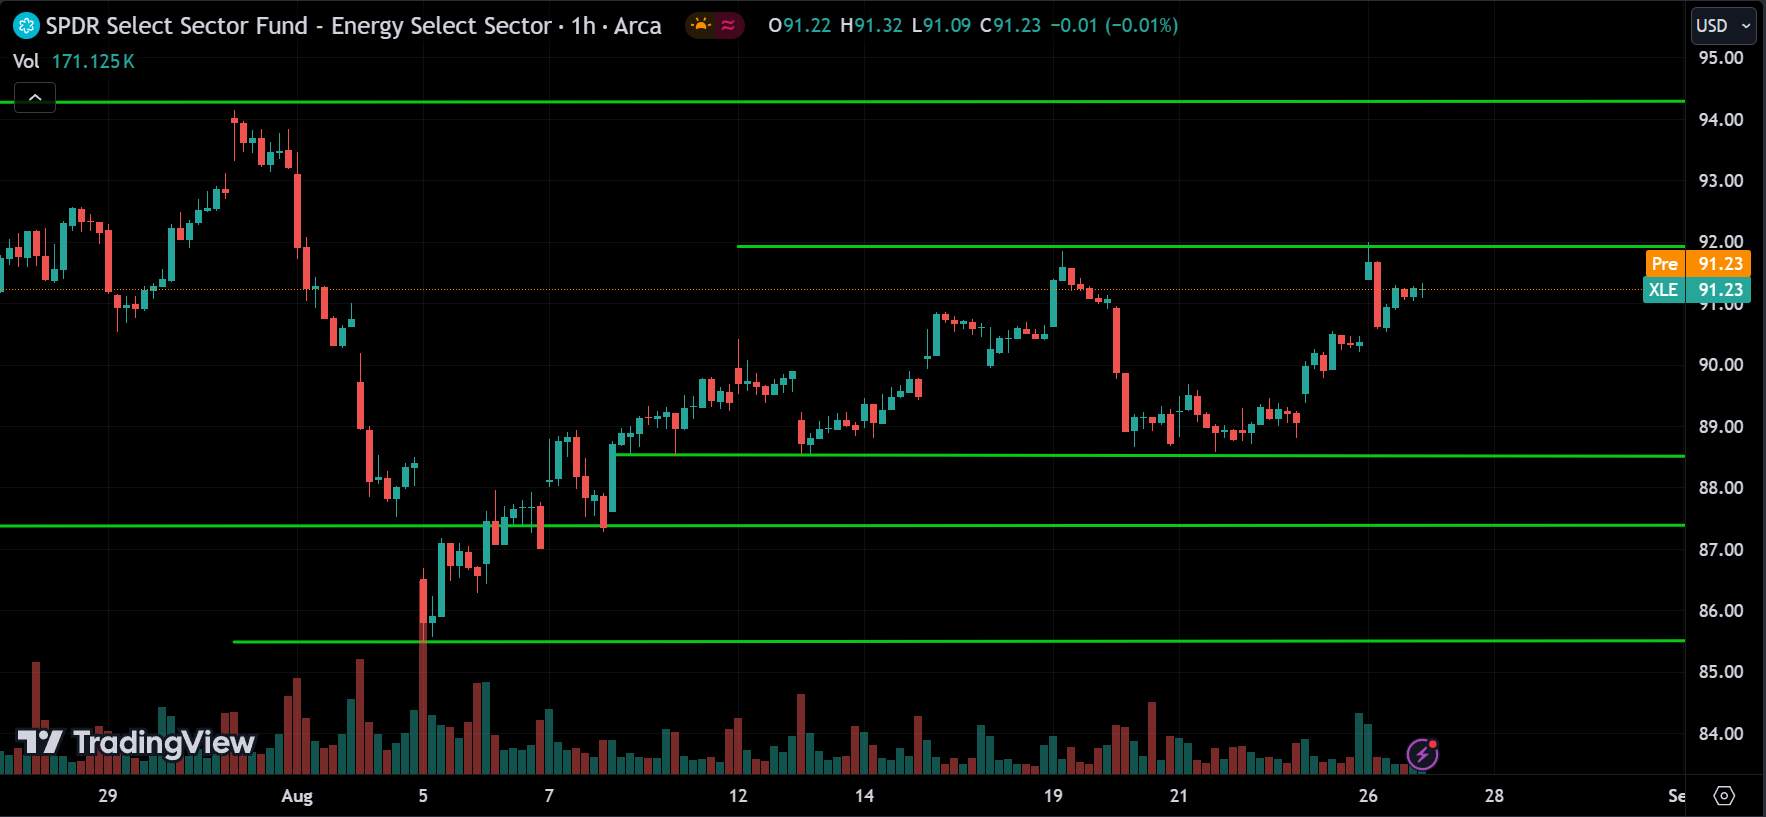
The Energy sector, or XLE ETF, is currently consolidating. After hitting the 86 support level, the price bounced back up and is now at a resistance level of 92. Since the overall market is trending up, we can expect the price to break above this resistance and continue rising toward 94. However, we might also see a pullback around the 92 level, similar to the previous drop to 89.
Materials Sector(XLB):
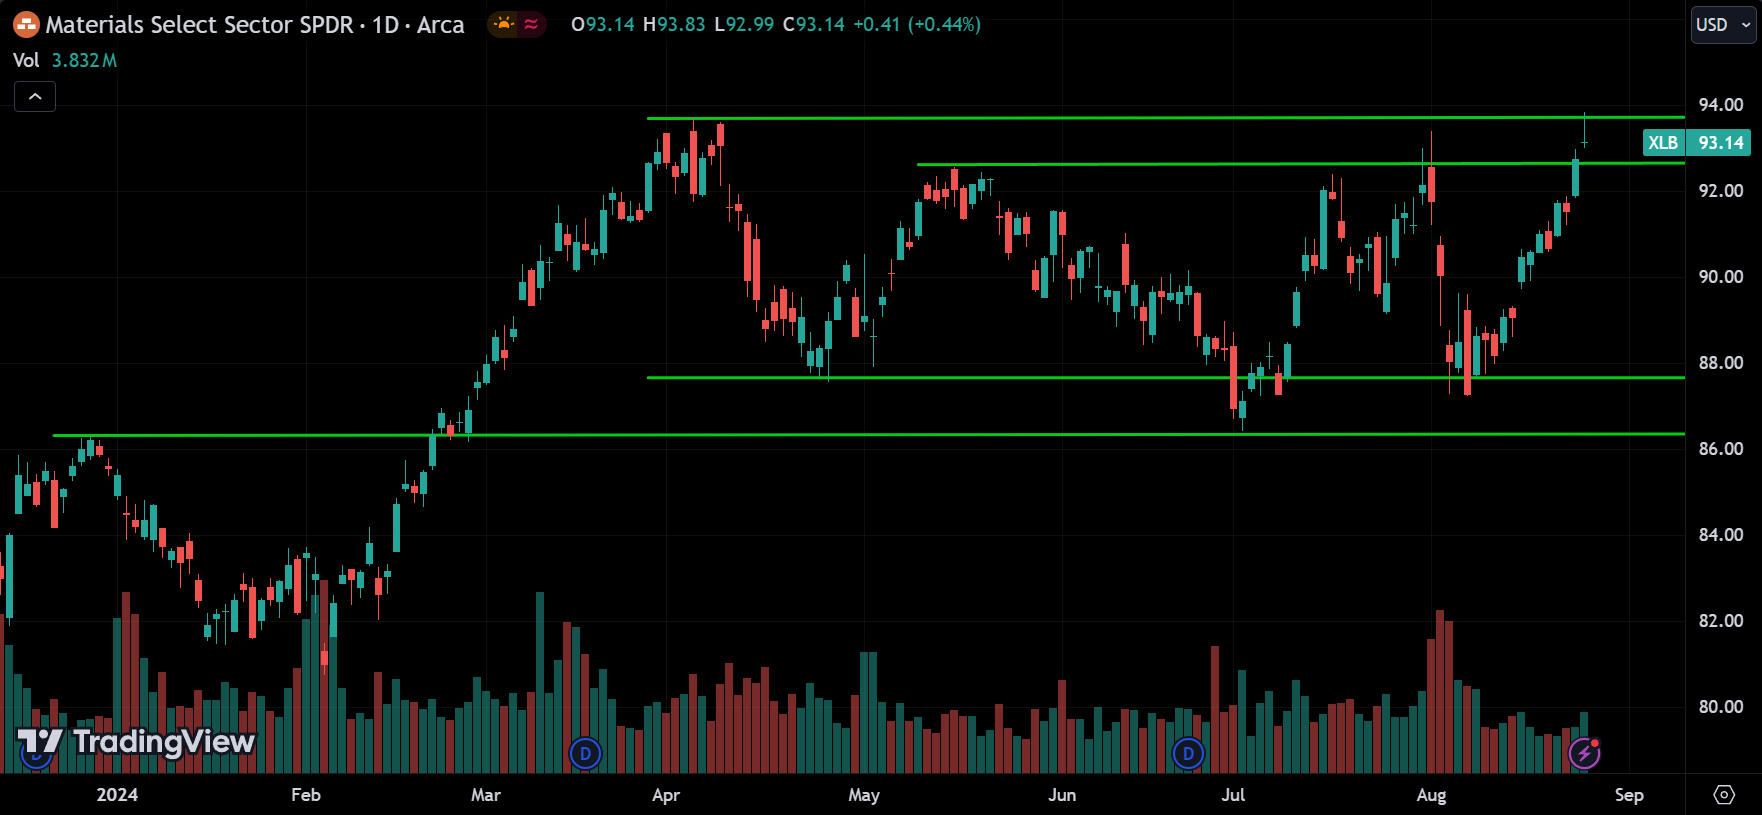
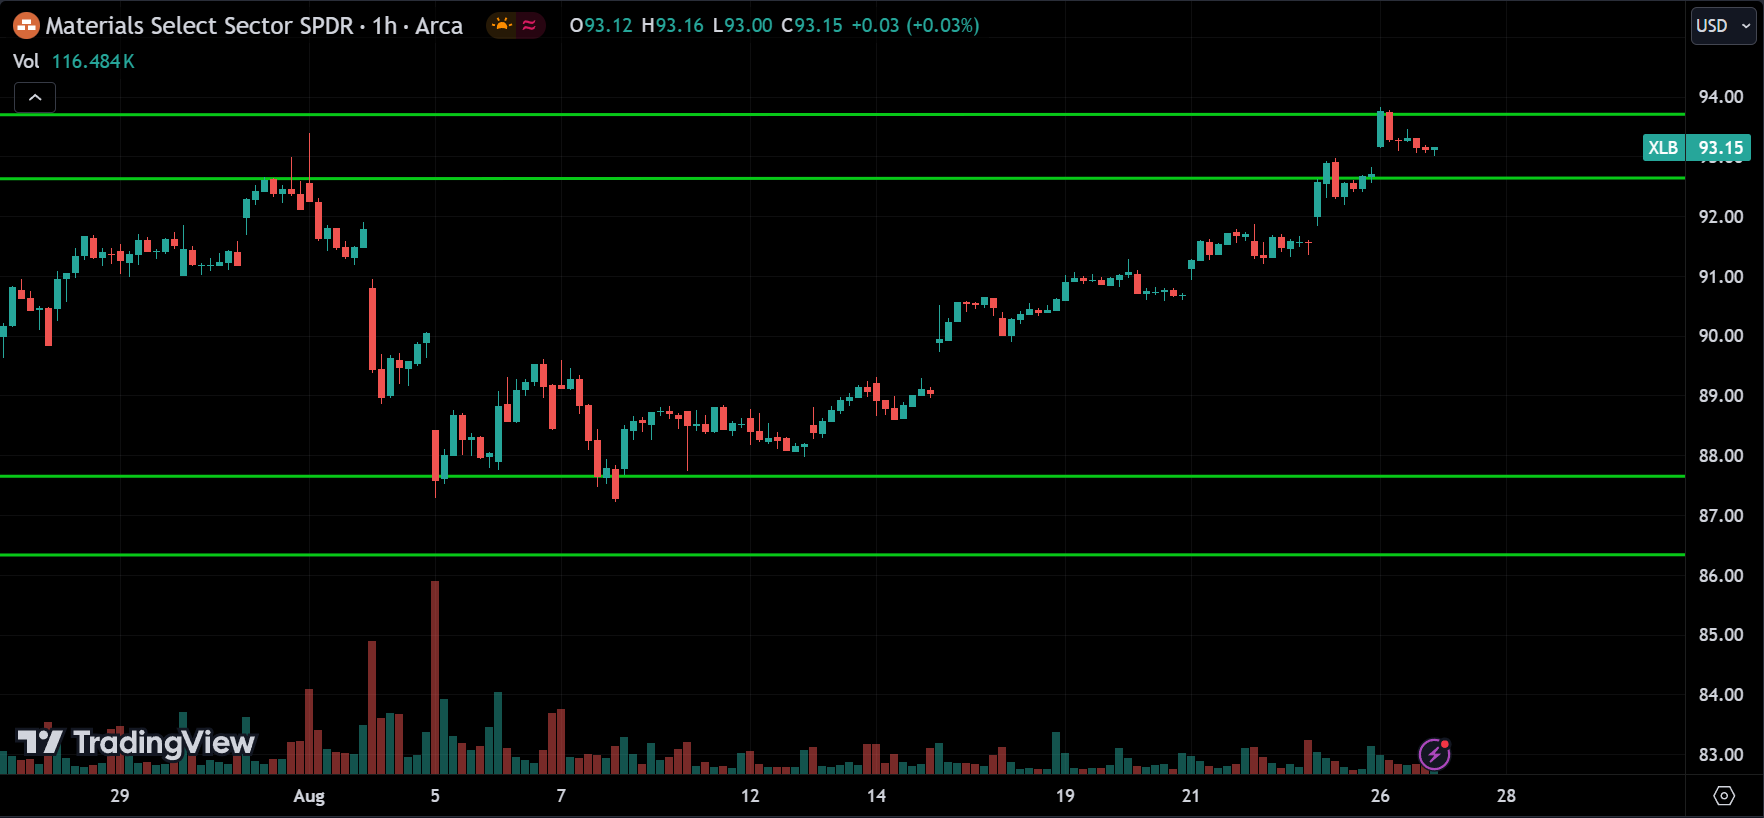
The Materials sector, or XLB ETF, is moving sideways, but it’s trending up in the medium term. Right now, the price is at a major resistance level of 94. Since the overall market is bullish, we can expect the price to break above this resistance and continue rising. However, be prepared for corrections, as the price might pull back from this resistance and head toward the 88 level.
Industrial Sector(XLI):
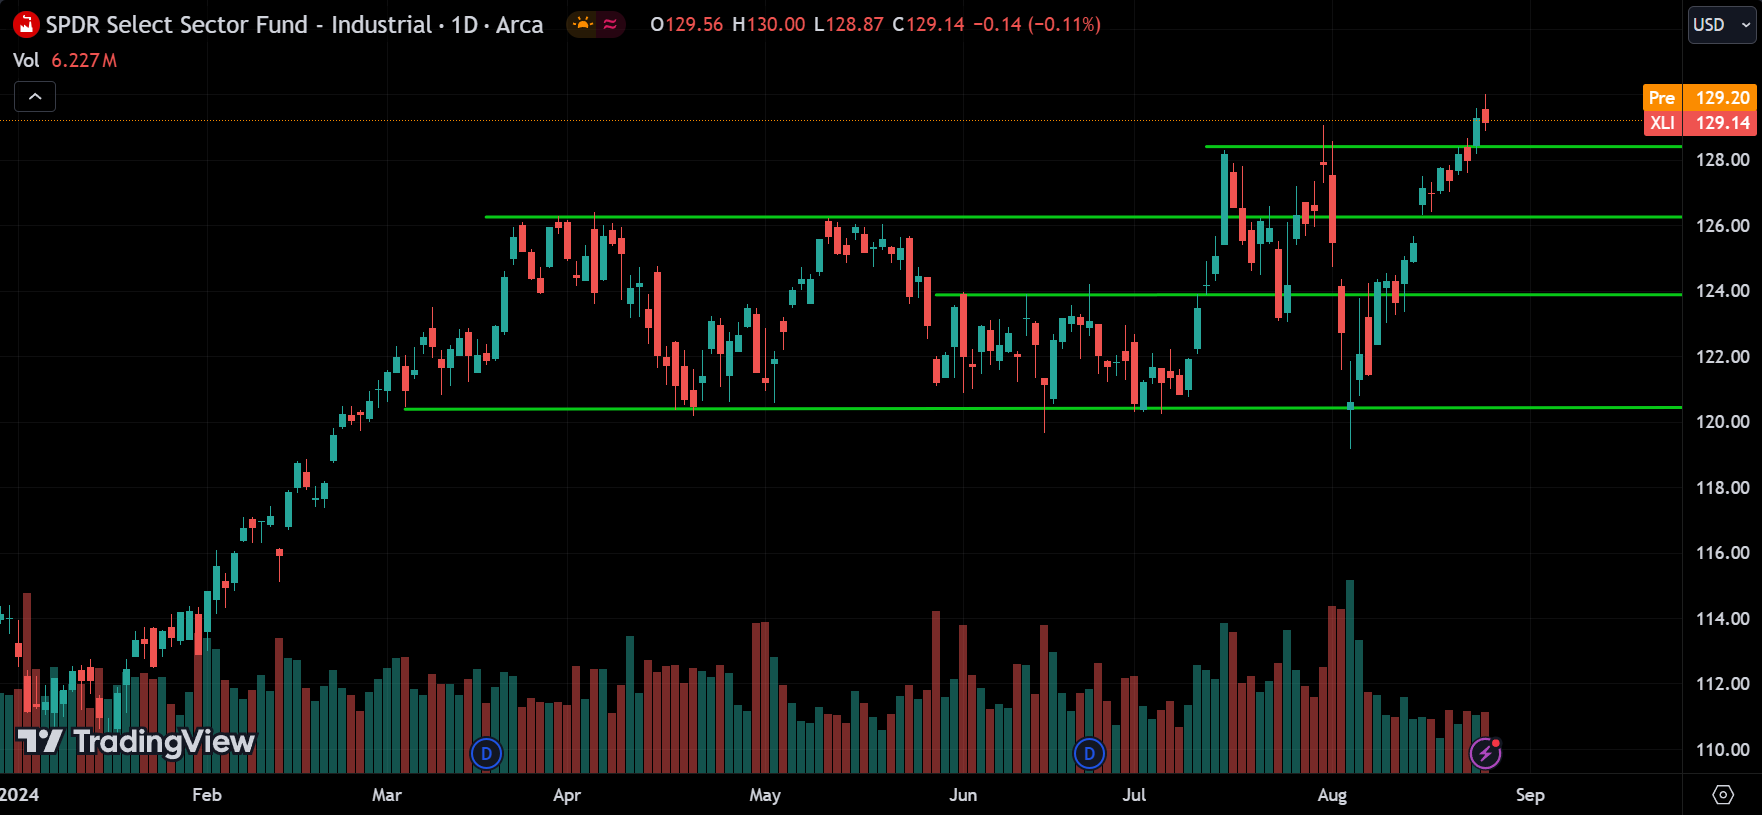
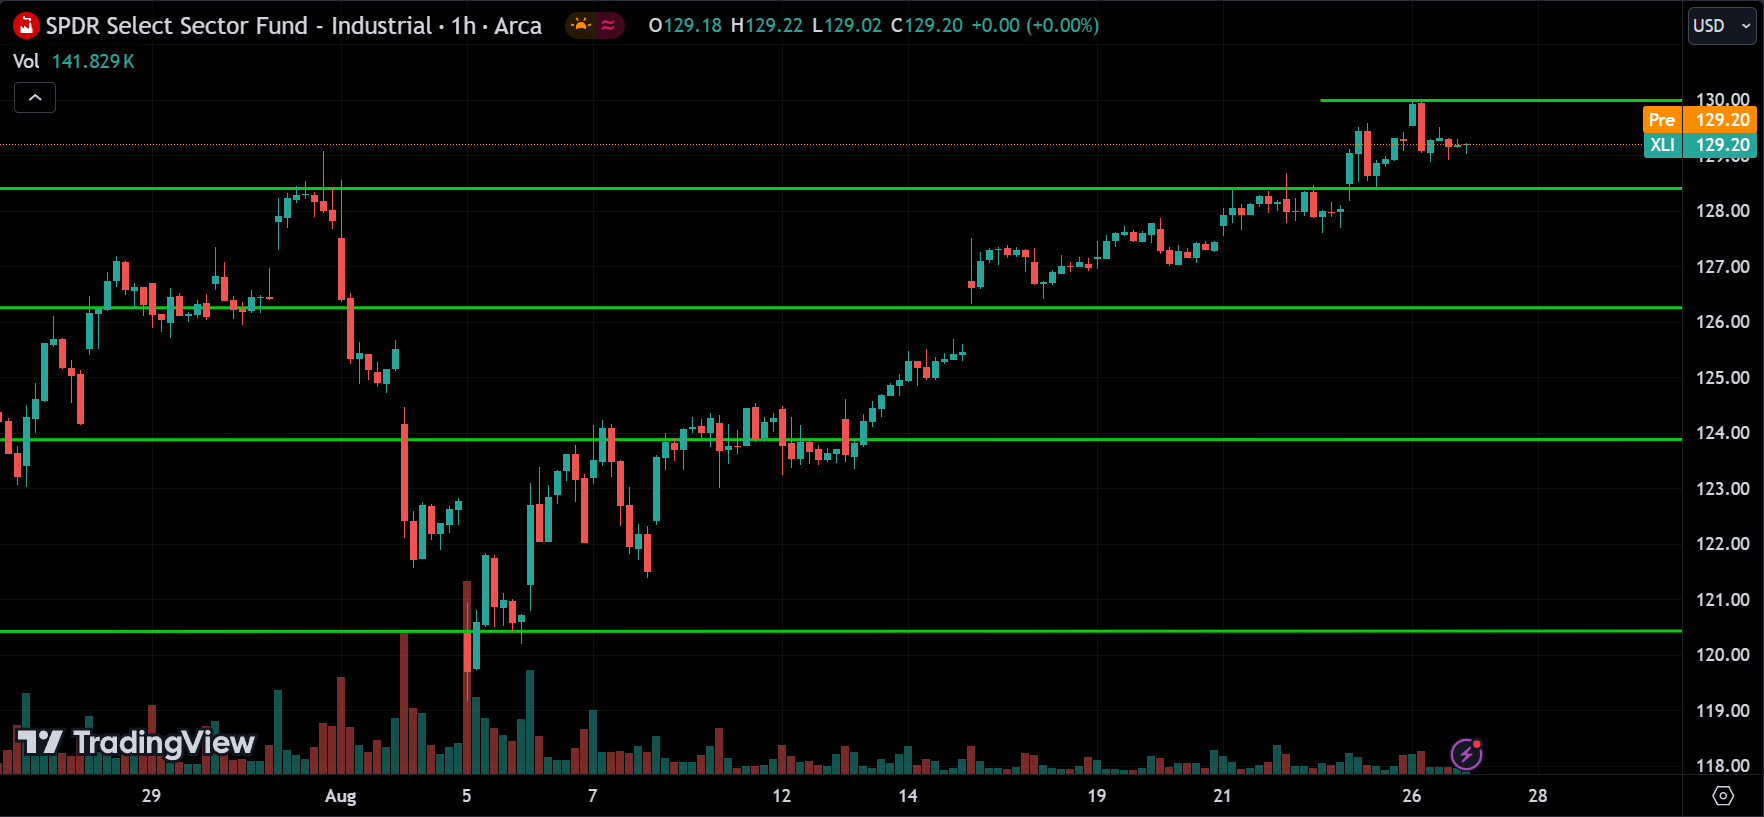
Looking at the Industrials sector, or XLI ETF, after a period of consolidation, the price broke above the 128 resistance level. Now, the price is at the 130 resistance level. Given the recent breakout and the overall bullish market sentiment, we can expect the price to break above 130 and continue rising. However, keep an eye out for the price dropping below 128 again, as this could signal the start of a correction phase.
Consumer Discretionary Sector(XLY):
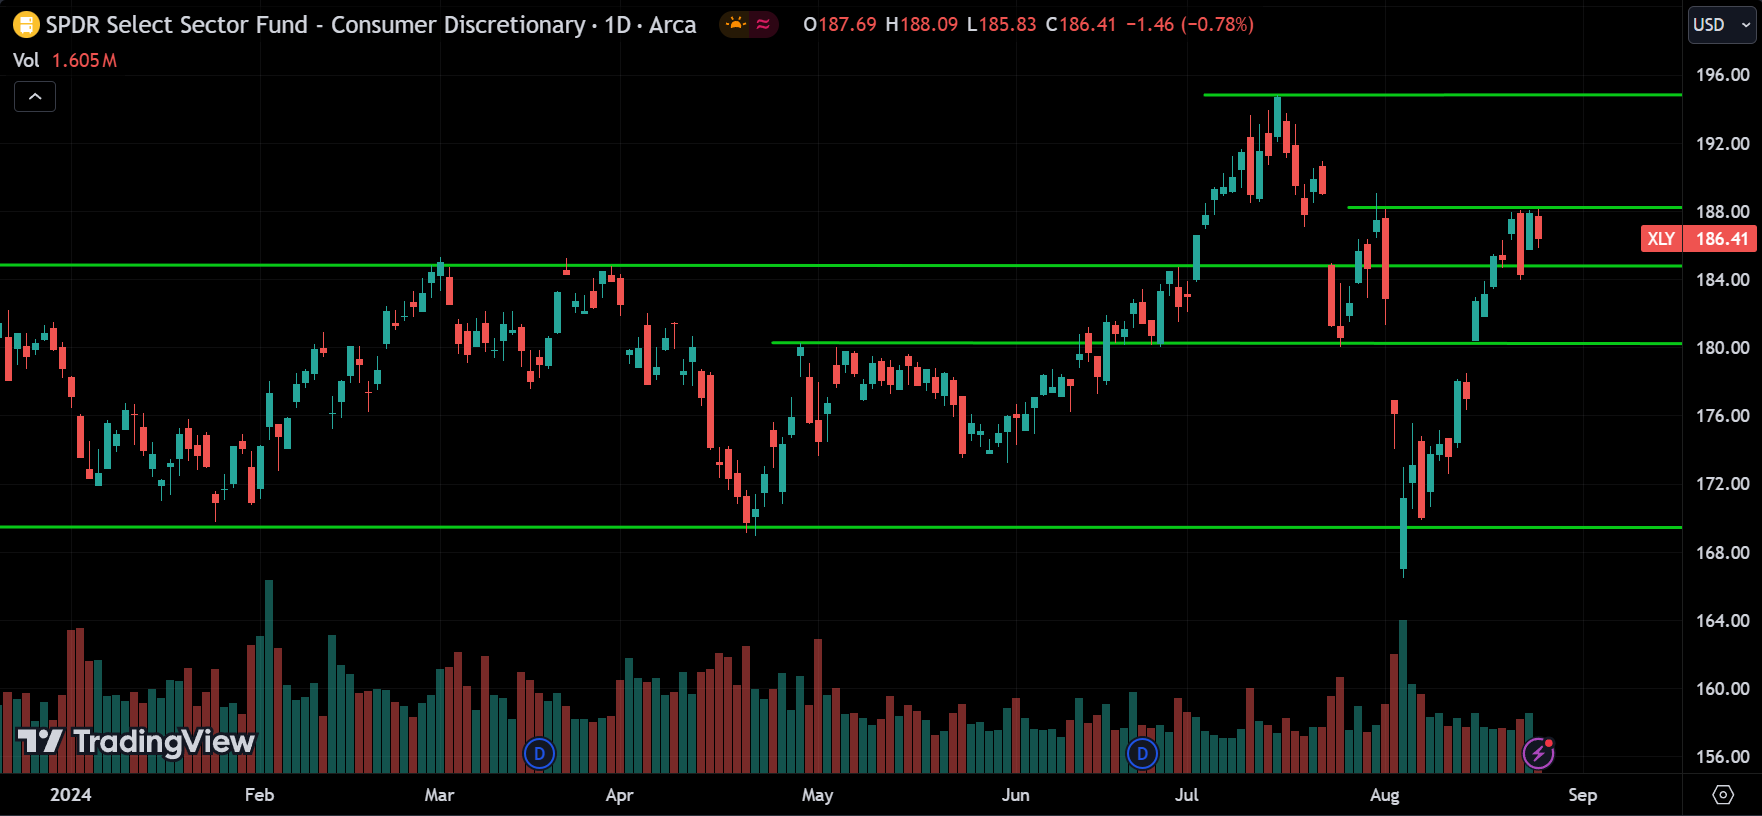
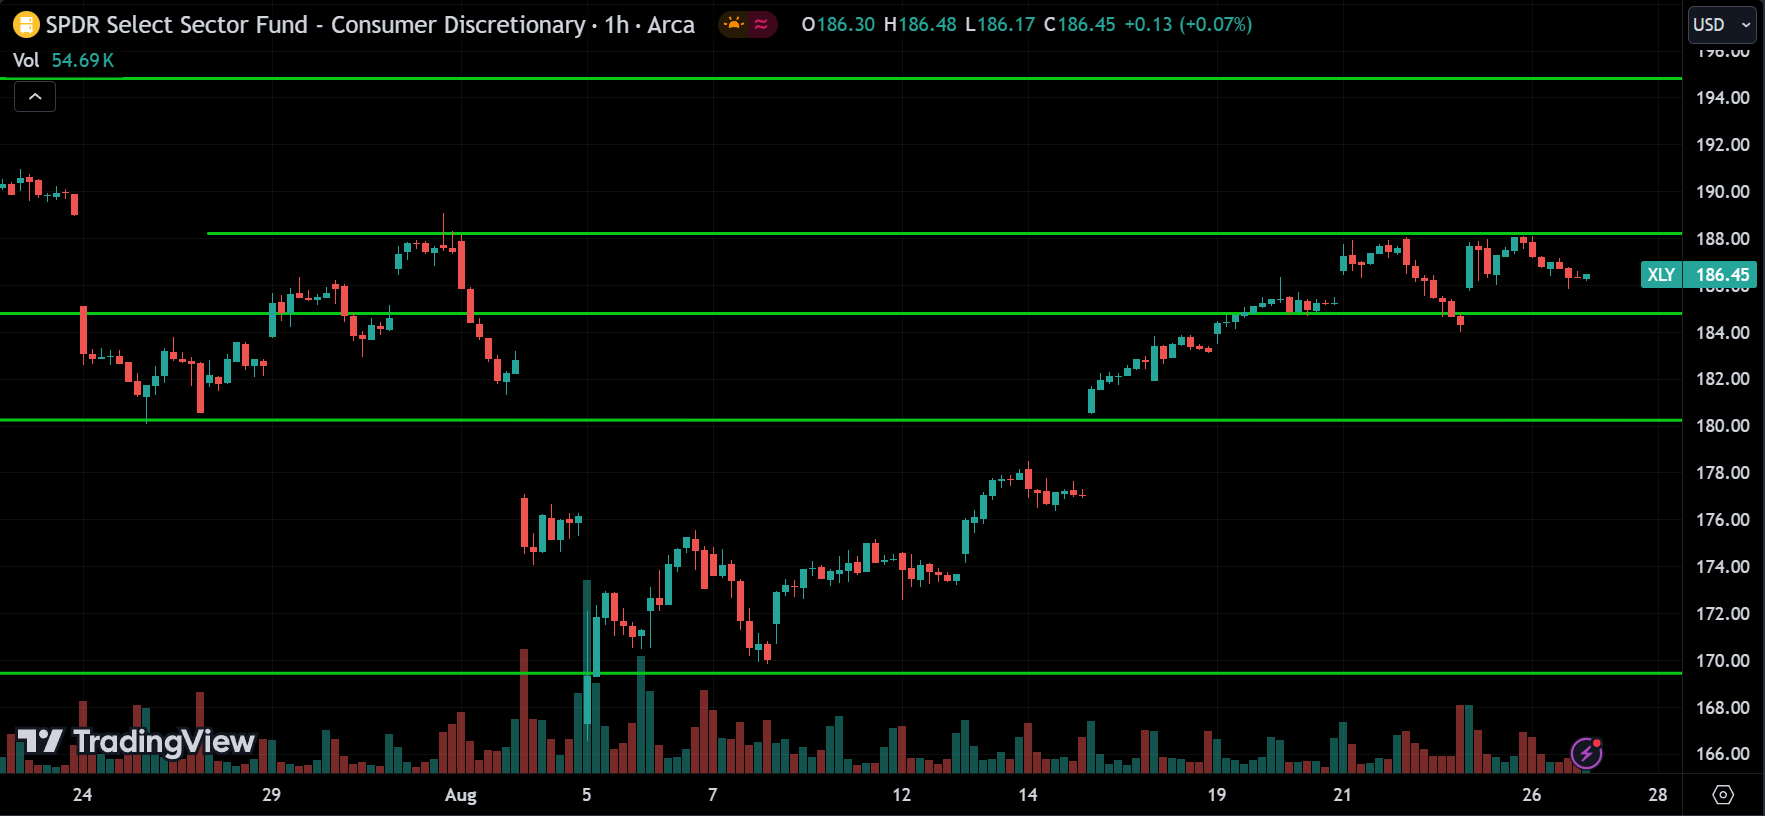
The Consumer Discretionary sector, or XLY ETF, has been consolidating for a while, but in the medium-term, the price is trending upward. It’s currently at the 188 resistance level. If the price breaks above this level, we can expect it to continue toward the major resistance at 195. On the other hand, if the price breaks below the 184 support level, it could drop to 180. So, watch out for breakouts.
Healthcare Sector(XLV):
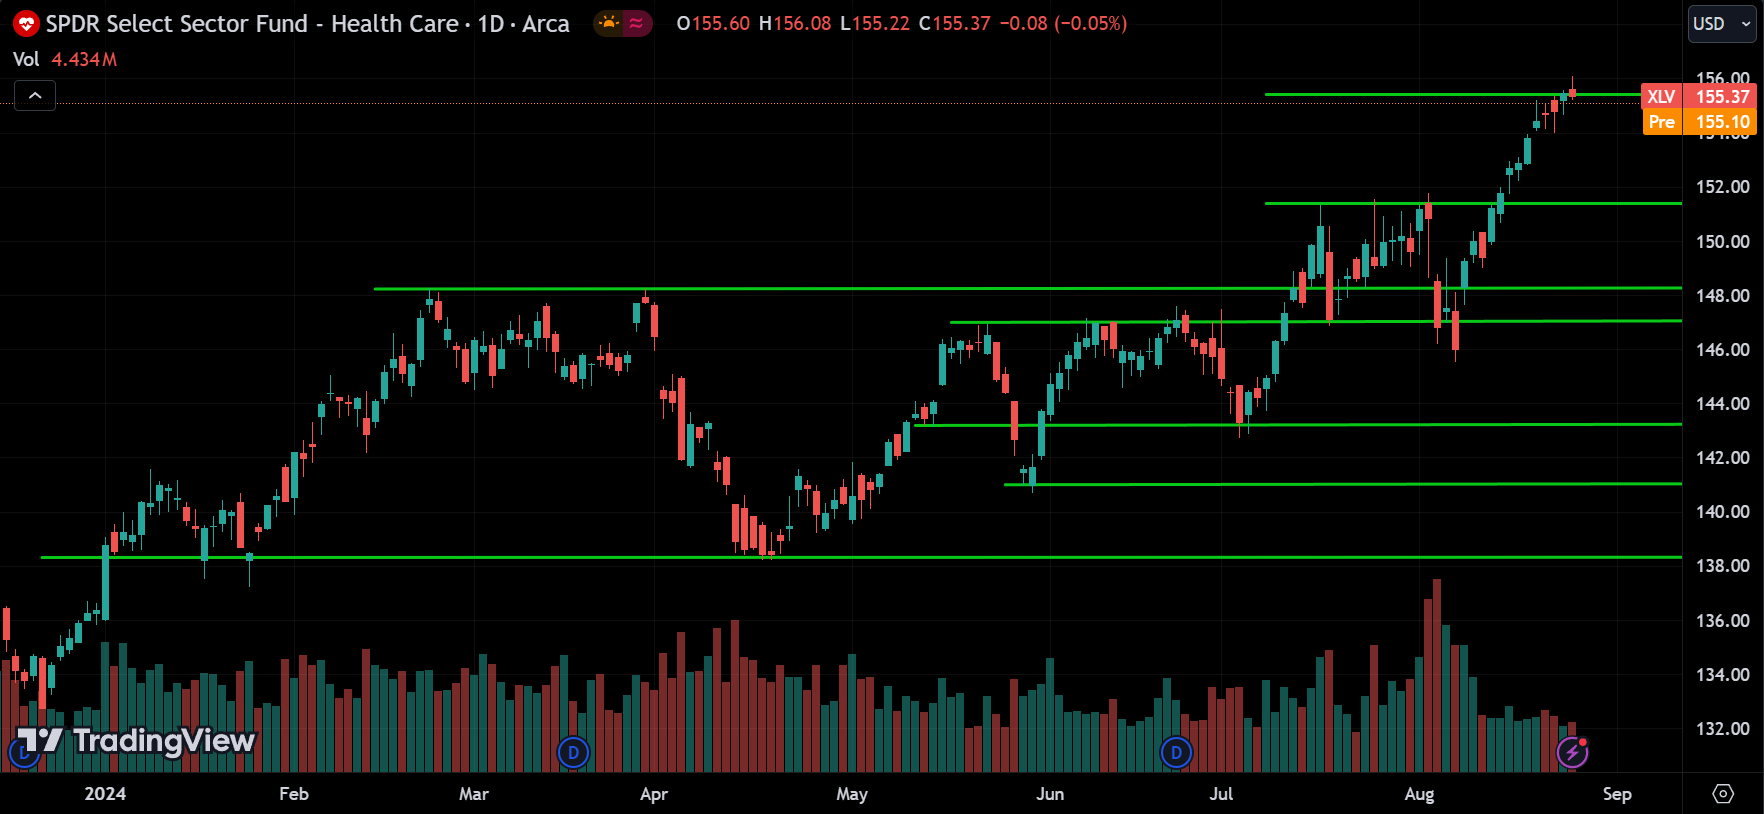
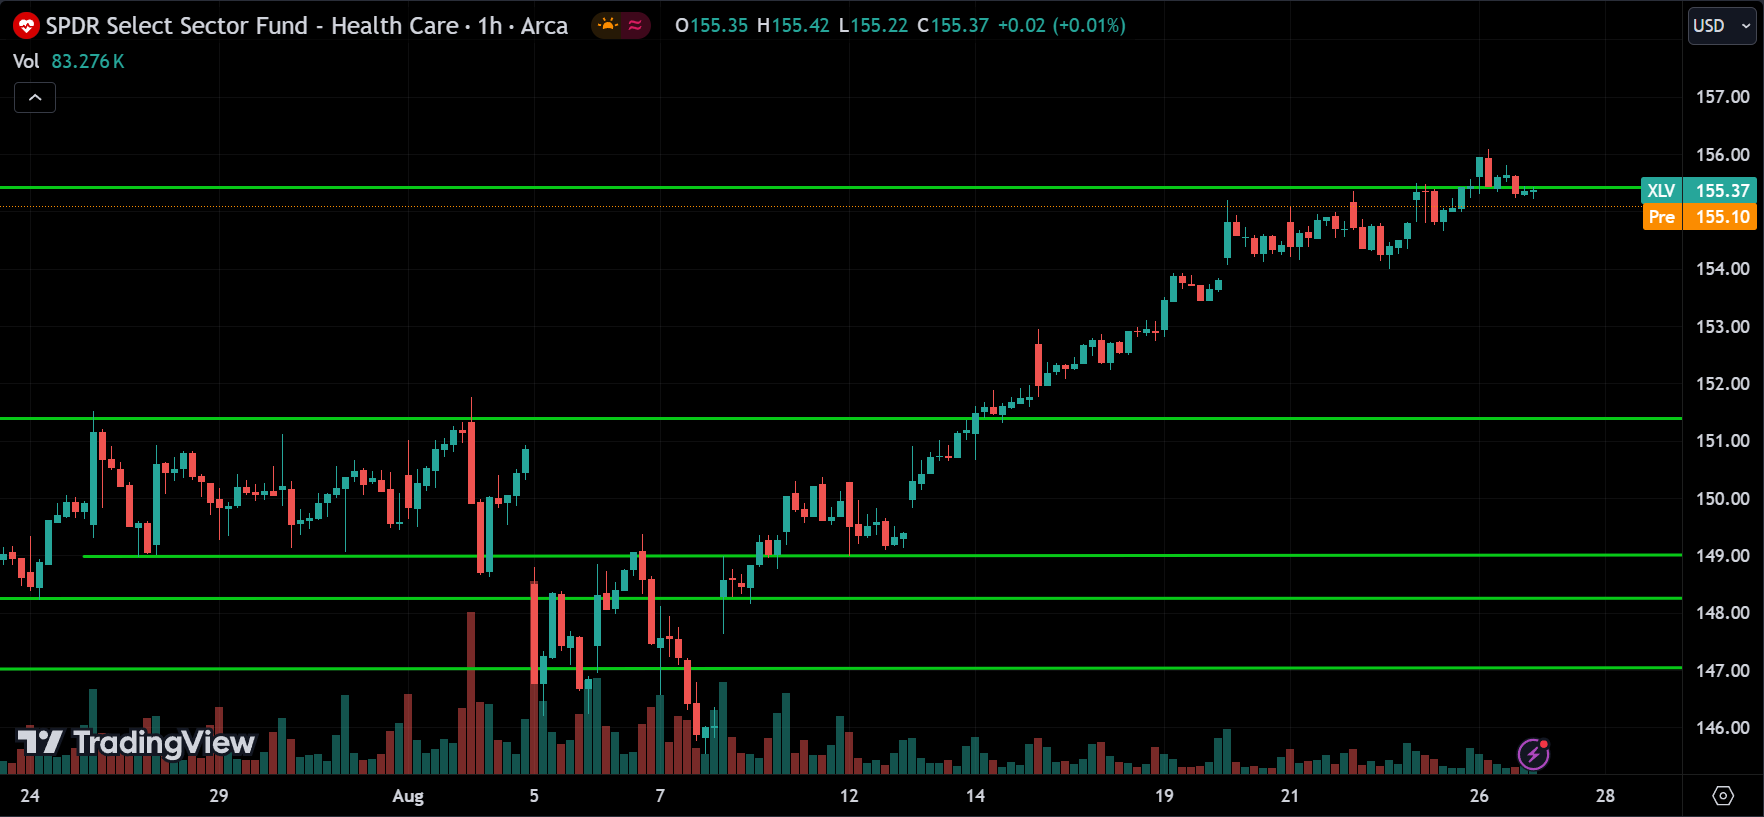
The Healthcare sector, or XLV ETF, is trending up, and the price is at 156. We can expect this upward momentum to continue, but be cautious if the price drops below 154, as that could signal a correction phase.
Financials Sector(XLF):

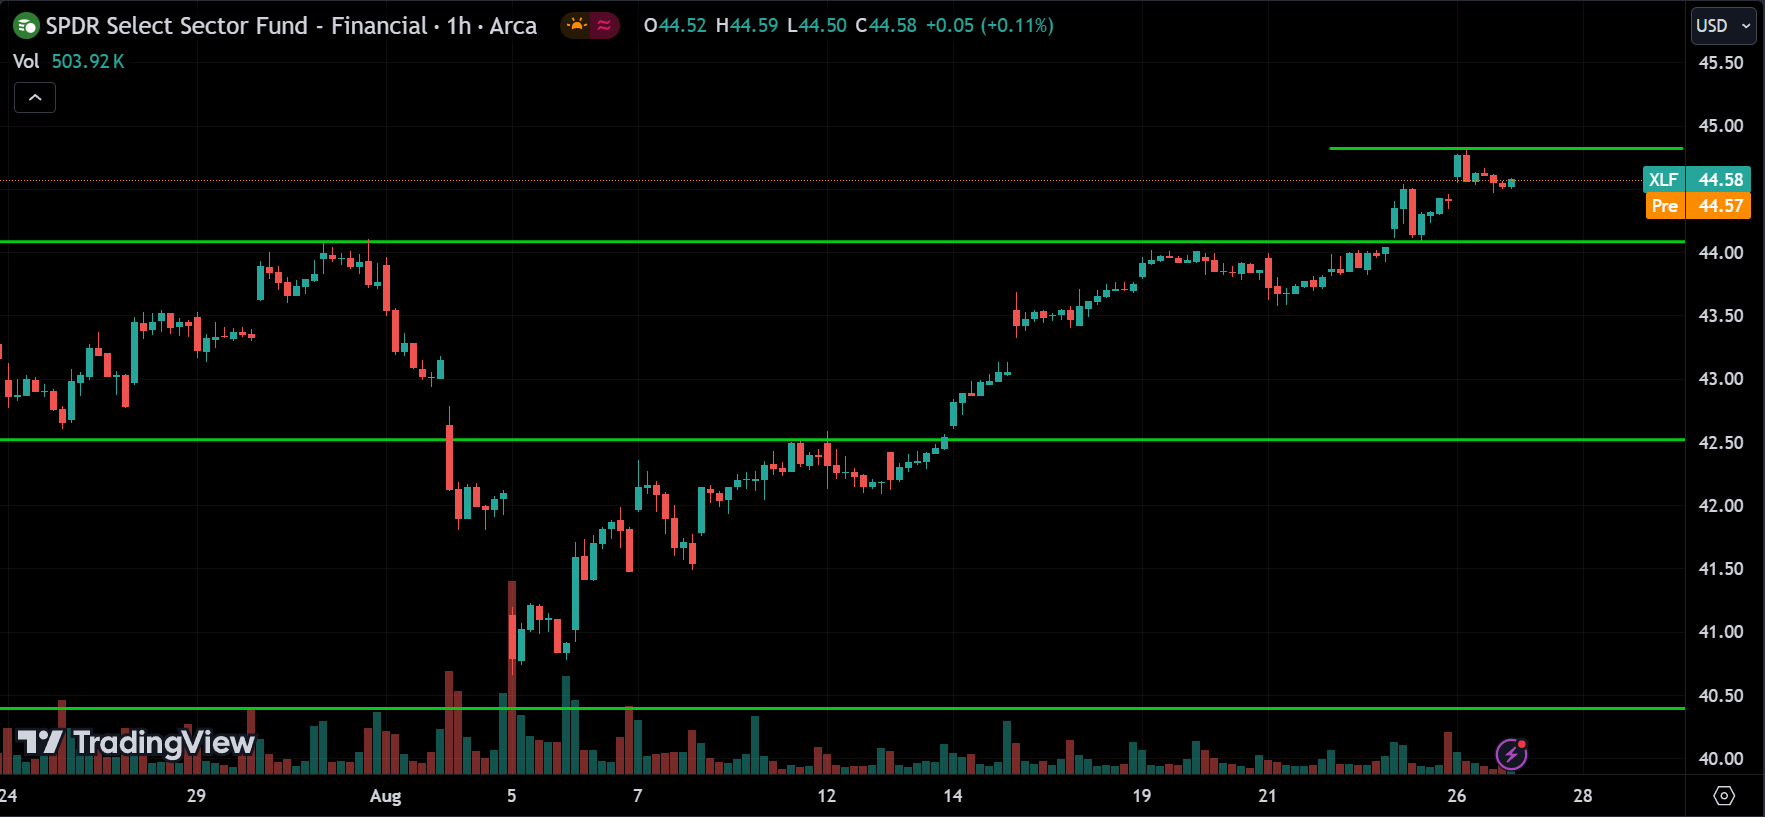
The Financial sector, or XLF ETF, is trending up. It recently broke above the previous resistance of 44 and is now at 45. We might see a pullback to 44 before it continues upward, or it could break above 45 and keep rising without a pullback. However, if the price drops below 44, it could signal a correction phase.
Technology Sector(XLK):
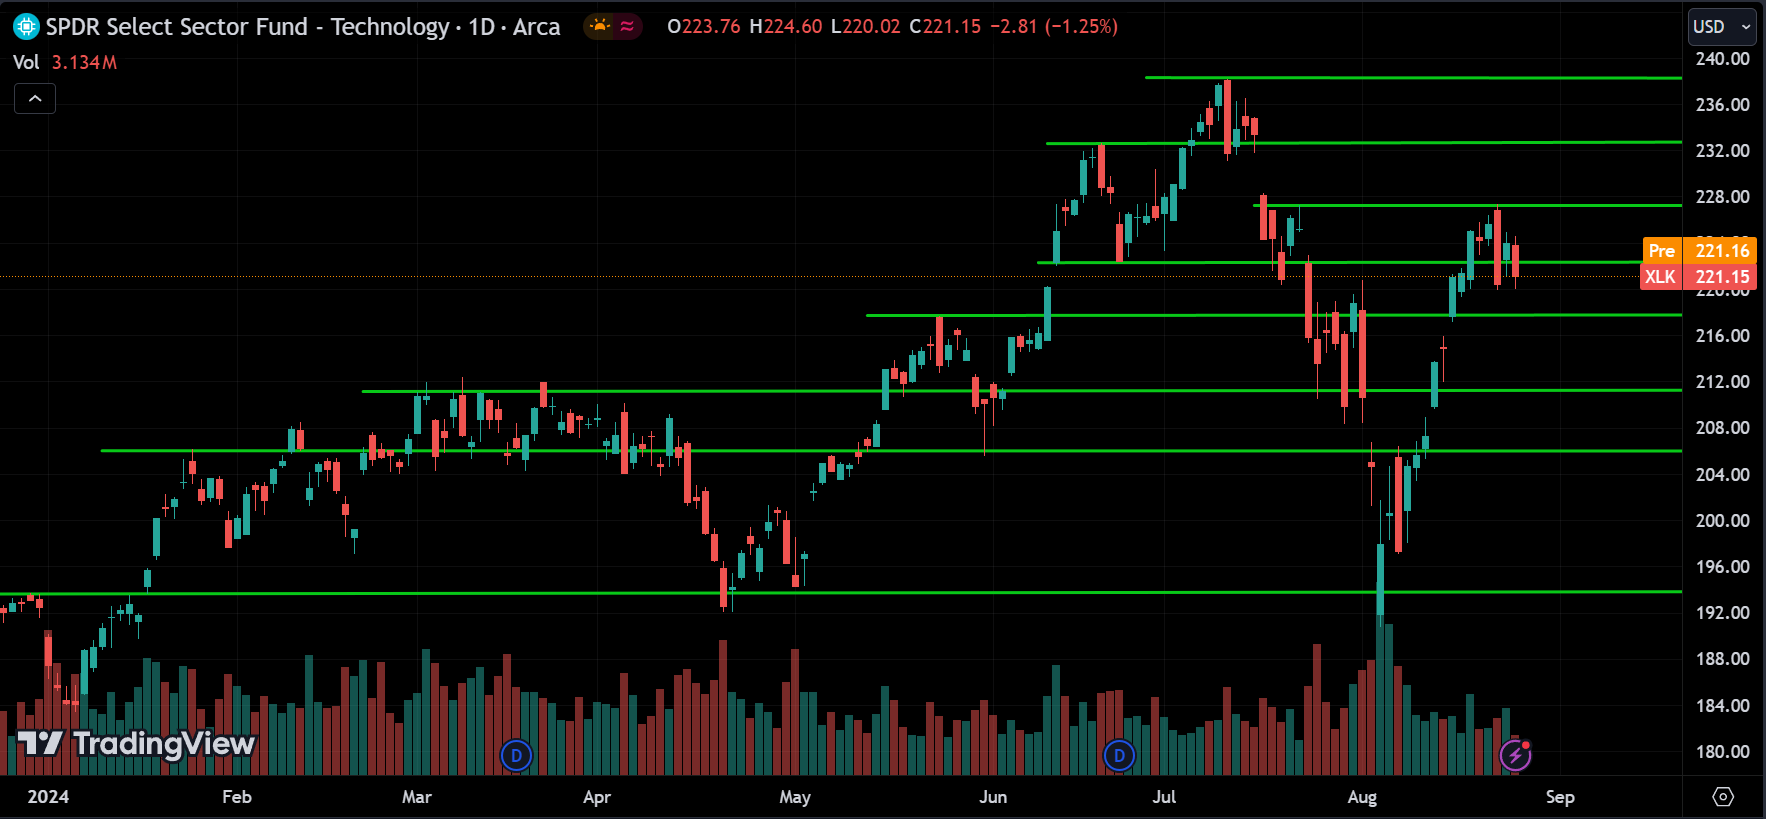
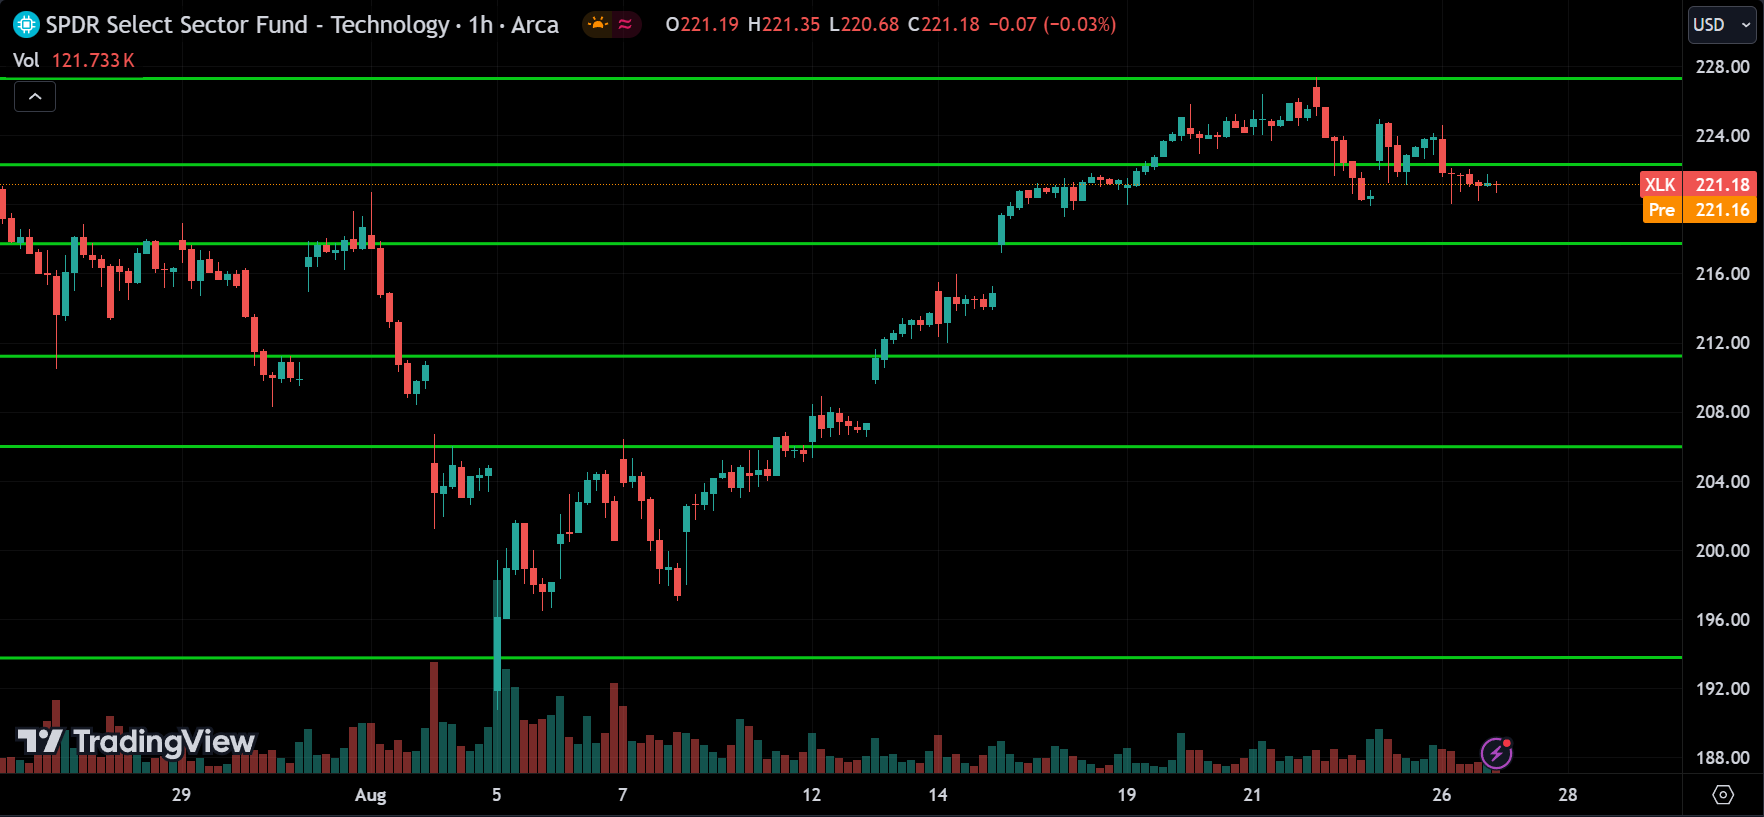
The Technology sector, or XLK ETF, started trending up after a correction. The price is currently at the 228 resistance level and is pulling back. However, since the overall market is bullish, we can expect the price to break above this level and continue rising. The tech sector should follow overall trend. But keep an eye on the price breaking below the 216 support level, as it could signal another correction phase.
Communications Sector(XLC):
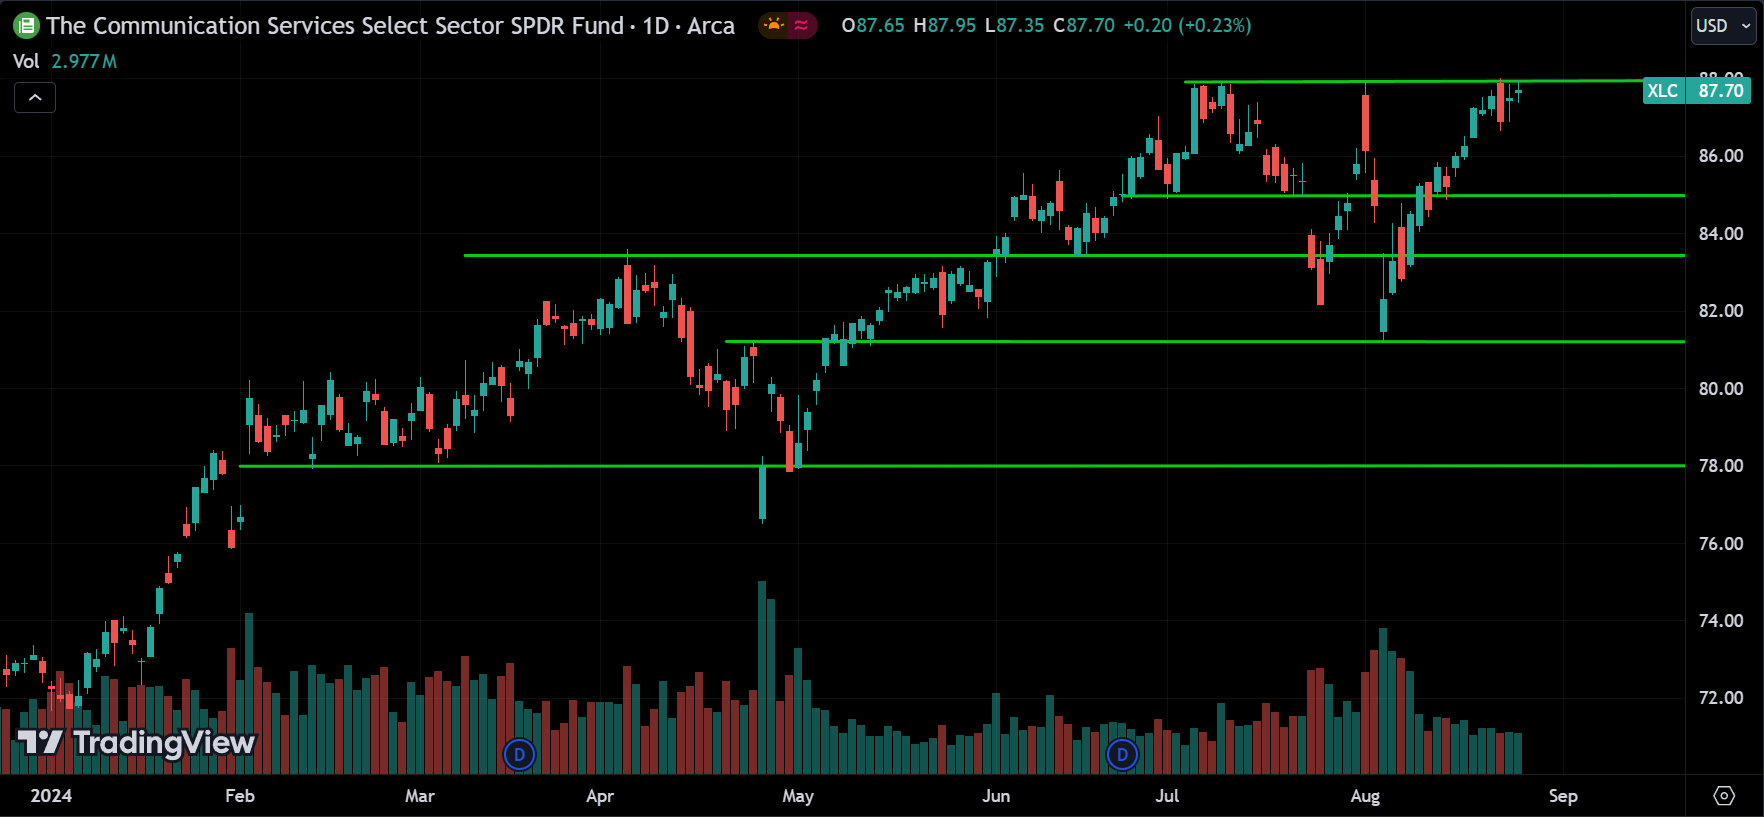
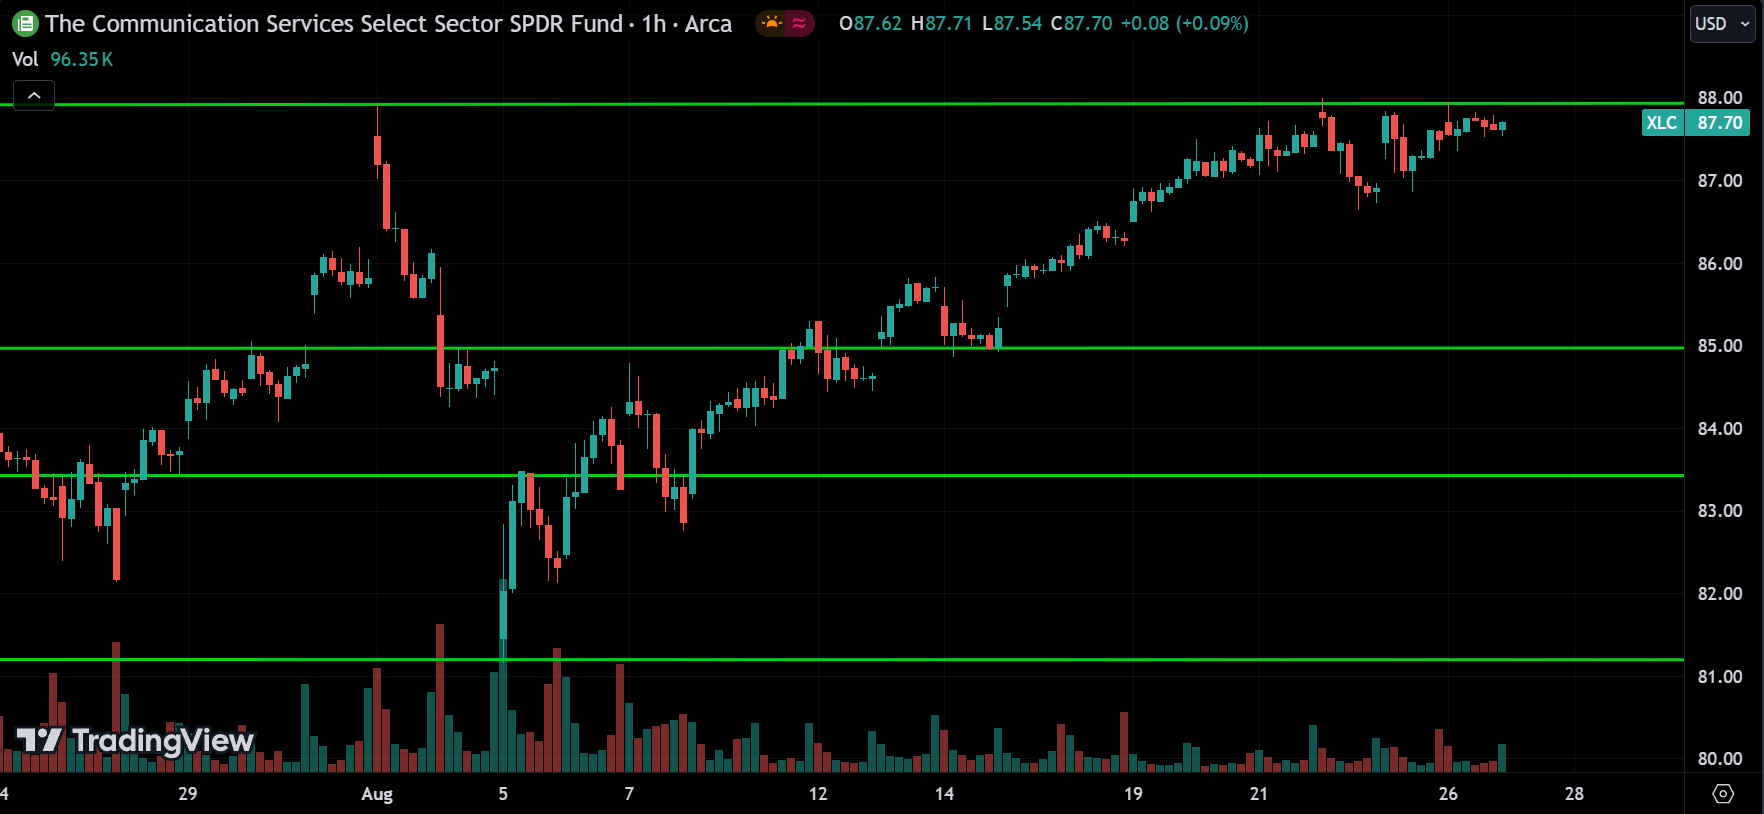
The Communication sector, or XLC ETF, is trending up and is currently at a major resistance level of 88. We can expect the price to break above this resistance and continue rising to new highs. However, if something goes wrong, a pullback could happen. If the price drops below 86.50, it could be a sign that something is off.
Utility Sector(XLU):
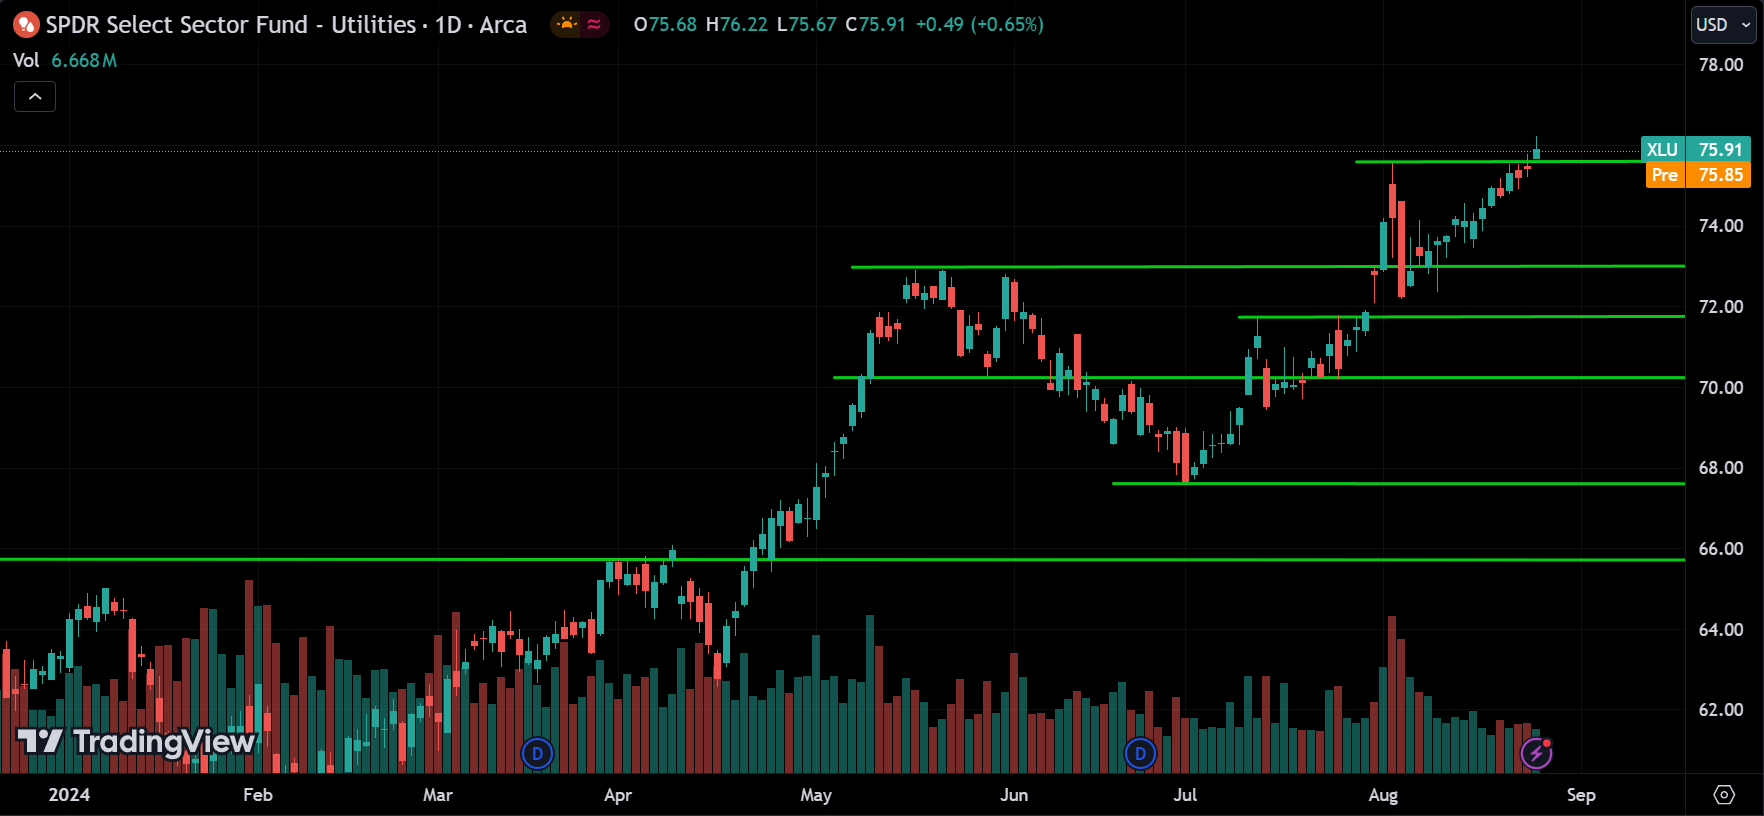
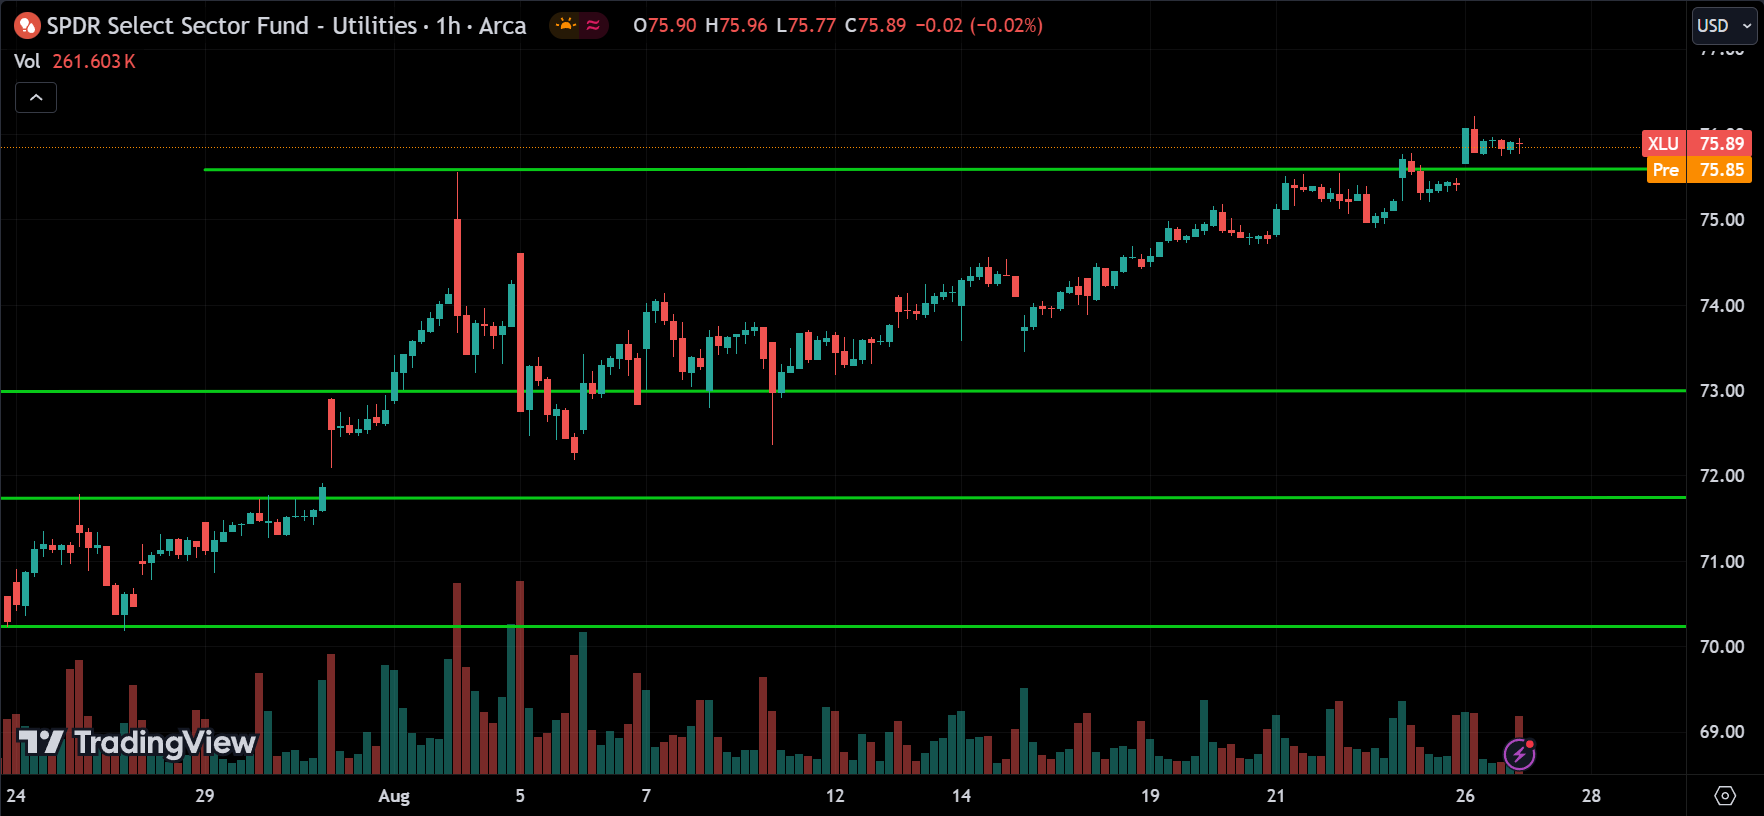
The Utilities sector, or XLU ETF, is trending up and is at above 75.80. We can expect this momentum to continue, but be cautious if the price drops below the 75 range, as that could signal a correction phase.
Real Estate Sector(XLRE):
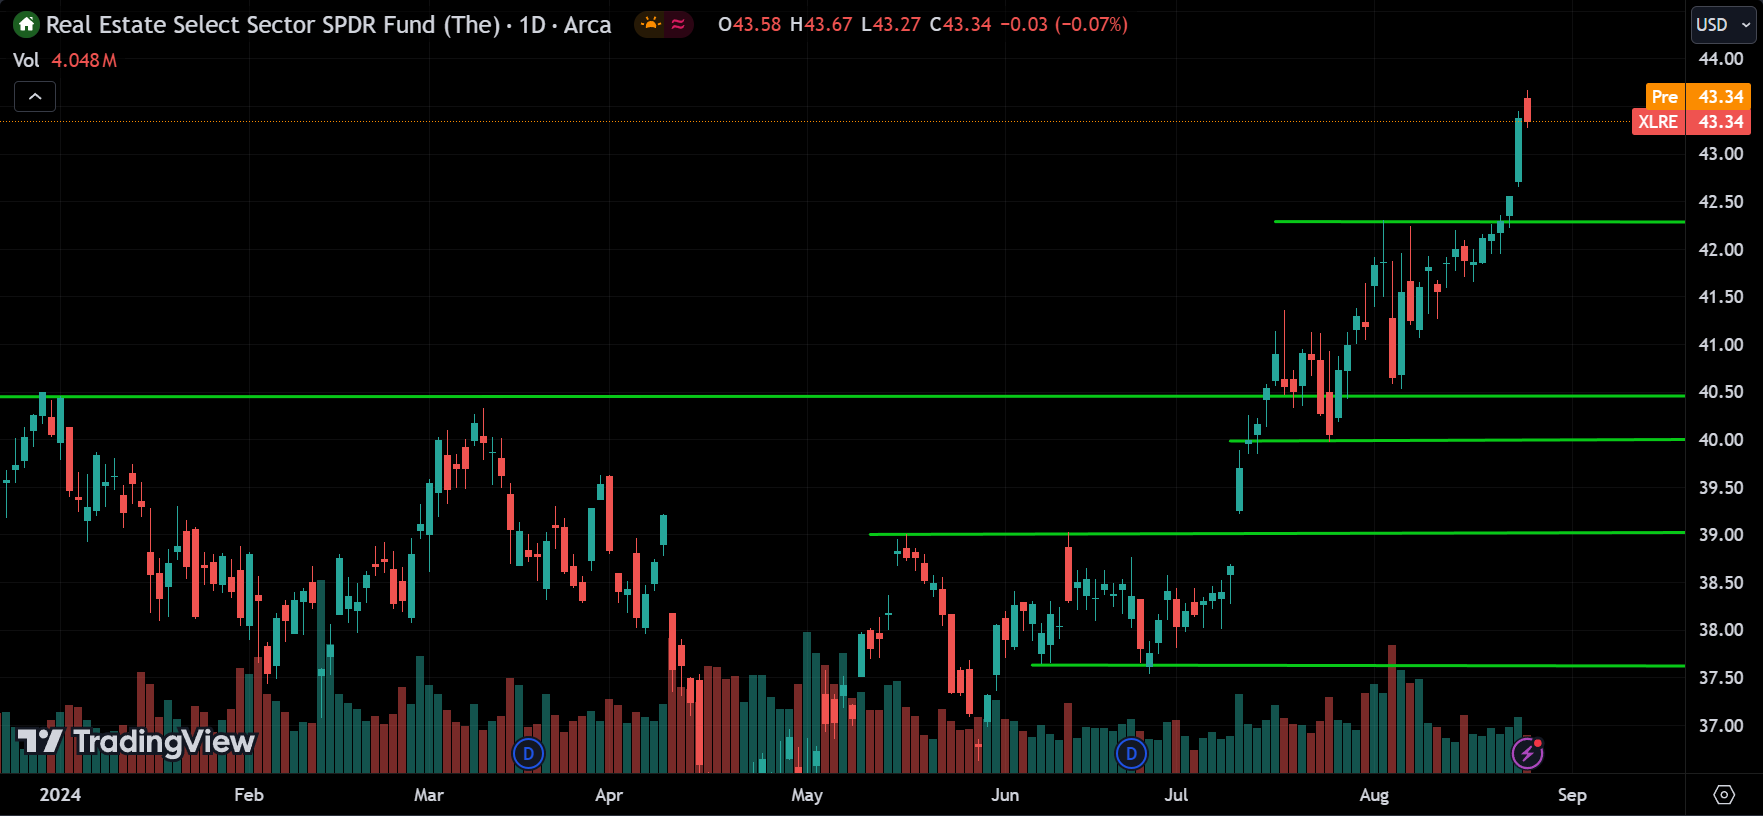
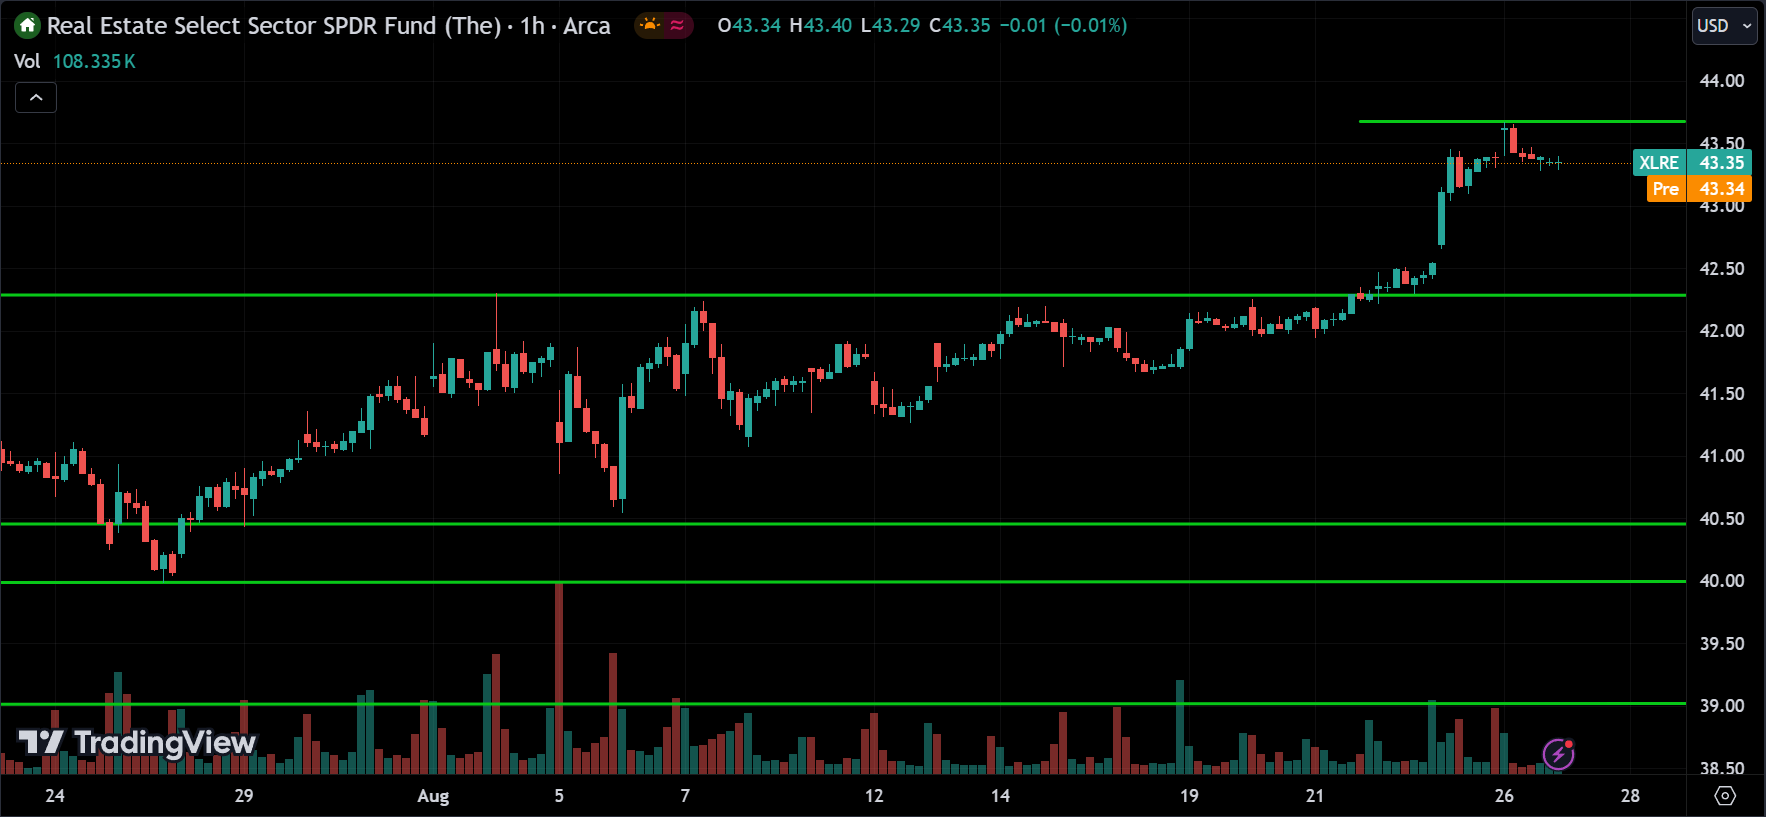
Looking at the Real Estate sector, or XLRE ETF, it’s trending up and is at the resistance level of 43.70. If the price breaks above this level, we can expect it to keep rising. However, if the price starts to drop from this resistance and falls below 42, it could signal the start of a correction phase.
Stocks to Watch Today
Nvidia(NVDA):
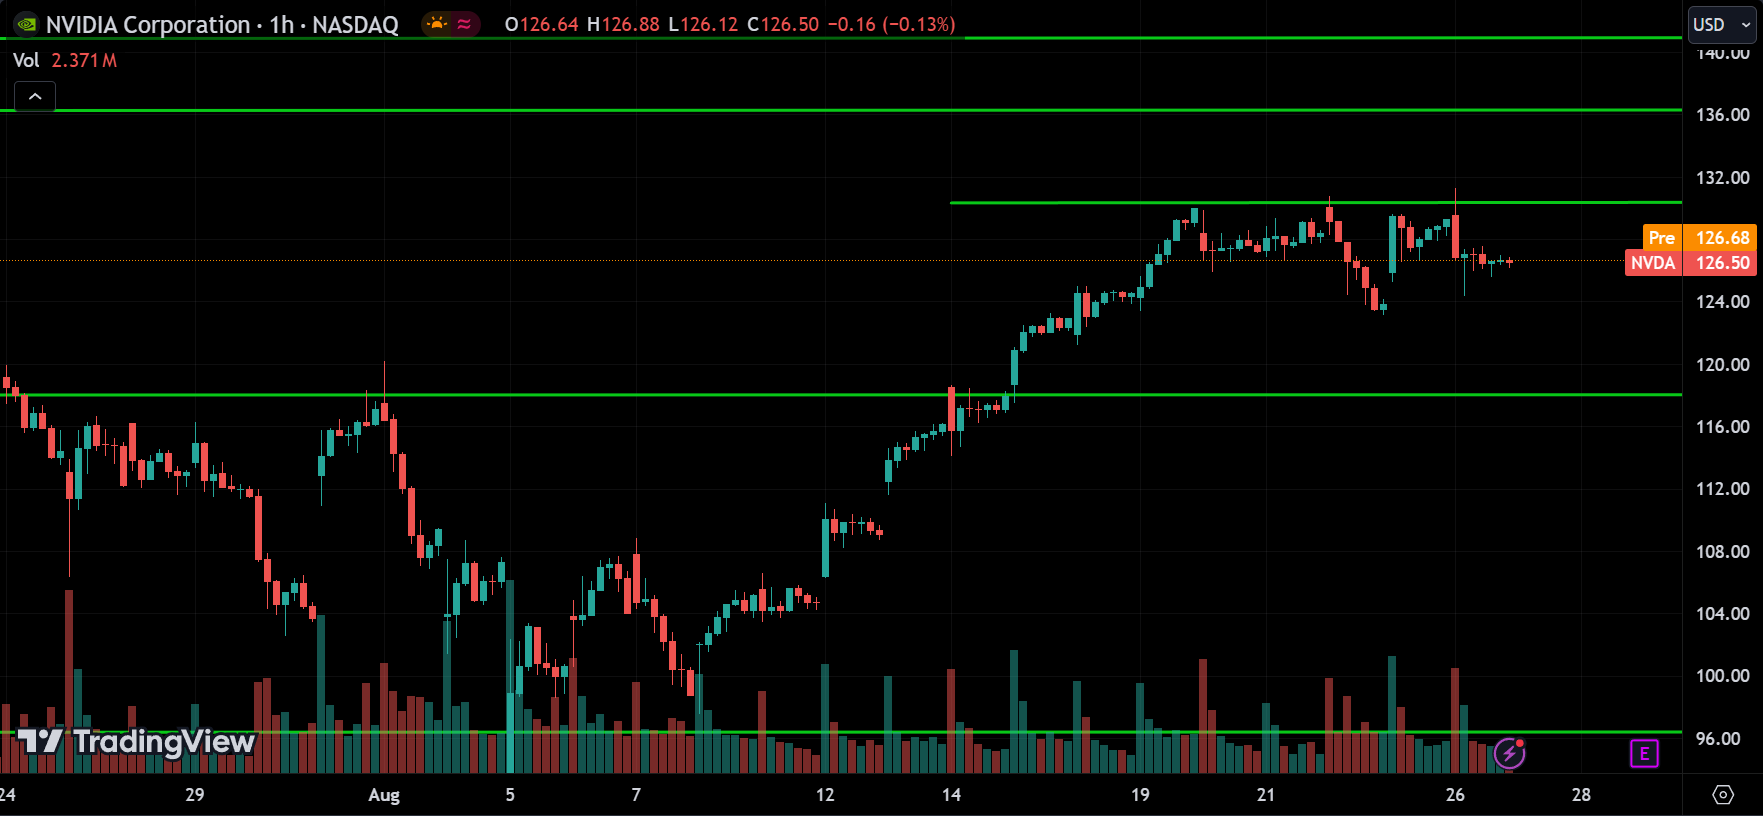
NVIDIA Corporation Common Stock is expected to report earnings on 08/28/2024 after the market closes. This report, covering the fiscal quarter ending in July 2024, is highly anticipated and could have a significant impact on the stock and the broader market. Currently, the price is consolidating around the 132 resistance level, with small support around 123. Watch for the price to break these levels. My expectation is that the price will either consolidate today or start moving up. Let’s wait and see.
Ebay(EBAY):
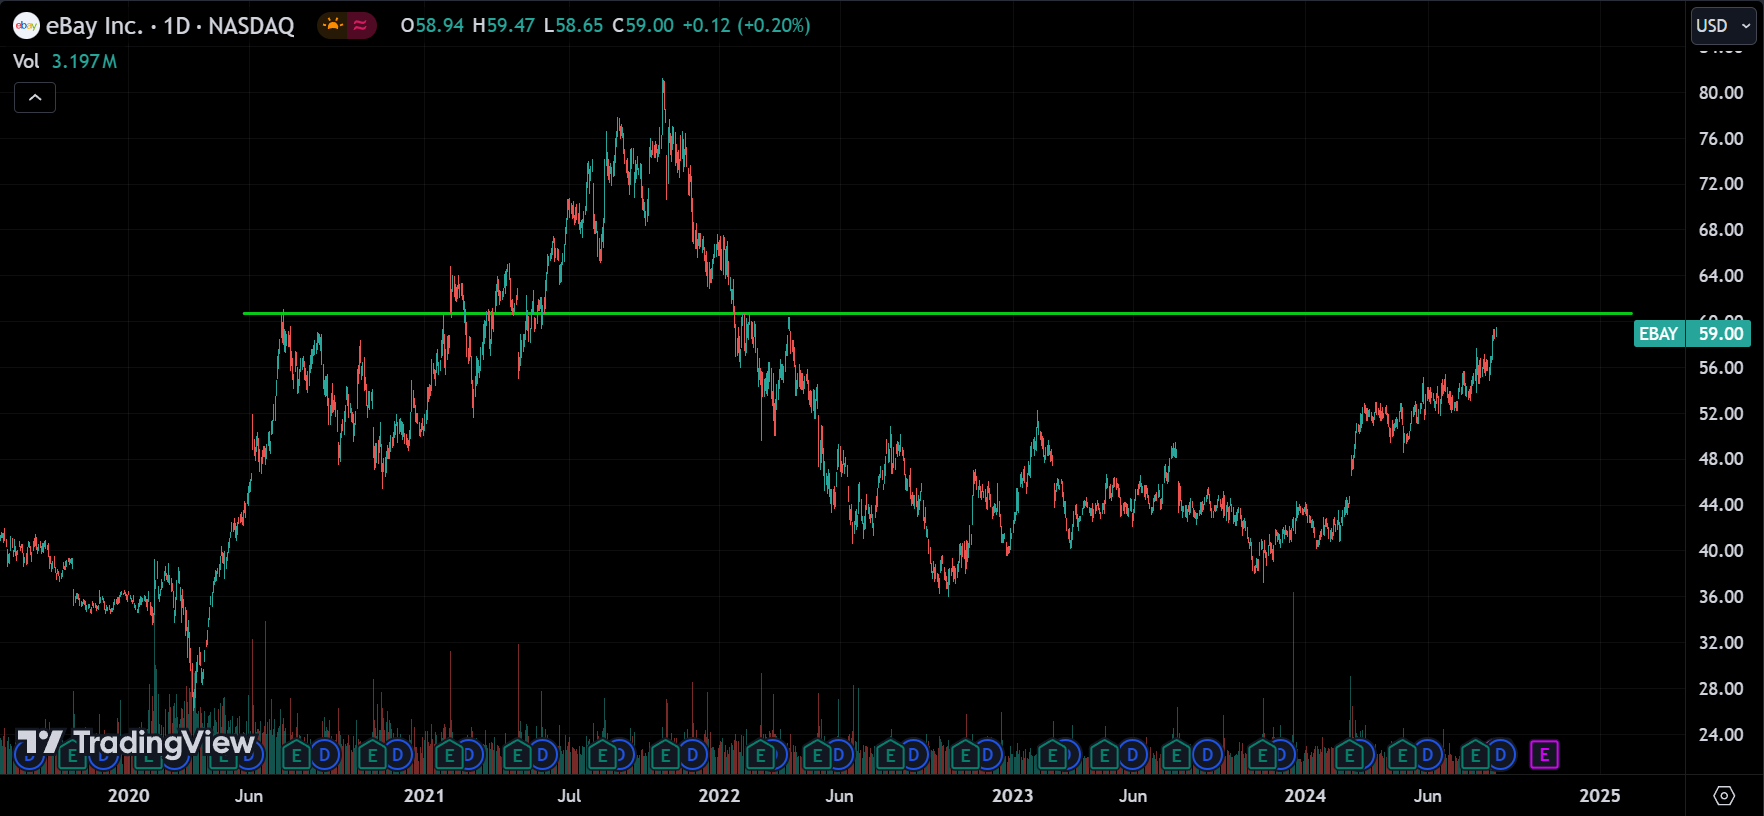
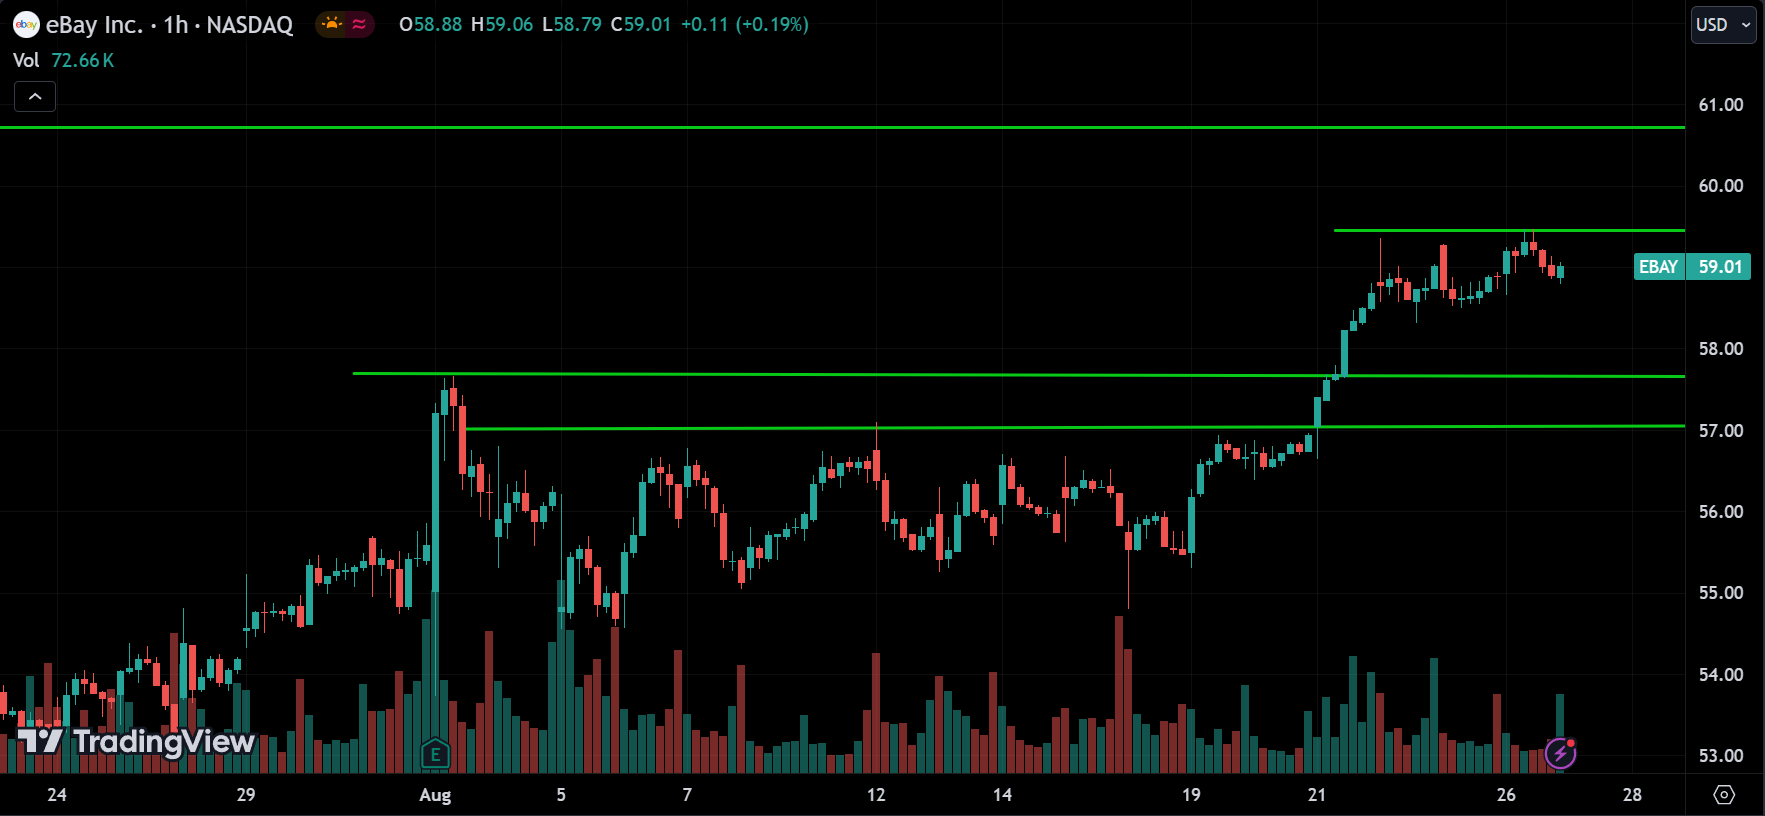
eBay is nearing a major resistance level at 60. Given the strong performance over the year, we can expect the momentum to continue. However, there might be a pullback or correction from the 60 level, and the price could drop below 57. If the price breaks above 60, we can expect it to keep rising.
Apple(AAPL):
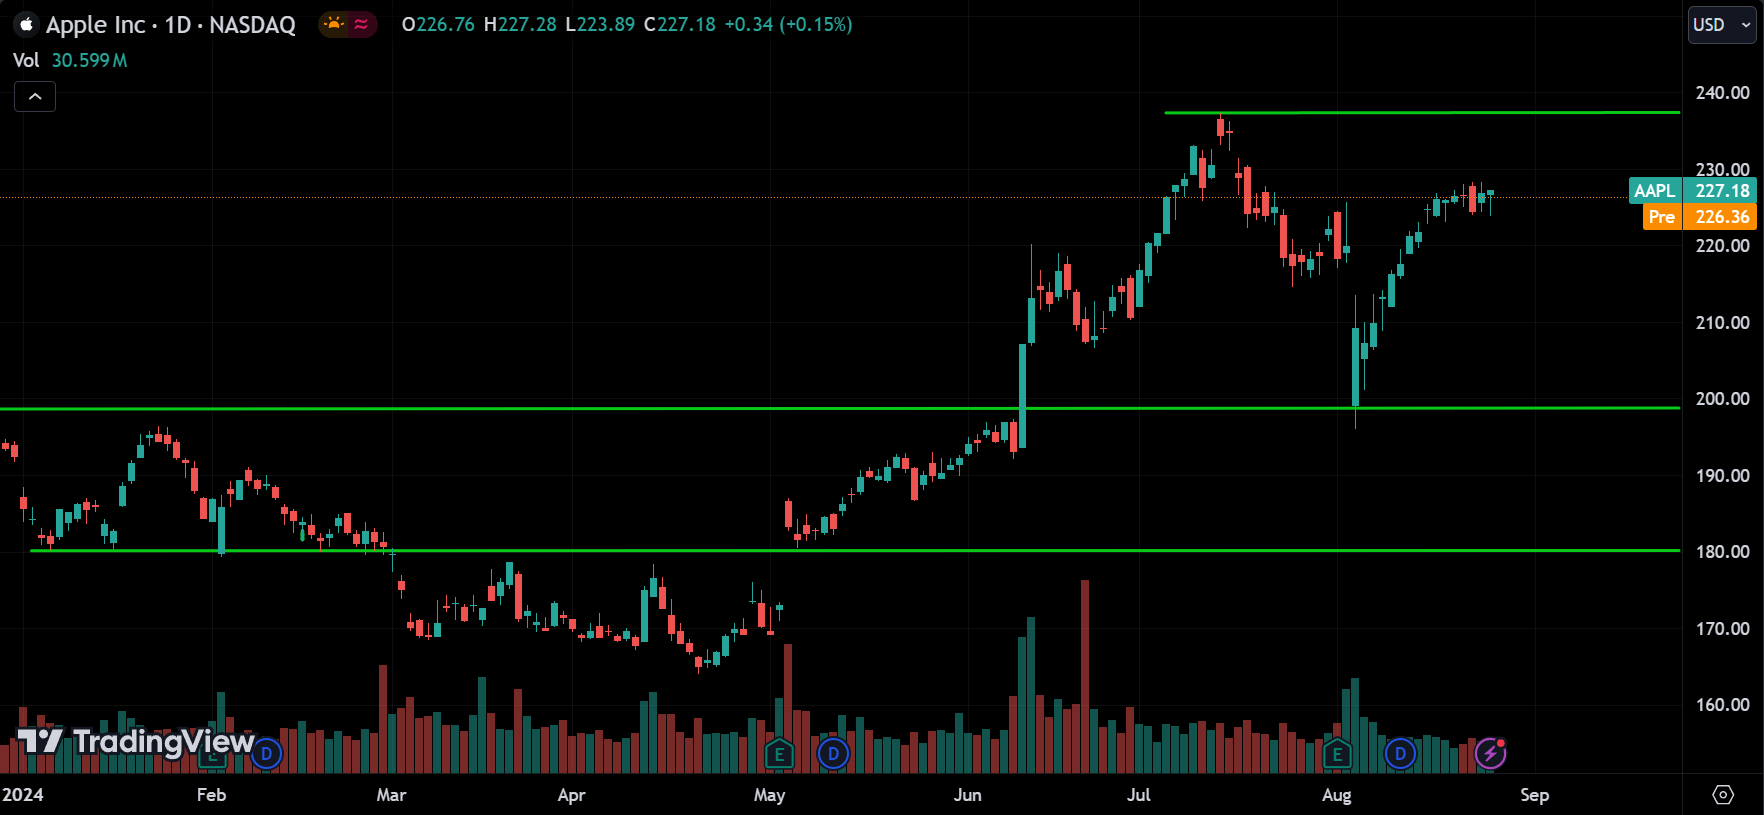
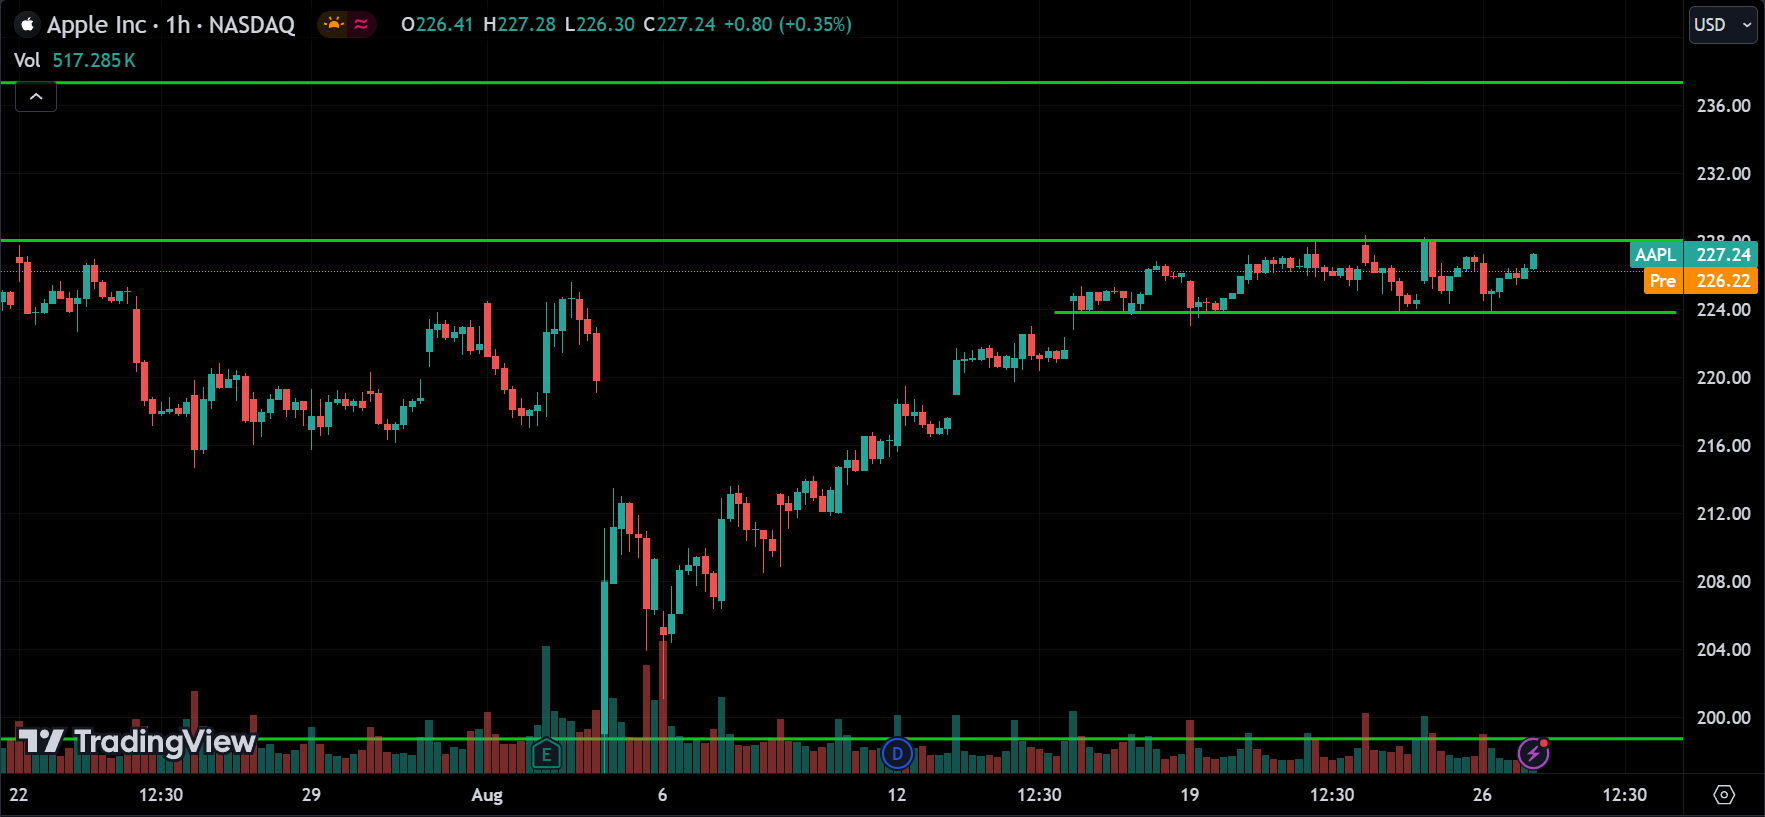
Apple has announced the date of its next big event: September 9th, 2024, at 1 PM ET / 10 AM PT. The event, called “It’s Glowtime,” will be held at the Steve Jobs Theater at Apple Park. During this event, the company is expected to launch the iPhone 16 lineup along with a few other products, possibly featuring some AI capabilities. This makes Apple a key stock to watch, especially as the world is increasingly recognizing the potential of AI. Currently, the price is consolidating between the 228.50 resistance level and the 224 support level. If the price breaks above resistance, we can expect it to keep rising. On the other hand, if it breaks below support, the price may drop. However, if Apple announces something unexpected, the stock could skyrocket, as strong product announcements typically drive the stock up.
Conclusion & Disclaimer
Subscribe to our Telegram channel to get instant updates on new articles.
Please provide your feedback on how we can improve this article. Thank you!
We discussed these sectors and markets because when the entire market or sector goes through certain movements, most of the stocks within that market will also experience similar movements. So, by understanding what the market is doing, you can conduct your own analysis on specific stocks.
These analyses are here to help you understand how to analyze the market. They’re not about giving buy or sell signals. It’s simply about observing price action market behavior. I don’t recommend when to buy or sell because trading doesn’t work that way. You need a strategy to guide your decisions about when to enter or exit positions. That’s the key to making consistent profits in the financial markets over time.
The information provided in this market analysis is for educational and informational purposes only. It should not be construed as financial advice or a recommendation to buy, sell, or hold any securities or investments.
All investments involve risk, and past performance is not indicative of future results. The analysis provided may not be suitable for all investors and should be used at their own discretion.
Readers are encouraged to conduct their own research.
Trading and investing in financial markets carry inherent risks, including the risk of losing invested capital. It is important to carefully consider your investment objectives, risk tolerance, and financial situation before making any investment decisions.
GOOD LUCK✌!!!