![US Stock Market Today [2024.08.28]: Key Price Levels and Trends for S&P 500 & Sectors - Nvidia Earnings Report After Market Close, Qualcomm & Analog Devices Stock Analysis
xlearnonline.com](https://xlearnonline.com/wp-content/uploads/2024/08/Fundamental.png)
Hello, and welcome to xlearn’s US stock market today article series. If this is your first time here, I recommend reading our guide on how to use our market analysis article before diving into this one.
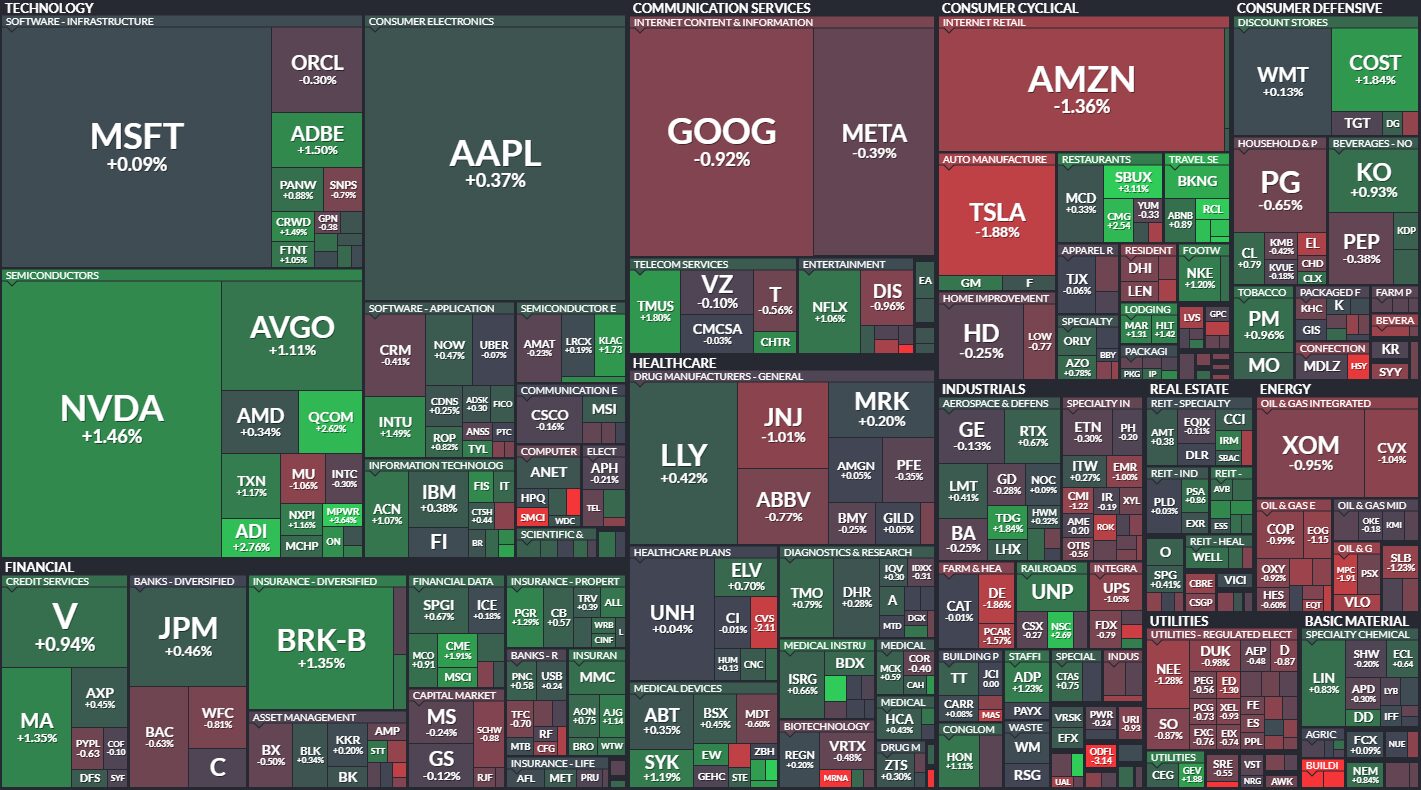
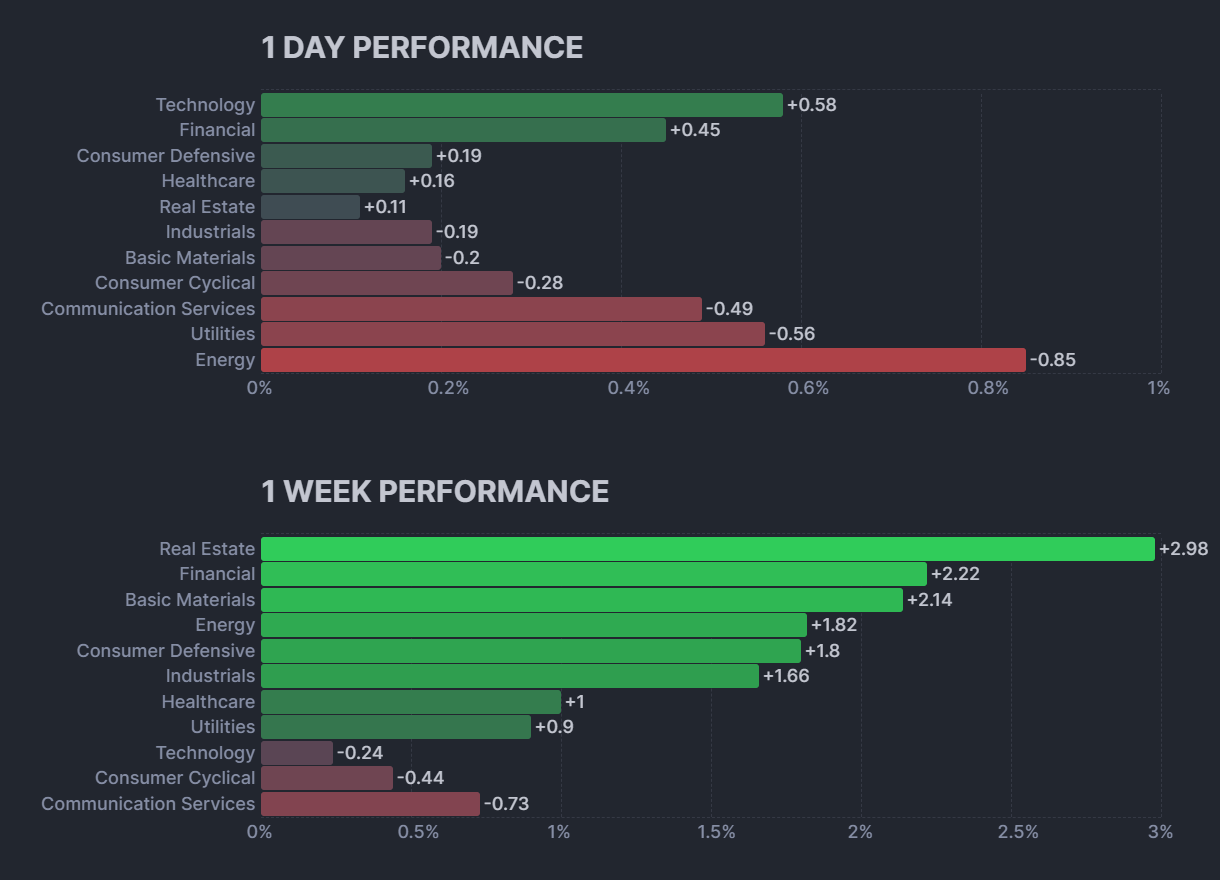
We will use a top-down approach in our analysis. First, we will analyze the overall market, focusing on the S&P 500. Then, we will analyze each sector one by one for their price action performance so we can trade stocks in those sectors with confidence. Finally, we will look at some stocks to watch for today.
Before we get into the analysis, let’s quickly review the major economic events that could impact the market.
Economic Events Today
These events include important news that could impact the stock market, macroeconomic reports, and economic indicators. For more details, you can check the bloomberg calendar & yahoo finance.
- 10:30 ET: The Crude Oil Inventories update will be released, showing the change in the number of barrels of crude oil held by commercial firms over the past week. The previous report was -4.6M, and the forecast is -2.7M. If the actual number is less than the forecast, it’s positive for the currency. This update is a key indicator of supply and demand imbalances in the market, which can affect production levels and cause price volatility. This will also impact petroleum stocks.
Stocks with Earnings:
| BEFORE MARKET OPEN | AFTER MARKET CLOSE |
|---|---|
| SJM | NVDA |
| CHWY | CRM |
| DCI | CRMD |
| ANF | HPQ |
| BBWI | VEEV |
| FL | NTAP |
| PDCO | PSTG |
| KSS | COO |
| PRTC | OKTA |
| NTNX | |
| AFRM | |
| FIVE | |
| GEF | |
| PSEC | |
| VSCO | |
| PAHC | |
| APLD |
For more details and to see all the stocks reporting earnings today, check out finviz.
S&P 500
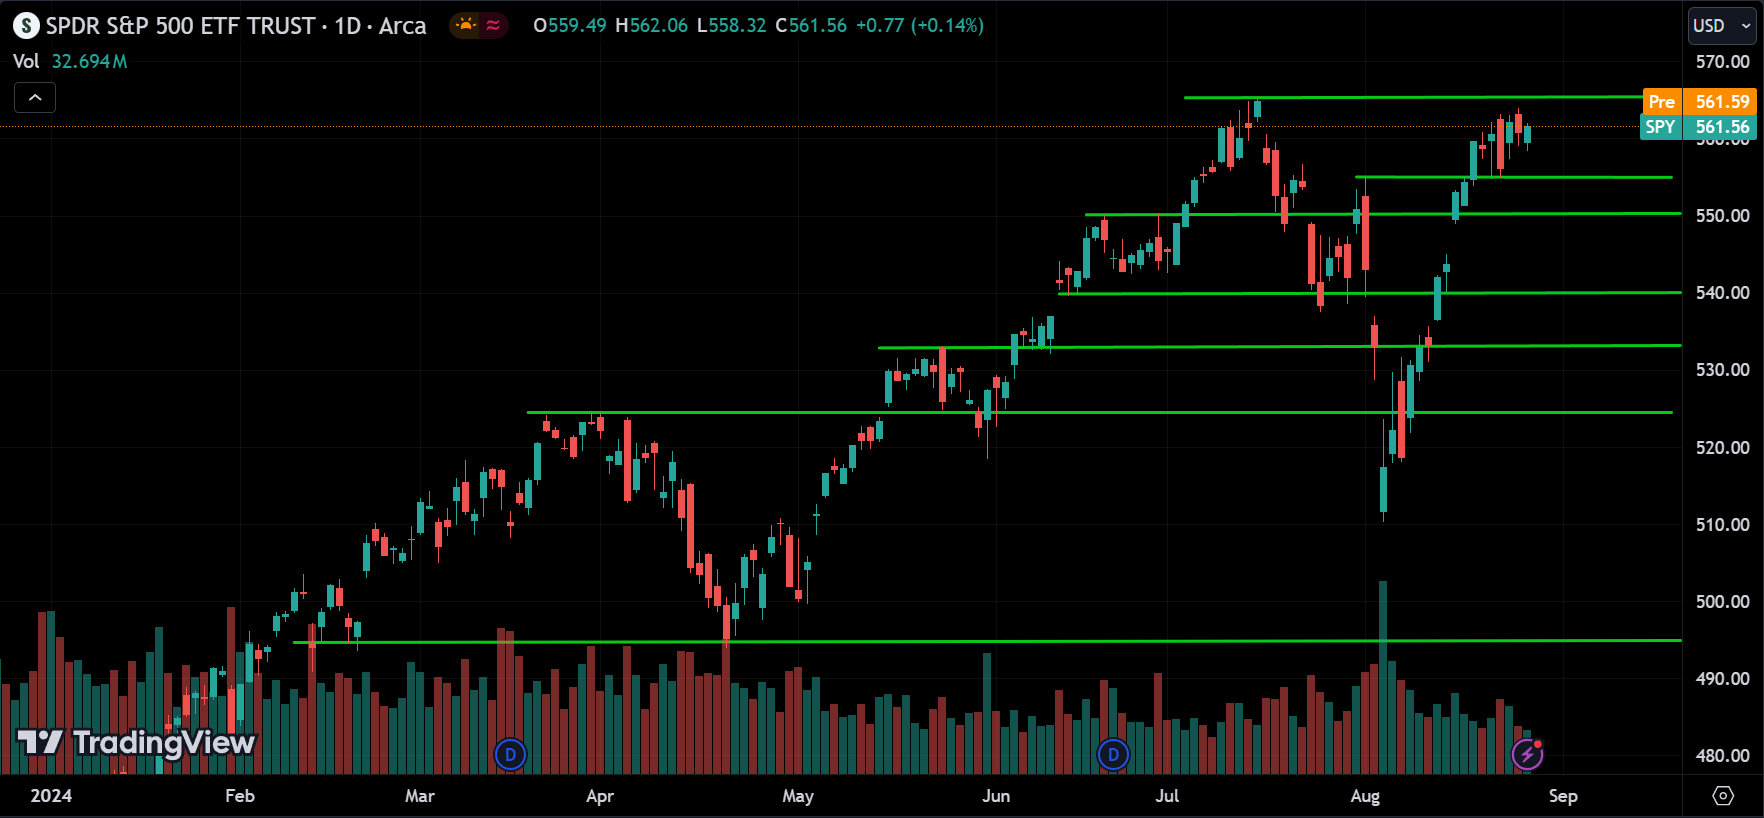
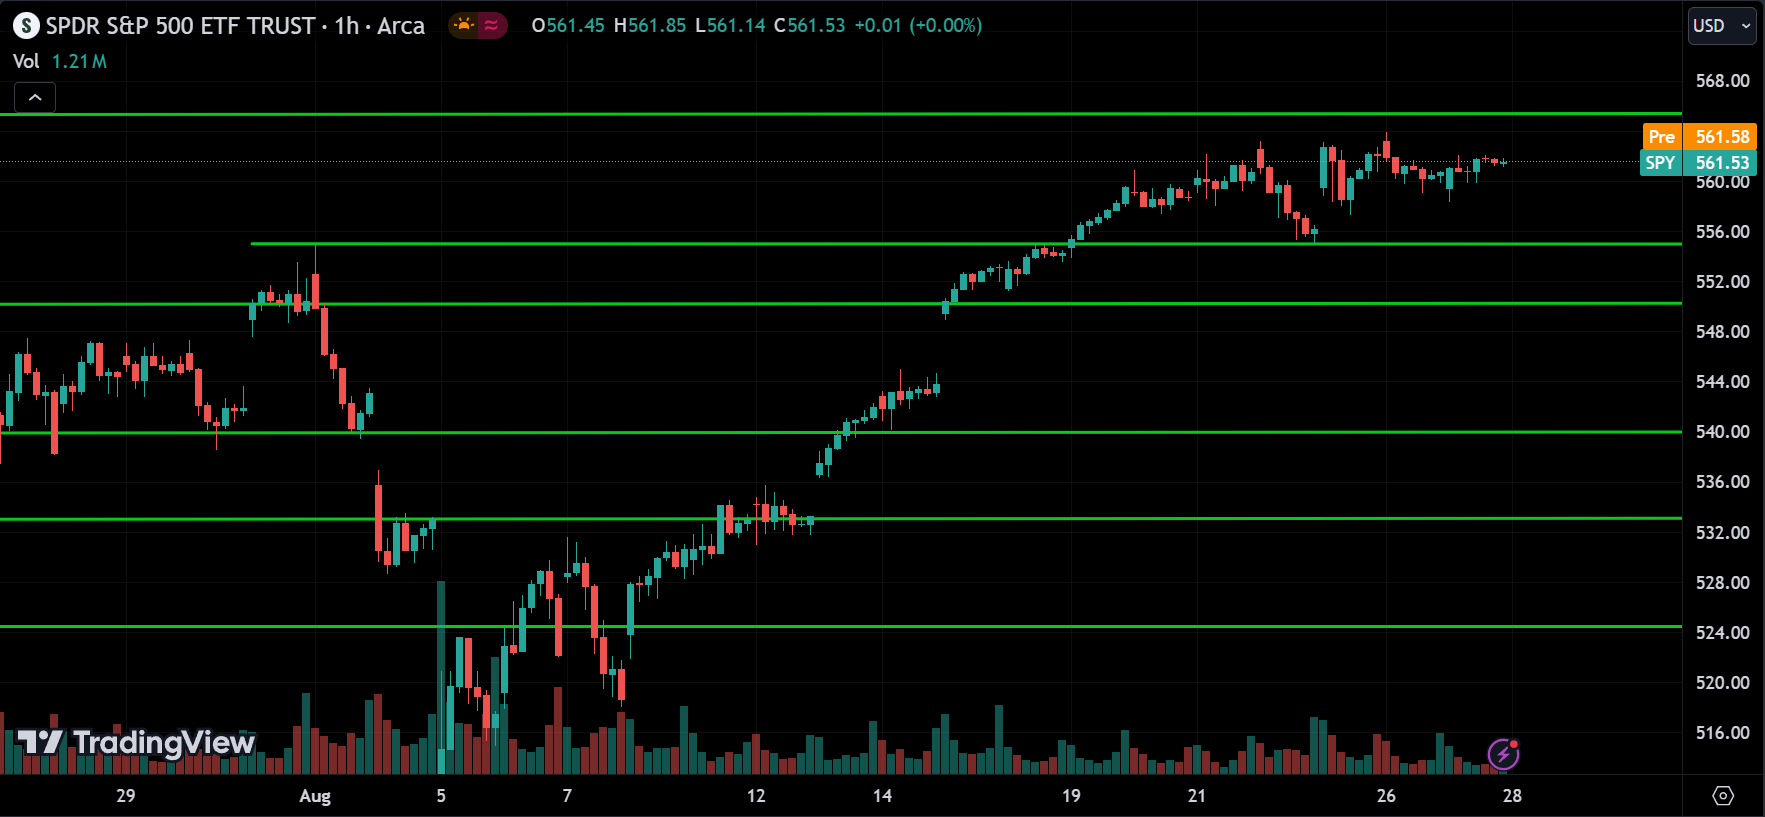
The S&P 500 is trending up, with the price currently consolidating between the 564 resistance and the 556 support levels. Since the overall market is trending upward, we can expect the price to break above the resistance and continue rising. However, if the price breaks below the 556 support, the market may enter a correction phase.
Consumer Staples Sector(XLP):
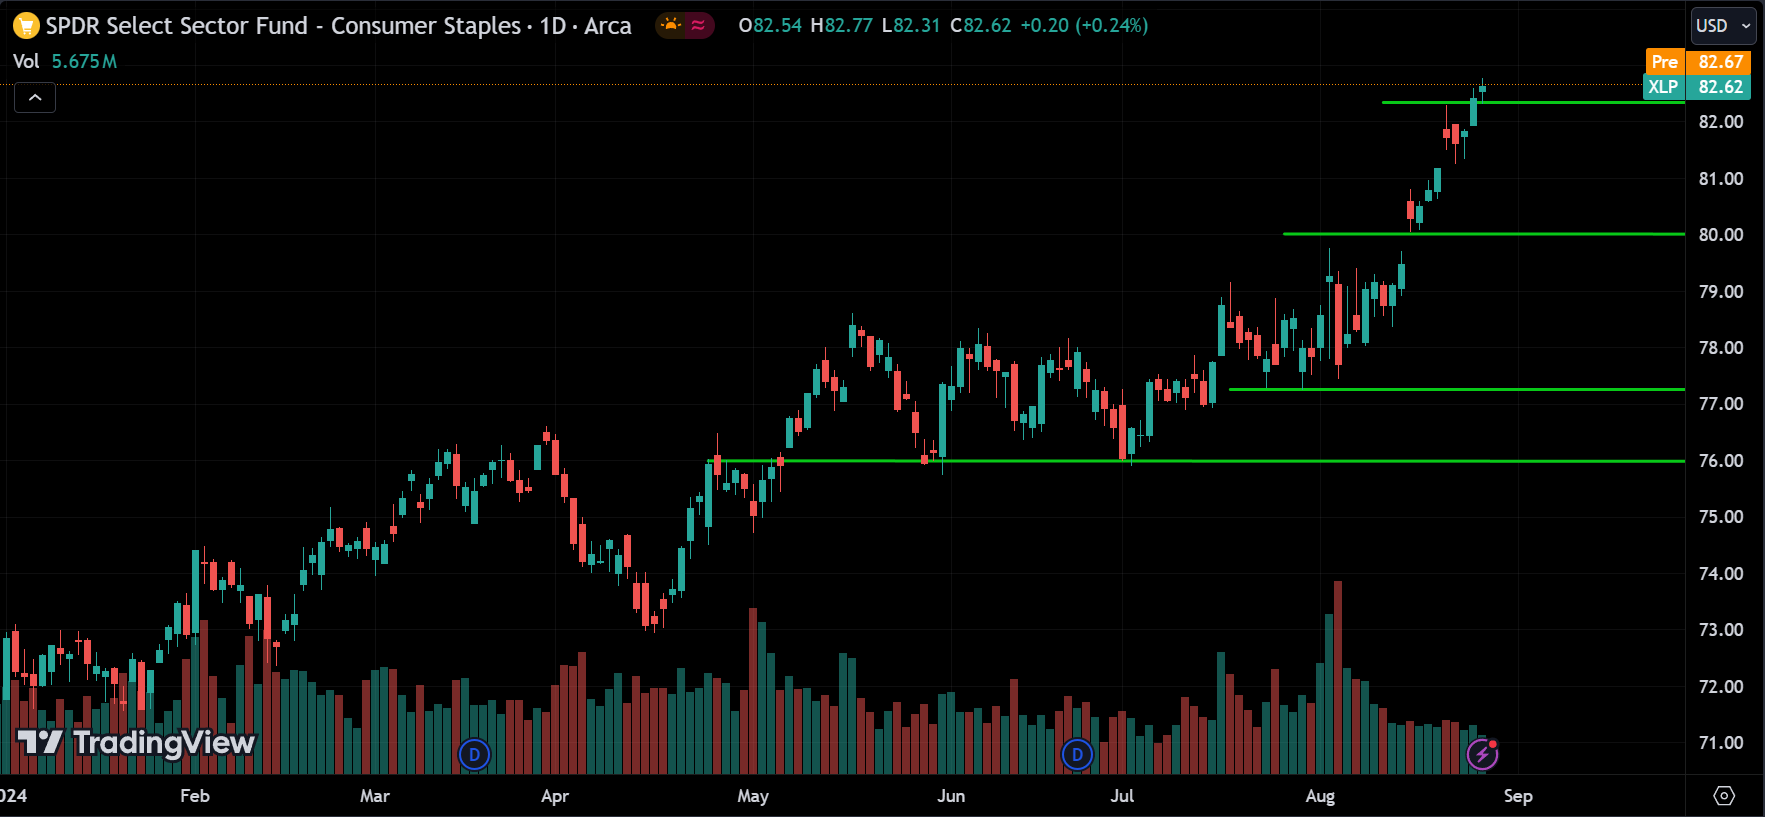
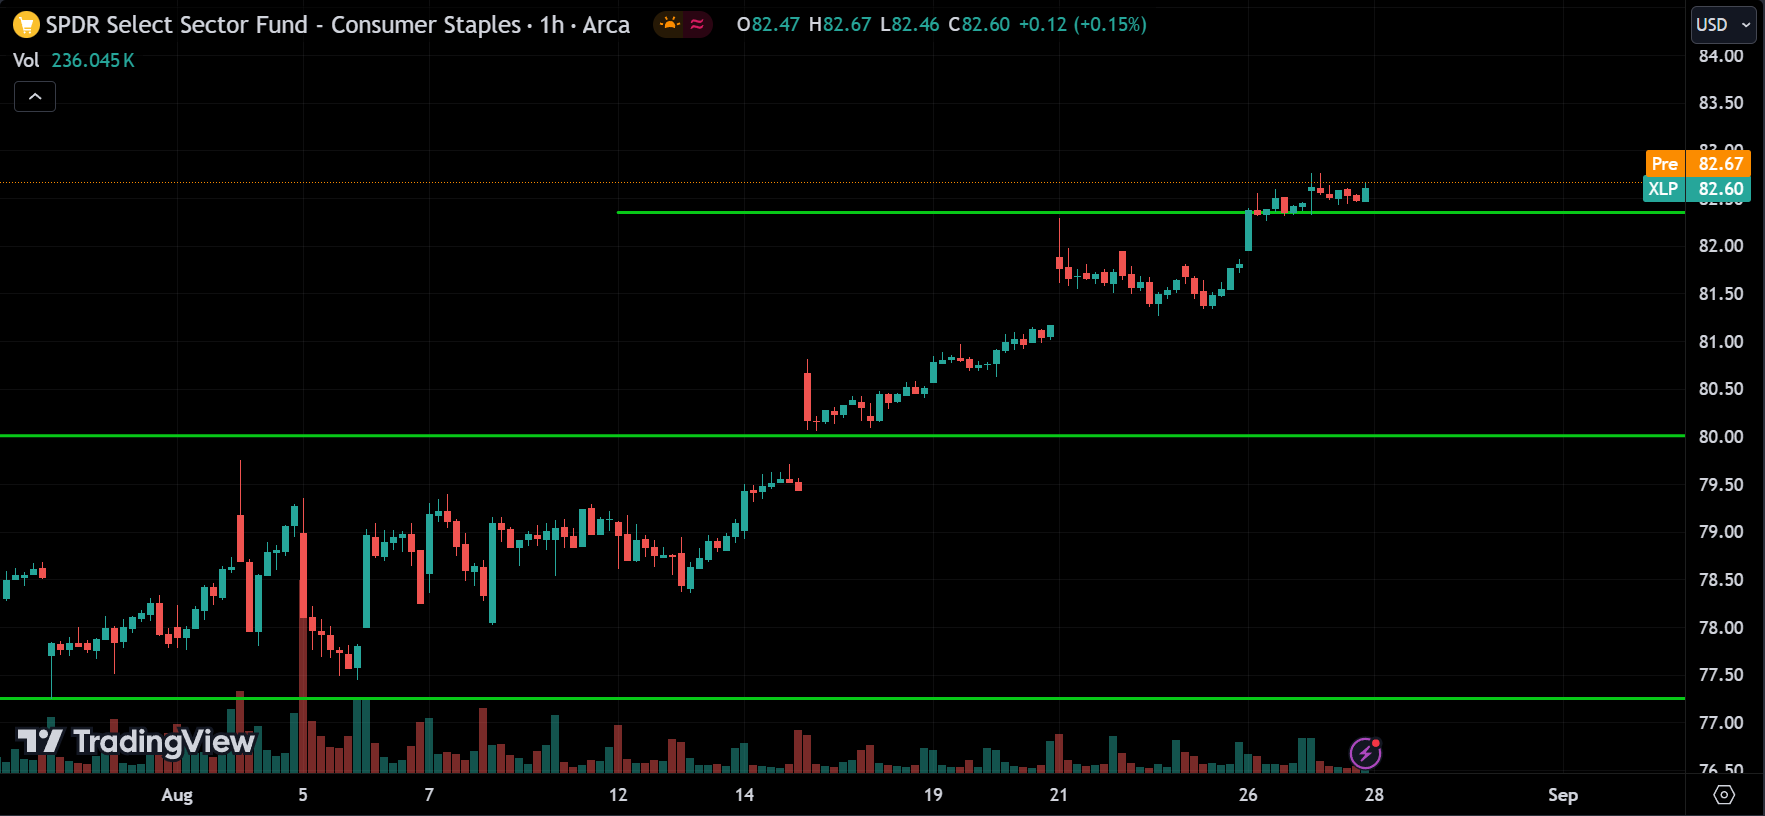
The Consumer Staples sector or XLP ETF is trending up and is at all-time high levels. On the 1-hour chart, the price is consolidating. Given the overall bullish trend, we can expect the price to start rising from this level. However, if the price breaks below the 82.50 support, we might see a correction toward 81.50 or lower.
Energy Sector(XLE):
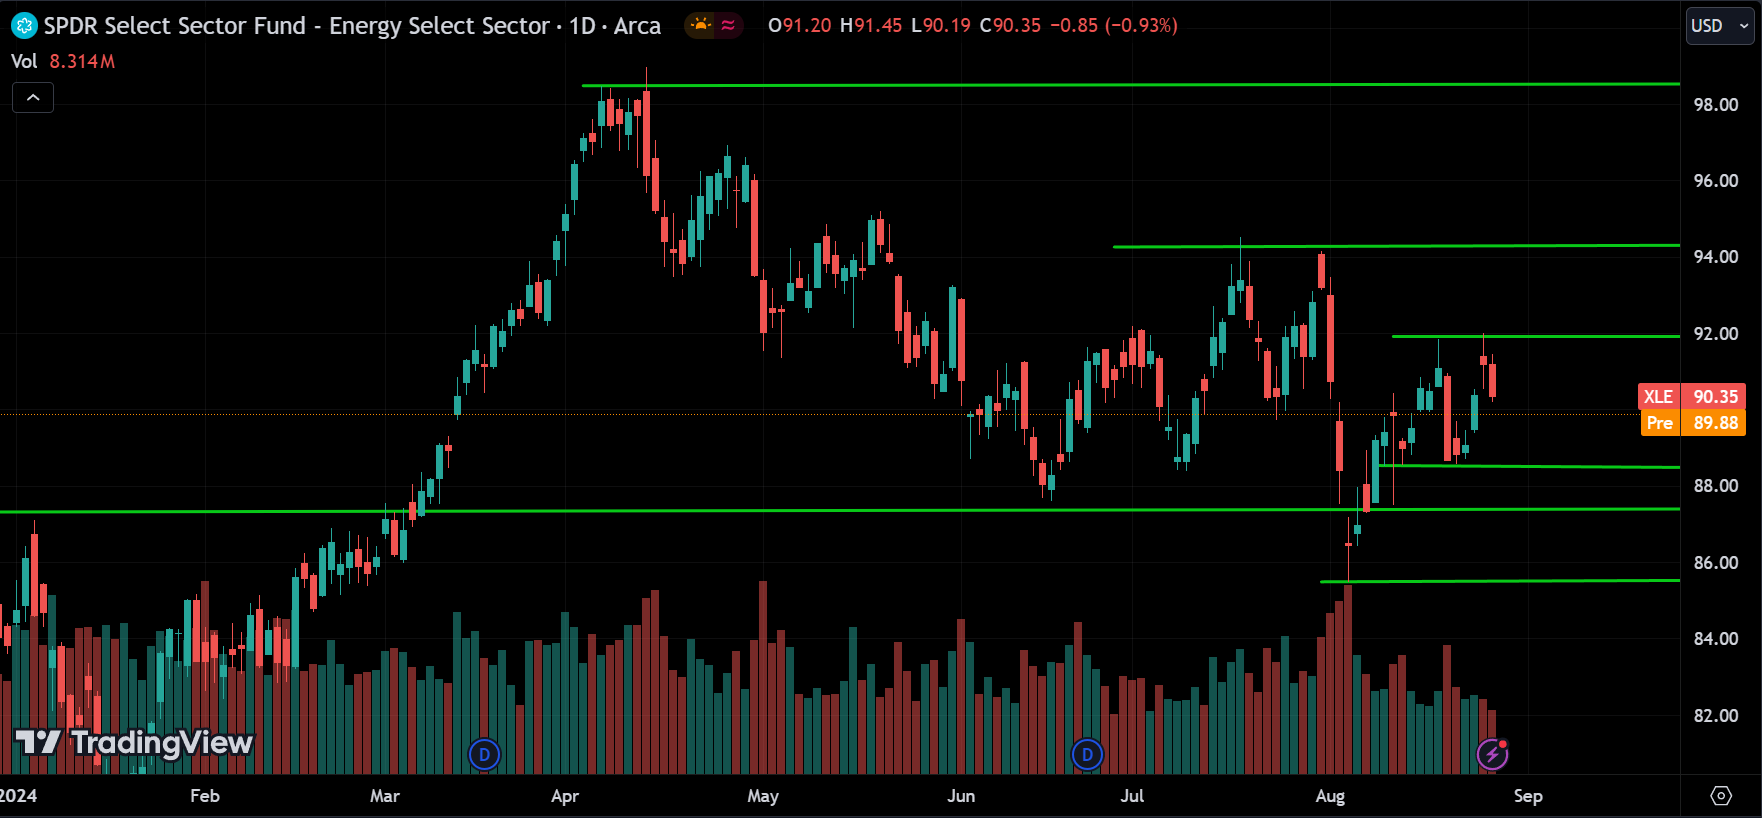
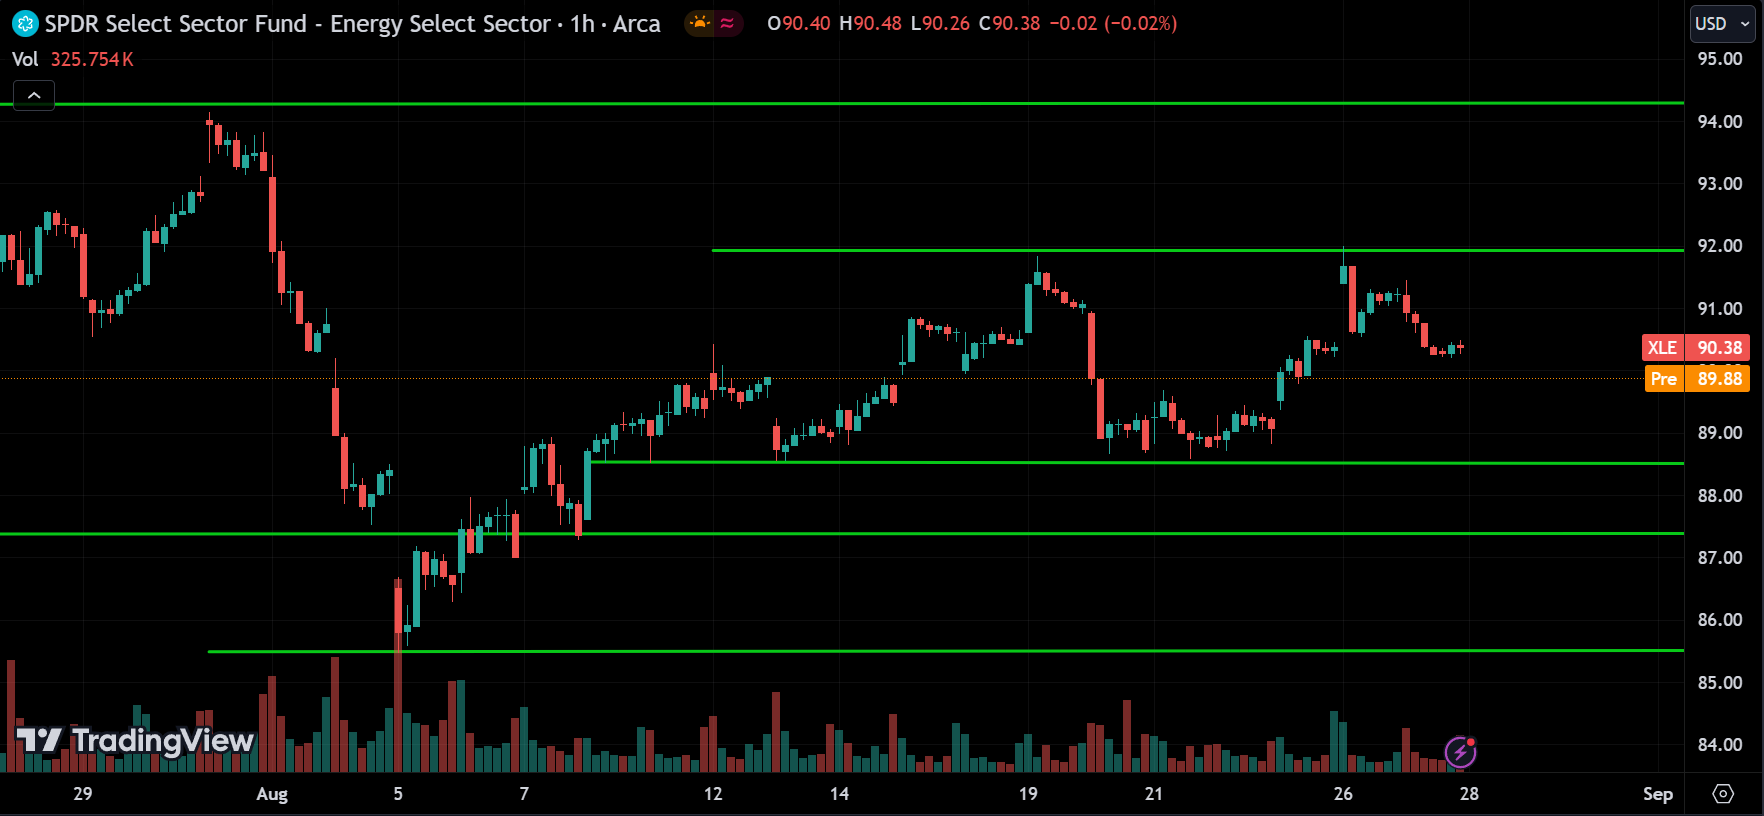
The Energy sector or XLE ETF is consolidating. On the 1-hour chart, the price is pulling back from the 92 resistance level and is heading toward 89. If the price breaks above the resistance, we can expect it to continue up towards 94. However, if the price drops to the 89 support level, we might see it pull back and start going up again. If it breaks below the support, the price could drop to 87 and continue lower with each further breakout.
Materials Sector(XLB):
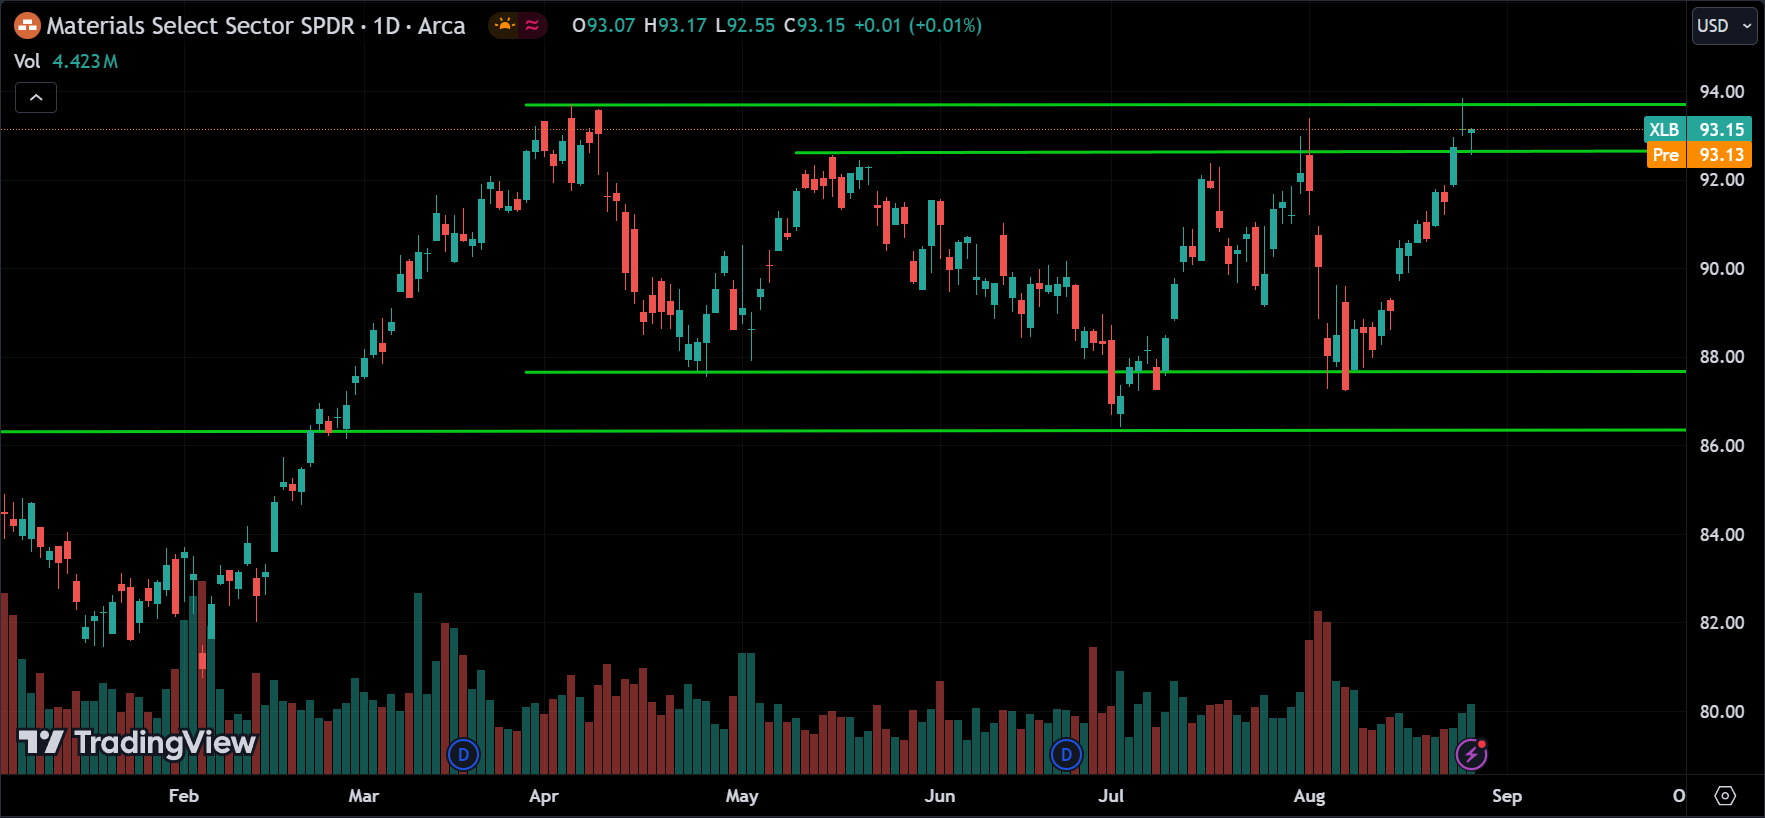
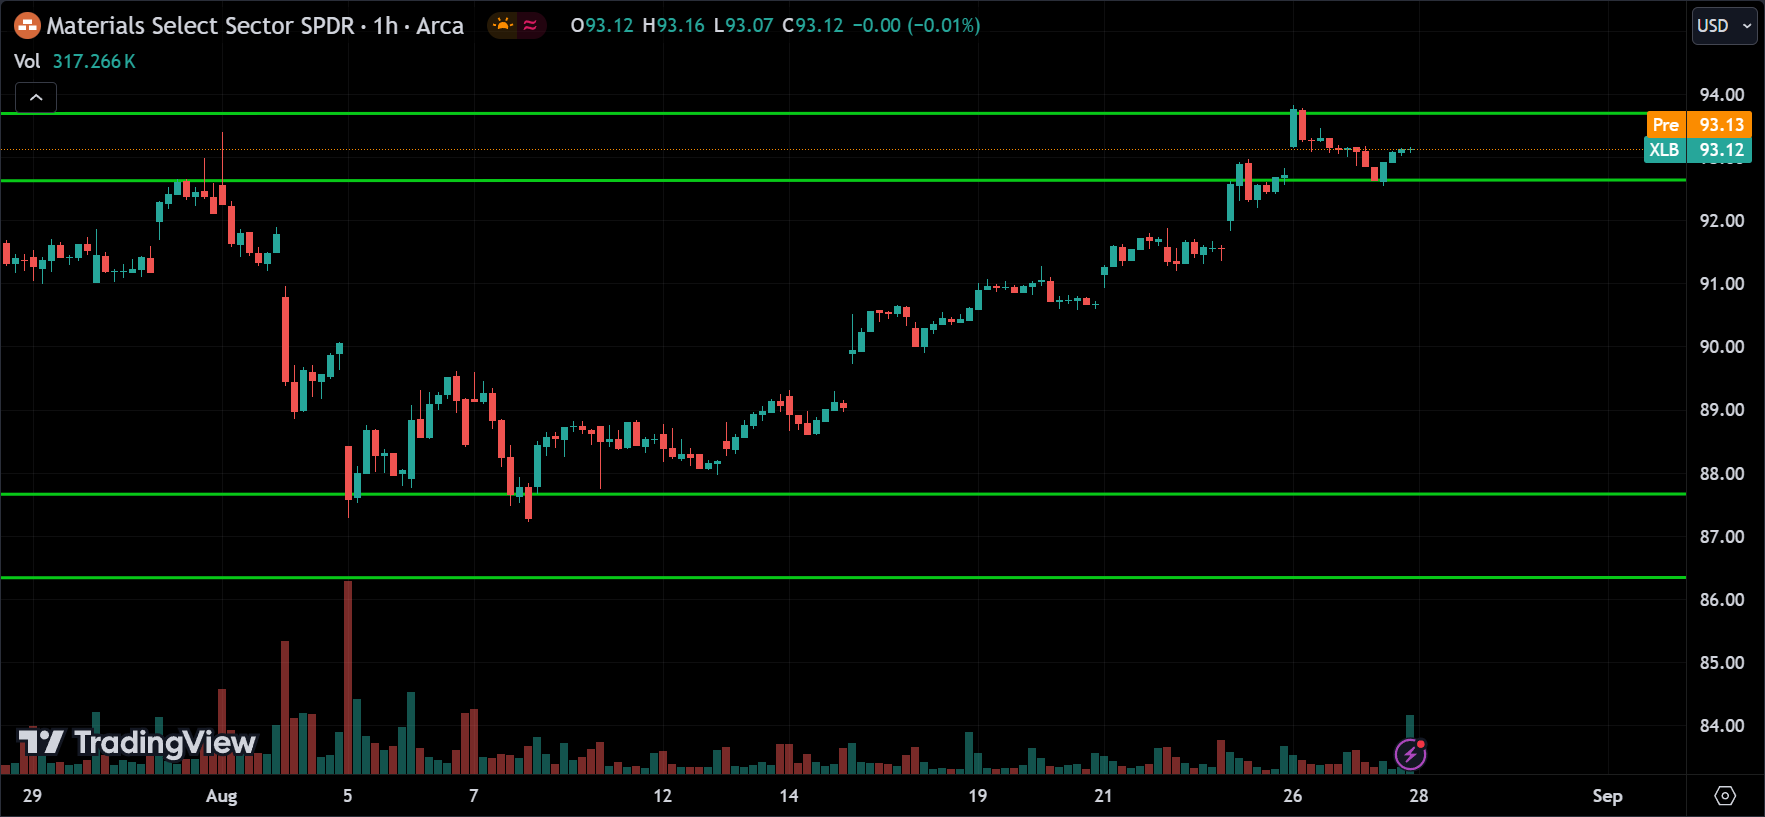
The Materials sector or XLB ETF is consolidating. On the 1-hour chart, the price is pulling back from the 94 resistance level and is currently at 92.50. If the price breaks above the 94 resistance, we can expect it to continue rising. However, if the price breaks below the 92.50 support, it could drop towards 88.
Industrial Sector(XLI):
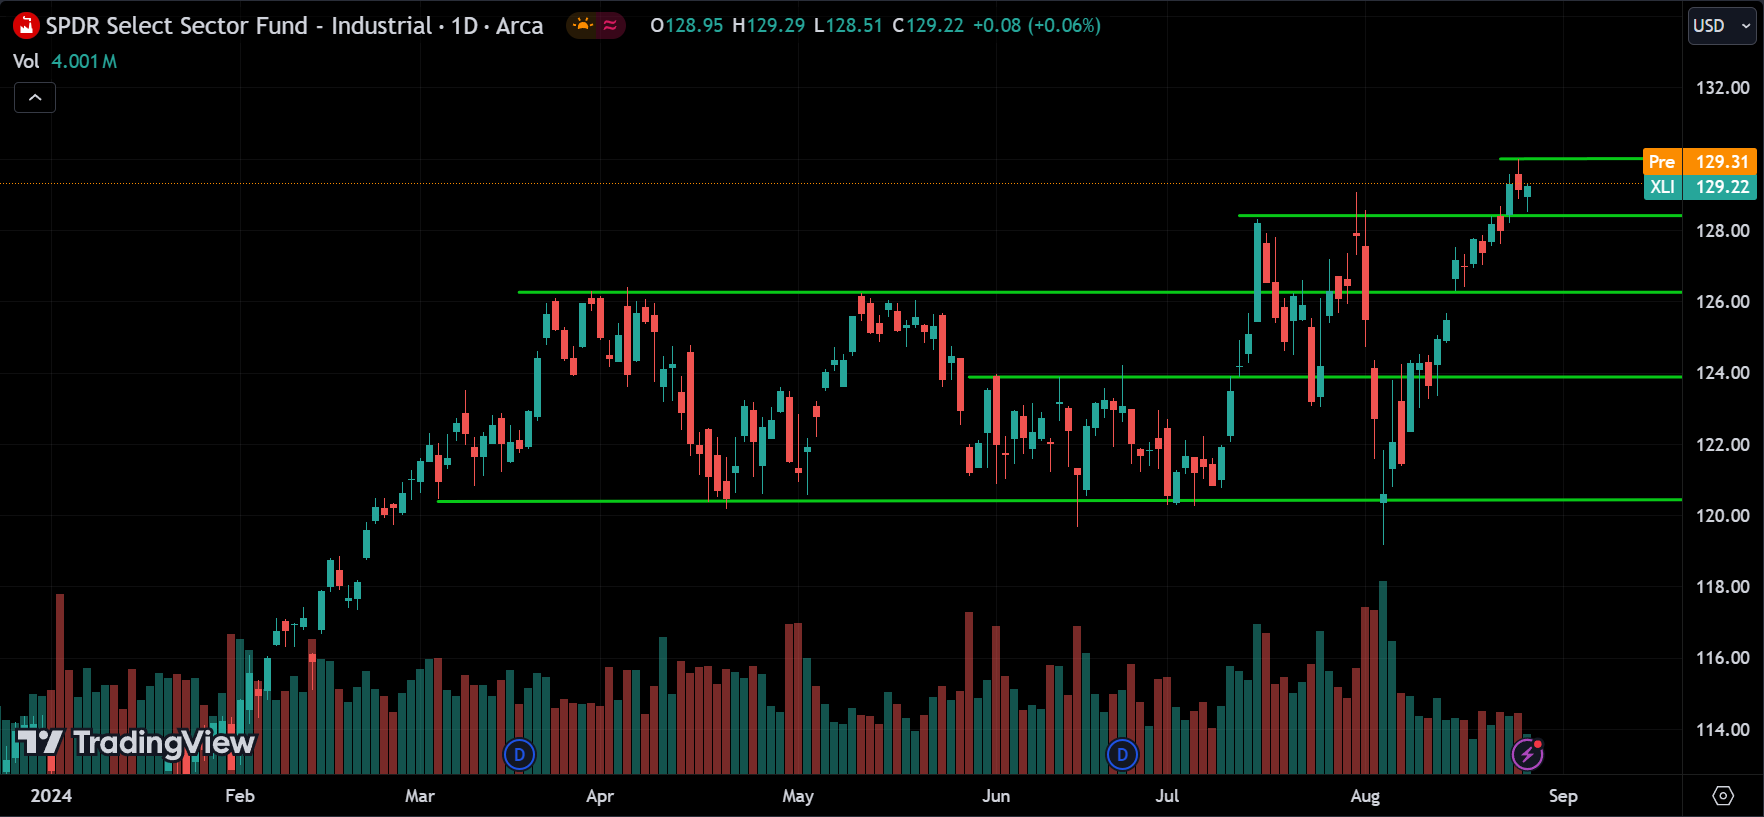
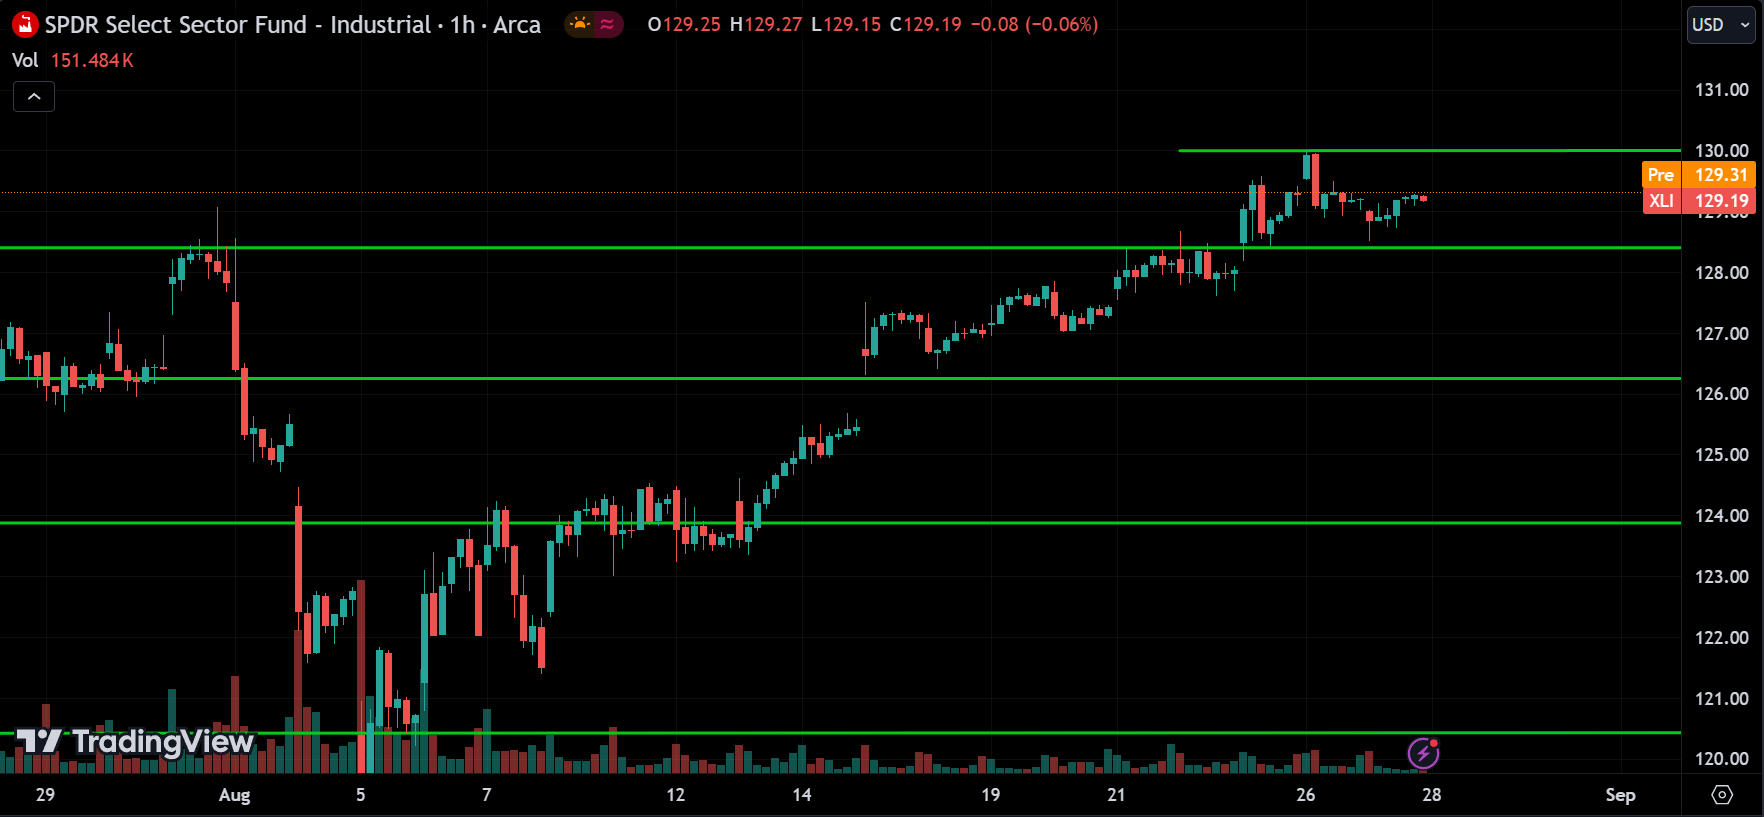
The Industrials sector or XLI ETF is trending up, with the price currently at the 130 resistance level and consolidating. If the price breaks above 130, we can expect it to keep going up. However, if the price breaks below the 128.50 support, it could continue dropping toward 126.
Consumer Discretionary Sector(XLY):
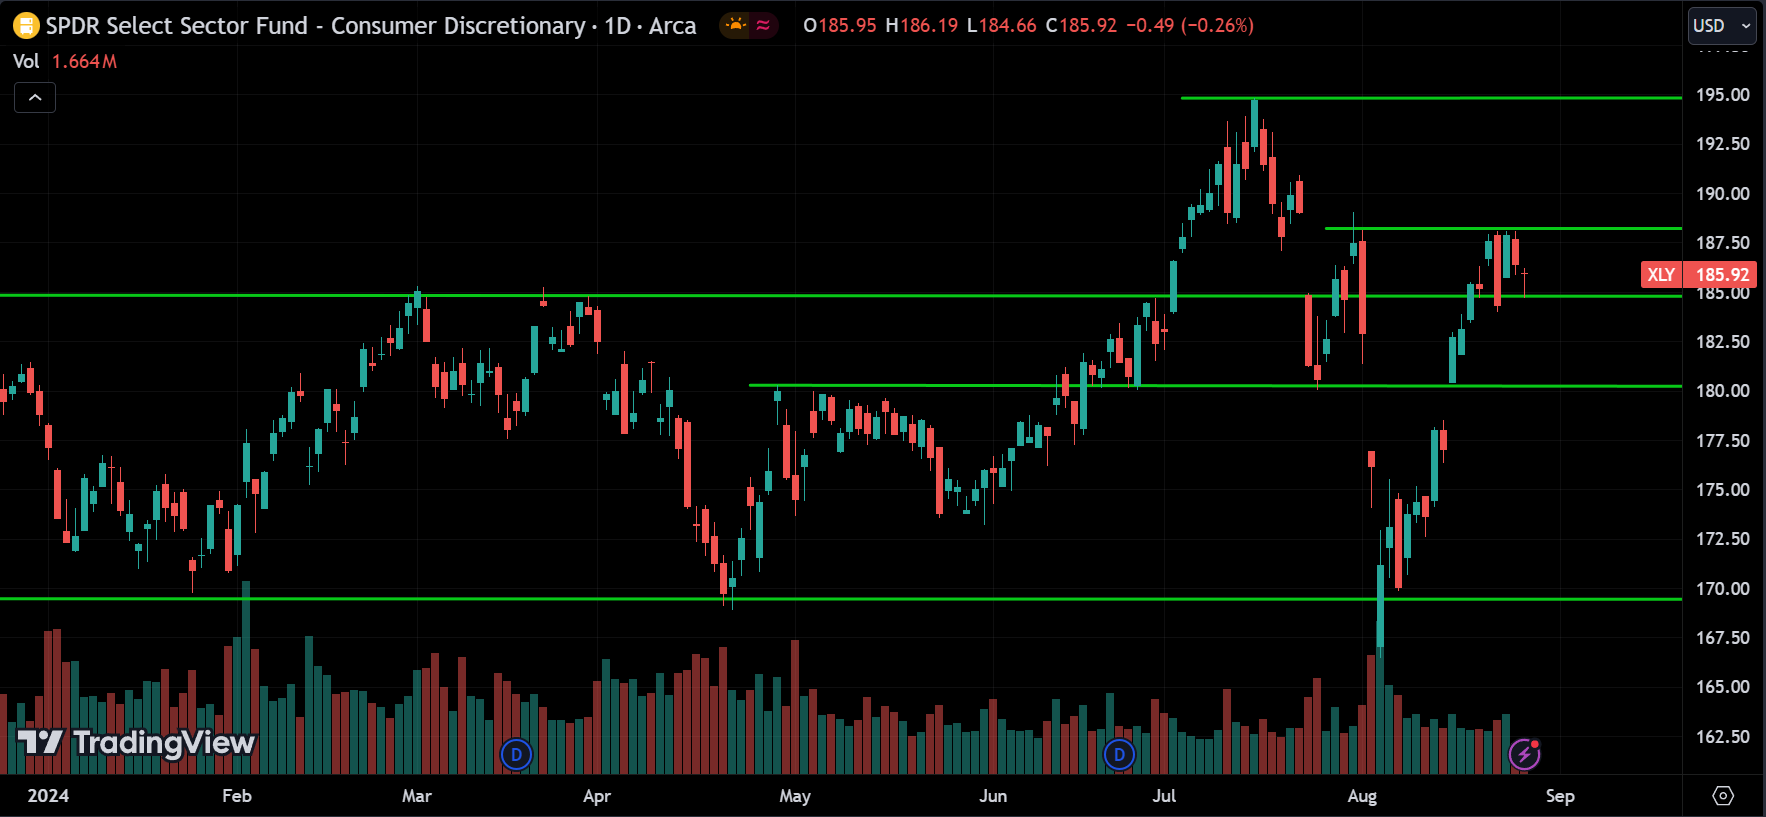
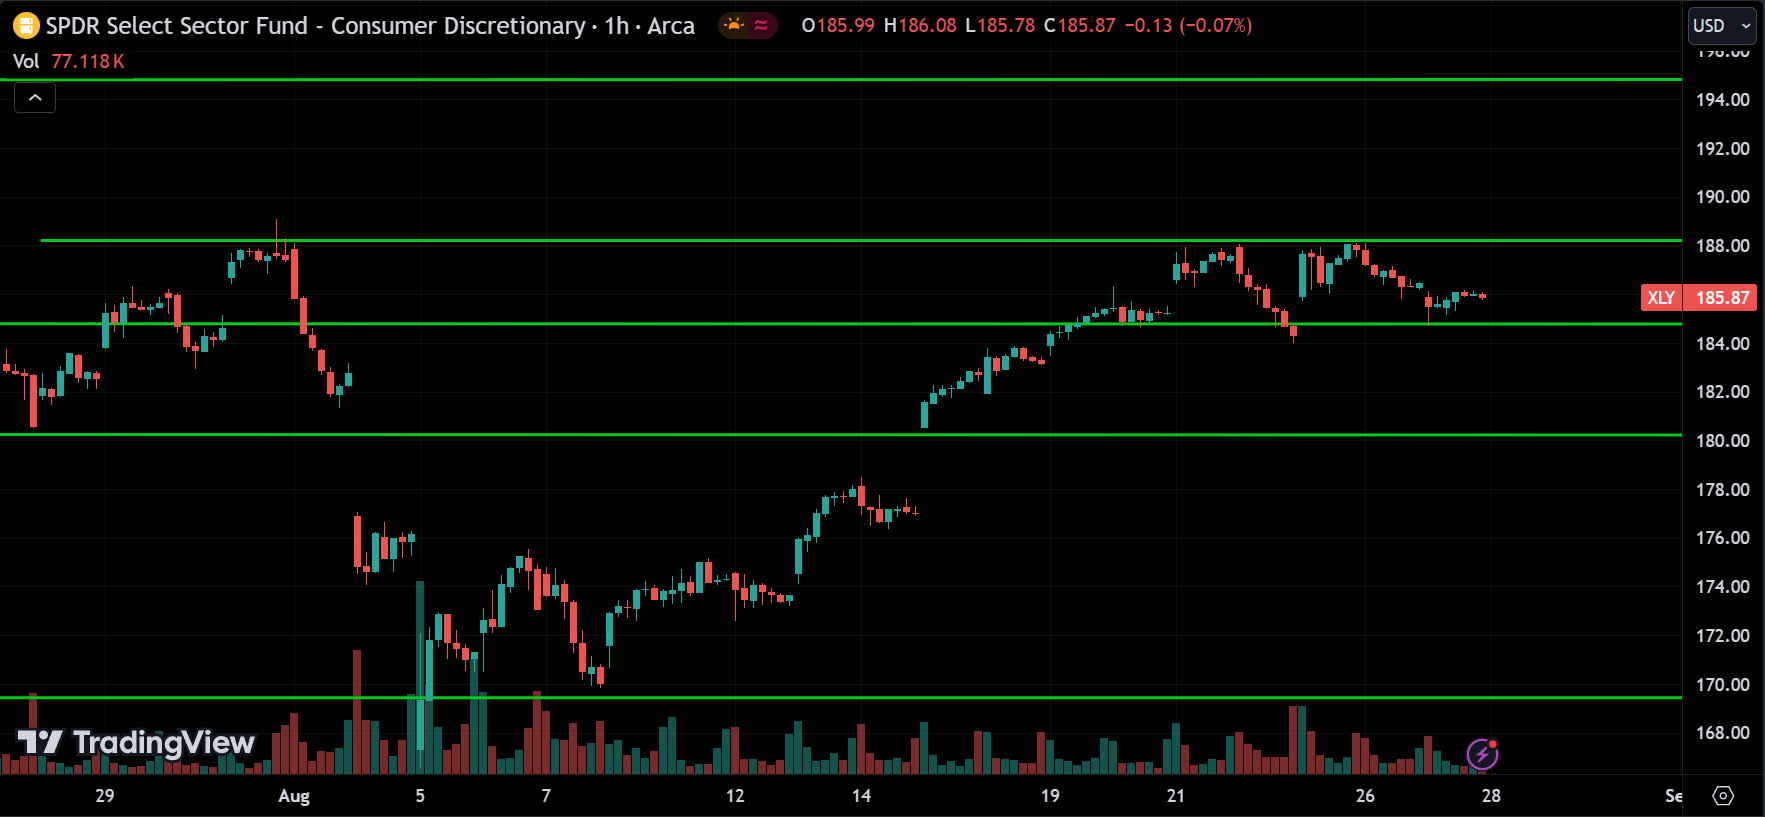
The Consumer Discretionary sector or XLY ETF is also trending up, with the price currently at the 188 resistance level. If the price breaks above this resistance, we can expect the uptrend to continue toward 194. However, if the price breaks below the 184.50 support level, it could drop toward 180.
Healthcare Sector(XLV):
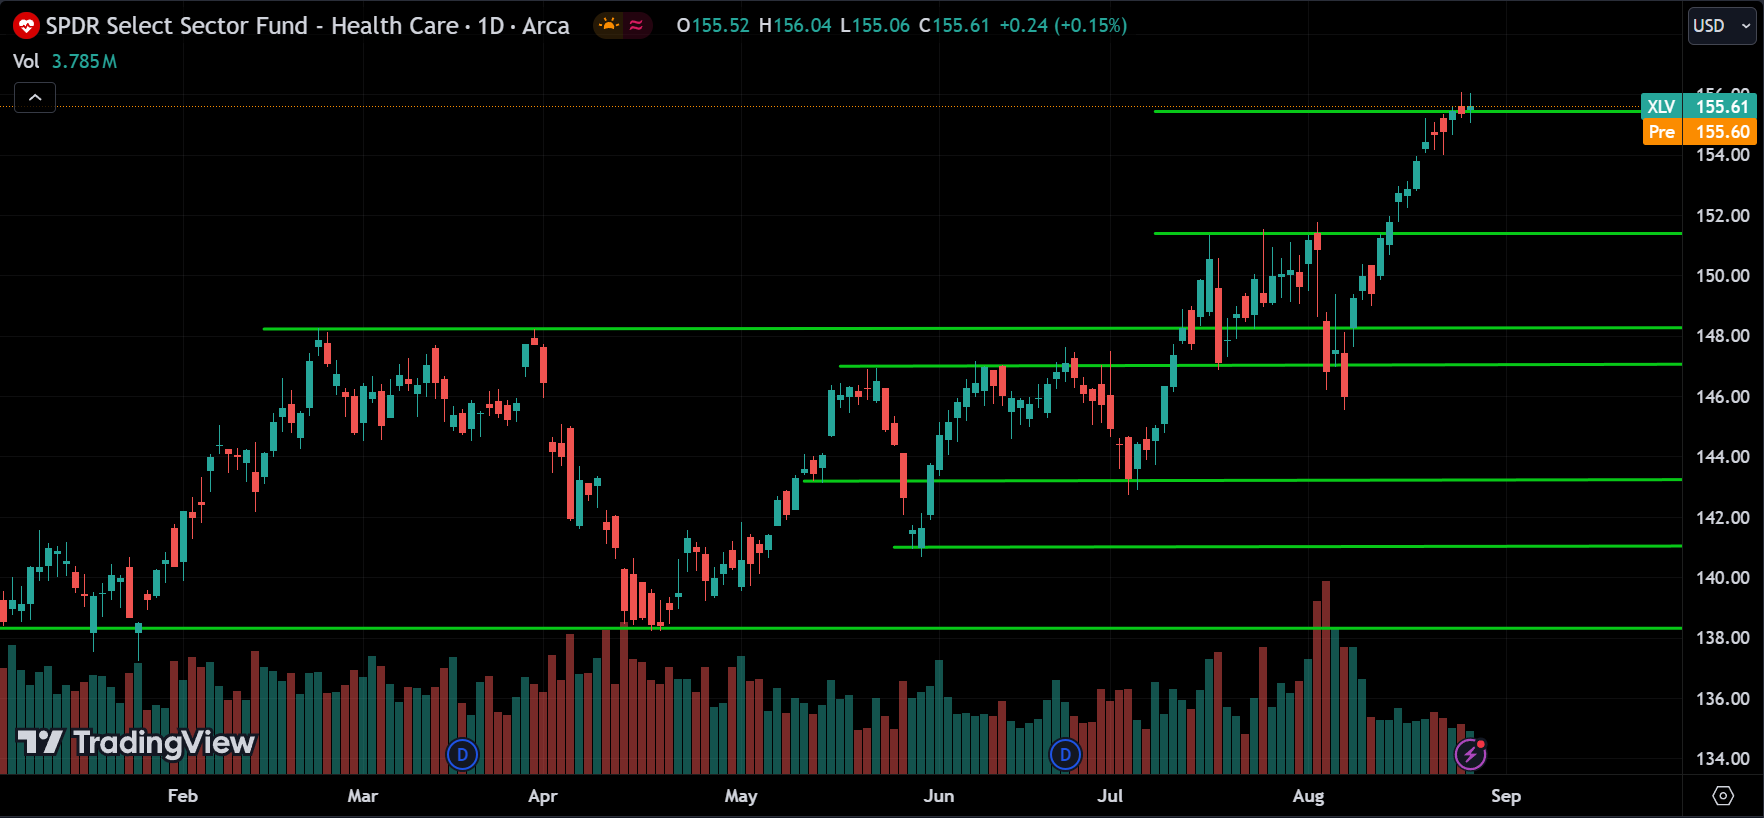
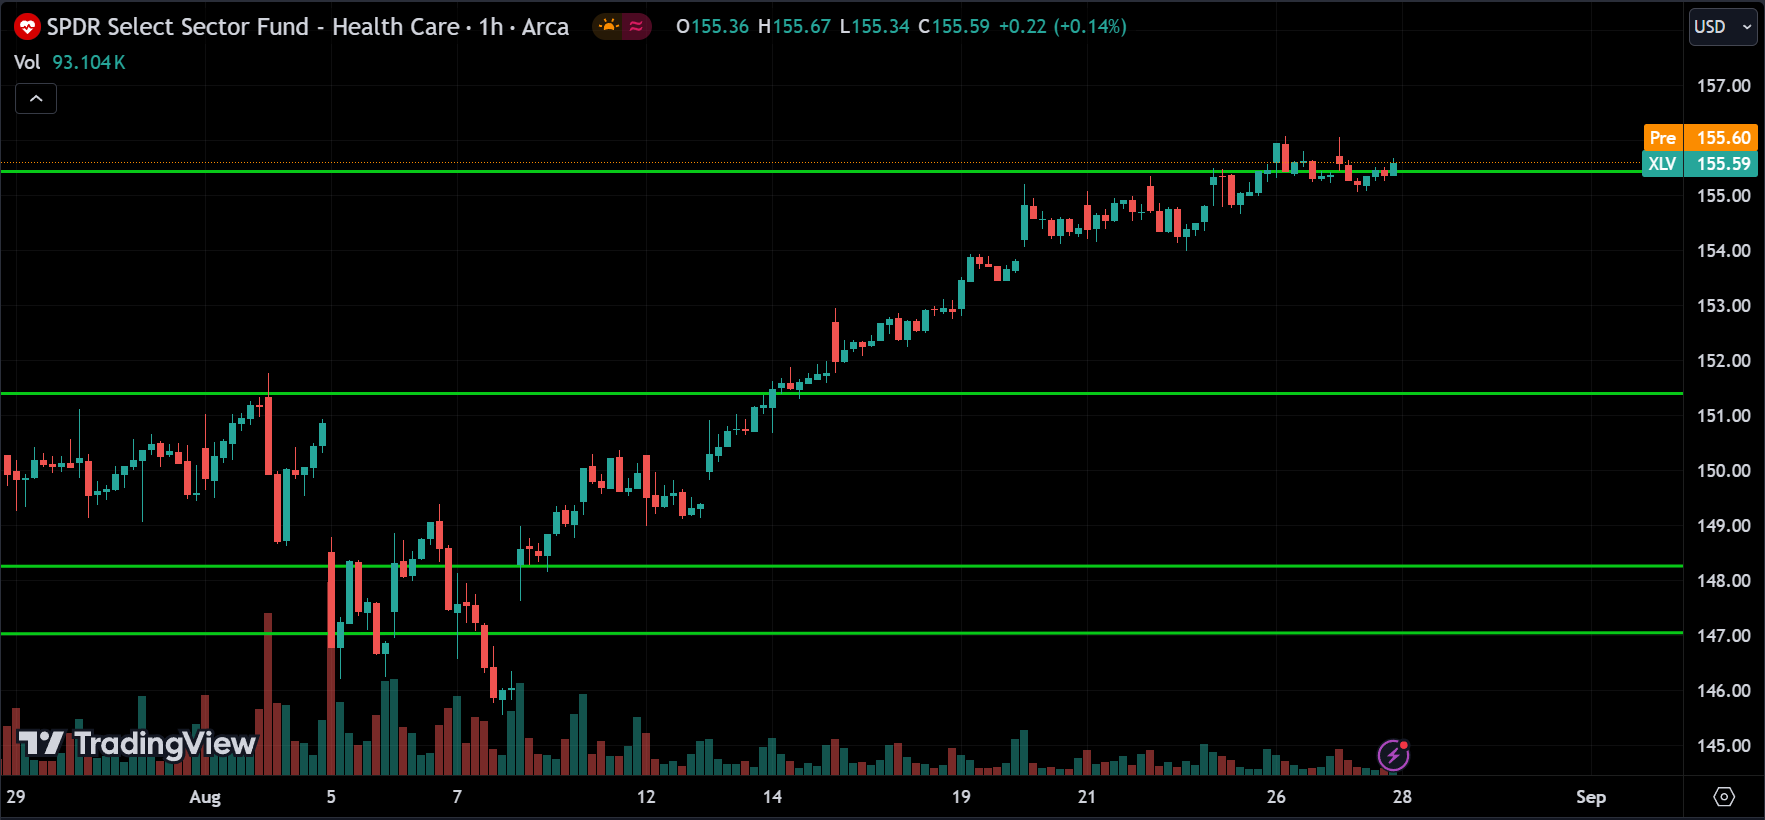
The Healthcare sector or XLV ETF is also trending up, with the price consolidating a bit on the 1-hour chart. If the uptrend continues, we can expect the price to rise above 156 and keep climbing. However, if the price drops below 154, it might continue falling toward 152.
Financials Sector(XLF):
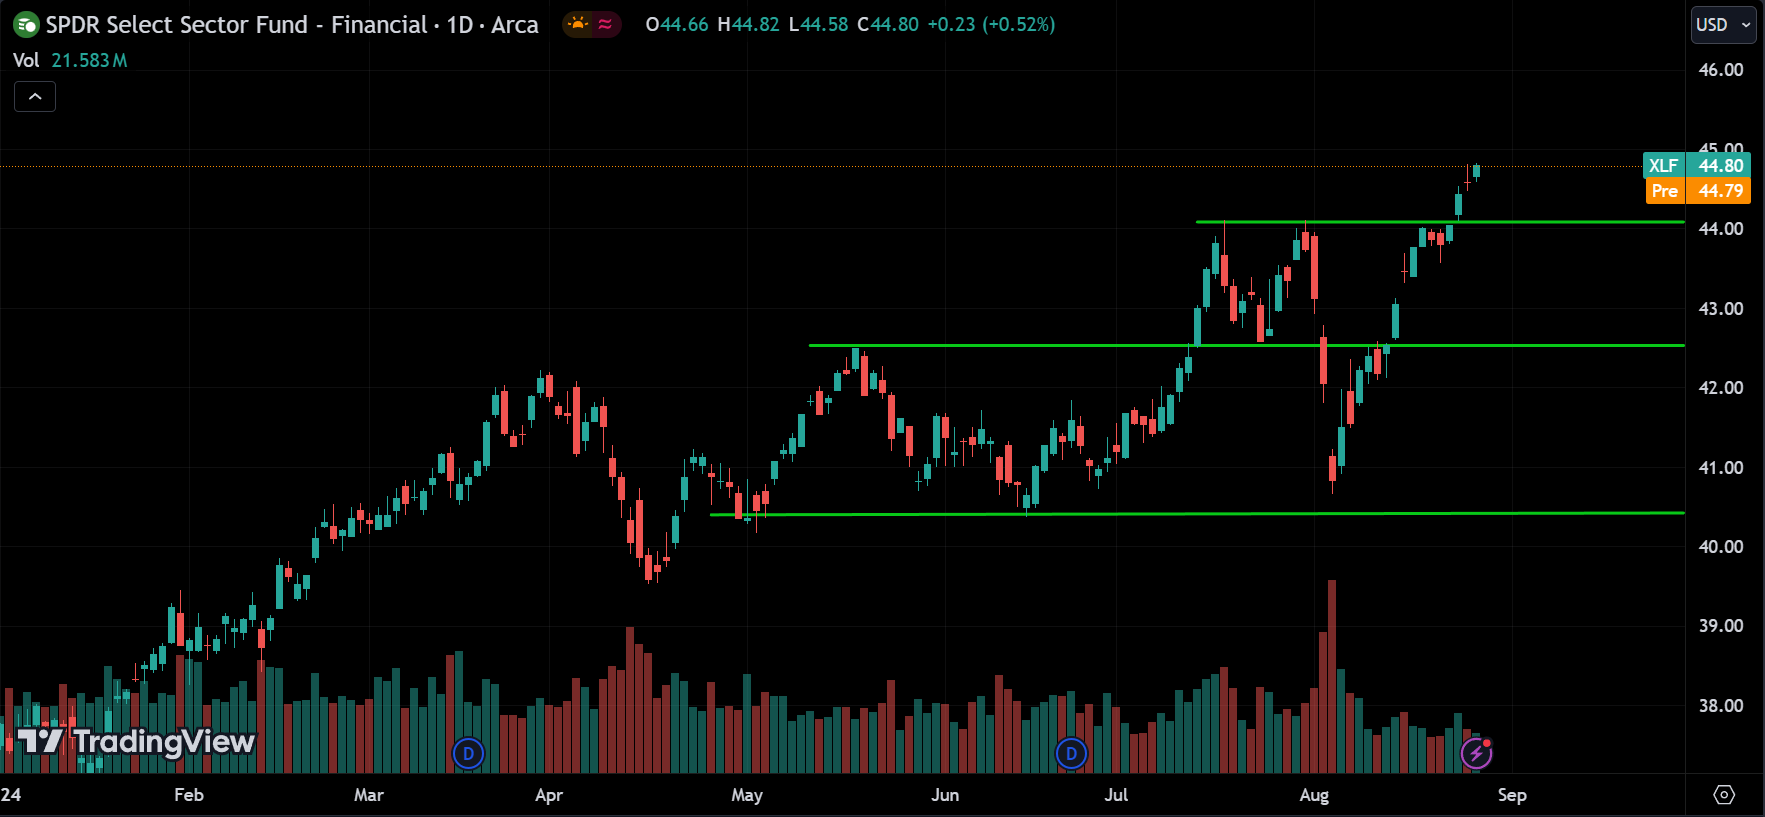
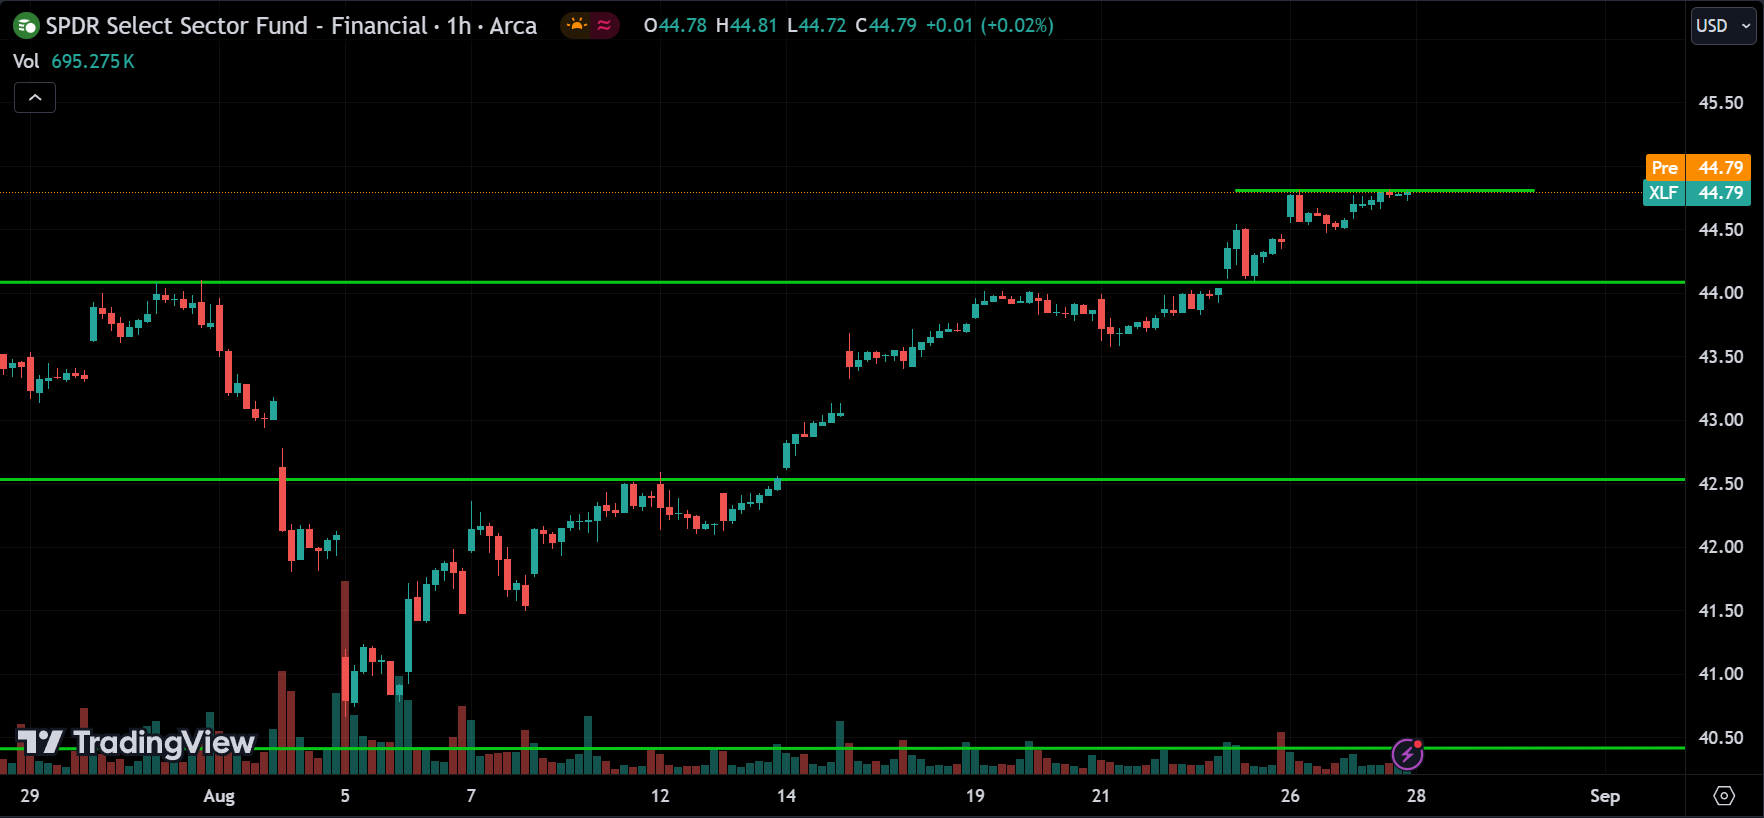
The Financial sector or XLF ETF is also trending up, with the price currently at the resistance level of 44.80. We can expect the price to break above this resistance and continue rising. However, if the price starts to drop and breaks below the 44 level, it could fall toward 42.50.
Technology Sector(XLK):
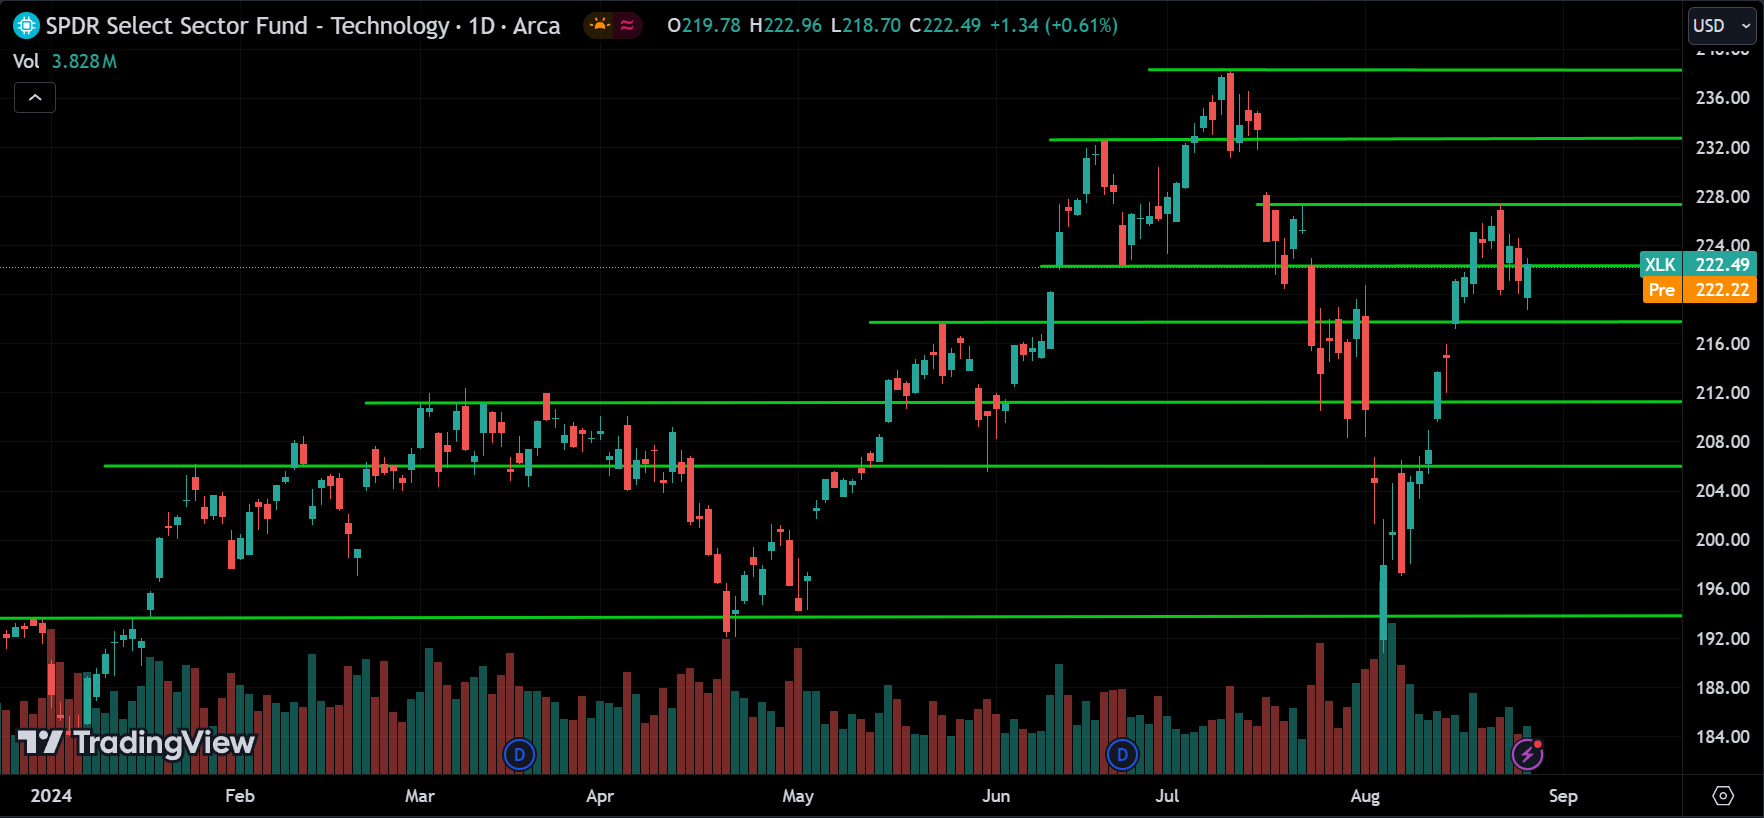
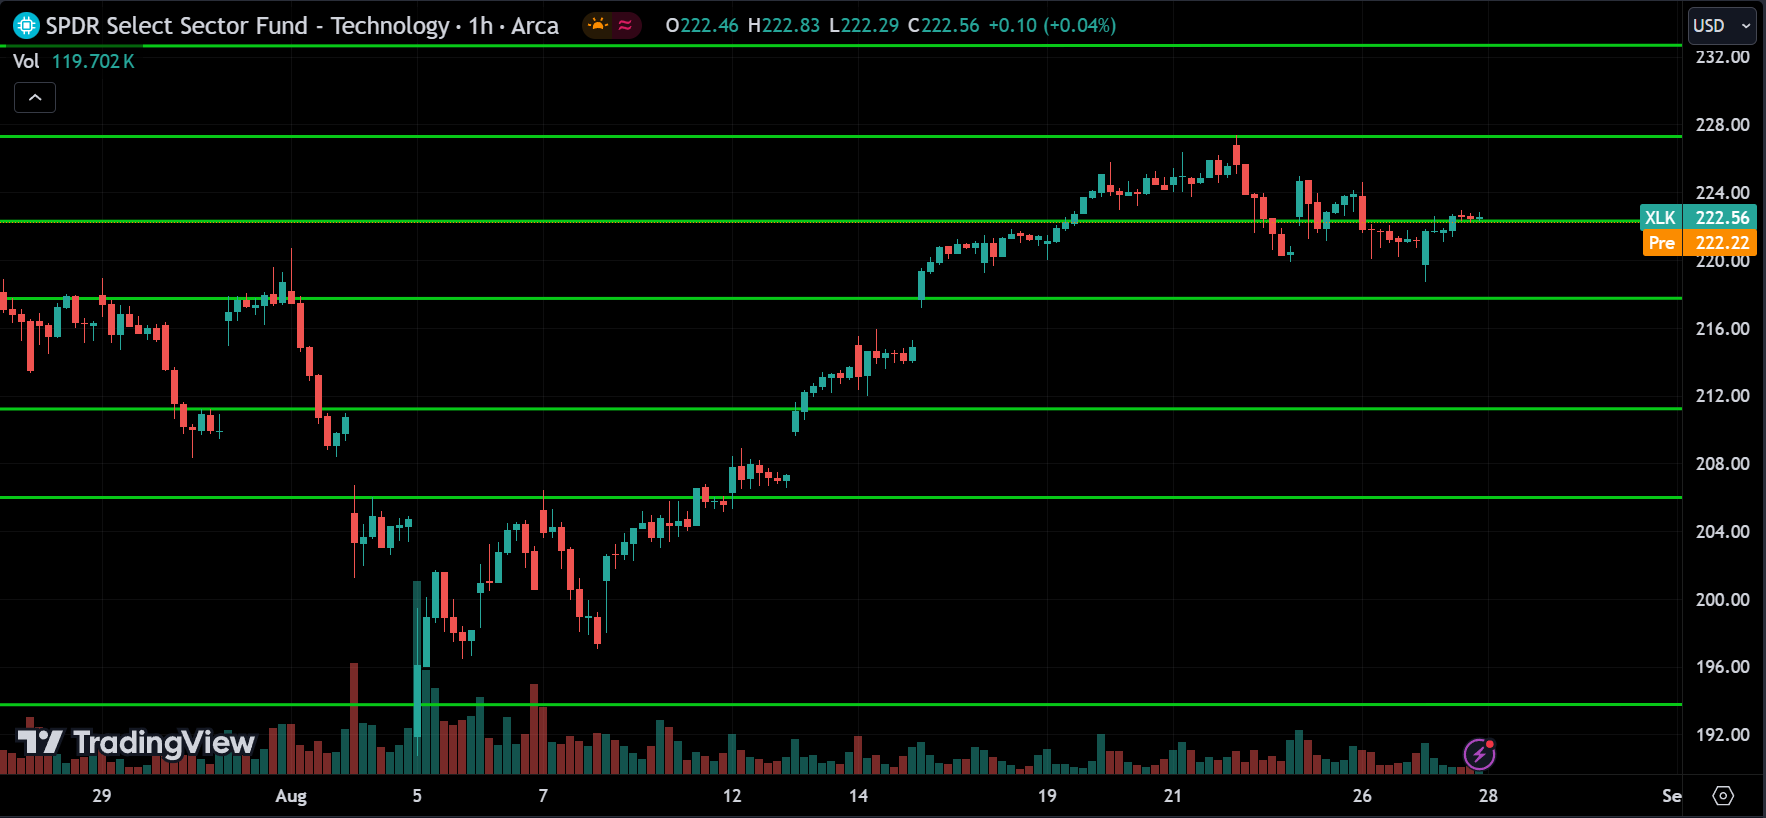
The Technology sector or XLK is also trending up, but on the 1-hour chart, the price has pulled back from the 228 resistance and is now consolidating above 216. If the price breaks above 228, the uptrend is likely to continue. However, if the price breaks below 216, it could keep dropping toward 212.
Communications Sector(XLC):
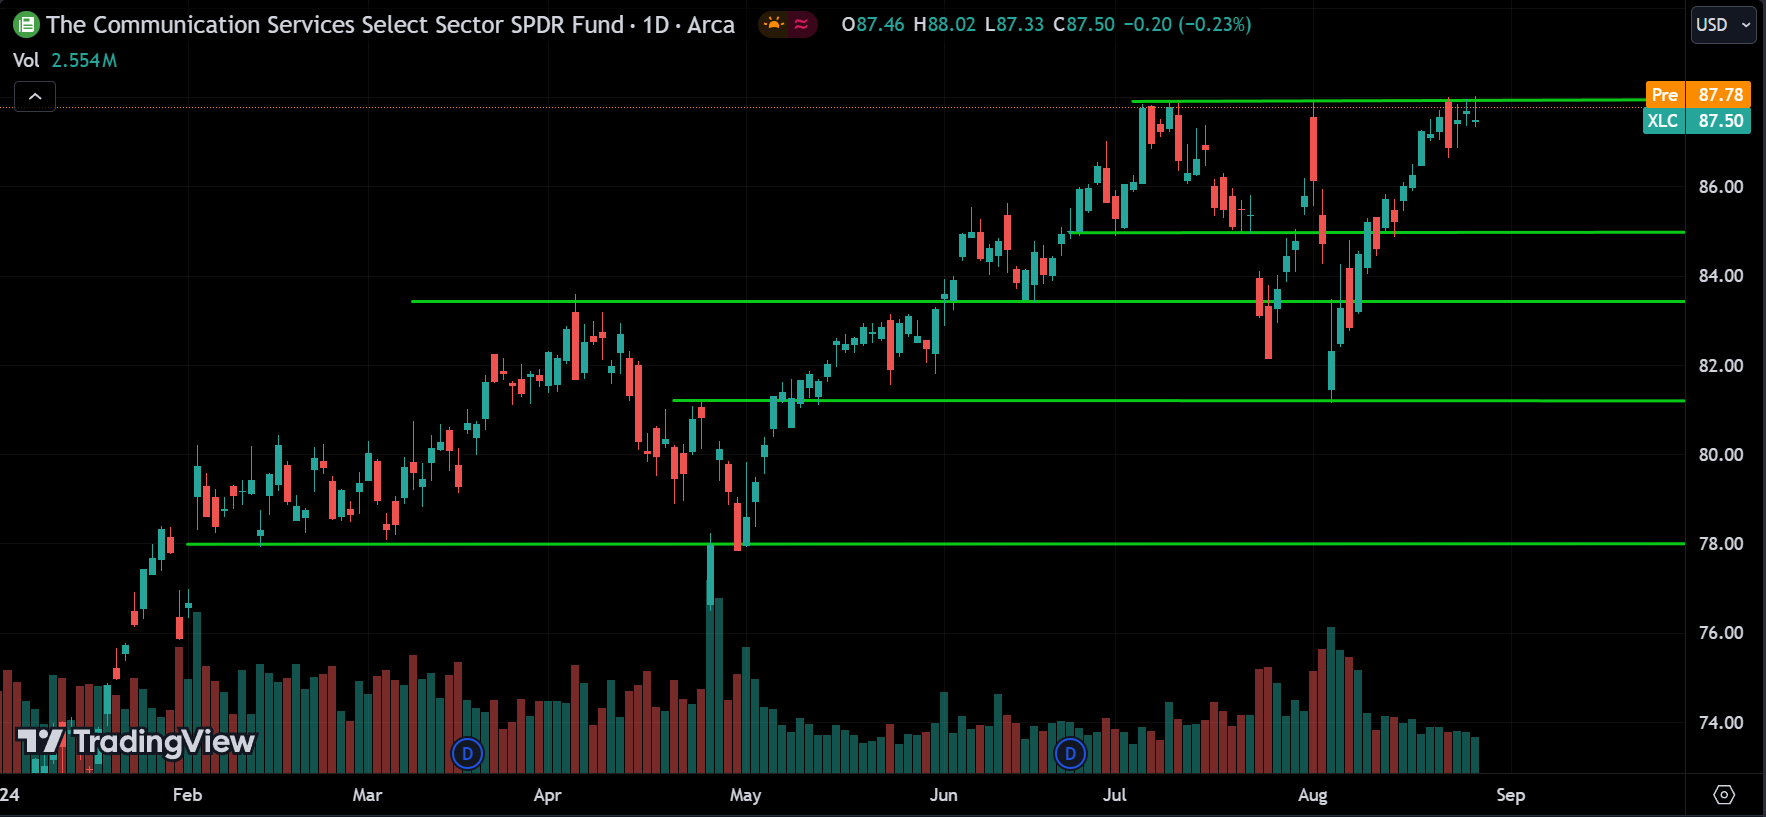
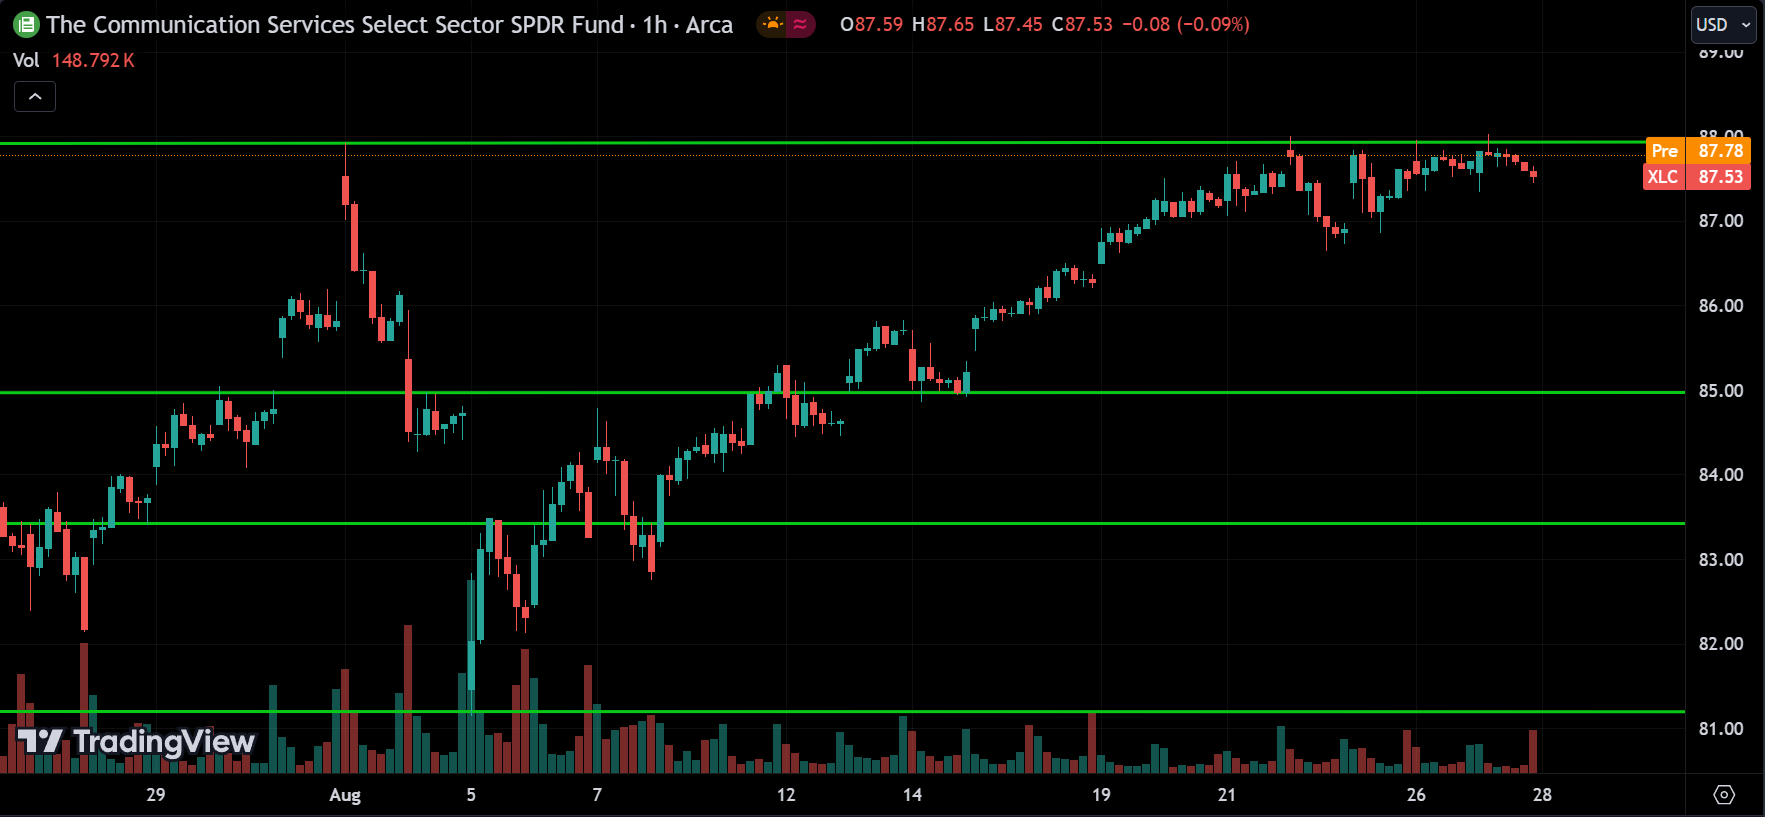
The Communication sector or XLC ETF is also trending up. On the 1-hour chart, the price is at the major resistance level of 88 and consolidating. We might see a pullback with the price dropping to 85, or the price could break above the 88 resistance level and continue its uptrend.
Utility Sector(XLU):
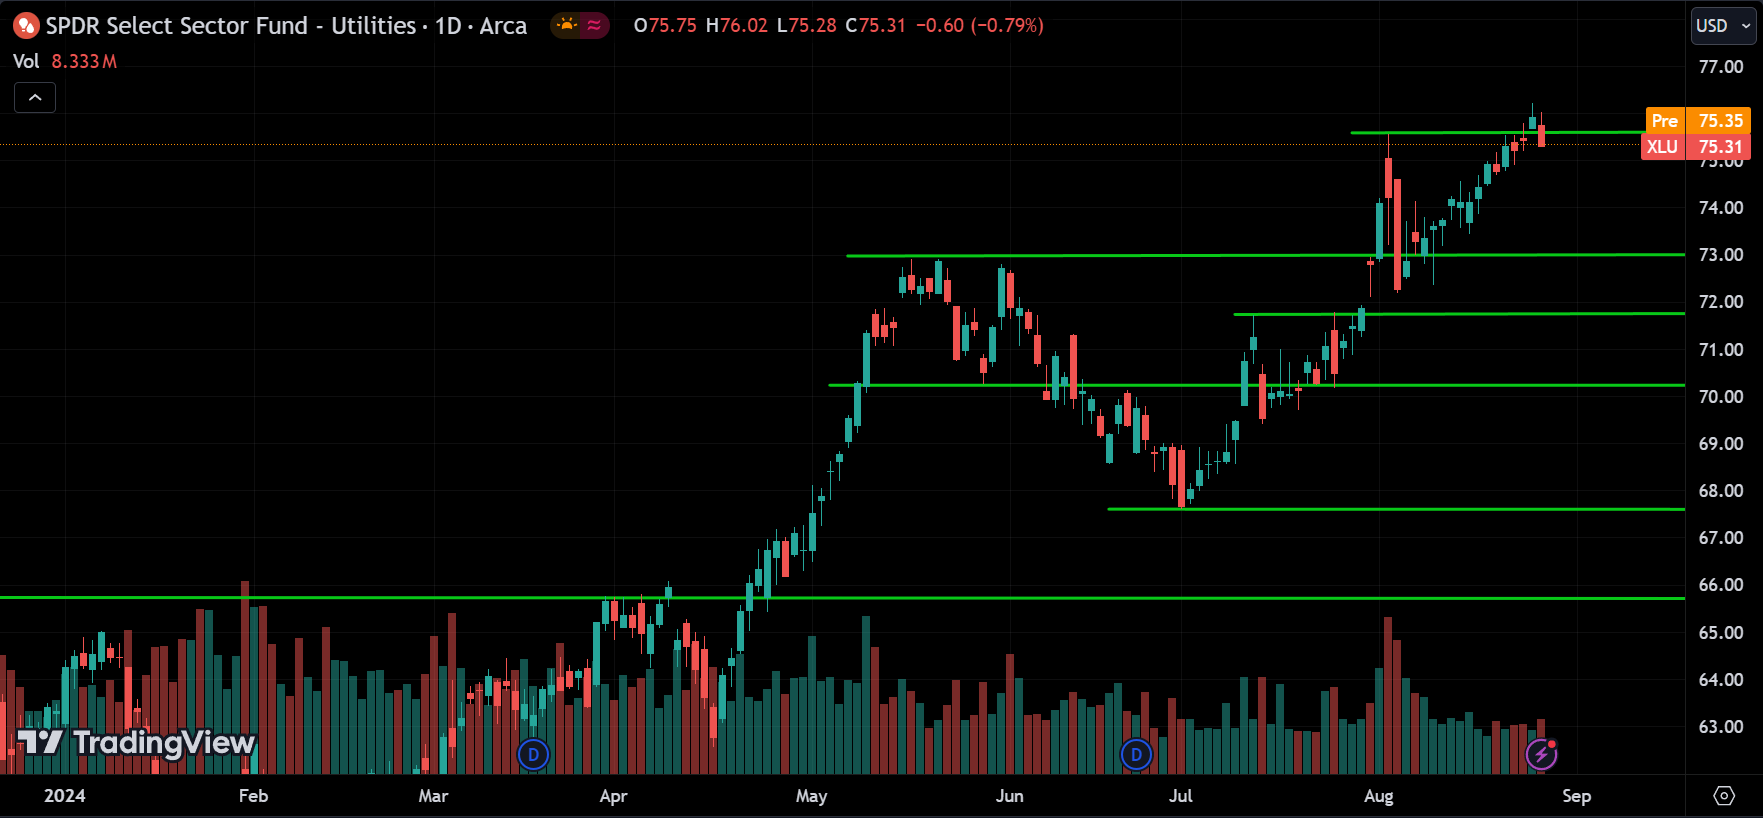
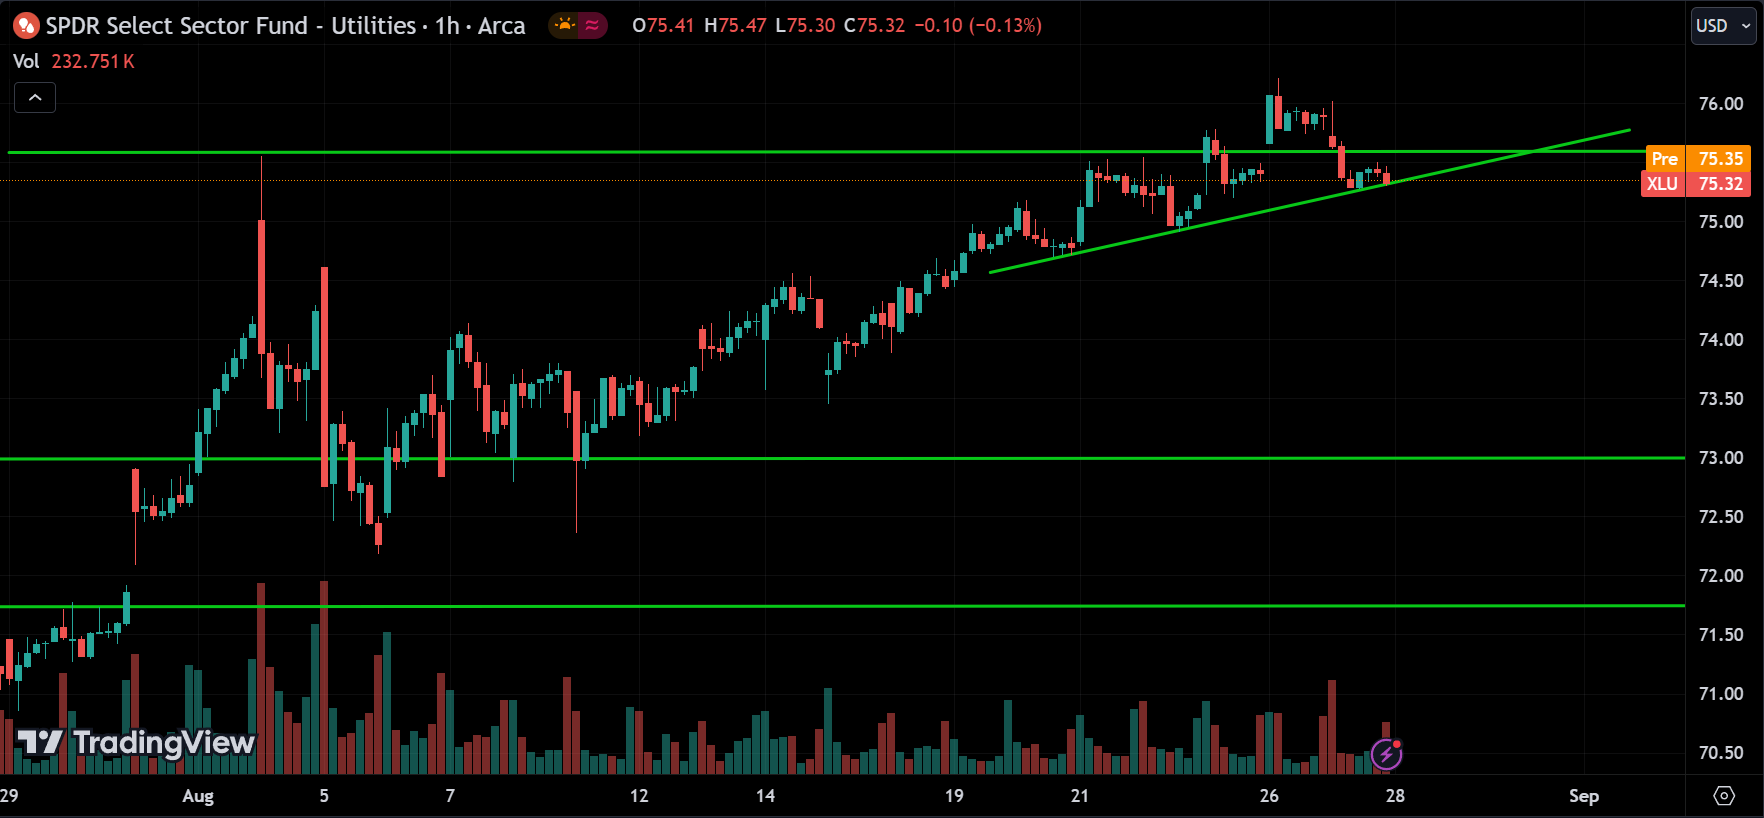
The Utilities sector or XLU is clearly uptrending, with a steady climb visible on the chart. We can expect this momentum to continue. However, watch out for the price breaking below the trend line, as that could signal a correction phase.
Real Estate Sector(XLRE):
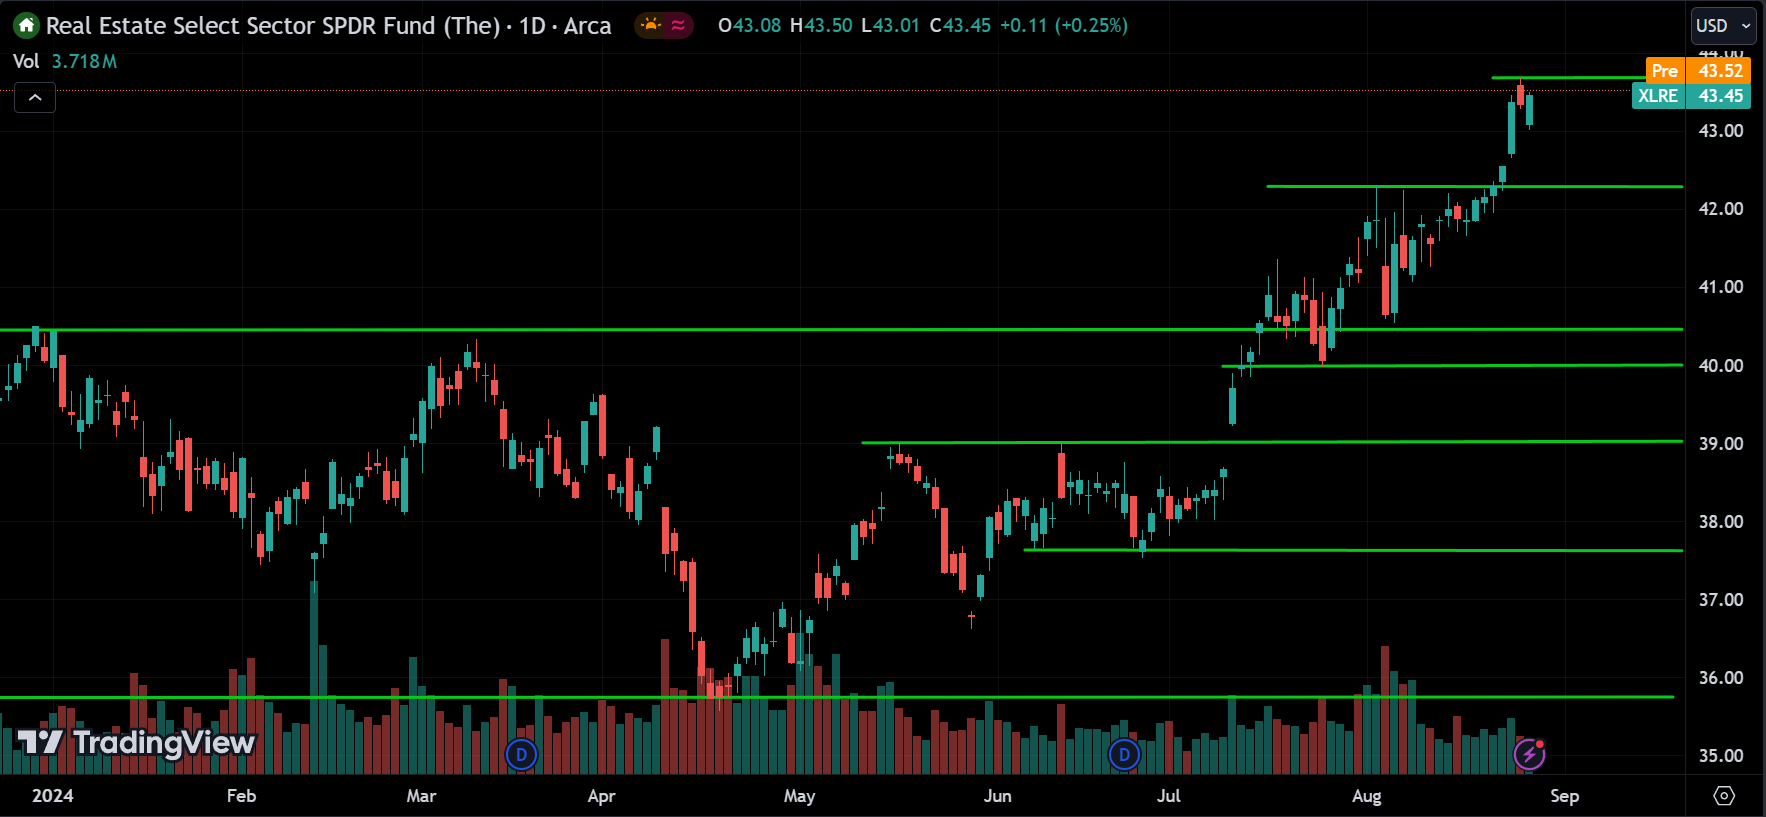
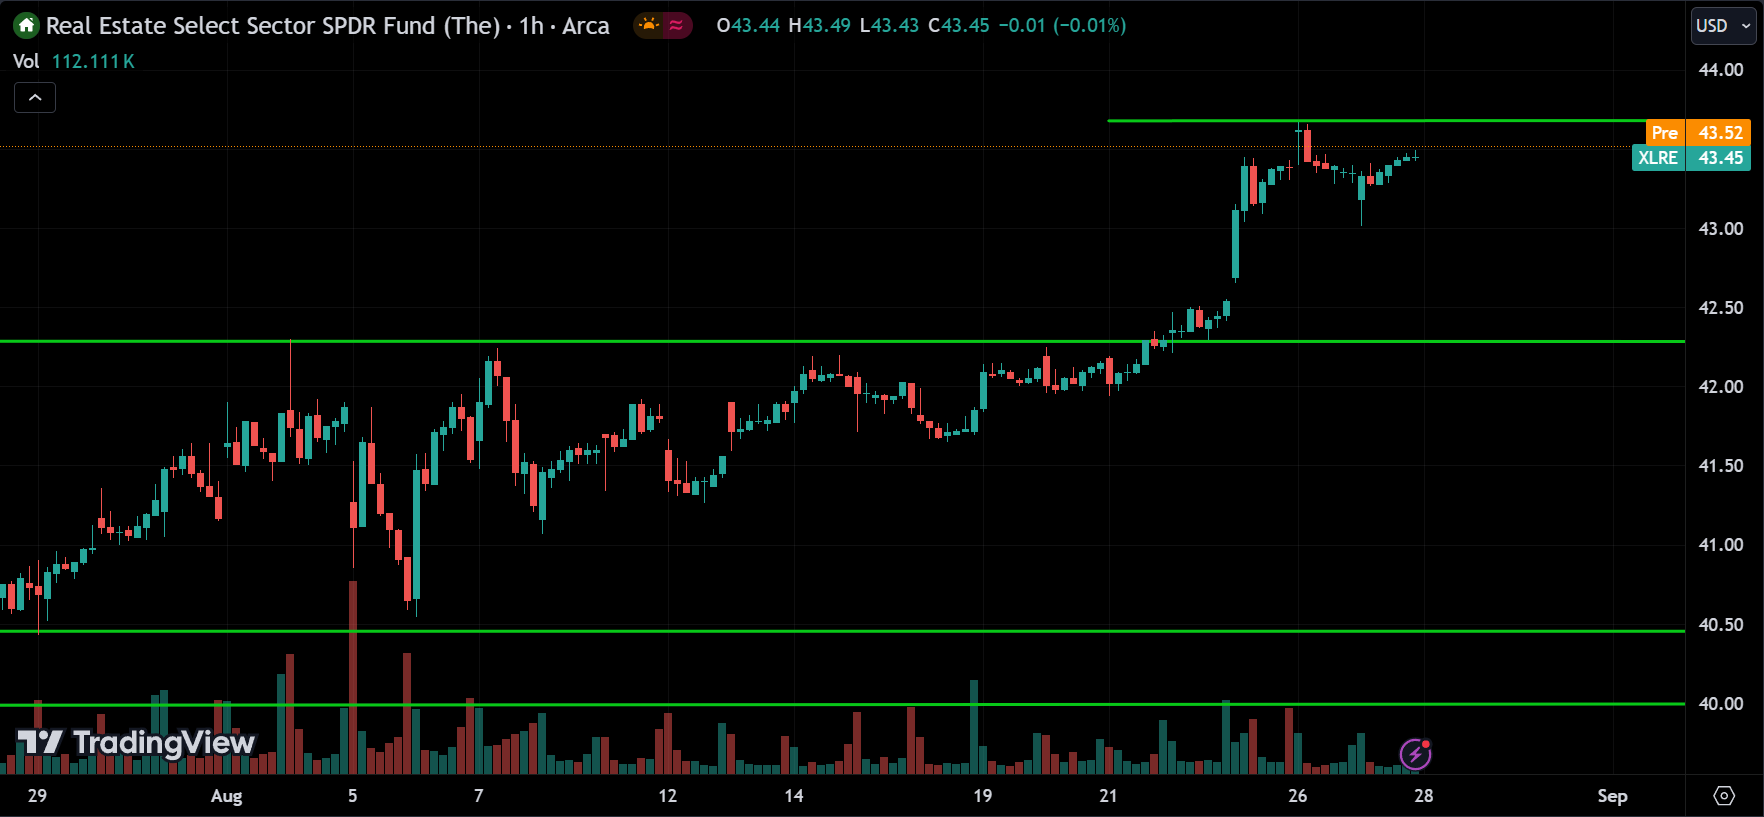
The Real Estate sector or XLRE ETF is trending up, with the price currently at the resistance level of 43.60. If the price breaks above this level, we can expect the uptrend to continue. However, we might also see a pullback toward 42.50.
Stocks to Watch Today
Nvidia(NVDA):
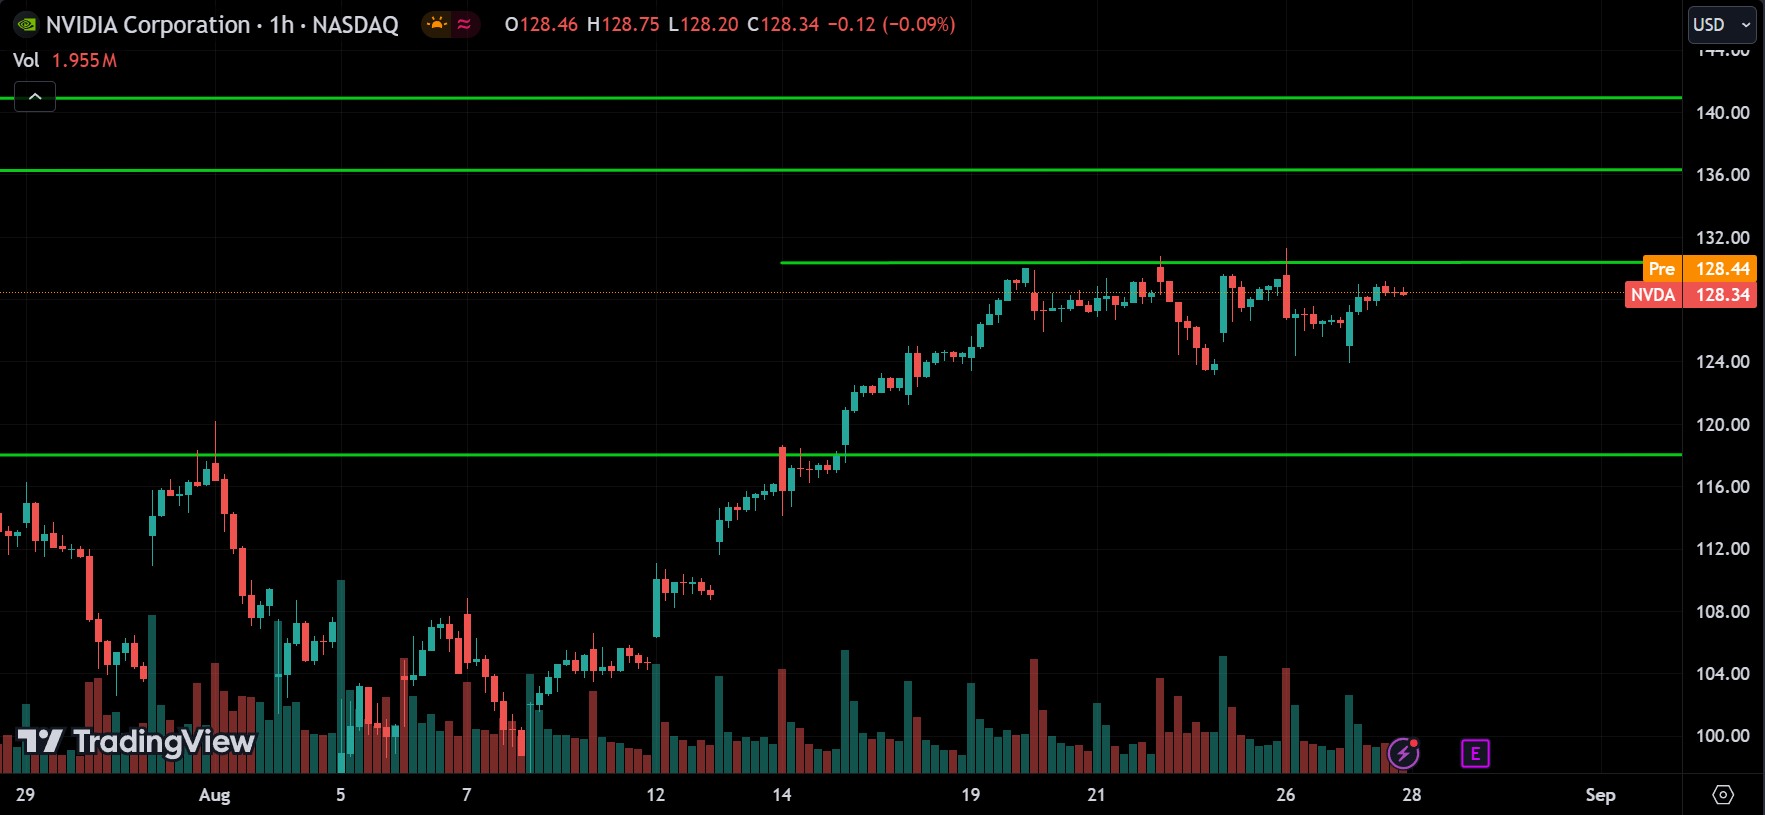
Nvidia is reporting earnings today after the close, and I expect them to beat the estimates, which could push the price up. However, anything can happen, and the market will adjust based on expectations today. Right now, the price is at the 132 resistance level and consolidating. If the price breaks above 132, we could see it continue up towards 136, and if that level is broken, then to 140. On the other hand, we might also see a pullback to the 124 support level, and if that level is broken, then down to 120.
Qualcomm(QCOM):
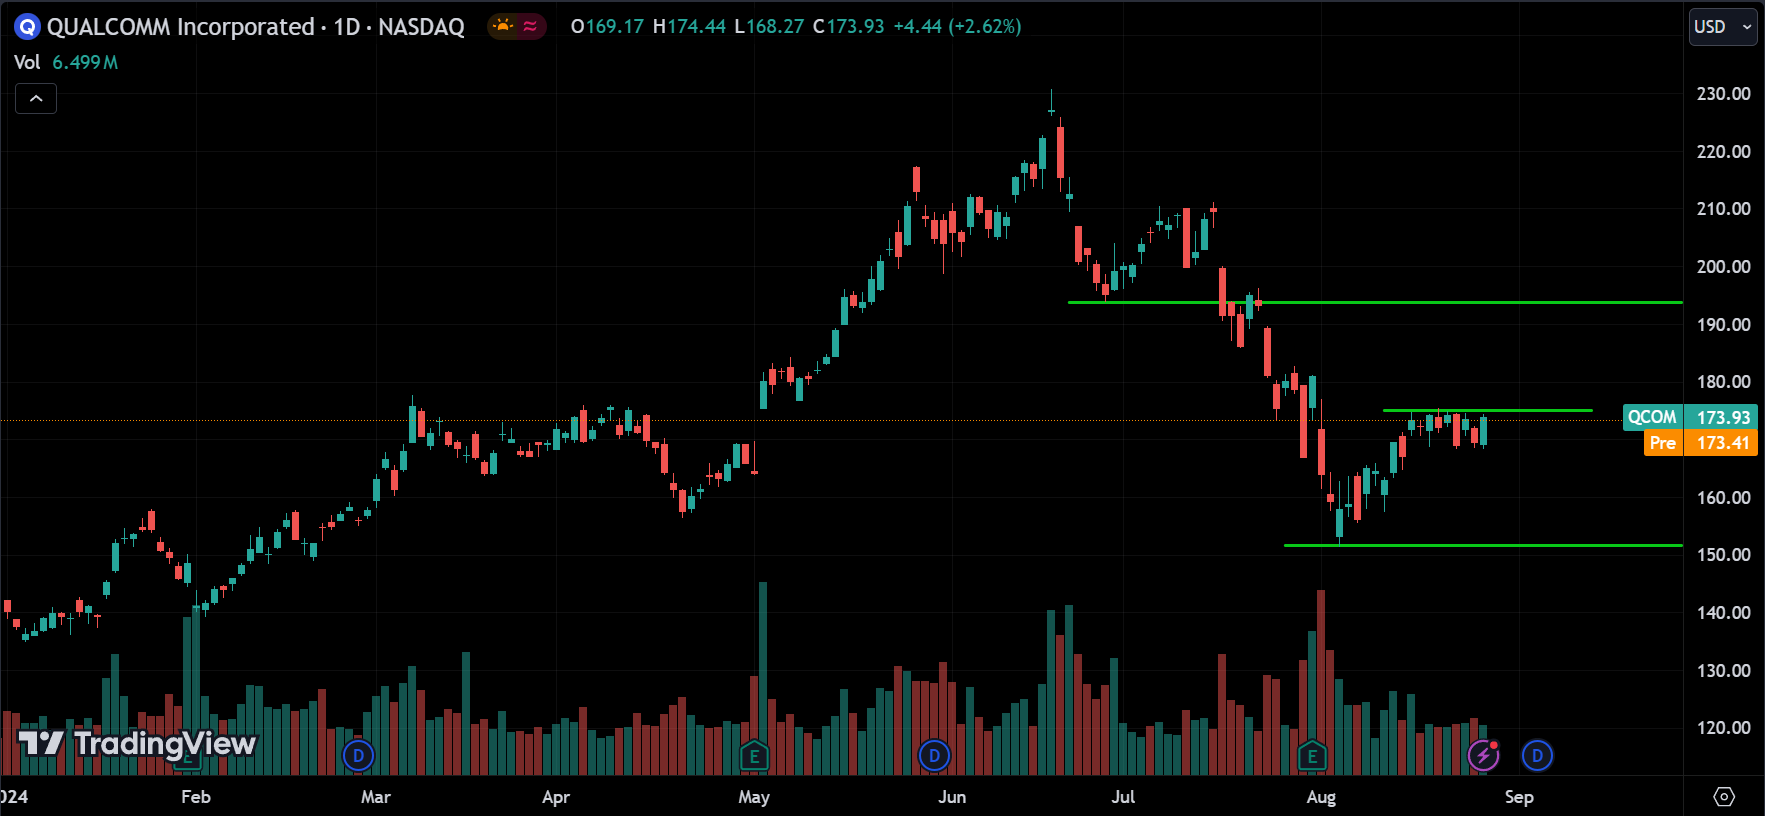
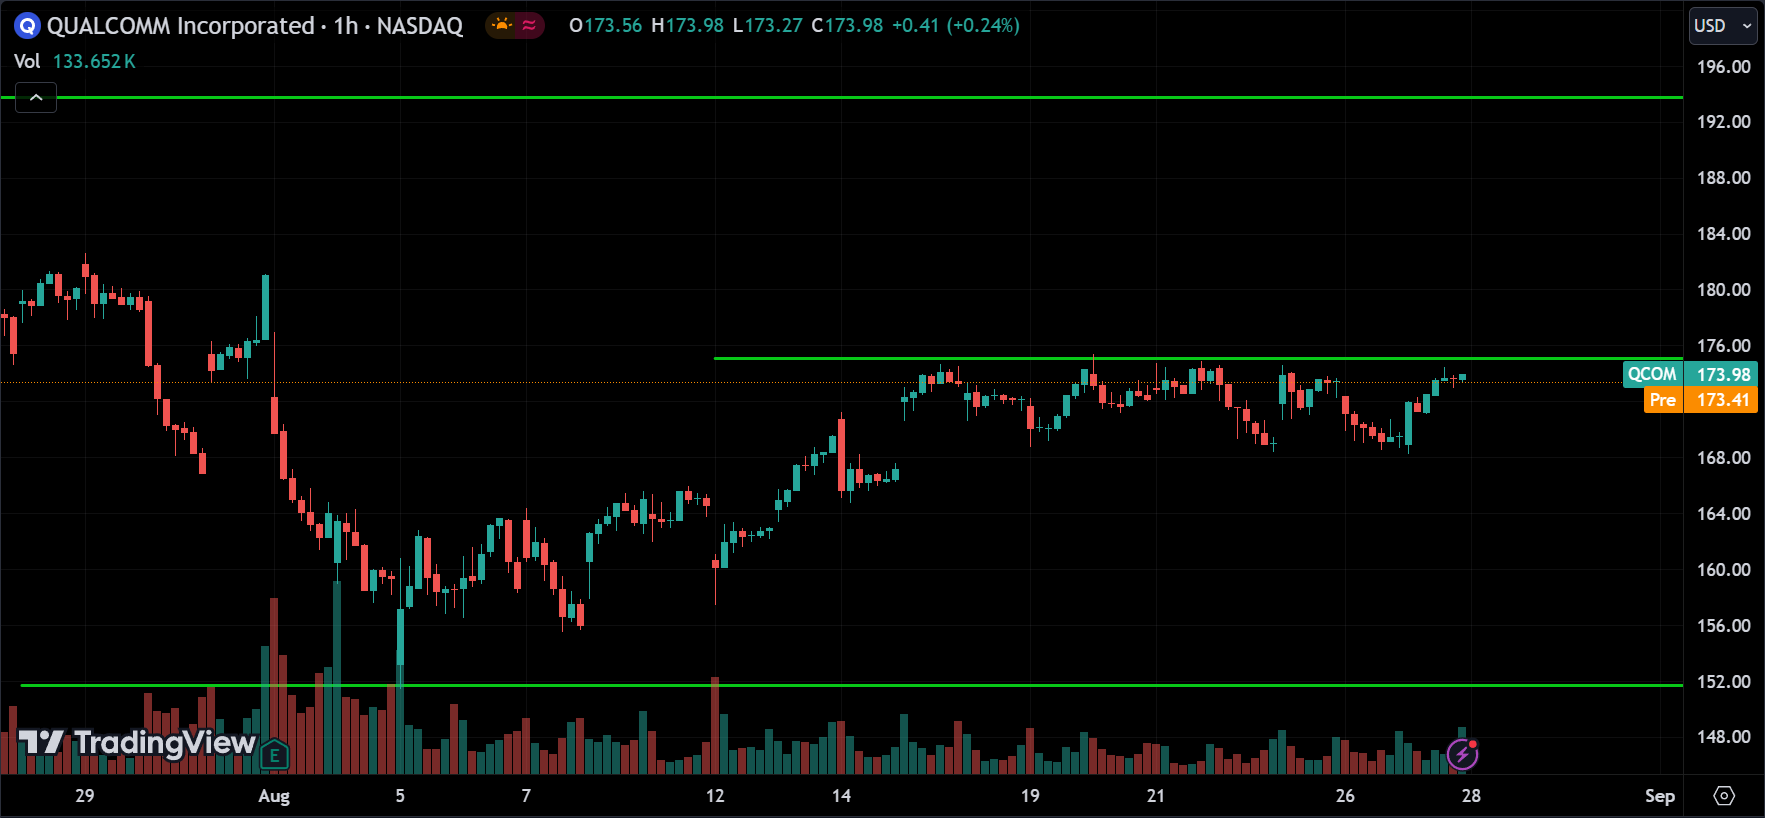
Qualcomm is trending down and currently in a correction phase. The price is consolidating around the 176 resistance level. If the price breaks above this resistance, we can expect it to keep rising toward 196, signaling a reversal and an uptrend. However, if the price pulls back from the resistance, it could drop to the 168 support level, and if that level is broken, the downtrend could continue toward 152.
Analog Devices(ADI):
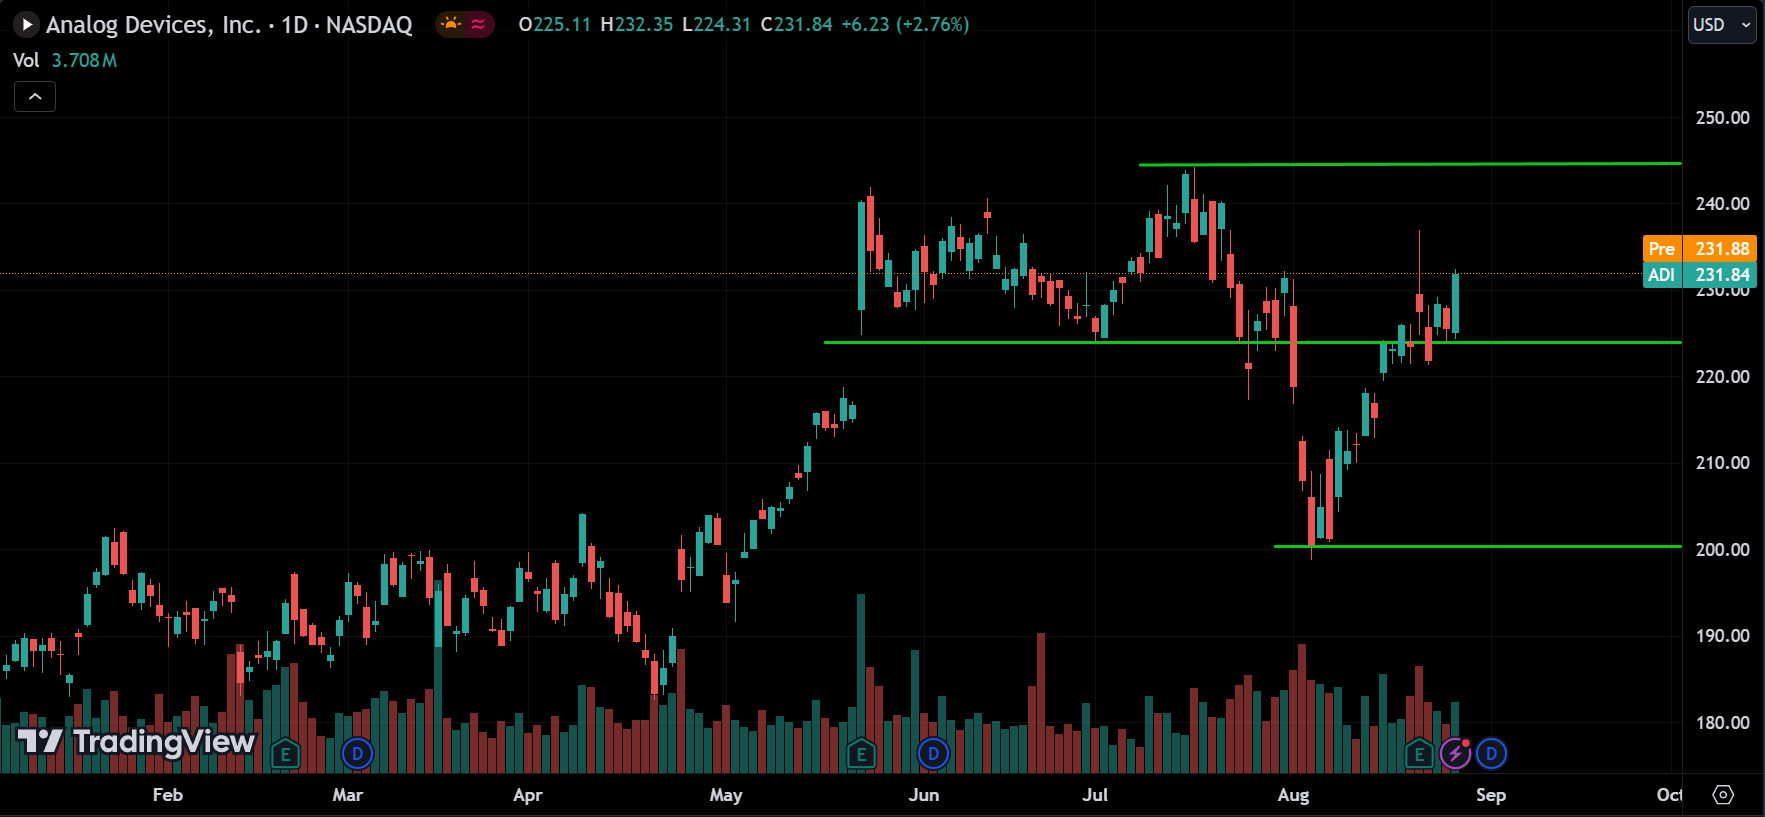
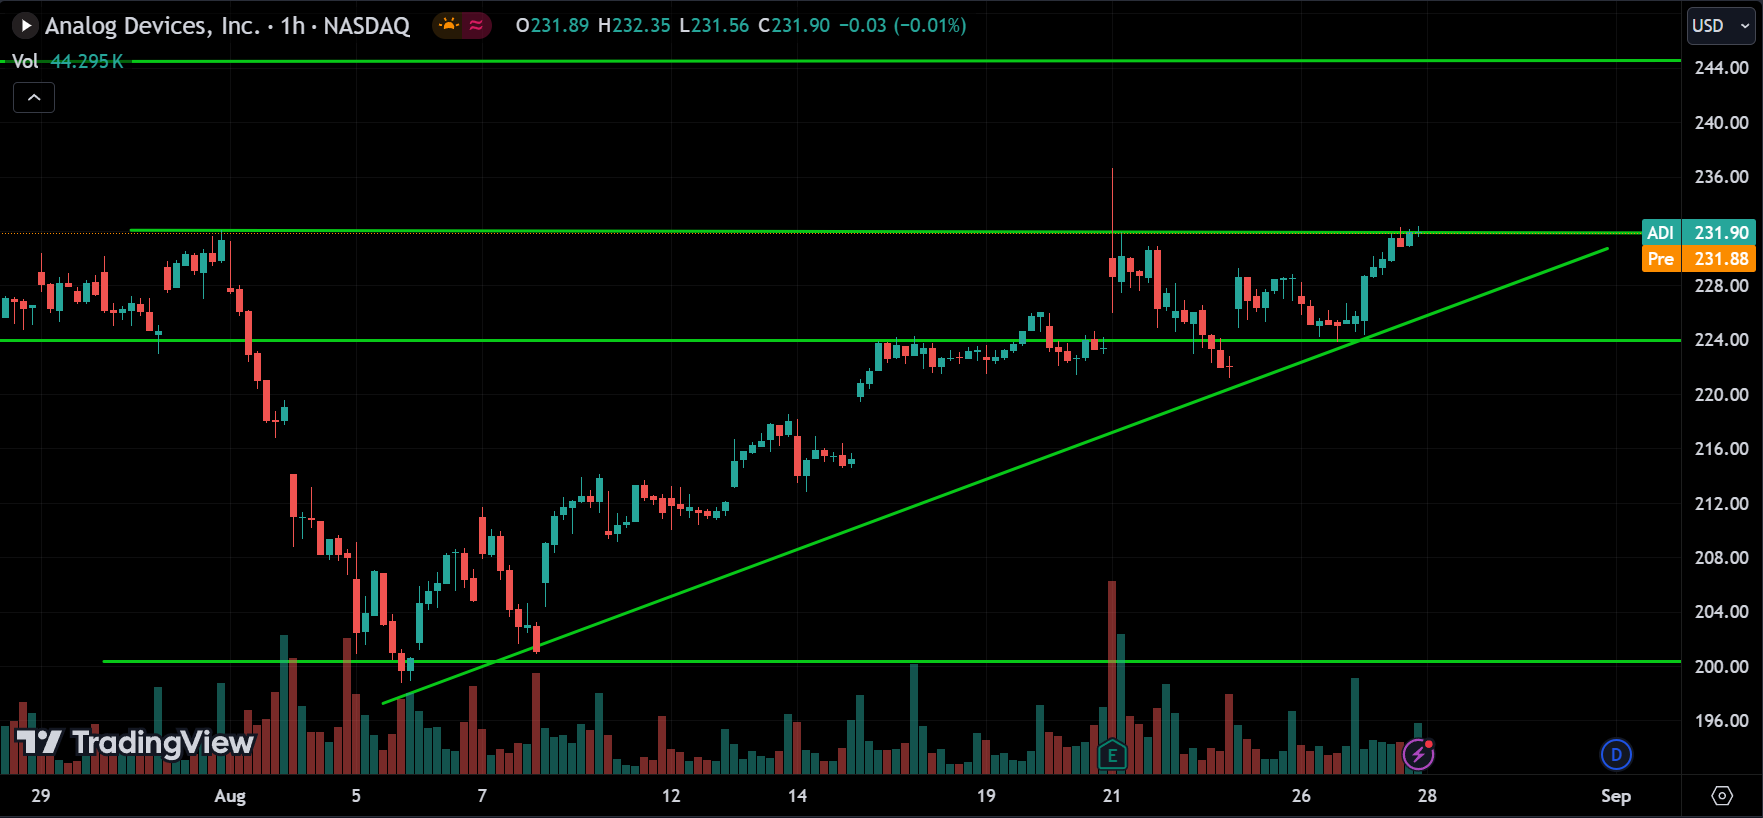
Analog Devices (ADI) is trending up, with the price currently at the resistance level of 232. It’s now heading toward the major resistance at 244, and we can expect this momentum to continue. However, watch out for the price breaking below this level, which could lead to a drop to 224. If the price falls below 224, it would signal a correction phase for this stock.
Starbucks(SBUX):
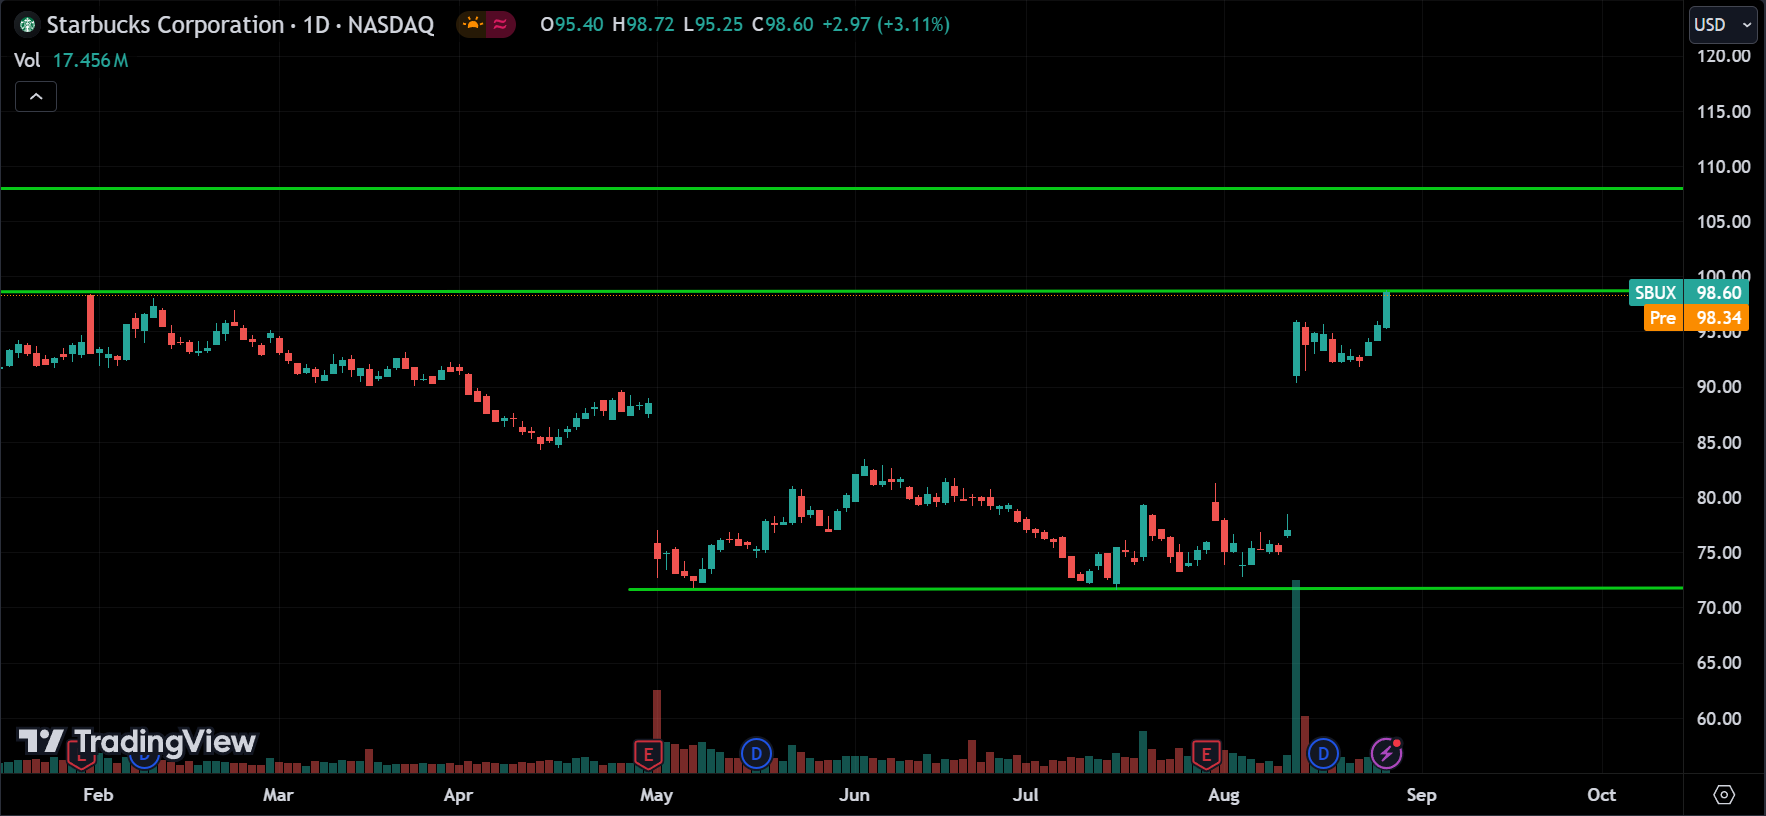
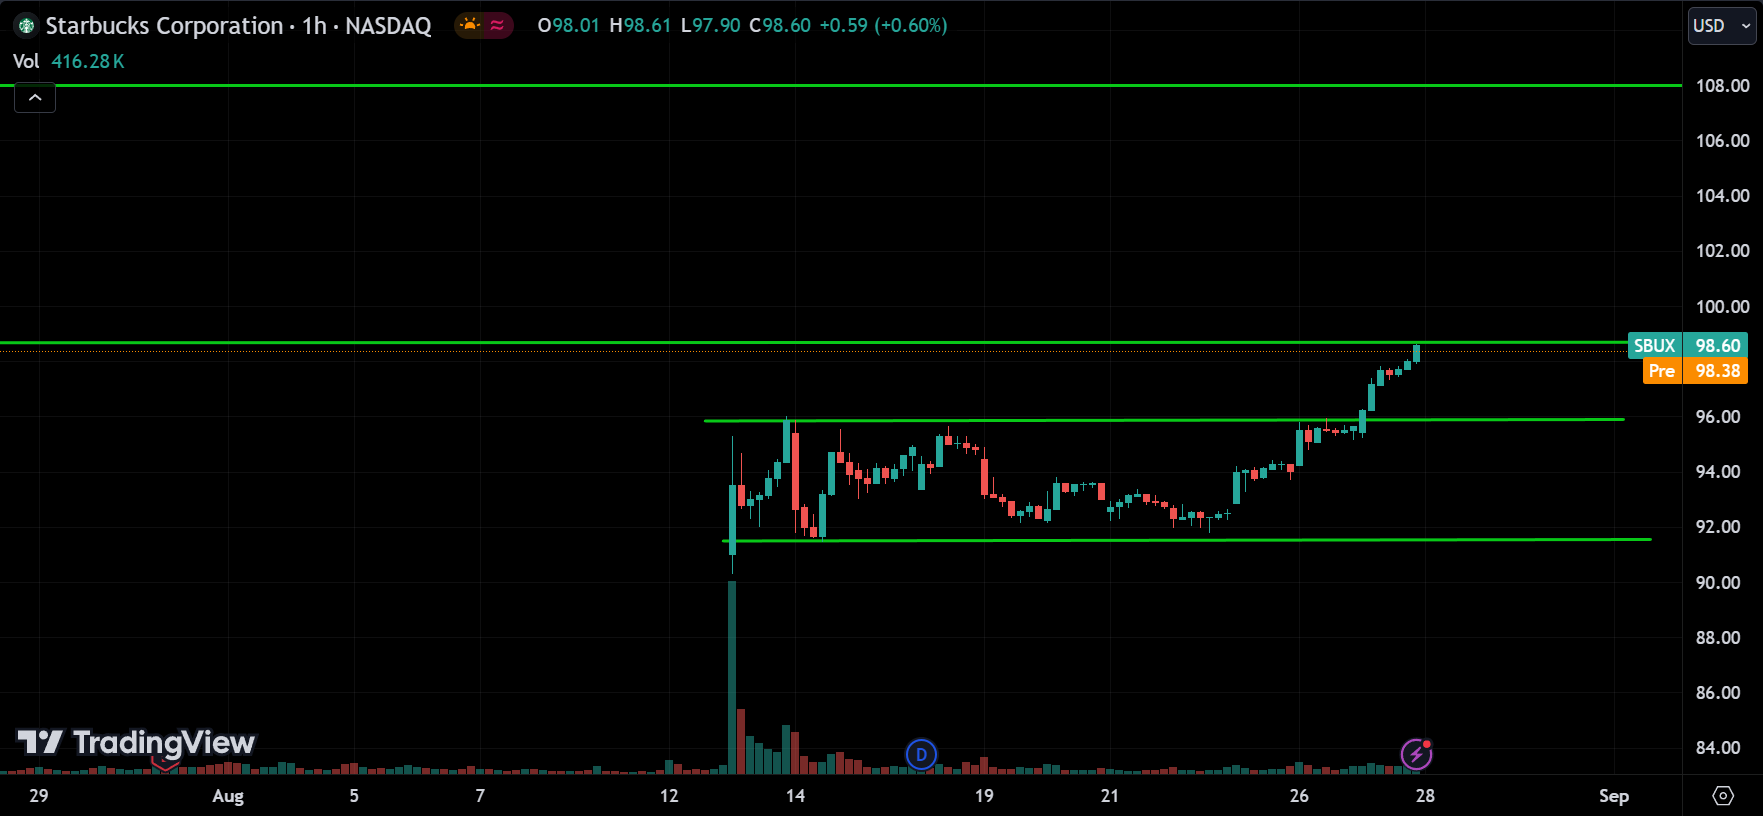
Starbucks gapped up, consolidated for a while, and then broke above resistance. It’s now at another resistance level around 100. If the price breaks above this level, we can expect it to continue toward 108. However, watch out for the price breaking below 96, as this could signal a correction phase, with the price potentially dropping toward 92.
Conclusion & Disclaimer
Subscribe to our Telegram channel to get instant updates on new articles.
Please provide your feedback on how we can improve this article. Thank you!
We discussed these sectors and markets because when the entire market or sector goes through certain movements, most of the stocks within that market will also experience similar movements. So, by understanding what the market is doing, you can conduct your own analysis on specific stocks.
These analyses are here to help you understand how to analyze the market. They’re not about giving buy or sell signals. It’s simply about observing price action market behavior. I don’t recommend when to buy or sell because trading doesn’t work that way. You need a strategy to guide your decisions about when to enter or exit positions. That’s the key to making consistent profits in the financial markets over time.
The information provided in this market analysis is for educational and informational purposes only. It should not be construed as financial advice or a recommendation to buy, sell, or hold any securities or investments.
All investments involve risk, and past performance is not indicative of future results. The analysis provided may not be suitable for all investors and should be used at their own discretion.
Readers are encouraged to conduct their own research.
Trading and investing in financial markets carry inherent risks, including the risk of losing invested capital. It is important to carefully consider your investment objectives, risk tolerance, and financial situation before making any investment decisions.
GOOD LUCK✌!!!