![US Stock Market Today [2024.08.29]: Key Price Levels and Trends for S&P 500, Dell, Nvidia & Berkshire's $1 Trillion Financial Giant
xlearnonline.com](https://xlearnonline.com/wp-content/uploads/2024/08/Fundamental-2.png)
Hello, and welcome to xlearn’s US stock market today article series. If this is your first time here, I recommend reading our guide on how to use our market analysis article before diving into this one.
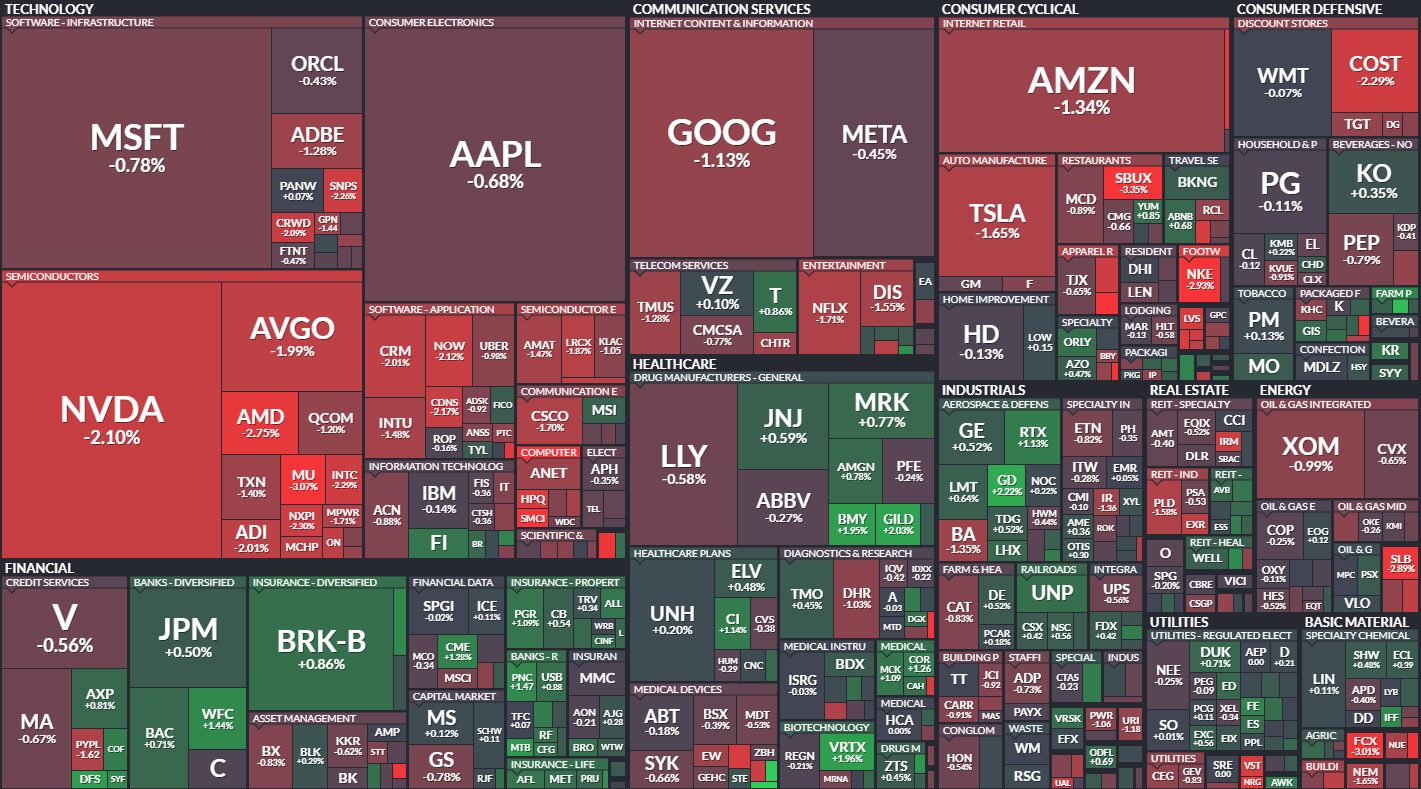
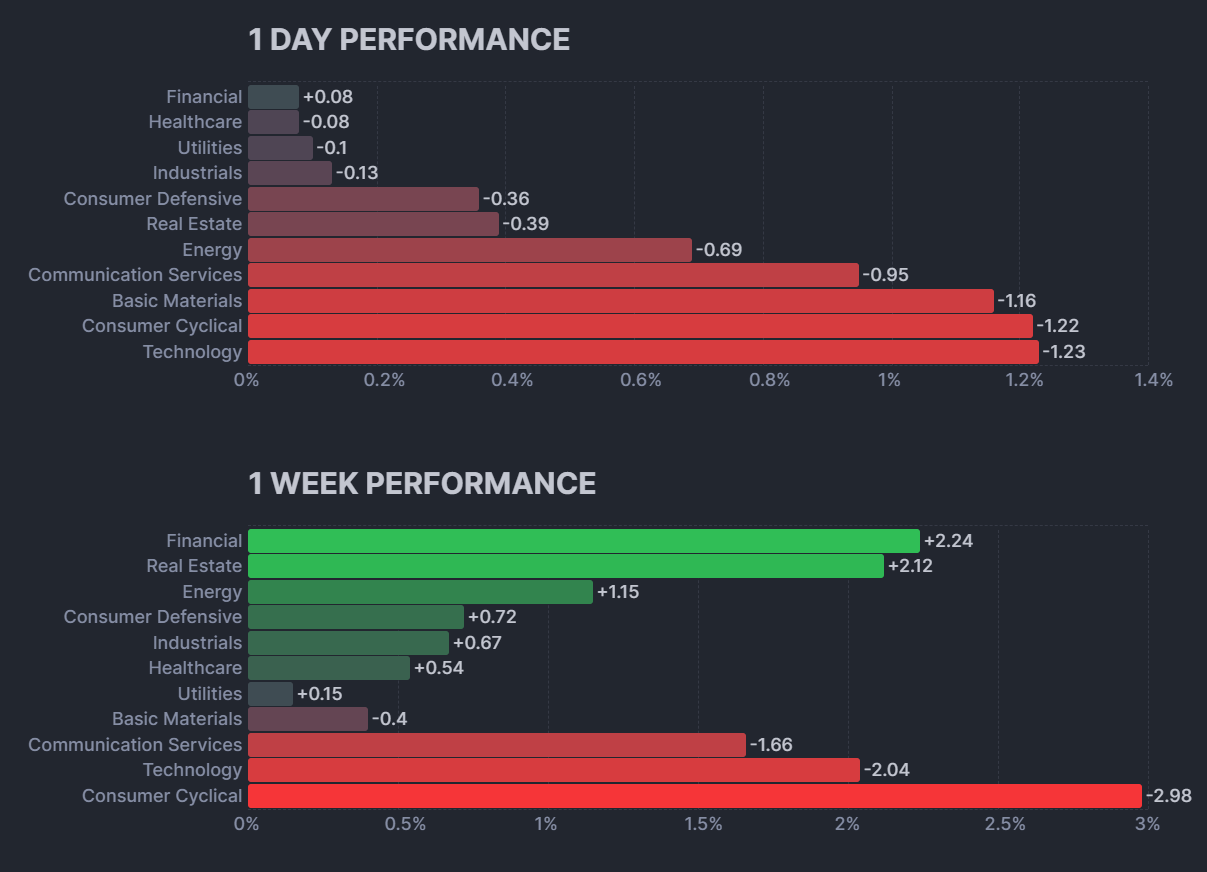
We will use a top-down approach in our analysis. First, we will analyze the overall market, focusing on the S&P 500. Then, we will analyze each sector one by one for their price action performance so we can trade stocks in those sectors with confidence. Finally, we will look at some stocks to watch for today.
Before we get into the analysis, let’s quickly review the major economic events that could impact the market.
Economic Events Today
These events include important news that could impact the stock market, macroeconomic reports, and economic indicators. For more details, you can check the bloomberg calendar & yahoo finance.
- 8:30 ET: The Preliminary GDP q/q data is being released. This report shows the annualized change in the value of all goods and services produced by the economy, with both the previous and forecast figures at 2.8%. If the ‘Actual’ number is higher than the forecast, it’s good for the currency. Although this is quarterly data, it’s reported in an annualized format (quarterly change multiplied by 4). The ‘Previous’ figure comes from the Advance release, so the ‘History’ data may seem unrelated. There are three versions of GDP released a month apart: Advance, Preliminary, and Final. The Advance release is the earliest and usually has the most impact. GDP is the broadest measure of economic activity and a key indicator of the economy’s health.
Stocks with Earnings:
| BEFORE MARKET OPEN | AFTER MARKET CLOSE |
|---|---|
| DG | DELL |
| BF-A | MRVL |
| BF-B | ADSK |
| BBY | ULTA |
| BURL | MDB |
| CPB | ESTC |
| OLLI | GAP |
| AEO | HCP |
| GMS | AMRK |
| PLAB | DDD |
| MBUU | |
| FLWS | |
| SSYS | |
| BBW | |
| MCFT | |
| TITN |
S&P 500
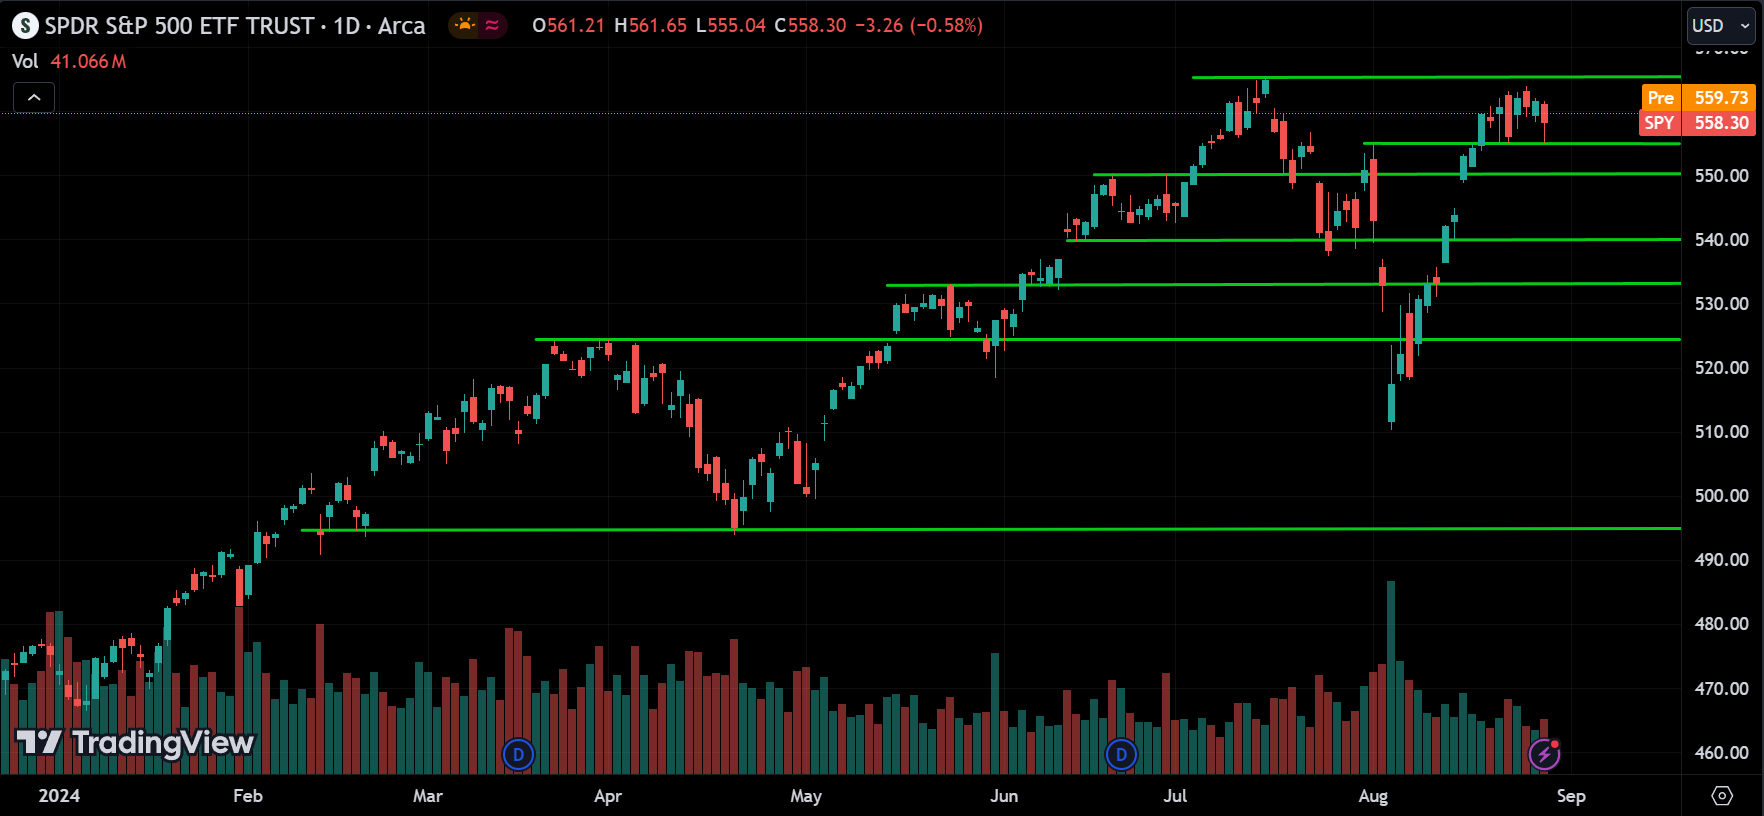
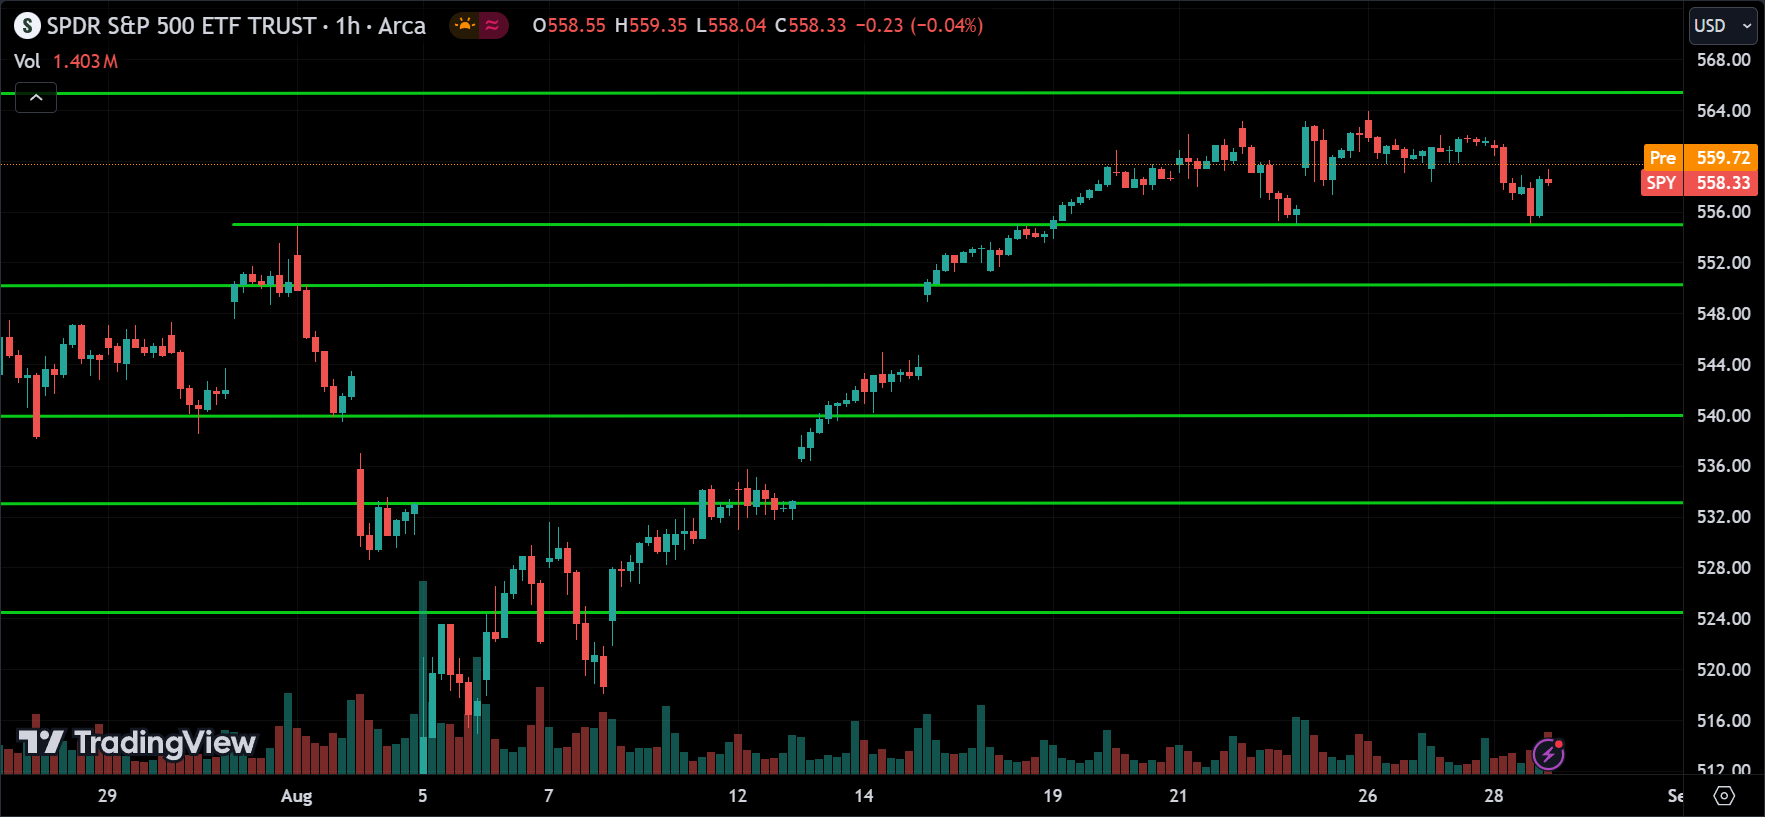
The S&P 500 or SPY ETF is in an uptrend, with the price currently consolidating between the support at 556 and the resistance at 564. The price is now pulling back from the support. Since the overall trend is bullish, we can expect the price to break above the resistance level and continue going up. However, be cautious if the price breaks below the support at 556, as this could trigger a correction phase or even a potential reversal.
Consumer Staples Sector(XLP):
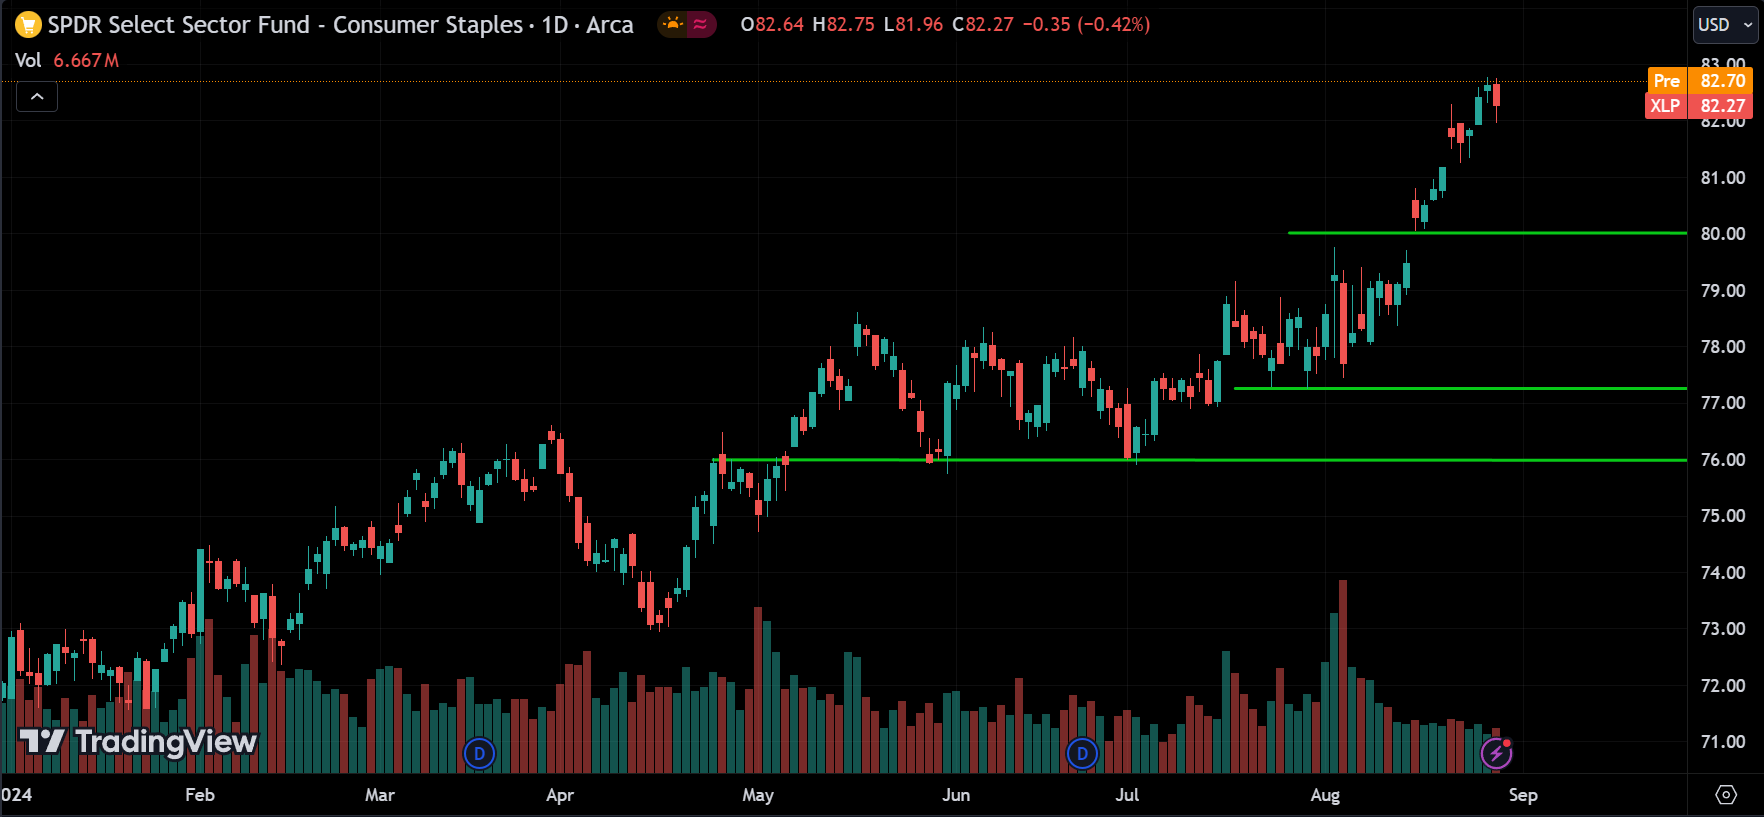
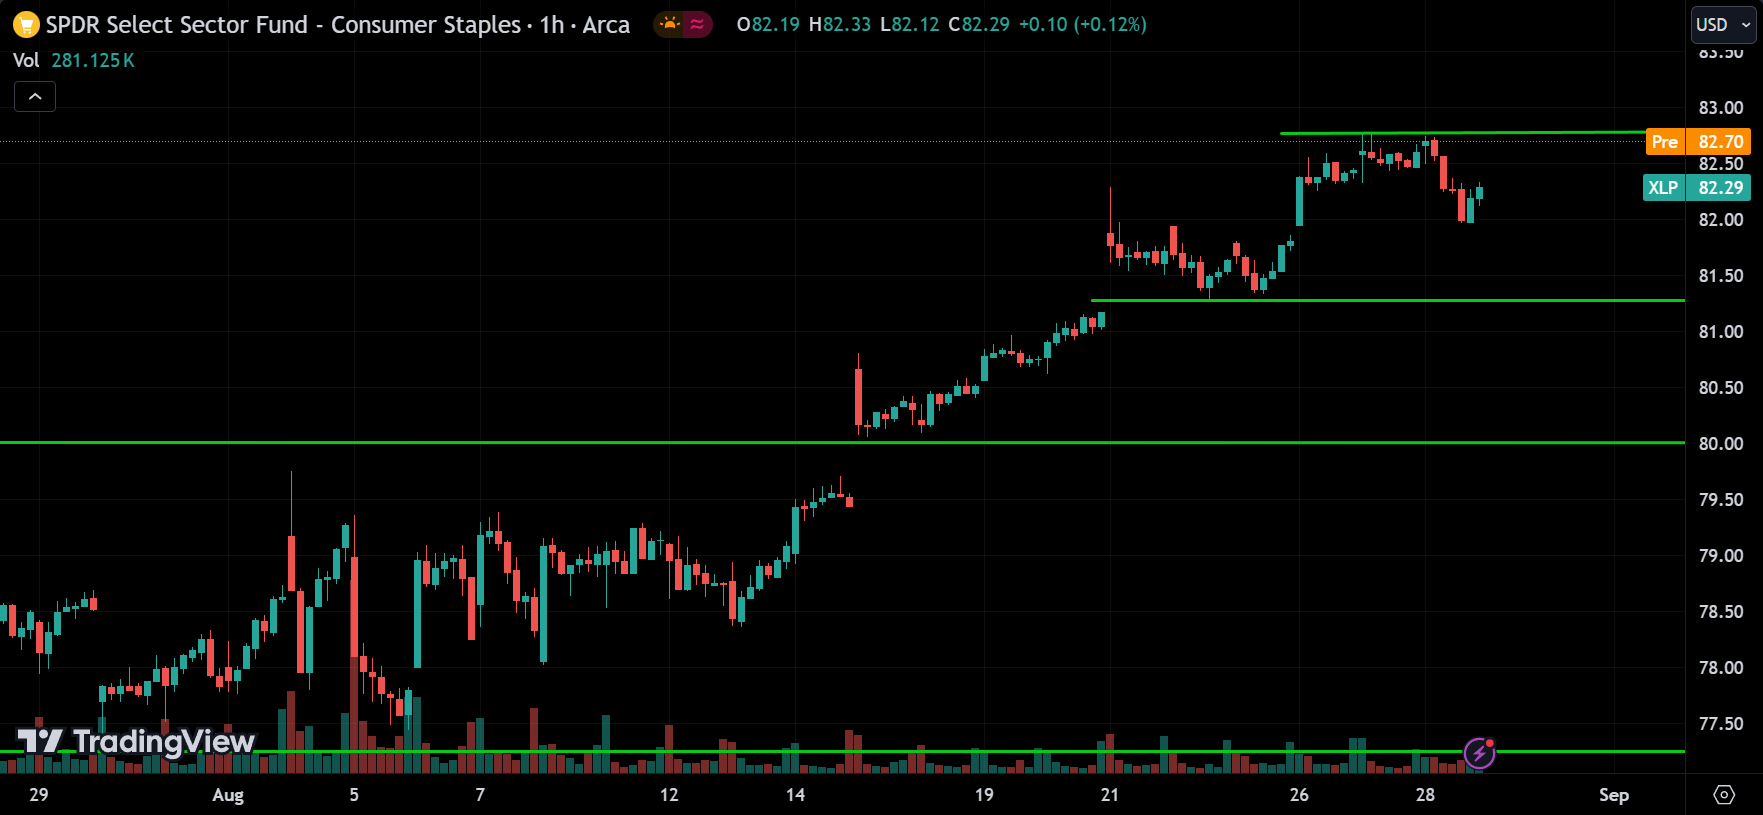
The Consumer Staples sector or XLP ETF is also trending up. The price is currently pulling back from the resistance at 82.80. There is support around 81.50, and we can expect the price to drop to this level and then pull back up, or it could start rising from its current level, which is around 82. If the price breaks above 82.80, we can expect it to continue going up. On the other hand, if the price breaks below the support at 81.50, we can expect it to drop toward 80.
Energy Sector(XLE):
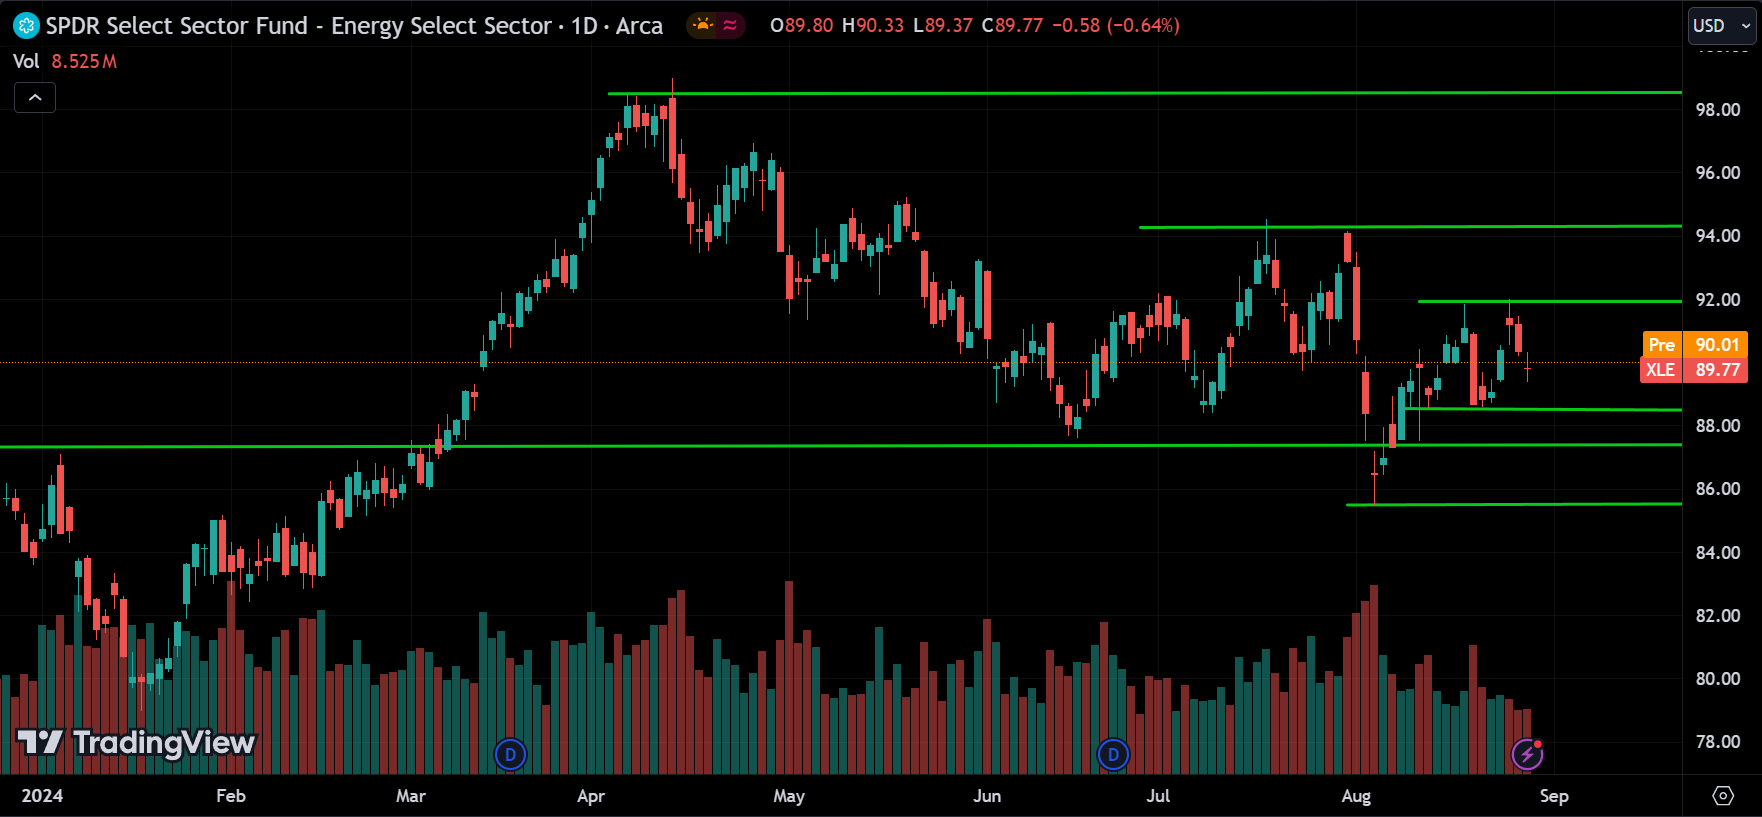
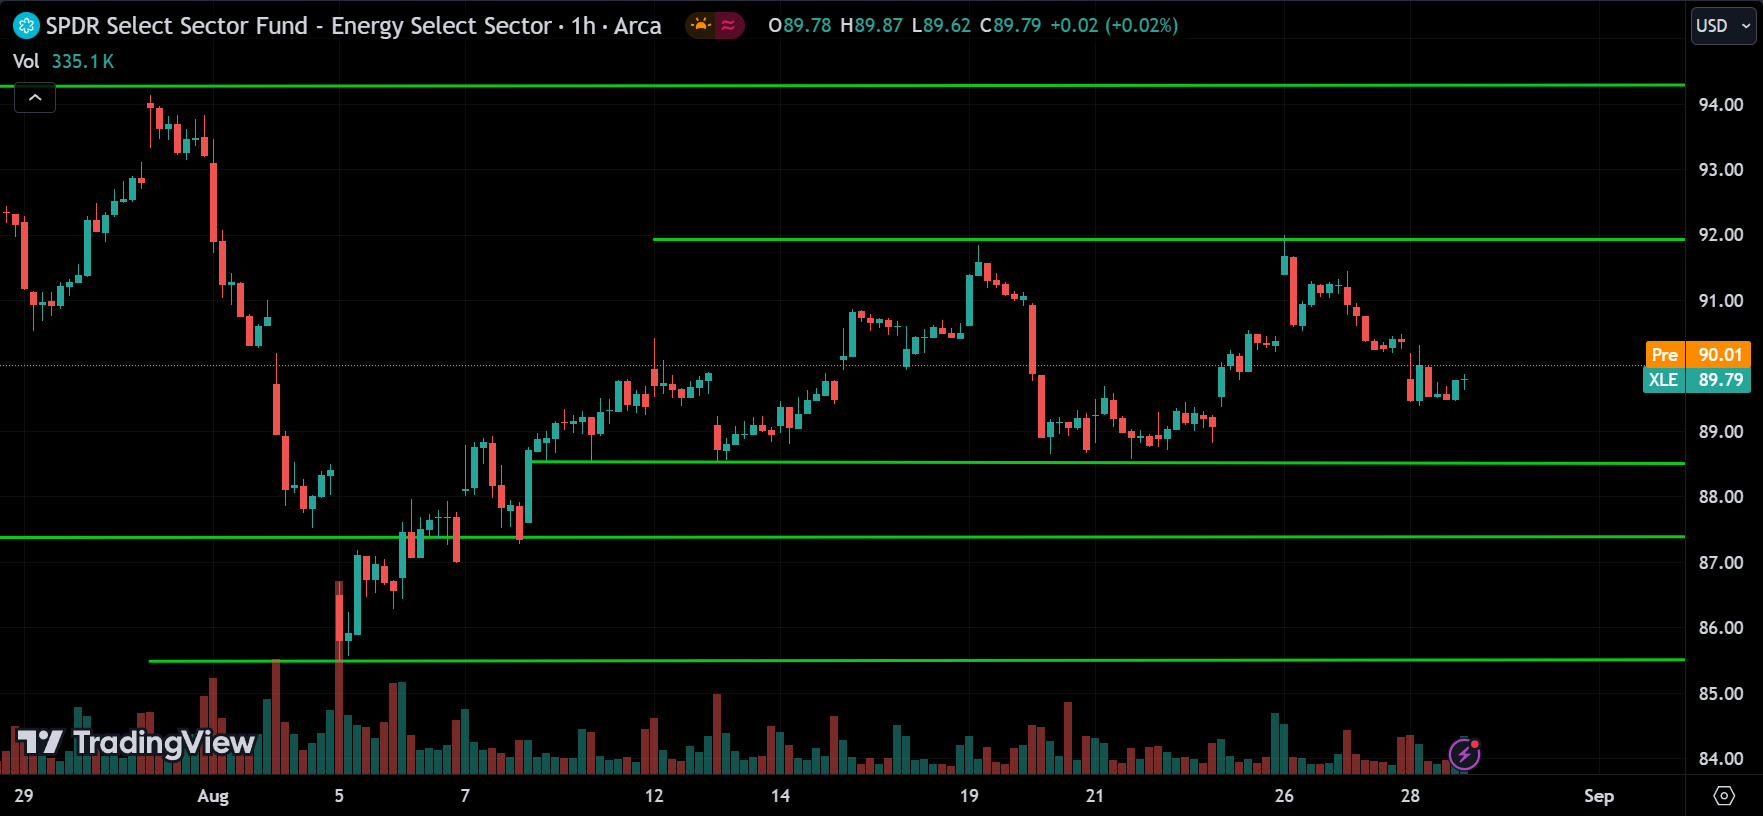
Looking at the Energy sector or XLE ETF, it’s more like trending down and consolidating in the medium term. The price is currently pulling back from the resistance level at 92 and heading toward 89. We can expect the price to start going up from the 89 support level, but if the price breaks below this support, it could drop further toward the 87 or 85.50 range. On the other hand, if the price starts rising from its current level back to 92, we might see a pullback around 92 again, or if the price breaks above it, it could continue moving up toward 94.
Materials Sector(XLB):
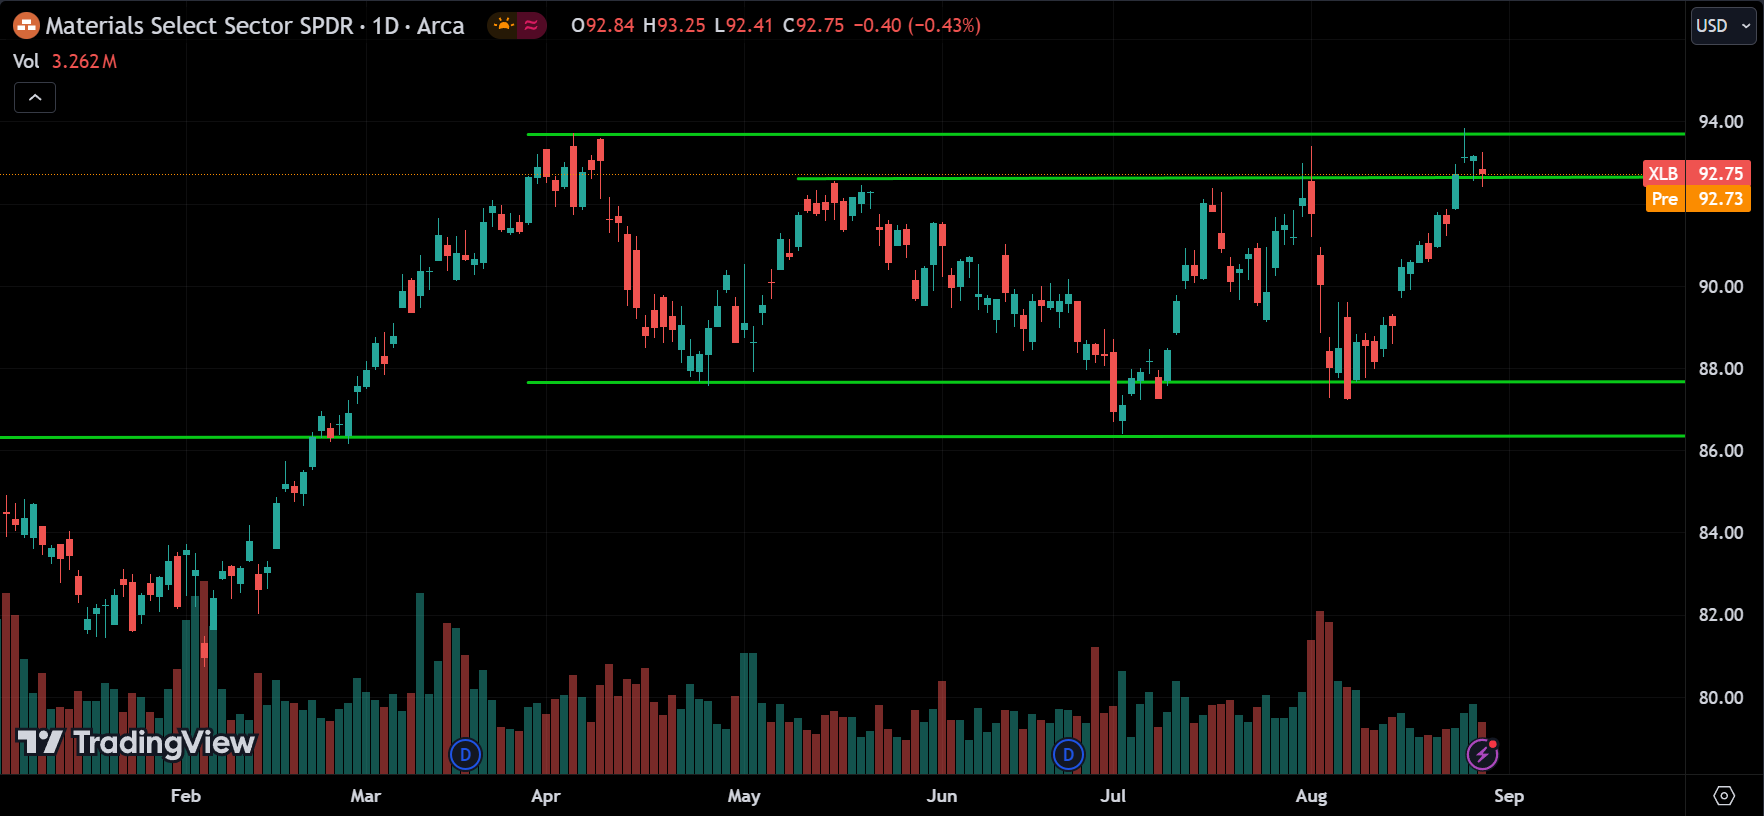
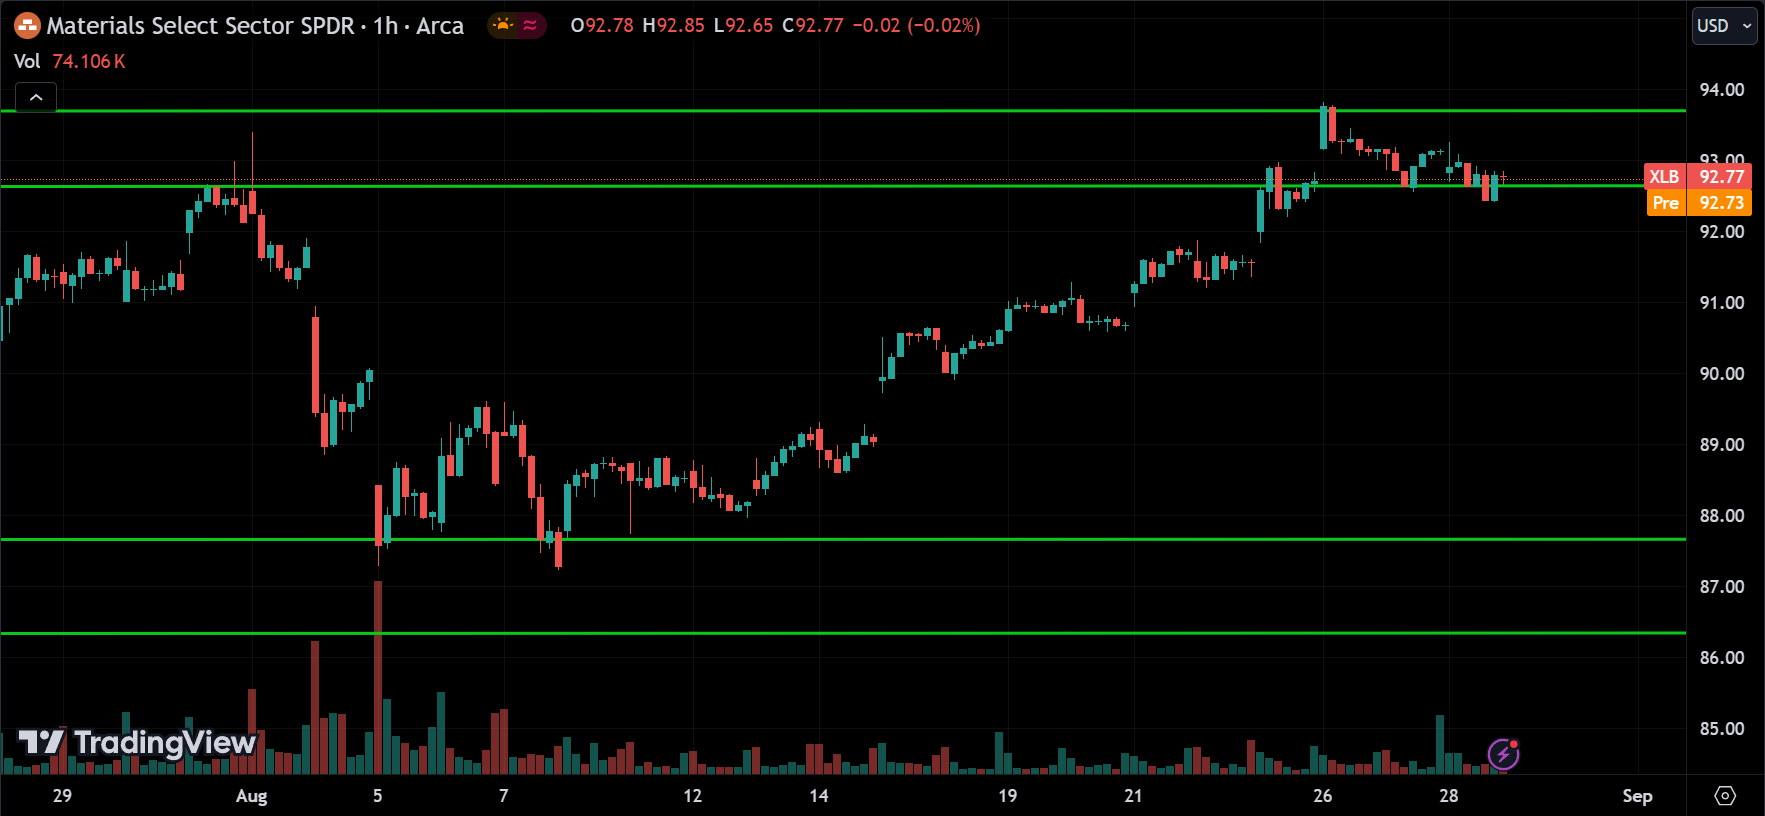
The Materials sector or XLB ETF is overall consolidating, but in the medium term, it’s trending up. The price is currently pulling back from the resistance level at 94 and is now around the 93 support range. If the price breaks below this level, we can expect it to drop toward the 90 or 88 support levels. On the other hand, if the price breaks above the 94 range, we can expect it to continue going up, which would start an uptrend.
Industrial Sector(XLI):
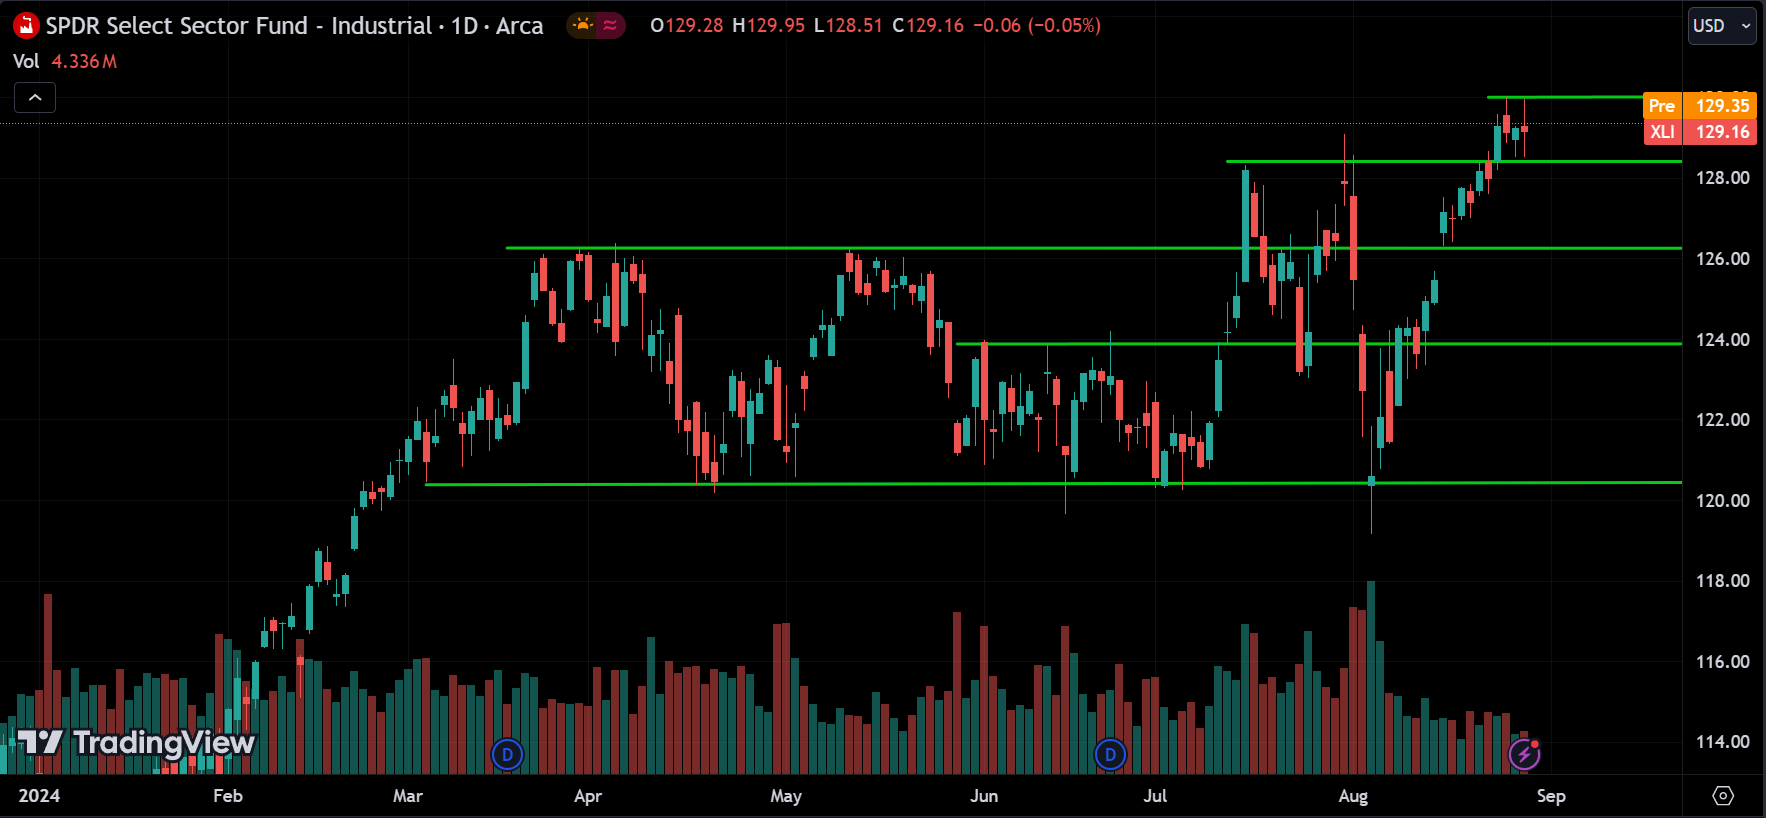
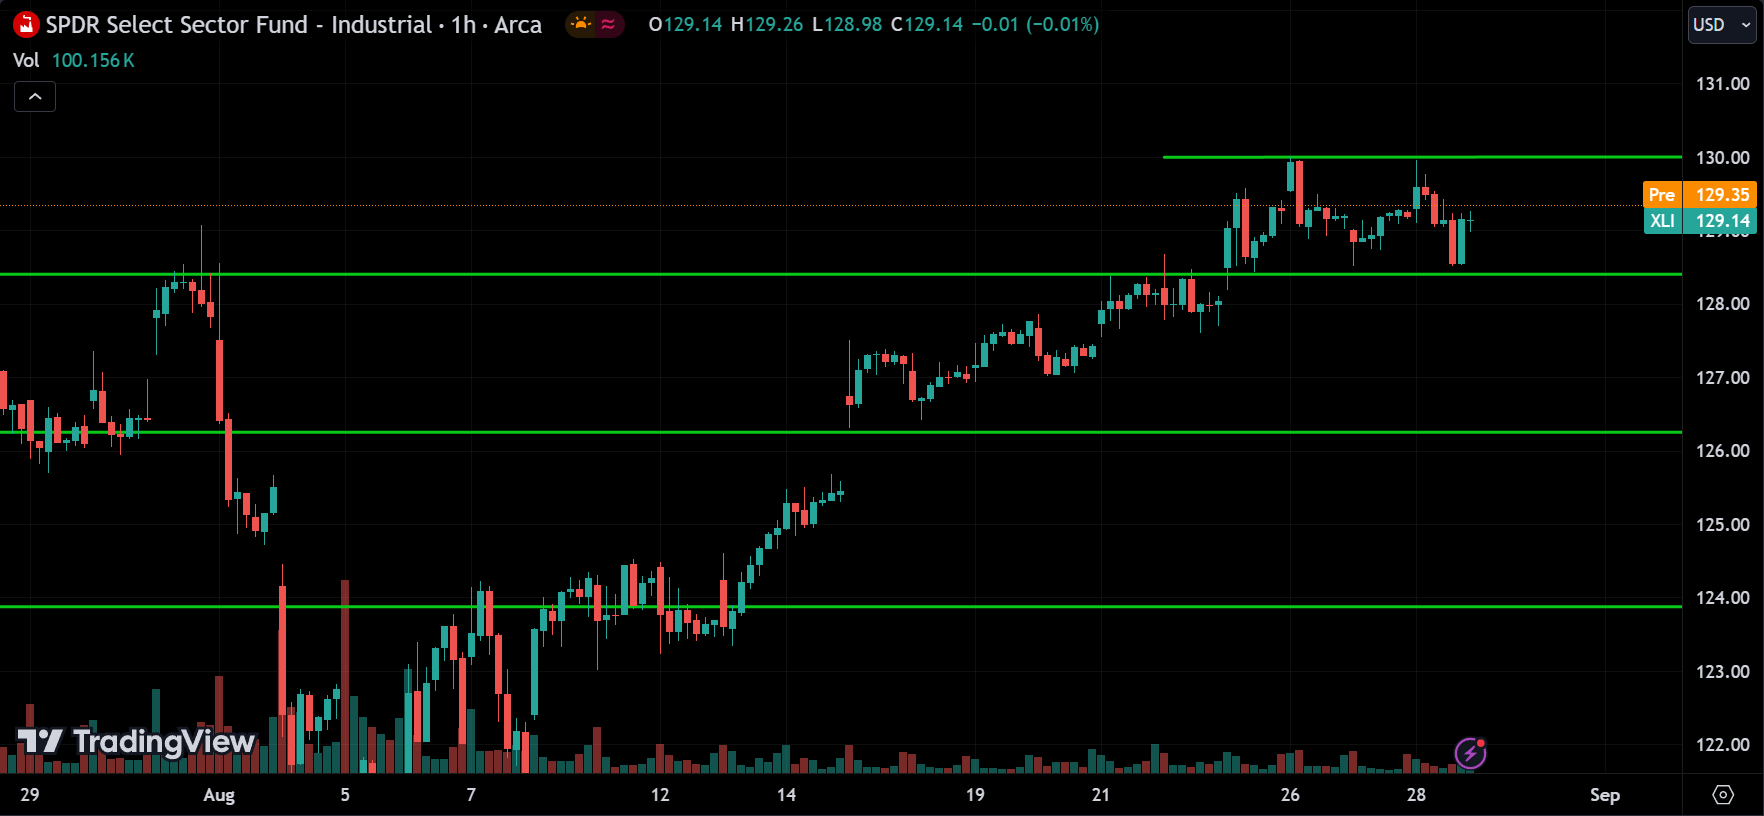
The Industrial sector or XLI ETF is also trending up. Right now, the price is pulling back from the resistance level at 130 and is at the 128.50 support. If the price breaks below this support, we can expect it to drop toward the 126 range. However, if the price starts going up and breaks above the 130 level, we can expect it to continue rising.
Consumer Discretionary Sector(XLY):
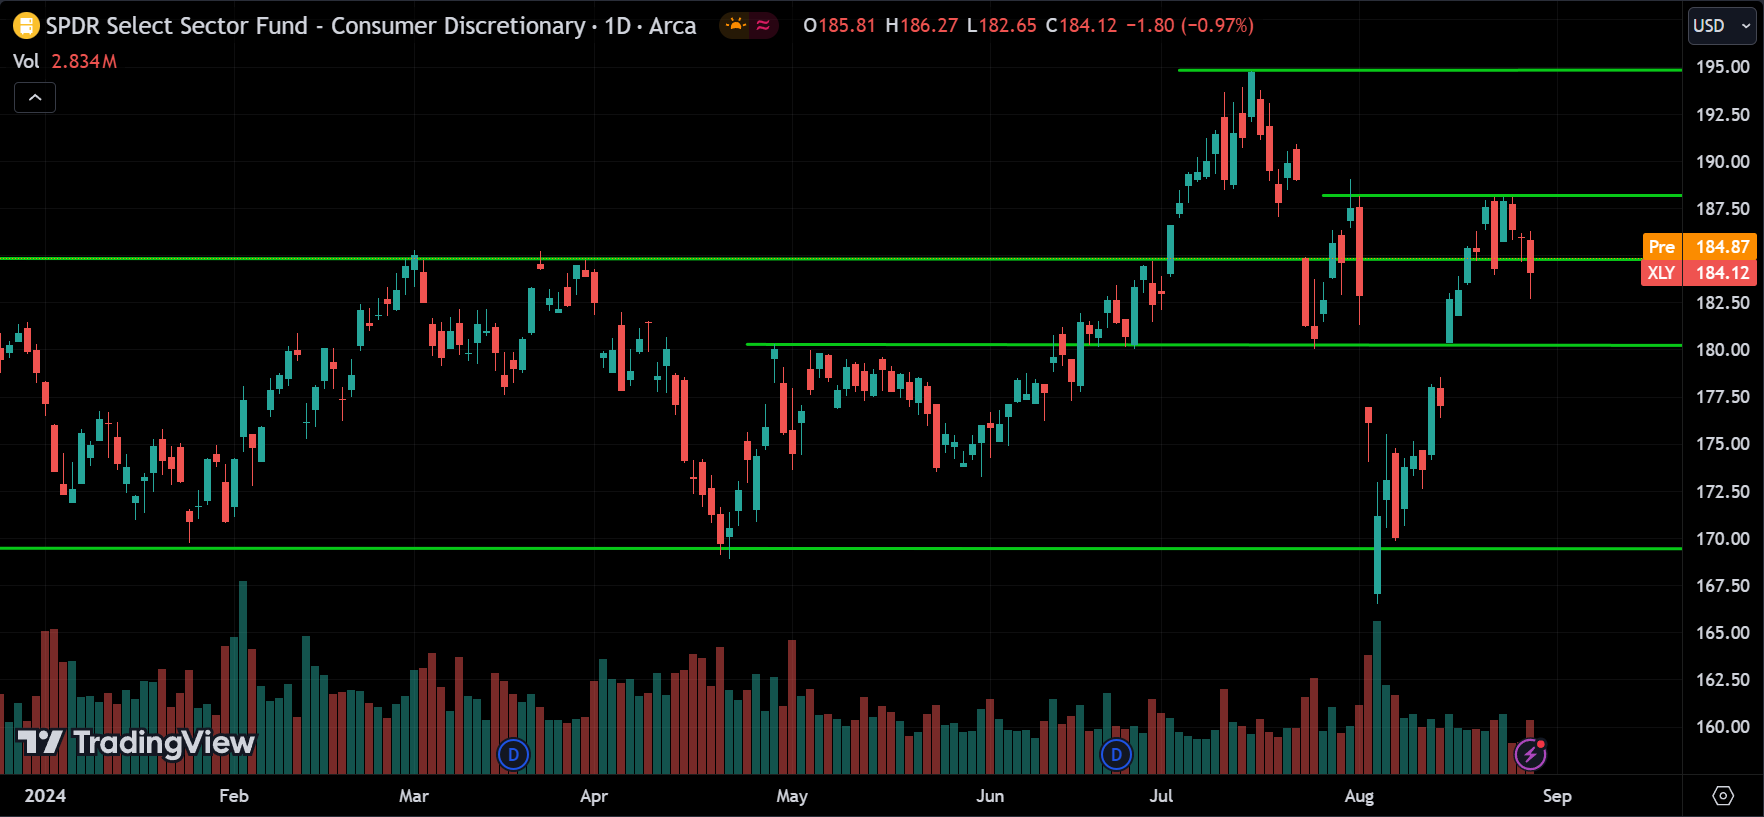
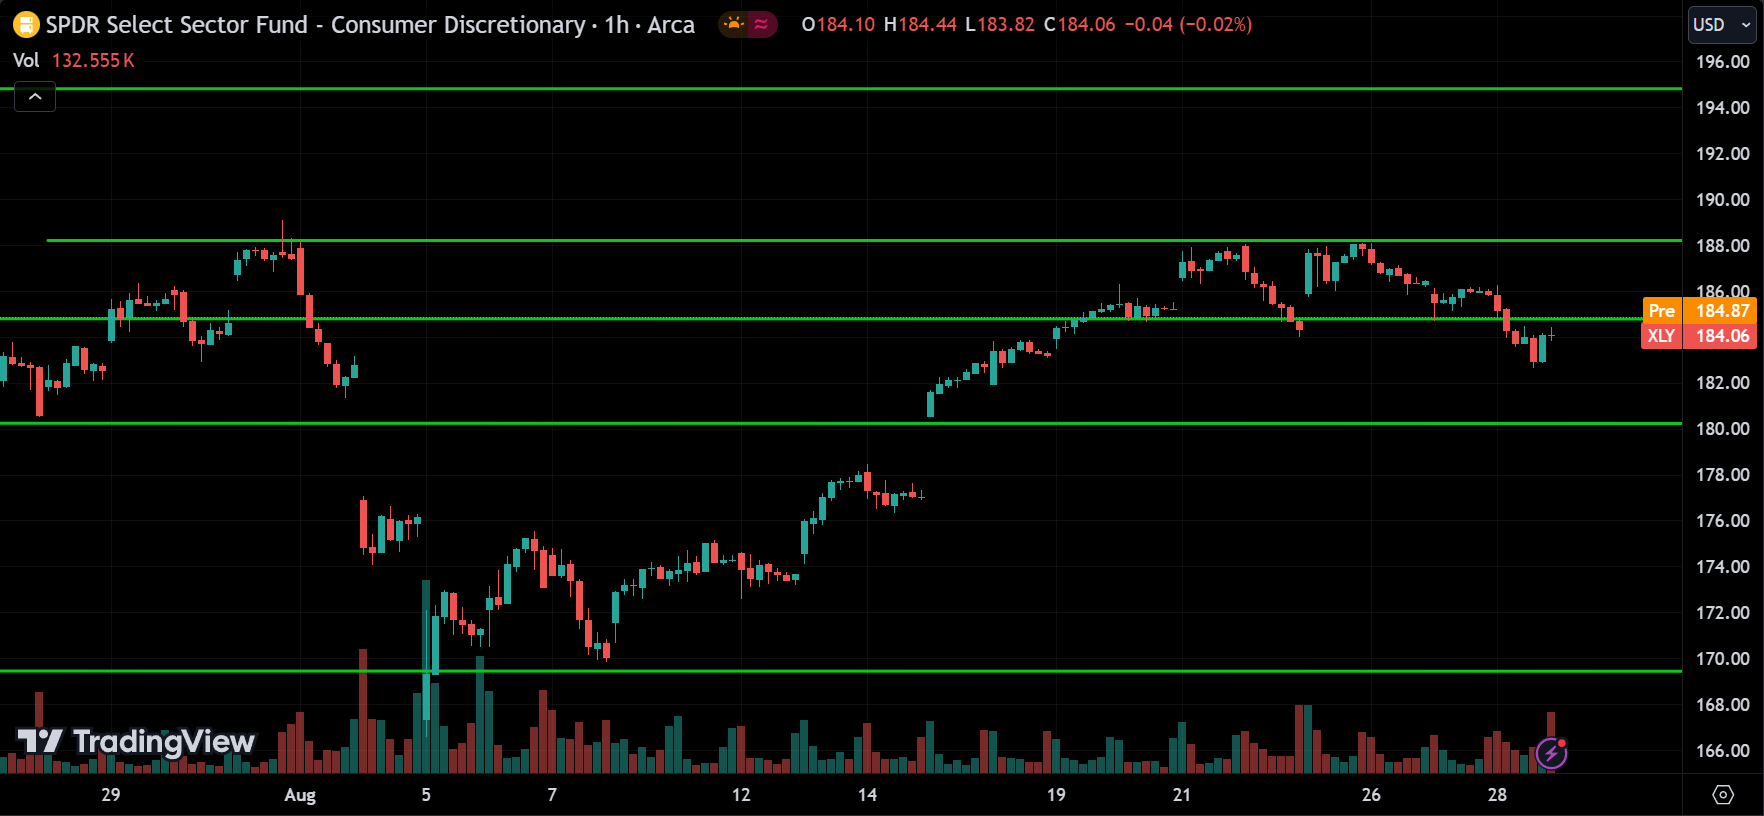
The Consumer Discretionary sector or XLY ETF is also trending up, but looking at the 1-hour chart, you can see that the price consolidated and then broke below the support. Now, we can expect the price to drop to the 180 level and then possibly start going back up. If it breaks below the 180 level, the price could drop further toward 170. However, if the price starts to rise and breaks above the 188 range, we can expect it to continue its uptrend toward the 195 range.
Healthcare Sector(XLV):
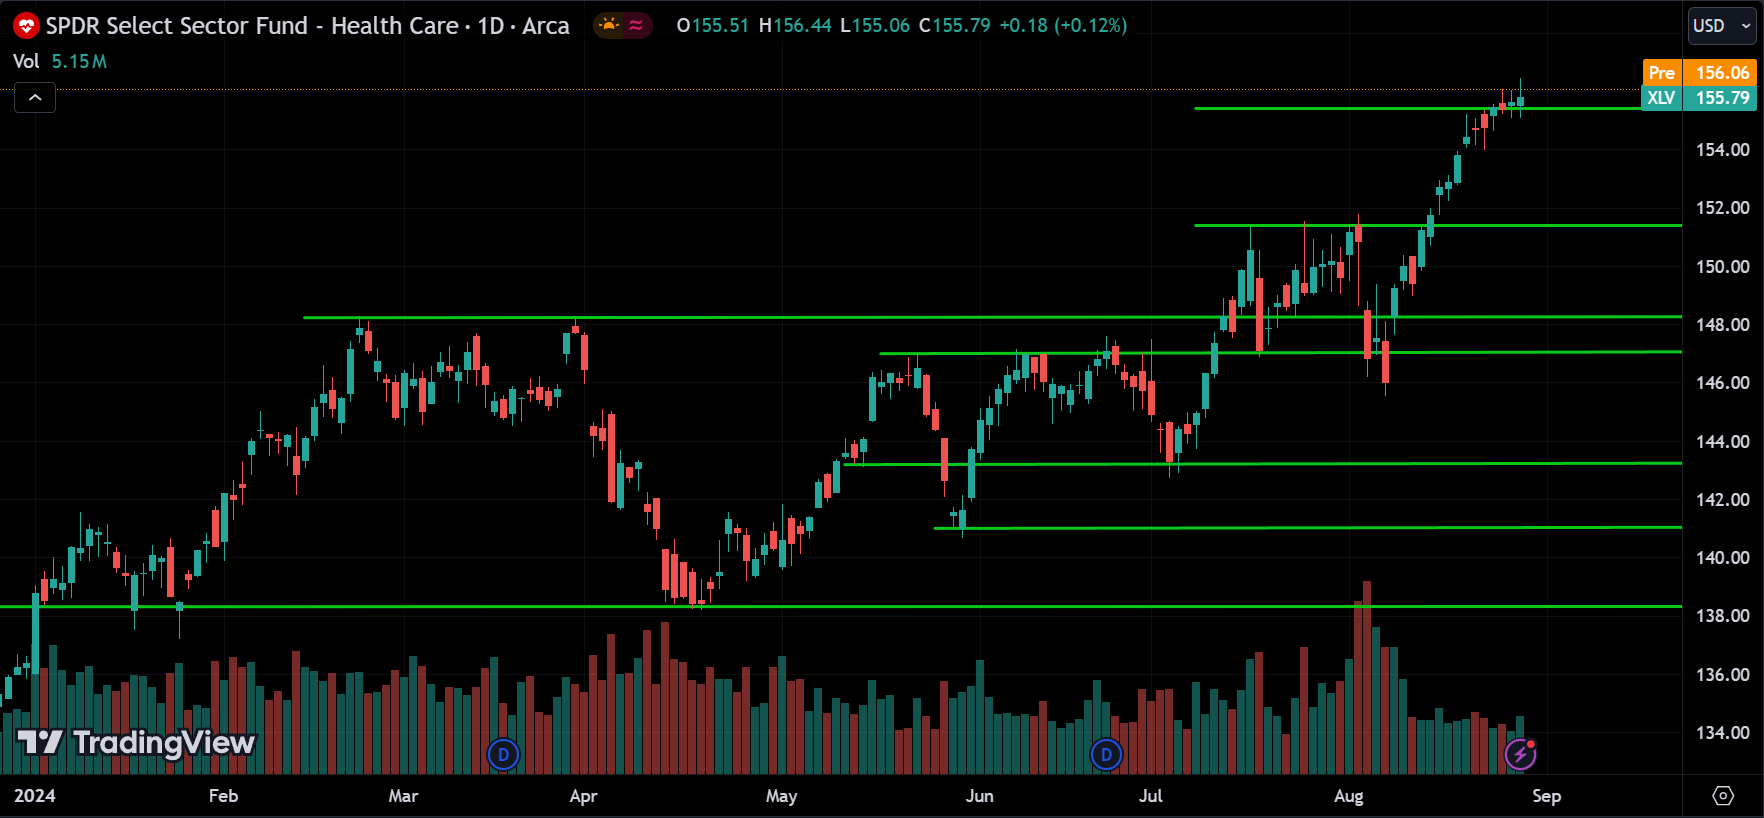
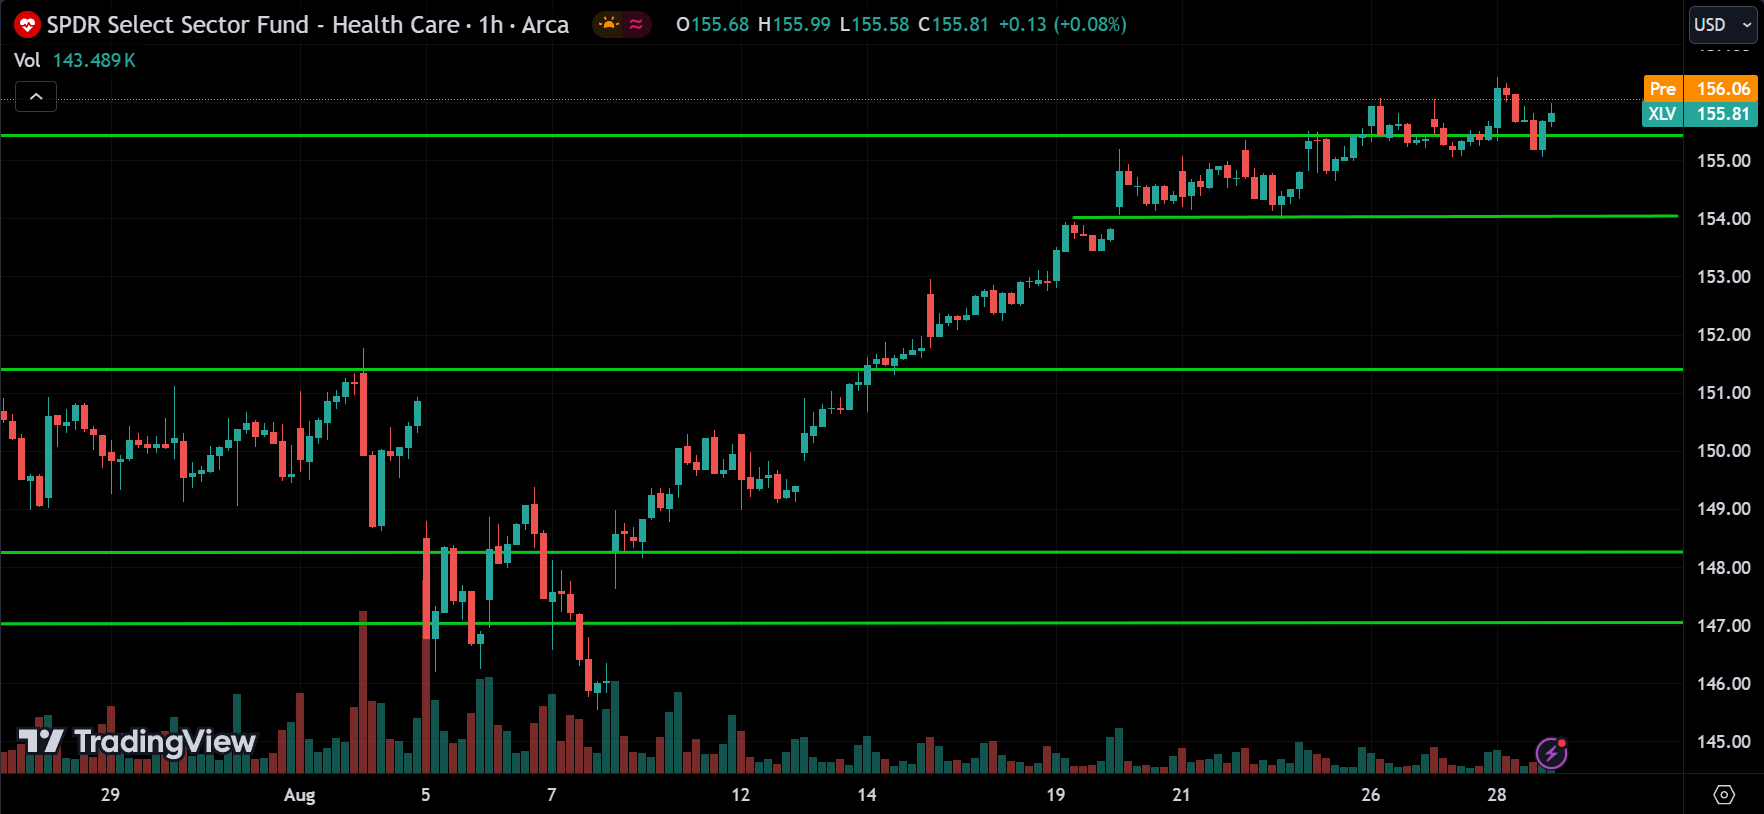
Looking at the Healthcare sector or XLV ETF, it’s also trending up. Since the price broke above the resistance level, we can expect this upward momentum to continue. However, be cautious if the price breaks below the 154 support range; if that happens, the price might enter a correction phase.
Financials Sector(XLF):
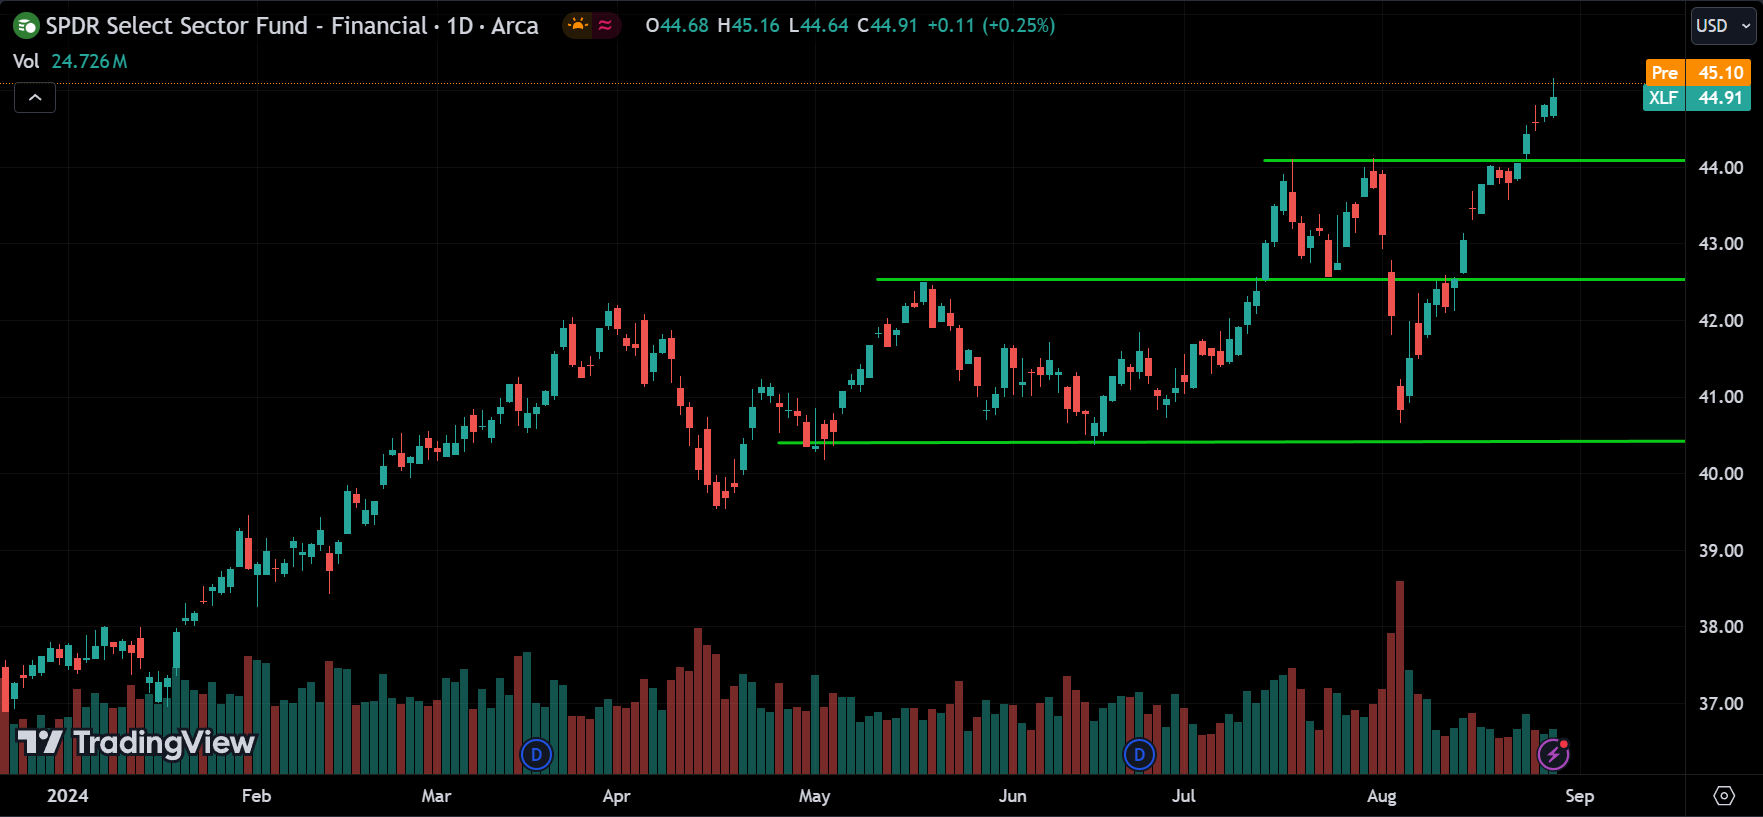
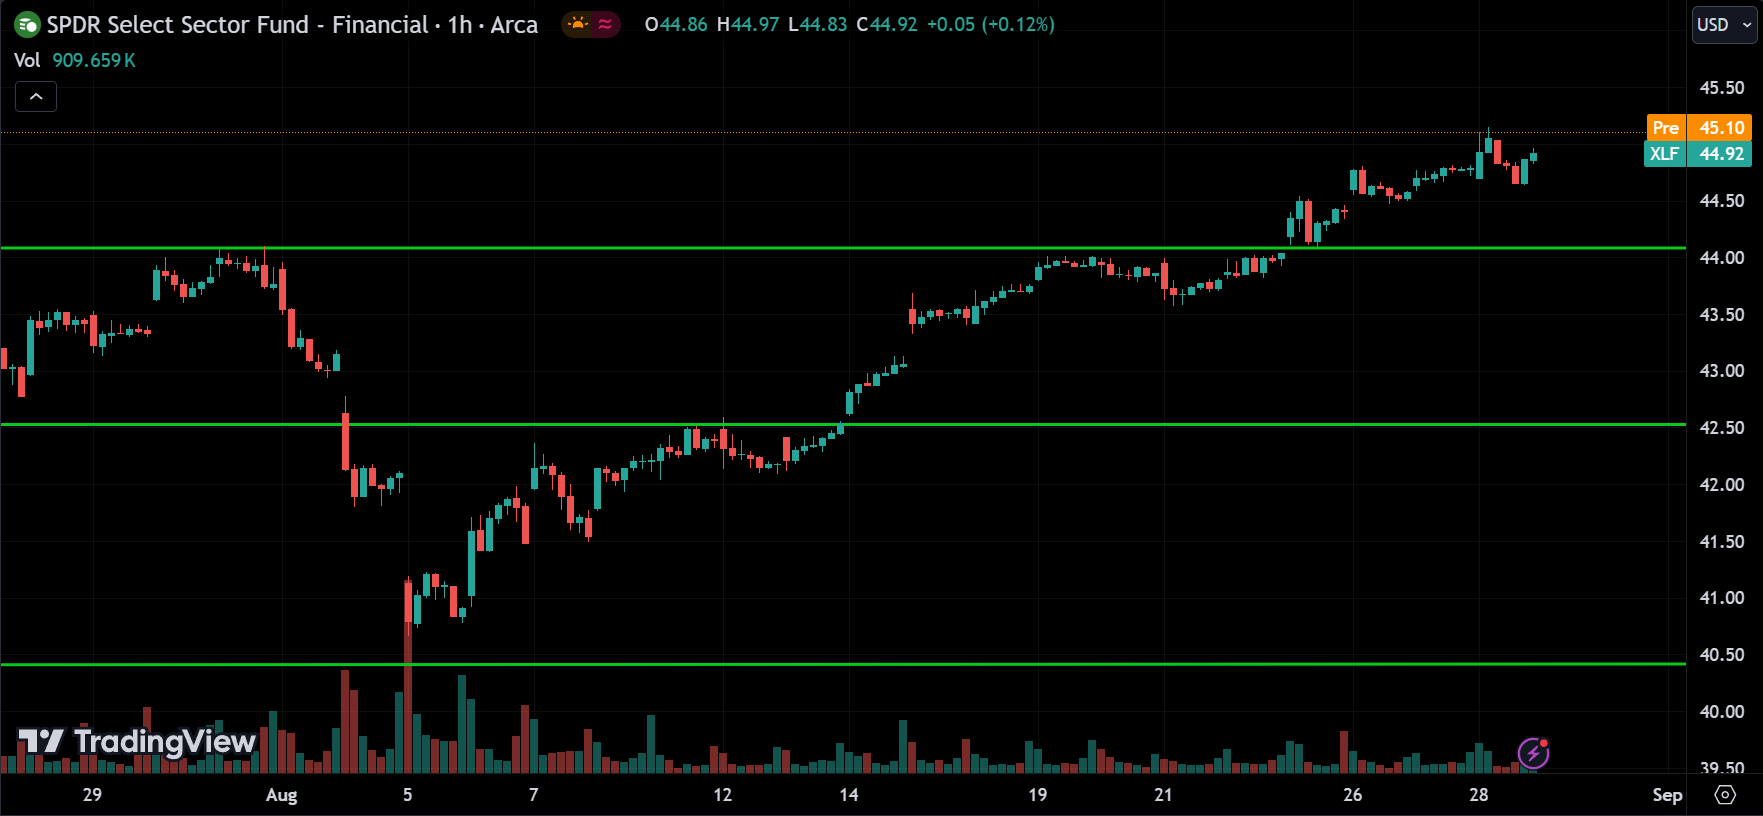
The Financial sector or XLF ETF is also trending up, and we can expect this momentum to continue. Be on the lookout for round numbers, as they might signal potential reversals or corrections. Also, watch for the price breaking below the 44 support range, as this could be a sign of a correction phase.
Technology Sector(XLK):
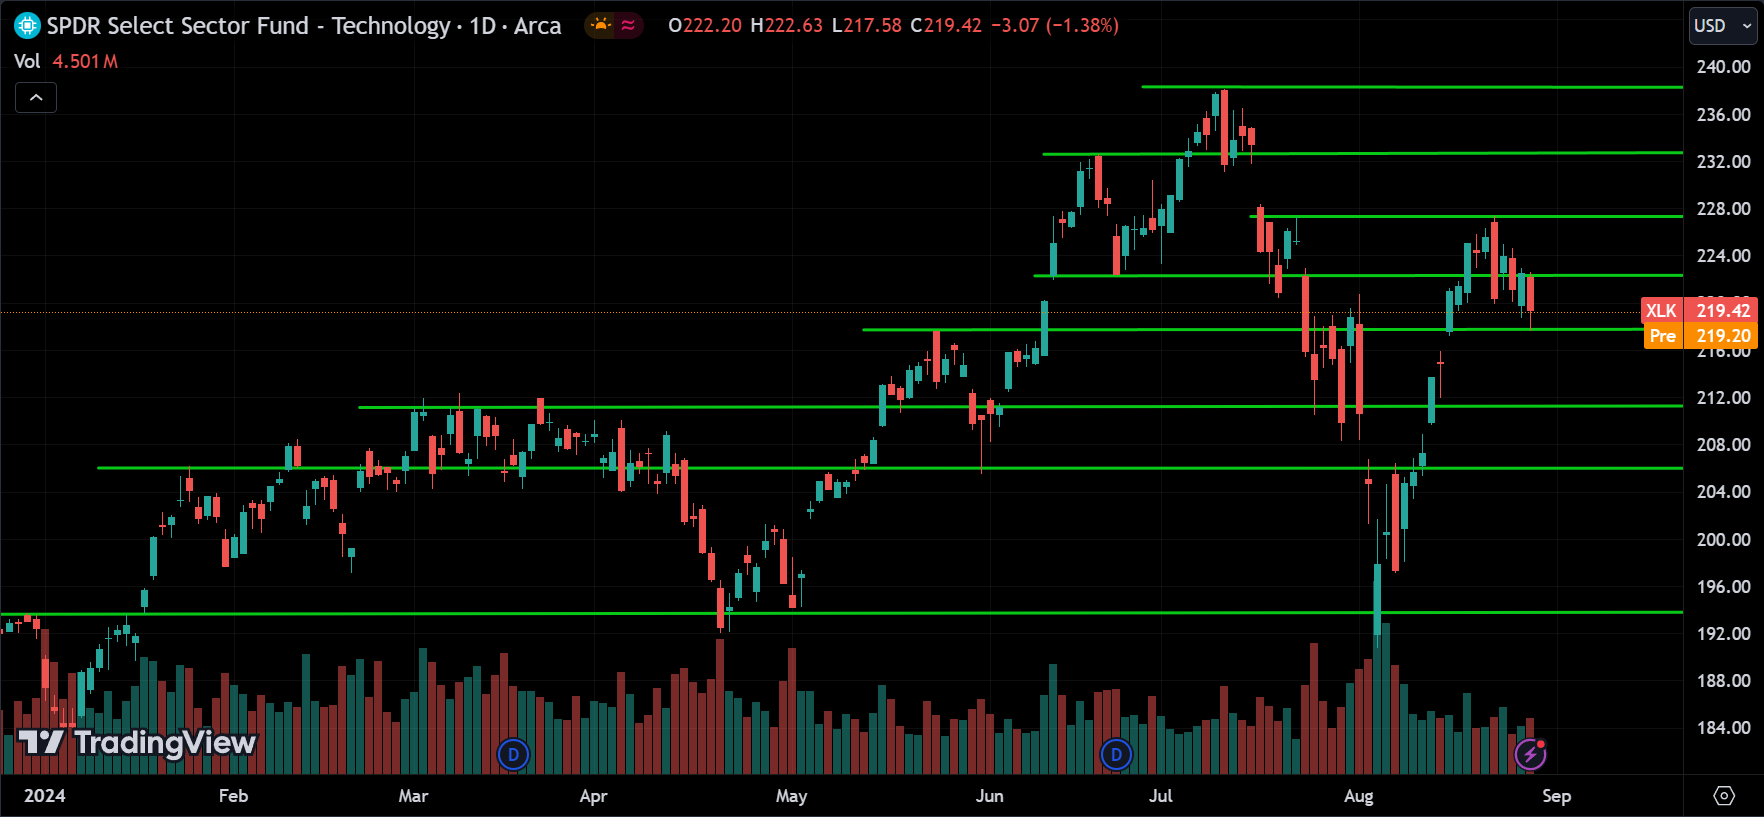
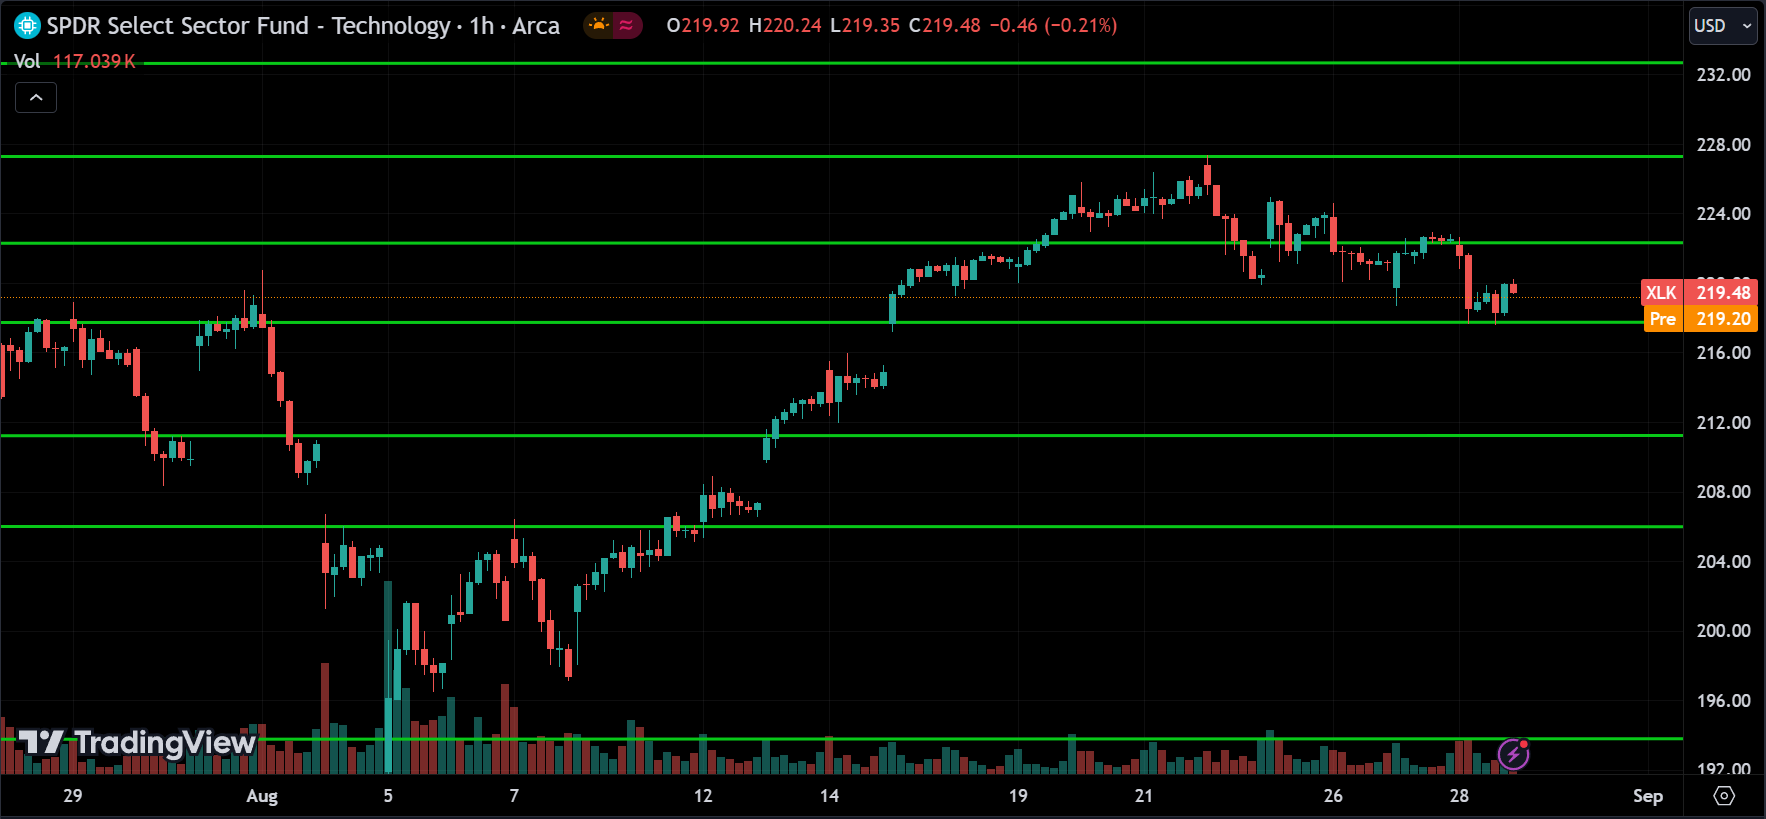
The Technology sector or XLK ETF is also trending up. The price is currently pulling back from the resistance at 228 and is now at the support level of 217.50. We can expect the price to bounce back from this support and move up toward the 228 range. However, if the price breaks below this support, it could drop toward the 212 level.
Communications Sector(XLC):
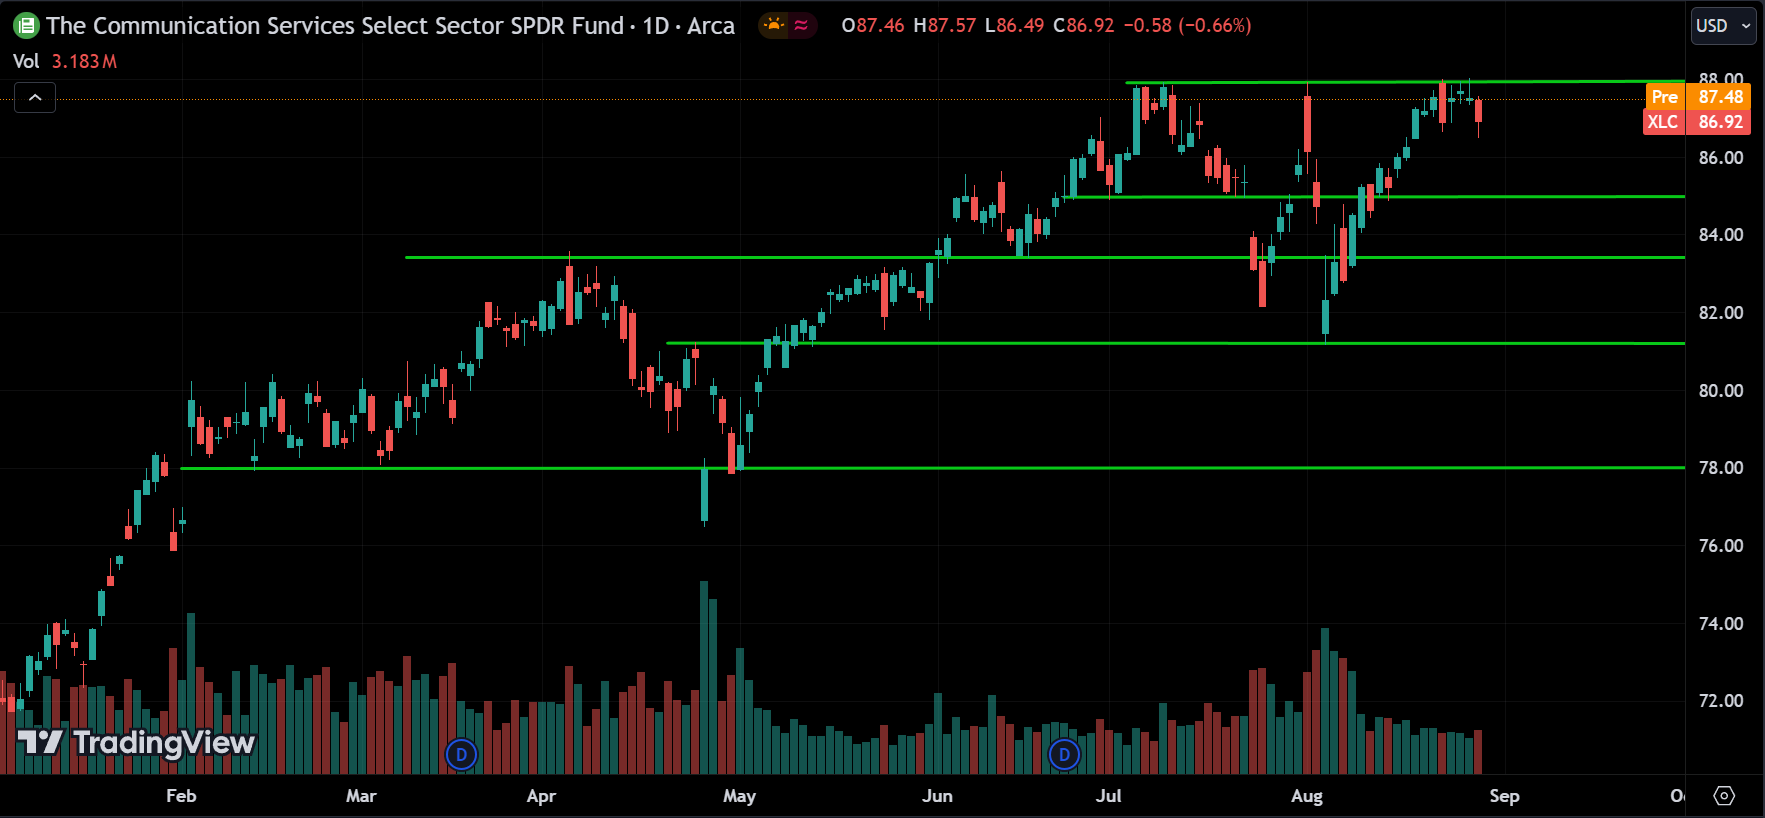
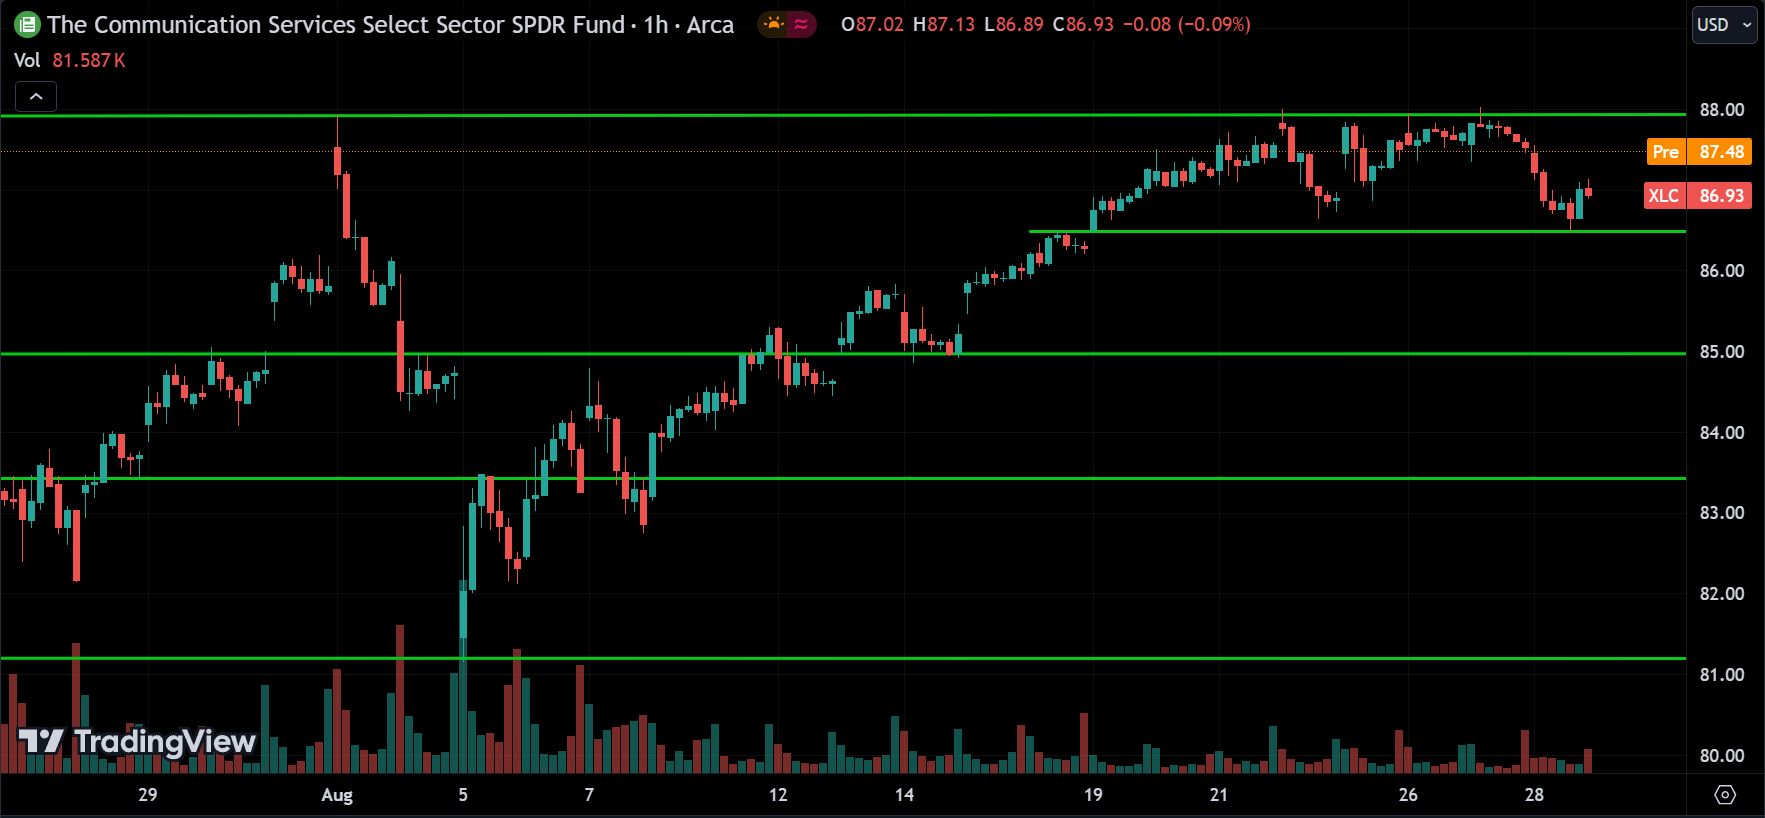
Looking at the Communication sector or XLC ETF, it’s also trending up, and the price is currently consolidating around the resistance level of 88. Right now, the price is at the support level of 86.50. If the price breaks below this support, we can expect it to drop toward 85. On the other hand, we might also see the price start to rise from this support back to 88. If the price breaks above that level, we can expect the uptrend to continue.
Utility Sector(XLU):
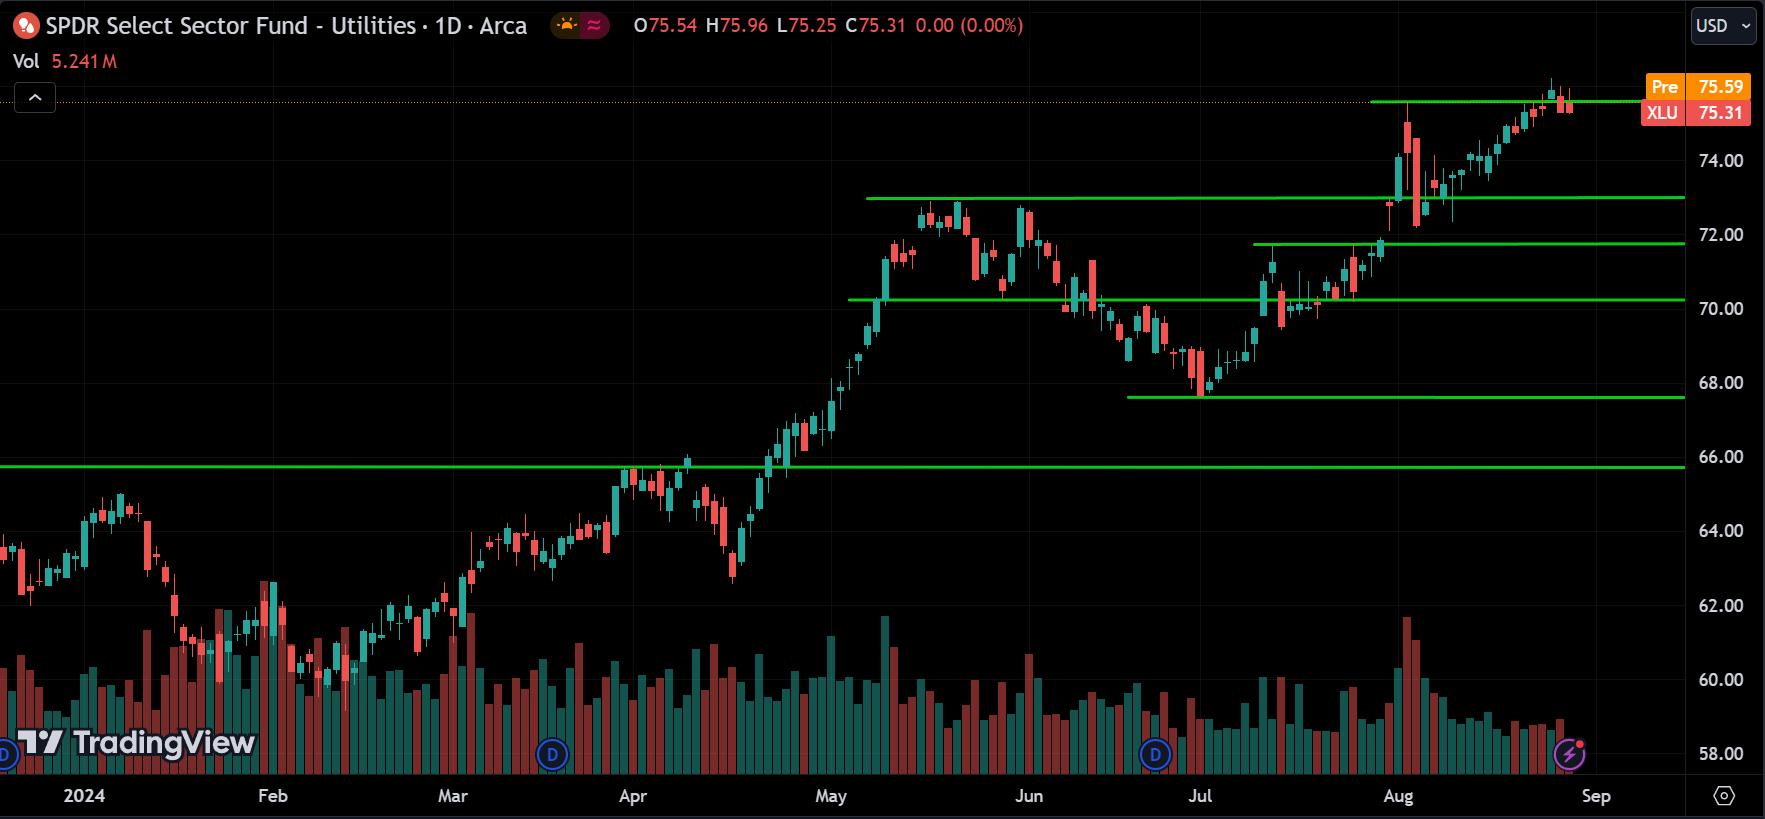
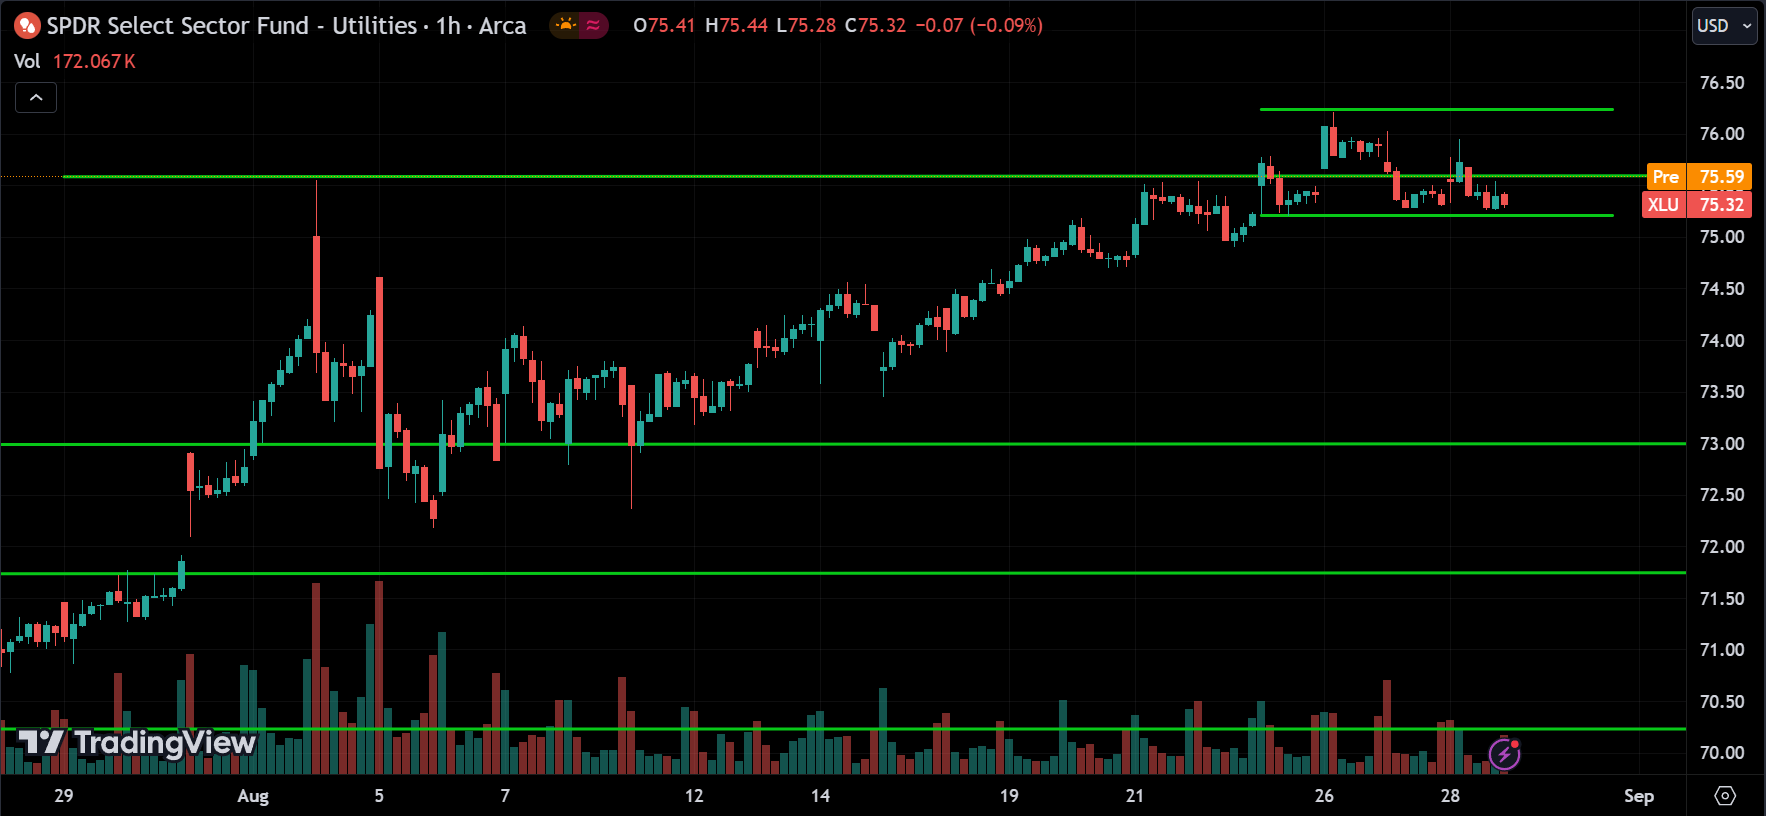
The Utilities sector or XLU ETF is also trending up, with the price currently consolidating between the support at 75.20 and the resistance at 76.20. The future trend will be determined by a breakout. If the price breaks above the resistance, we can expect it to continue going up. However, if the price breaks below the support, it could drop toward the 73 level.
Real Estate Sector(XLRE):
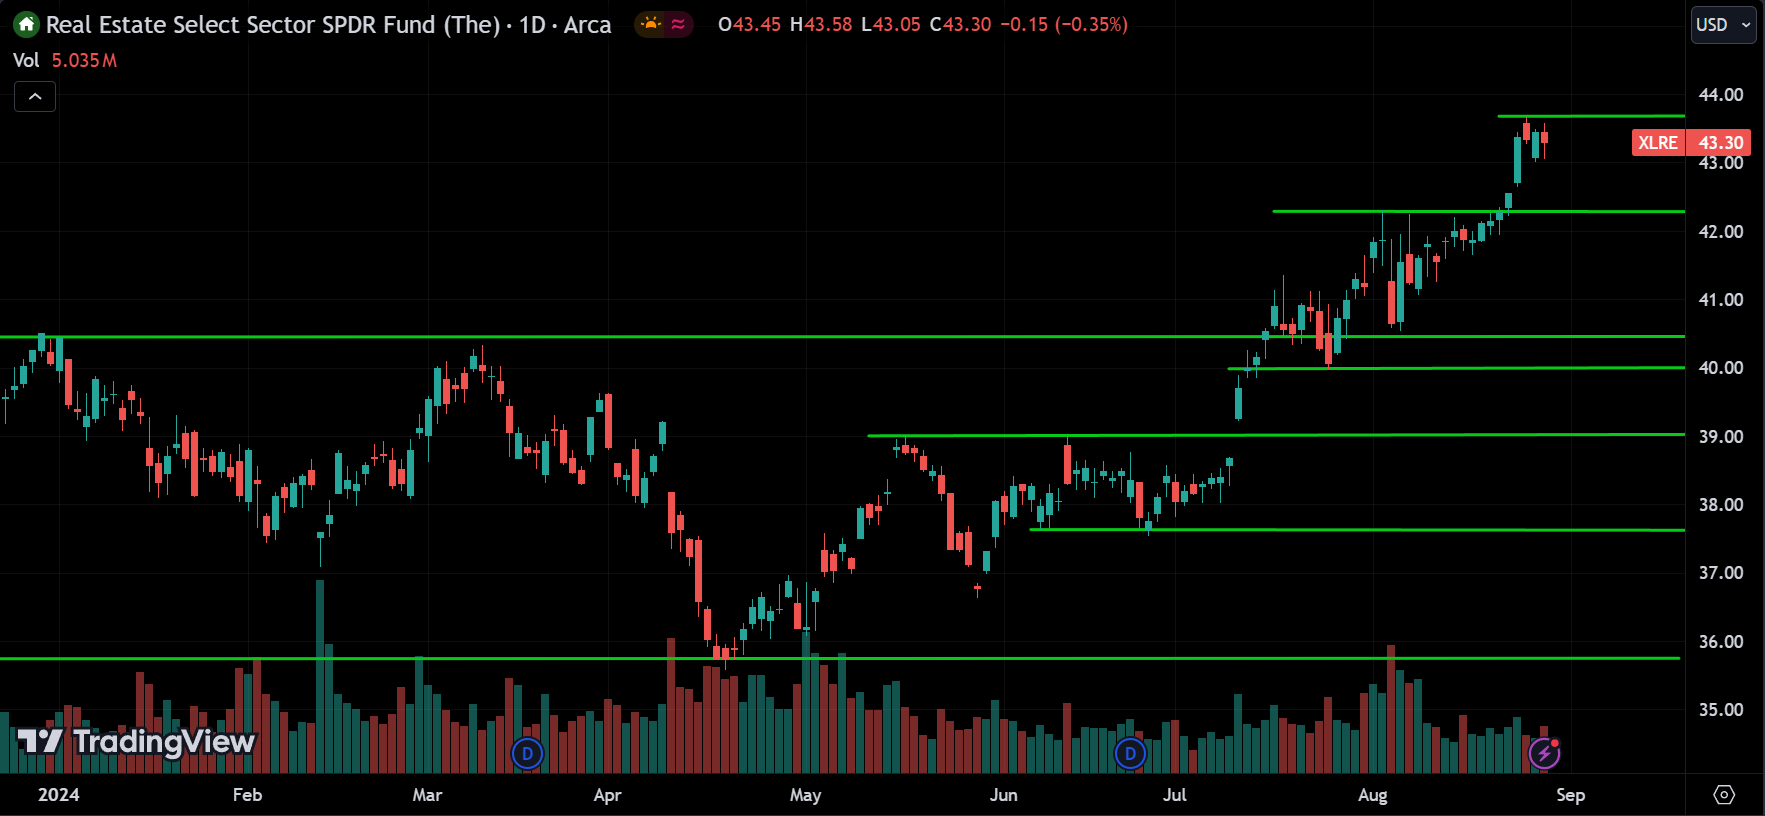
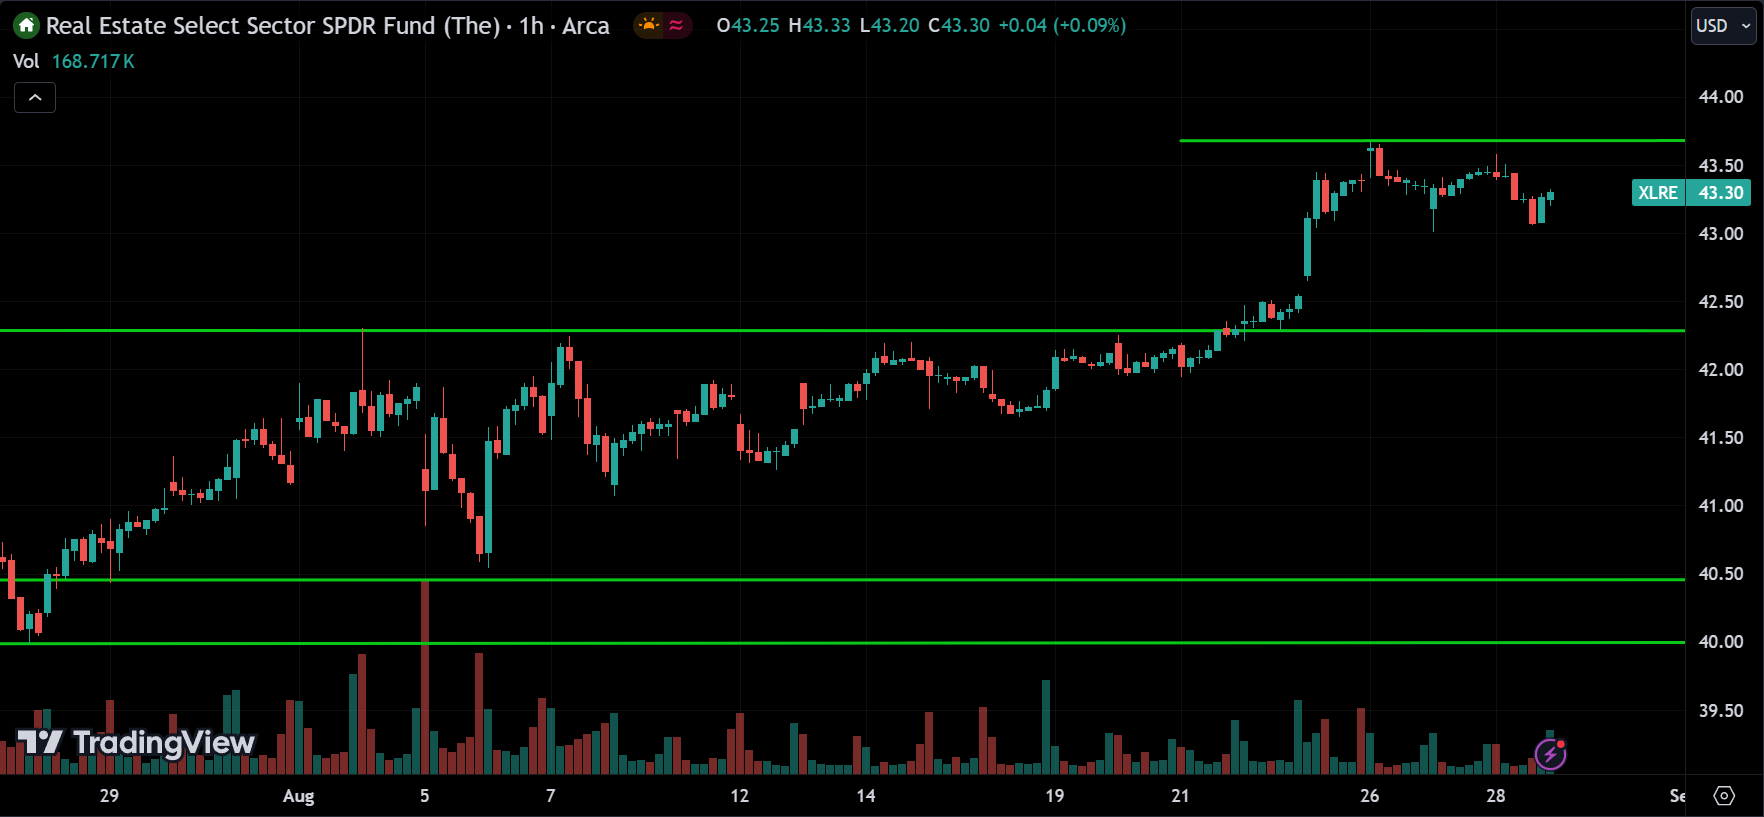
Looking at the Real Estate sector or XLRE ETF, it’s also trending up. The price is currently consolidating around the resistance at 43.70 and the support at 43. If the price breaks above this resistance, we can expect the uptrend to continue. On the other hand, if the price breaks below the 43 level, it could drop to 42.50, and if that level is also broken, the price may continue dropping toward 41.50.
Stocks to Watch Today
NVIDIA Corporation(NVDA):
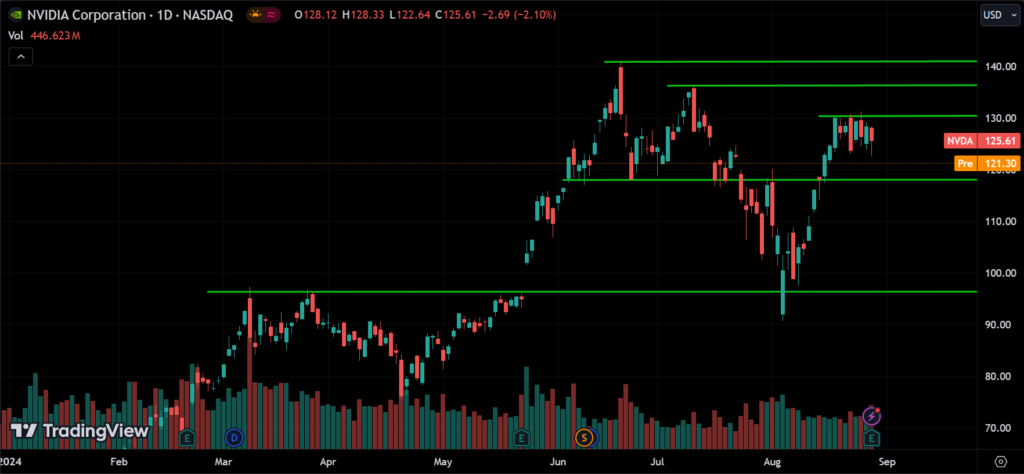
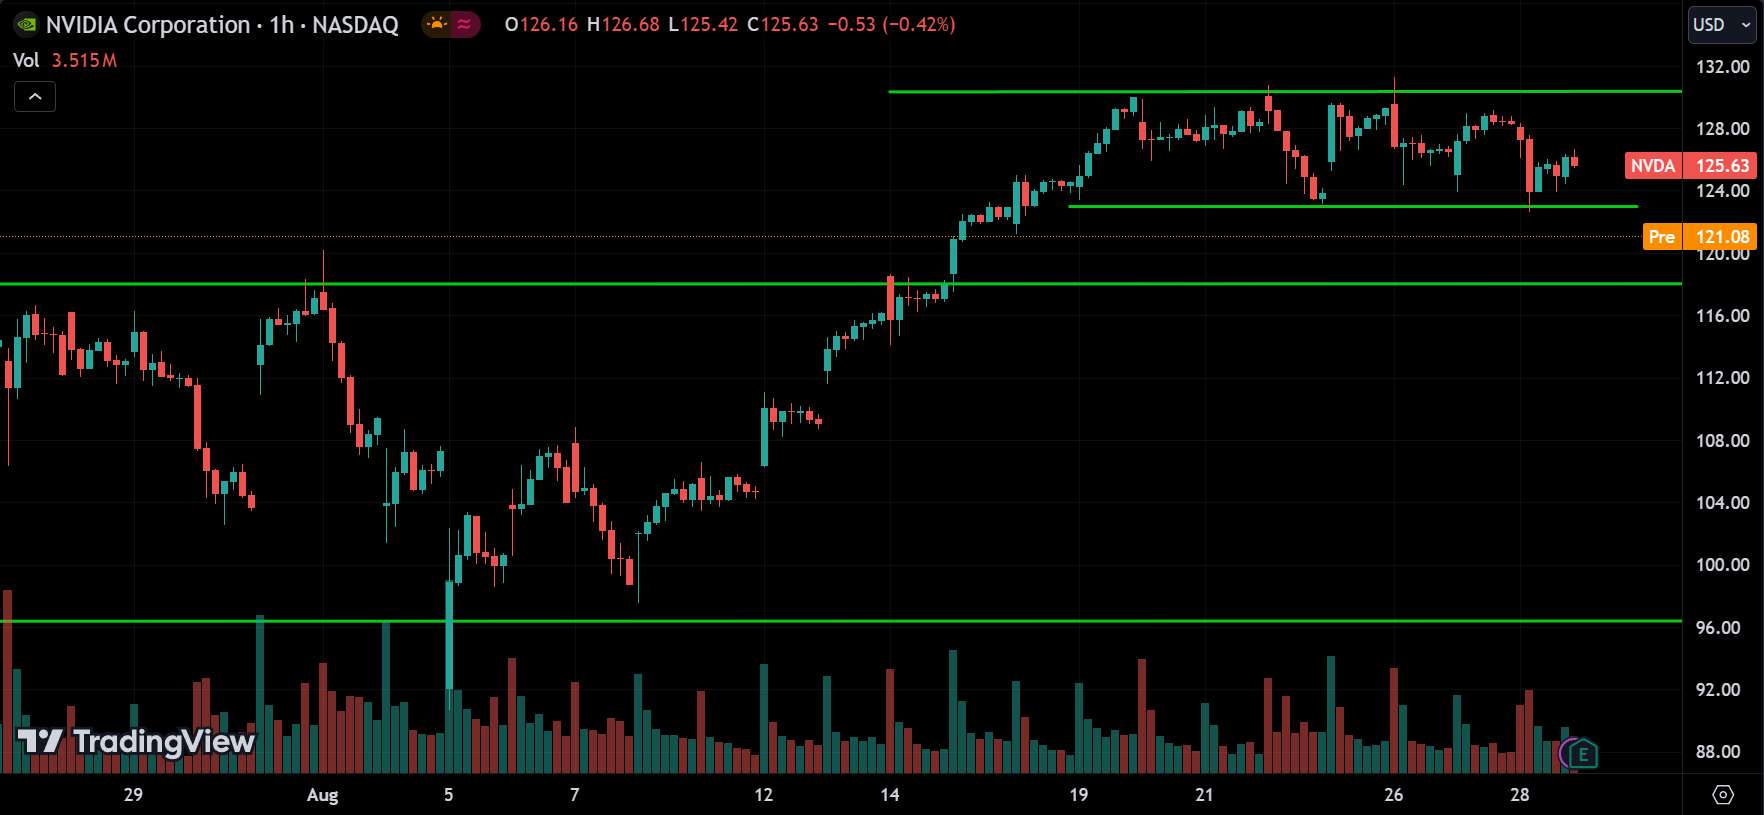
Nvidia reported earnings yesterday, and they beat the estimates. However, the price dropped in the pre-market because they also announced a $50 billion stock buyback. This was a good opportunity for big investors to sell shares while everyone else was buying, which caused the drop. The actual price will be determined when the market opens. If the price breaks above the resistance at 132, we can expect it to continue going up. If it breaks or opens below 124, the stock may enter a correction phase, possibly dropping to 120 or even lower.
Dell Technologies Inc.(DELL):
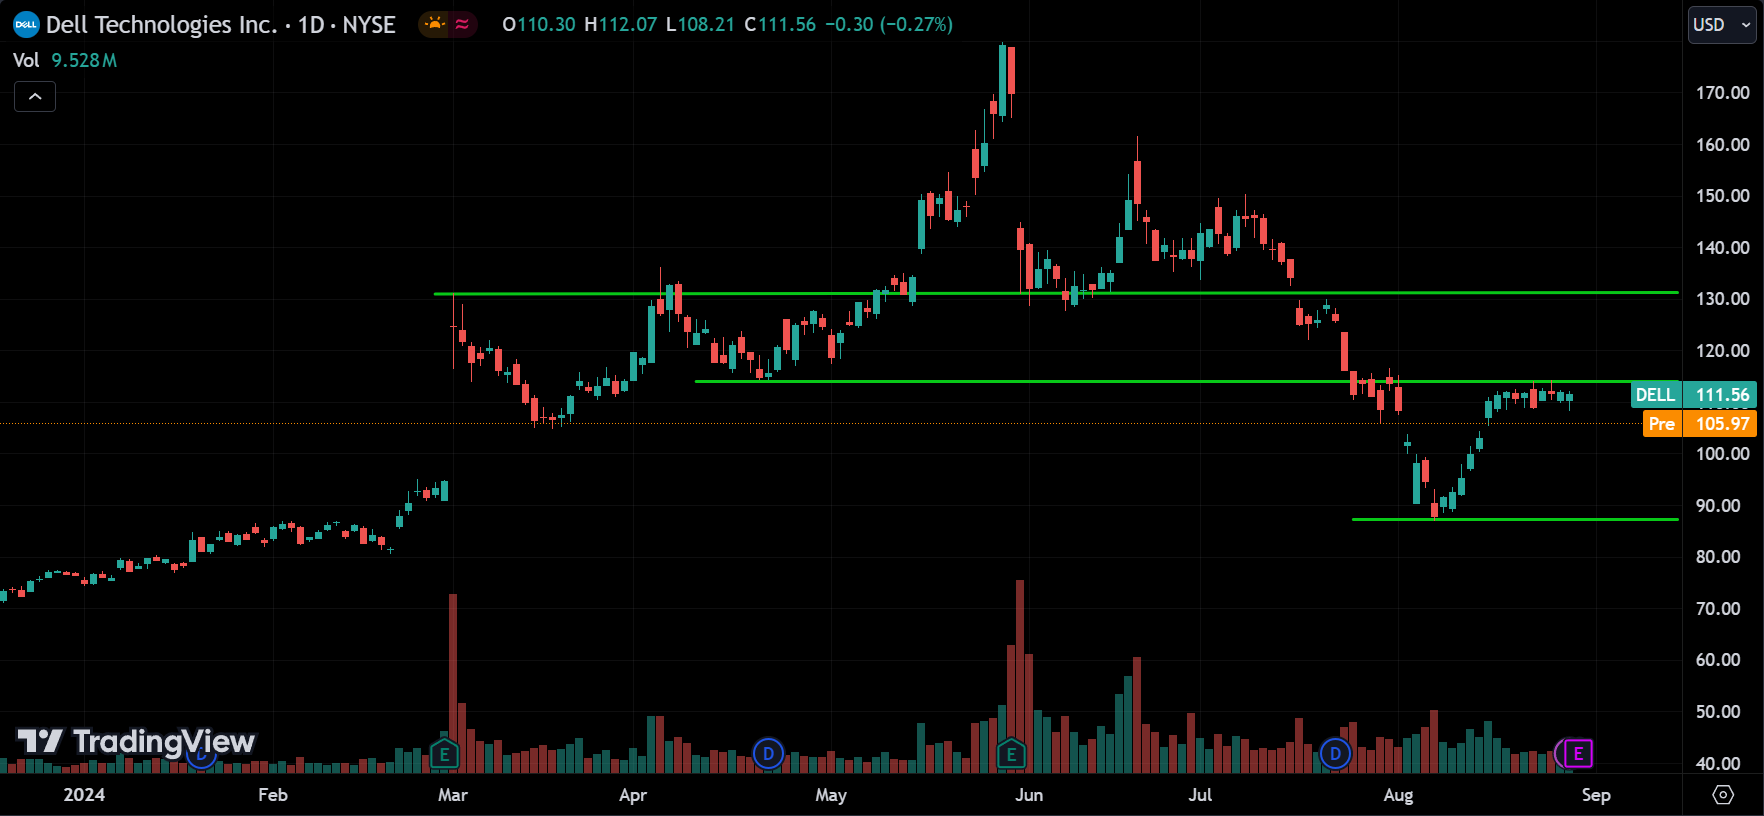
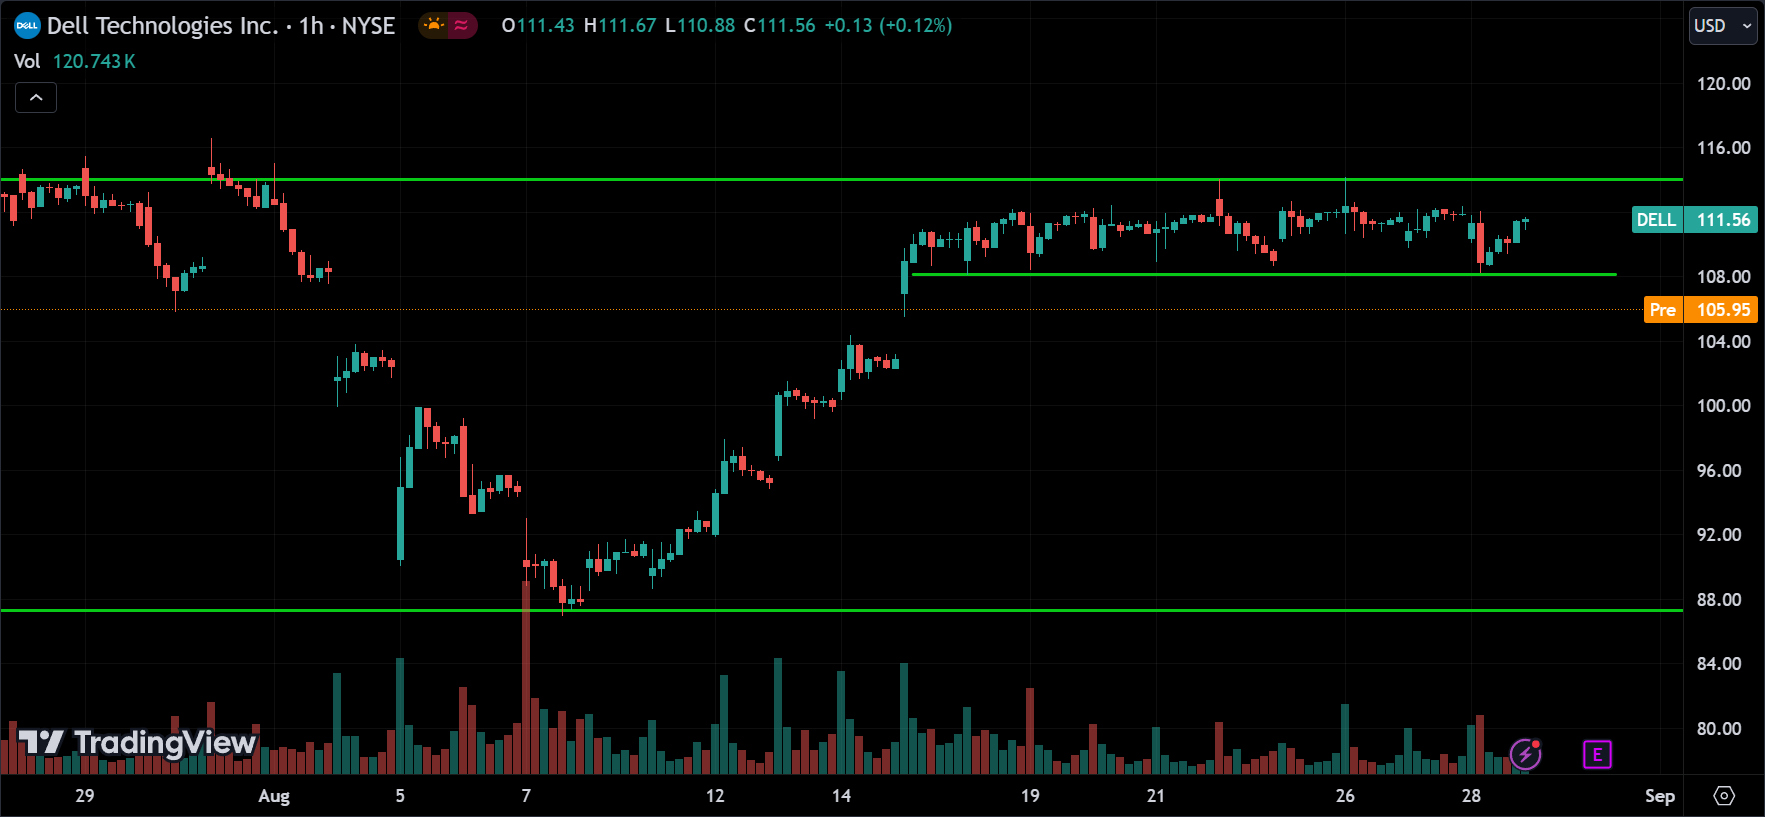
Dell reporting earnings after today market close, right now the price is consolidating, just like the nvidia or more like all the technology sector, now if the price break above 114 resistance range we can expect the price to continue go up, but if it break below 108 support level we can expect he price to drop towars 100 or 88 level. usually when a company beats estimates stock price usually goes up.
Berkshire Hathaway Inc.(BRK-B):
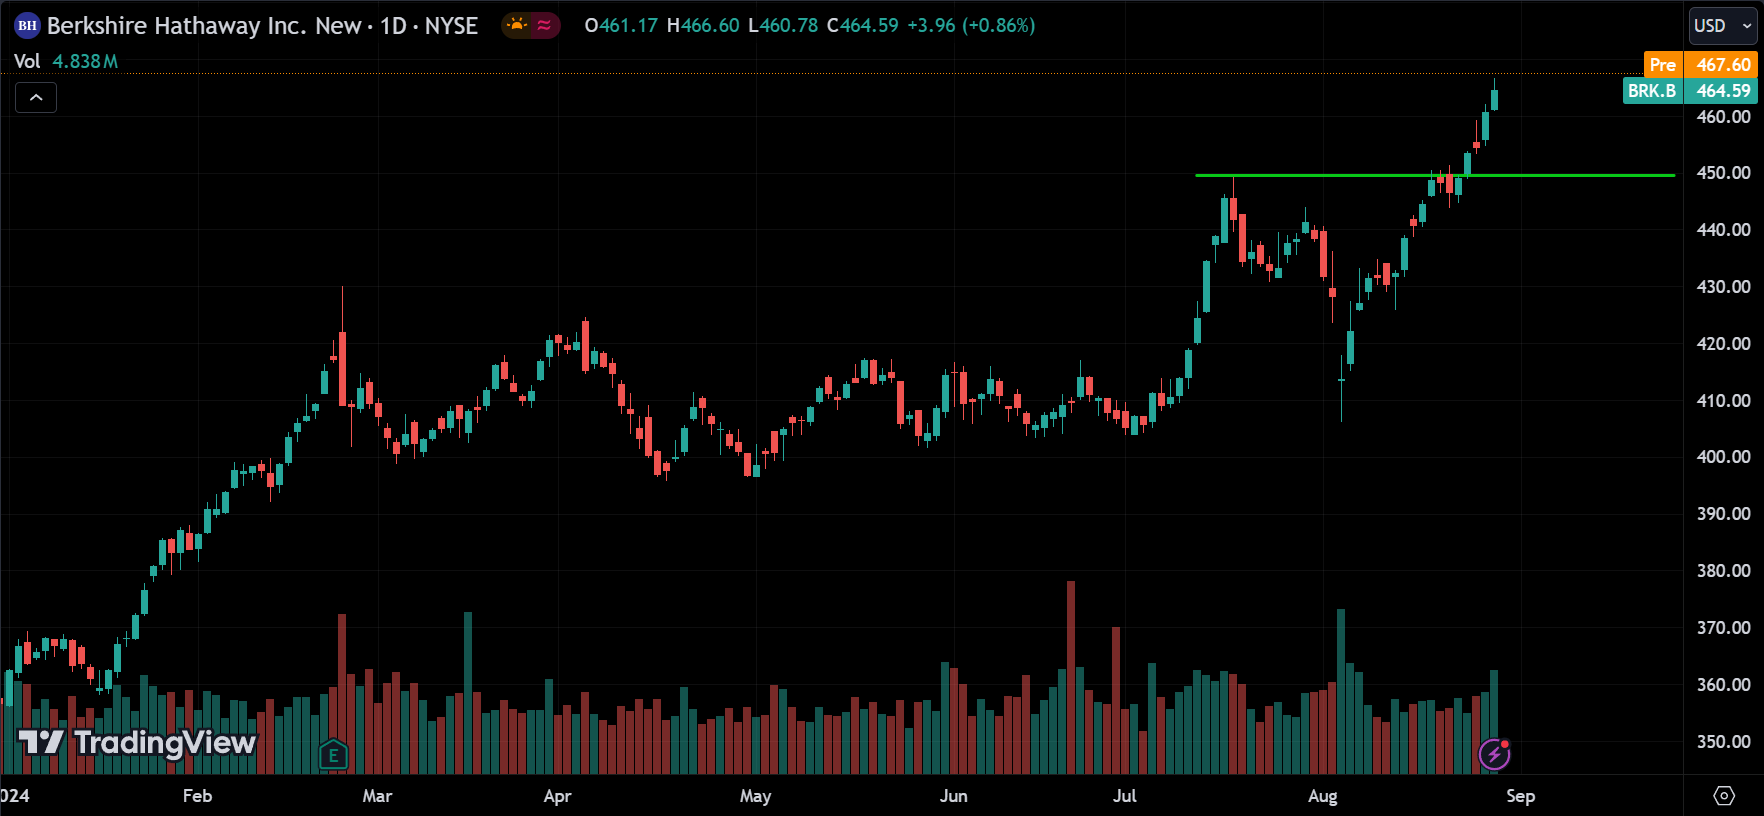
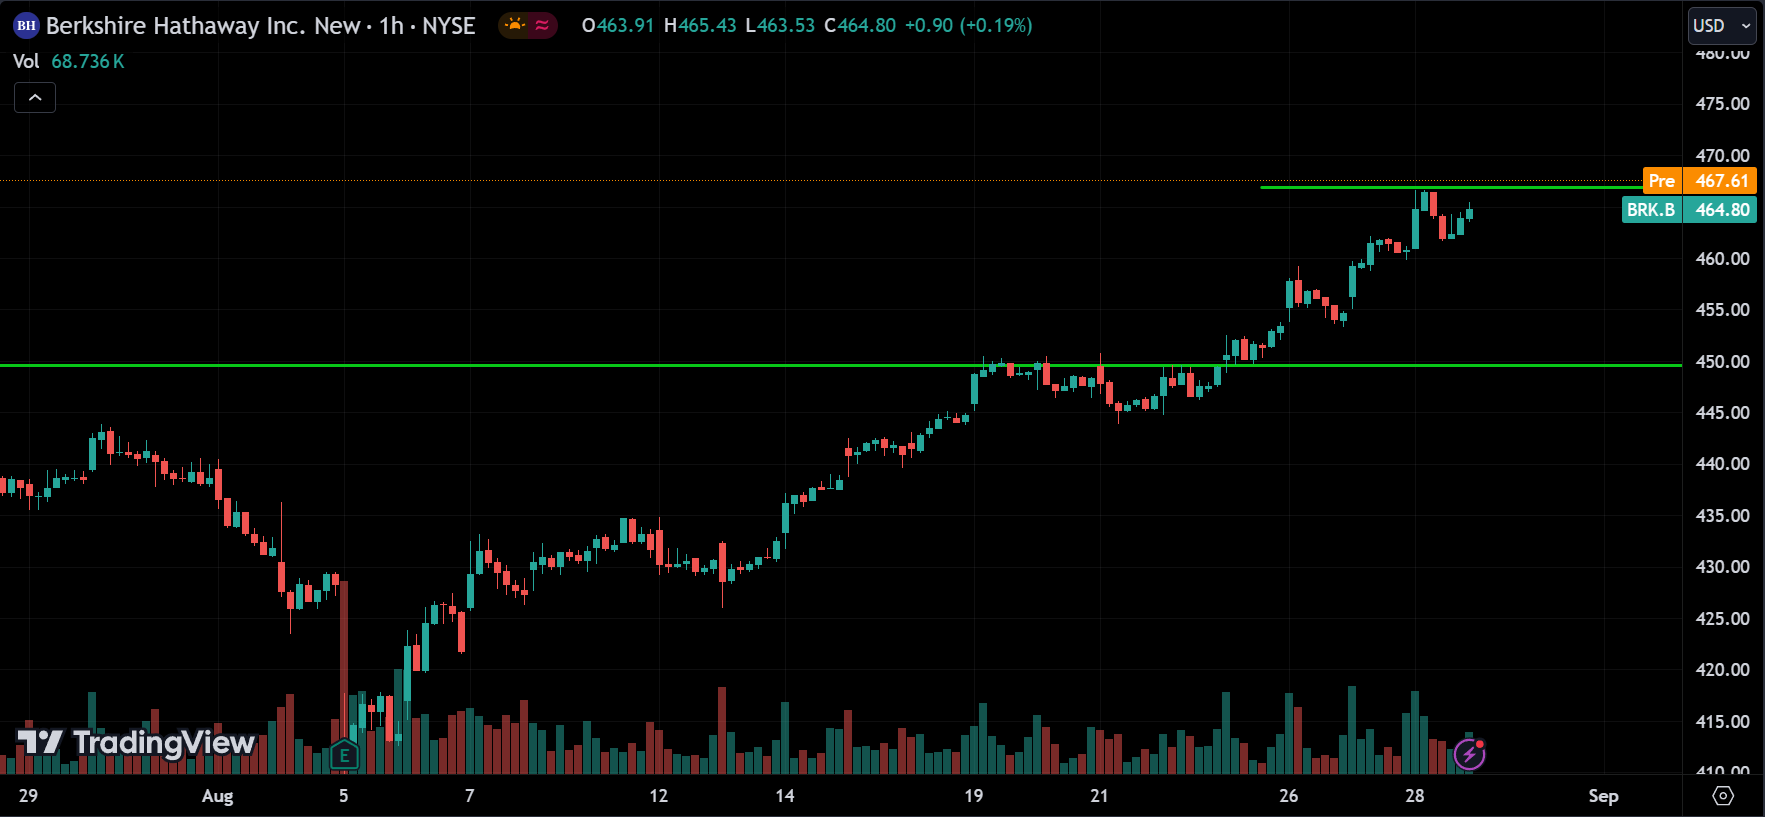
For the first time in history, a financial sector company’s value went above 1 trillion USD. The old man has his way of doing things—the price started to rise after he began selling Bank of America stocks, as he predicted rate cuts were coming. But nobody knows his full strategy until he reveals it. Right now, the price is around the 465 range, and it’s even higher in the pre-market. We can expect this momentum to continue, but a small correction might occur. Usually, when everyone notices this, they start buying shares, which tends to push the stock price even higher.
Conclusion & Disclaimer
Subscribe to our Telegram channel to get instant updates on new articles.
Please provide your feedback on how we can improve this article. Thank you!
We discussed these sectors and markets because when the entire market or sector goes through certain movements, most of the stocks within that market will also experience similar movements. So, by understanding what the market is doing, you can conduct your own analysis on specific stocks.
These analyses are here to help you understand how to analyze the market. They’re not about giving buy or sell signals. It’s simply about observing price action market behavior. I don’t recommend when to buy or sell because trading doesn’t work that way. You need a strategy to guide your decisions about when to enter or exit positions. That’s the key to making consistent profits in the financial markets over time.
The information provided in this market analysis is for educational and informational purposes only. It should not be construed as financial advice or a recommendation to buy, sell, or hold any securities or investments.
All investments involve risk, and past performance is not indicative of future results. The analysis provided may not be suitable for all investors and should be used at their own discretion.
Readers are encouraged to conduct their own research.
Trading and investing in financial markets carry inherent risks, including the risk of losing invested capital. It is important to carefully consider your investment objectives, risk tolerance, and financial situation before making any investment decisions.
GOOD LUCK✌!!!