Before we discuss Fibonacci retracement in trading, let’s first understand what the Fibonacci sequence means.
What is the Fibonacci Sequence?
The Fibonacci sequence is a series of numbers where each number is the sum of the two before it. It starts with 0 and 1, then goes like this: 0, 1, 1, 2, 3, 5, 8, 13, 21, 34, and so on. This pattern keeps going, with each new number being the result of adding the two before it.
It’s named after an Italian mathematician called Fibonacci.
For example, if we start with 0 and 1, we get 1. Then, by adding 1 and 1, we get 2. This goes on: 2 + 1 = 3, 3 + 2 = 5, 5 + 3 = 8, and so on. Each number is made by adding the two before it.
0, 1, 1, 2, 3, 5, 8, 13, 21, 34, 55, 89, 144, 233, 377, 610, 987, 1597, 2584, 4181, 6765, 10946, 17711, 28657, 46368, 75025, 121393, 196418, 317811, 514229, …..
A cool thing about this sequence is the ratios it creates. If you divide one number by the next, you often get a ratio close to 0.6180. This happens with many numbers in the sequence. For example, 610 divided by 987 is about 0.6180. And if you divide 6765 by 10946, you still get around 0.6180. So, no matter which numbers you pick, this ratio shows up.
People love the Fibonacci sequence because it’s everywhere in nature, art, and architecture. It brings beauty and balance to things it’s used in. That’s why it’s so well-known and studied. If you want to learn more, there are lots of resources online to explore further.
How to use Fibonacci Retracement in Trading?
There are a lot of technical indicators based on the Fibonacci sequence, and the one that works the best and is most popular is Fibonacci retracement levels. this indicator is available on every charting software and trading platform, including TradingView.
How it works is by selecting a low and high point in a trend. You draw it from the start to the end of the trend. What’s shown here includes different Fibonacci ratios, marked from 0 to various levels. These levels are 0.23 (23% from the 0th level), 0.38 (38% from the 0th level), 50%, 61.8%, and 78.9%.
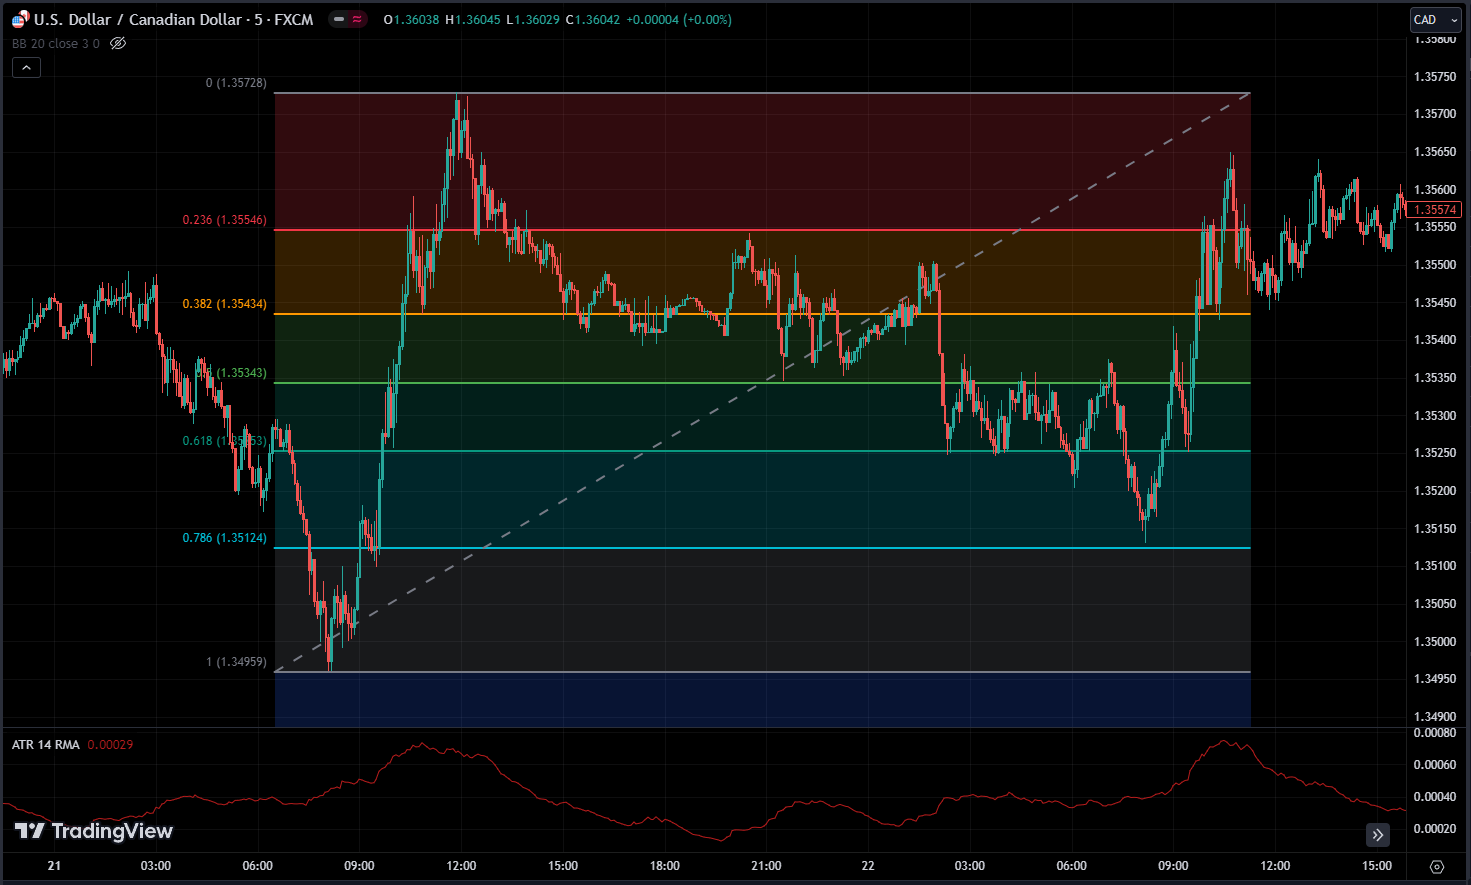
Let’s revisit the previously mentioned golden ratio, 0.618, which corresponds to the 61.8% level. Now, let’s delve into how we derive these other levels.
Take the number 610: instead of dividing it by the next number, divide it by the number following that one – in this case, 1597, which yields 0.381, representing the 38% level. Moving forward, if we divide 610 by 2584, the result is 0.236, indicating the 23% level. It’s worth noting that while one level, the 50% level, isn’t directly from the Fibonacci sequence, it’s included due to the frequent retracements observed at this point.
The primary application involves drawing the indicator from a low point to a high point. This allows us to analyze a trend that appears to be moving in a particular direction, with the expectation that it will continue. However, it’s common for prices to retrace or pull back before resuming their trend.
The key question then arises: to what extent will this retracement occur? Through this indicator, we discover that retracements often align with levels derived from the Fibonacci sequence. It’s particularly common for retracements to occur at levels such as 23%, 38%, and 61%. Recognizing this, we include these levels when plotting the indicator, and interestingly, they often act as support or resistance. This understanding enhances our awareness of the likelihood of a pullback to one or more of these levels.
If you anticipate that the price will continue its trend and you want to enter a position, timing your entries strategically becomes crucial. You can place your entries at these specific levels, expecting a bounce from one of them, which would signal the continuation of the trend.
This indicator can form the basis for developing trading strategies. How you utilize this indicator is entirely customizable and depends on your preferences and objectives.
Conclusion
In conclusion, understanding the Fibonacci sequence and its application in trading can provide valuable insights for traders. By identifying key retracement levels derived from this sequence, traders can anticipate potential price movements and strategically time their entries and exits.
These Fibonacci levels often act as significant points of support or resistance, enhancing the accuracy of trading decisions. Whether incorporating Fibonacci retracement as part of a broader trading strategy or using it as the foundation for constructing new approaches, traders have a versatile tool at their disposal. Ultimately, mastering the principles of Fibonacci retracement empowers traders to navigate the complexities of financial markets with greater confidence and precision.