![US Stock Market Today [2024.09.09]: Key Price Levels and Trends for S&P 500 & Sectors xlearnonline.com](https://xlearnonline.com/wp-content/uploads/2024/09/Stock-Market-Analysis-1024x576.png)
Hello, and welcome to xlearn’s US stock market today article series. If this is your first time here, I recommend reading our guide on how to use our market analysis article before diving into this one.
Rate cuts are approaching, and with the CPI data being released this week, it marks an important week for the stock markets. The markets are currently pulling back, and I believe we’ll have a clearer idea of where they’re headed after the CPI release.
We will use a top-down approach in our analysis. First, we will analyze the overall market, focusing on the S&P 500. Then, we will analyze each sector one by one for their price action performance so we can trade stocks in those sectors with confidence. Finally, we will look at some stocks to watch for today.
Before we get into the analysis, let’s quickly review the major economic events that could impact the market.
Economic Events Today
These events include important news that could impact the stock market, macroeconomic reports, and economic indicators. For more details, you can check the bloomberg calendar & yahoo finance.
- There are no major economic events today that could affect the stock market.
Stocks with Earnings:
S&P 500

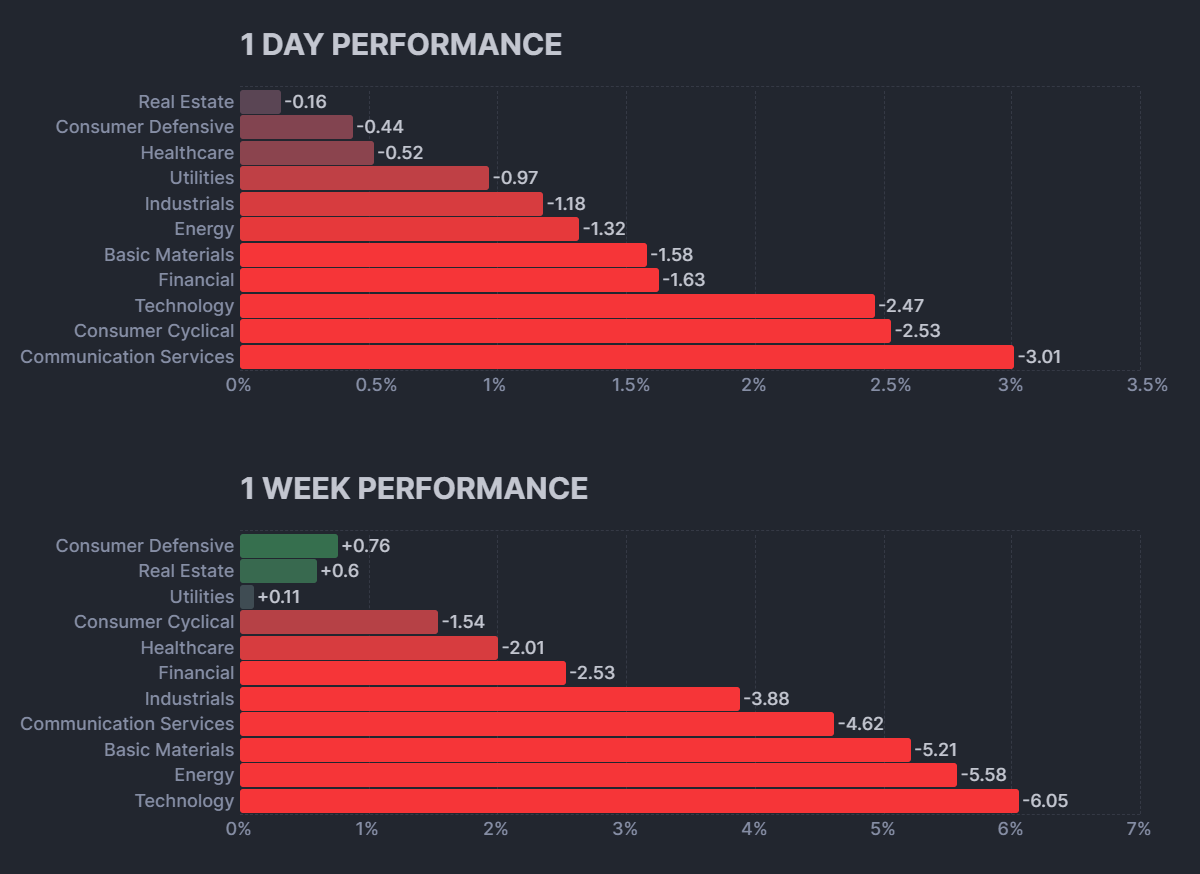
Looking at the S&P 500, or the overall market, we’re in a bearish phase. Some people might say the market is crashing, but from my experience in the financial markets, it’s better to act on what’s happening rather than guess what might happen. Right now, the main takeaway is that the market is going through a pullback. This pullback could either be a correction or a reversal, but we need more confirmation to know for sure. We’ll discuss this further when we talk about the sectors.
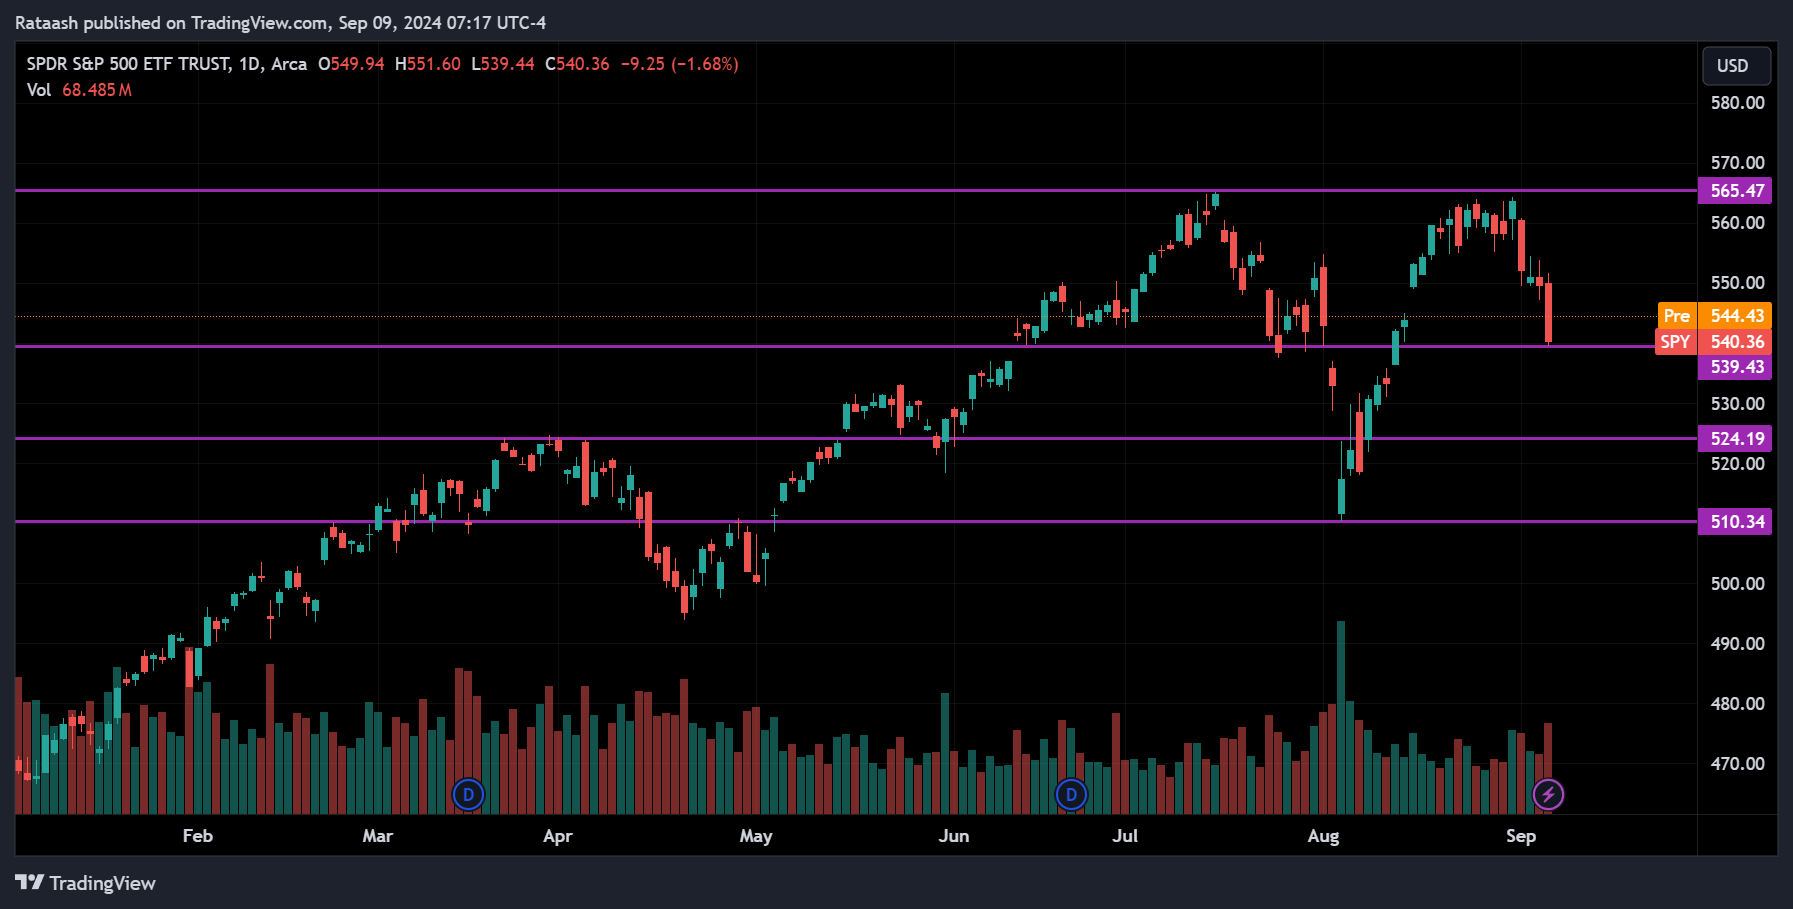
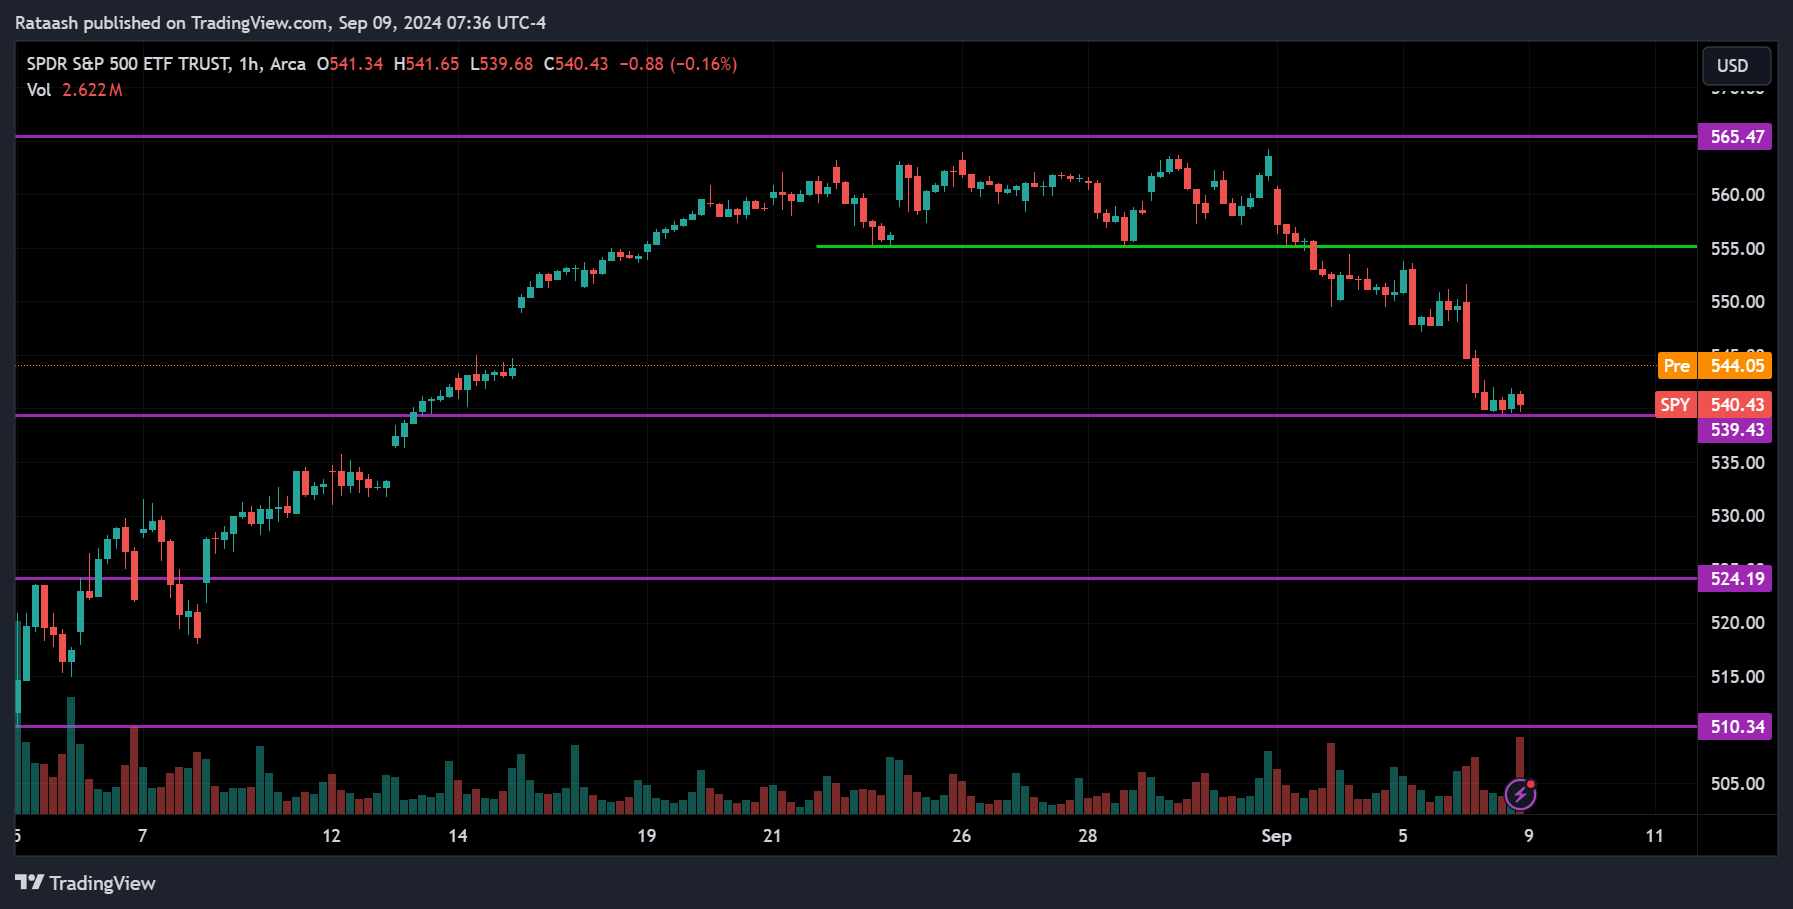
The SPY ETF is currently pulling back from the 565.50 resistance level and is now at the 540 support level. If this pullback continues, we can expect the price to break below the support and head toward the 524 support level. On the other hand, if this is just a correction, we can expect the price to reverse from where it’s trading now and move toward 555.
Consumer Staples Sector(XLP):
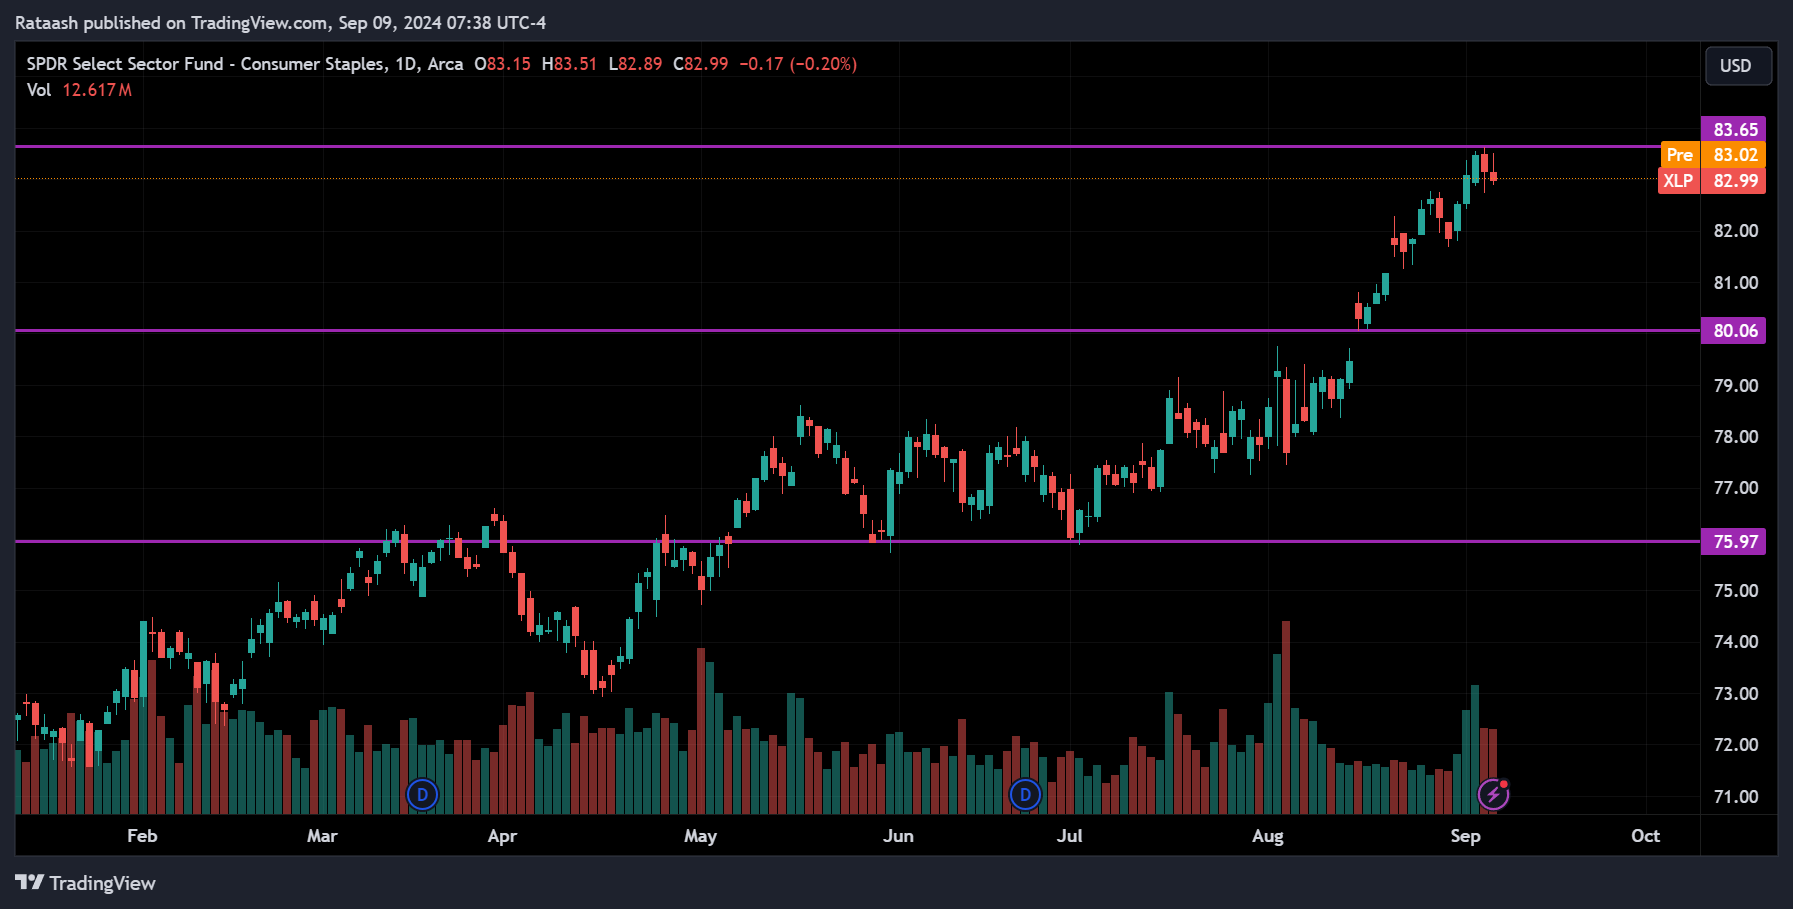
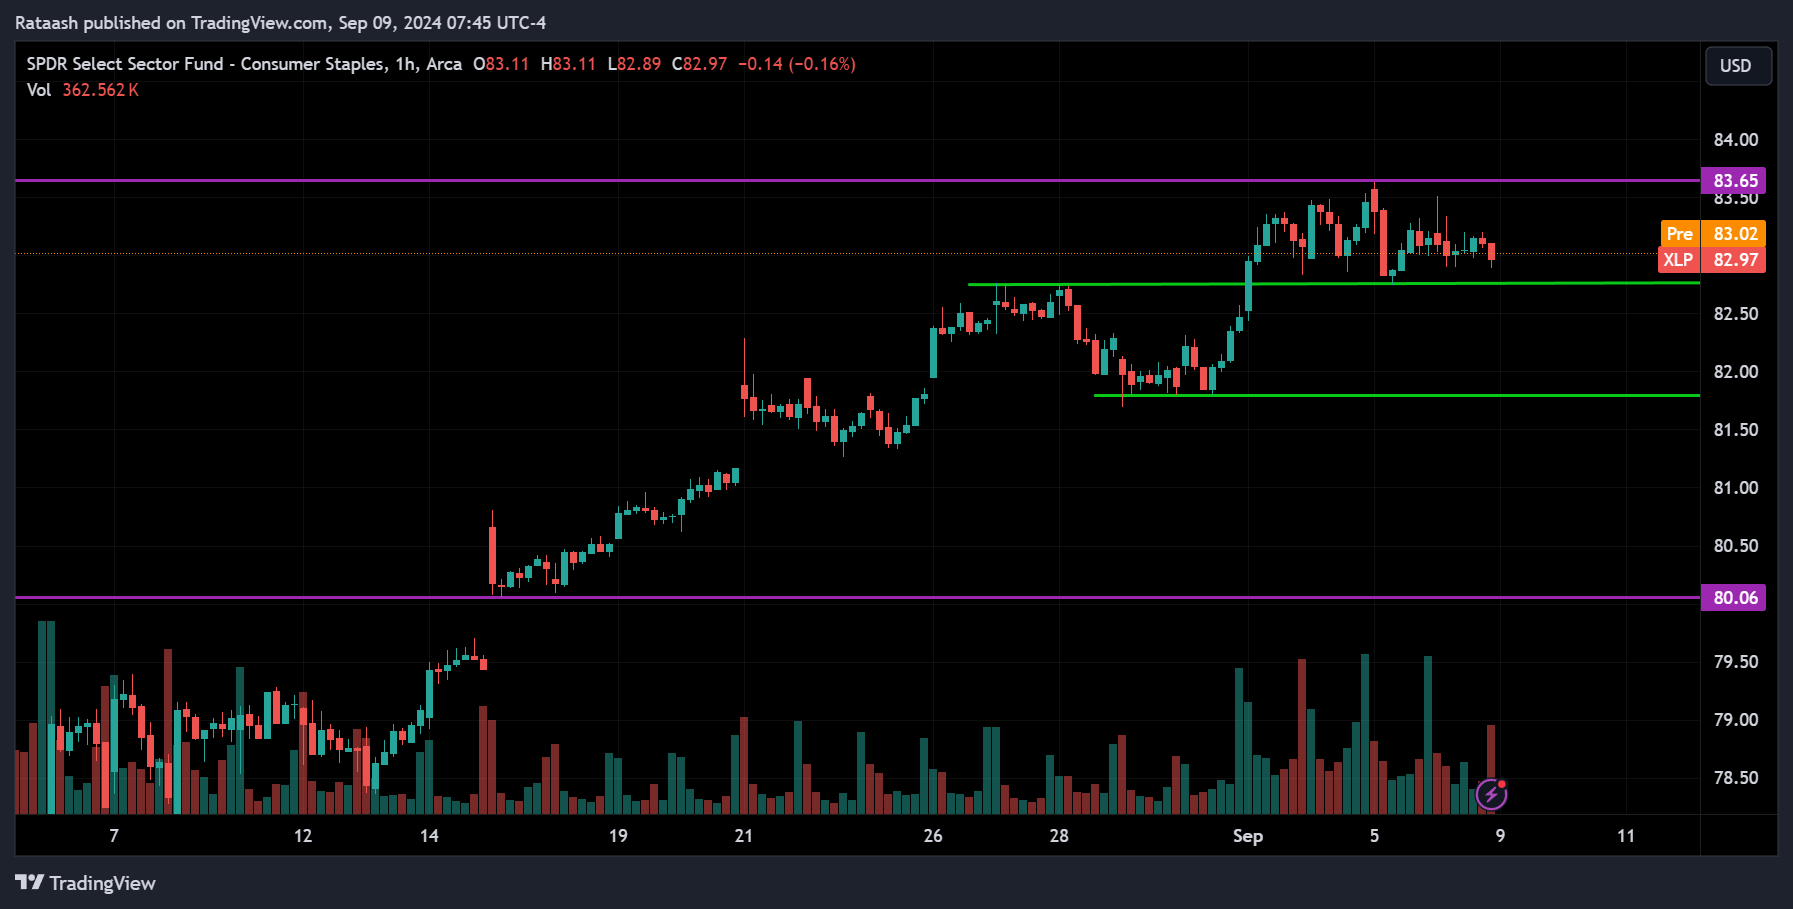
The XLP ETF, or consumer staples sector, is uptrending and currently at a high level. The price is around the 83.65 resistance and consolidating between the 82.75 support. If the price breaks below the support, we can expect it to drop to the 82 support level. On the other hand, if the price starts to rise and breaks above the 83.65 resistance, we can expect the uptrend to continue.
Energy Sector(XLE):
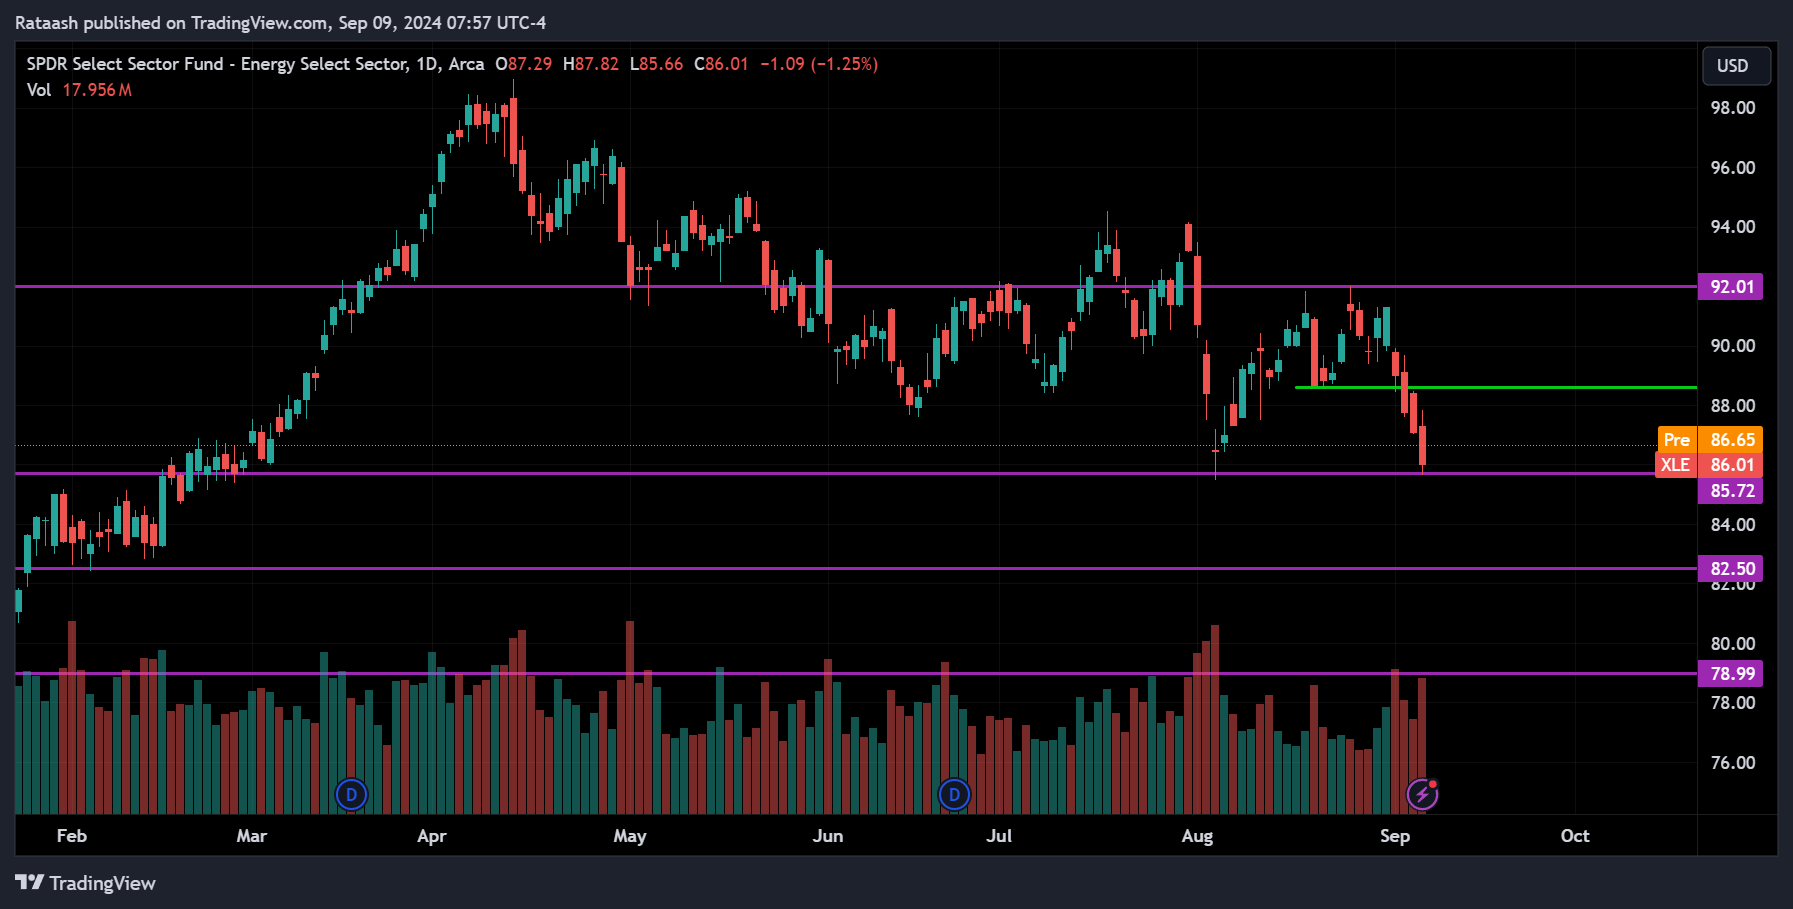
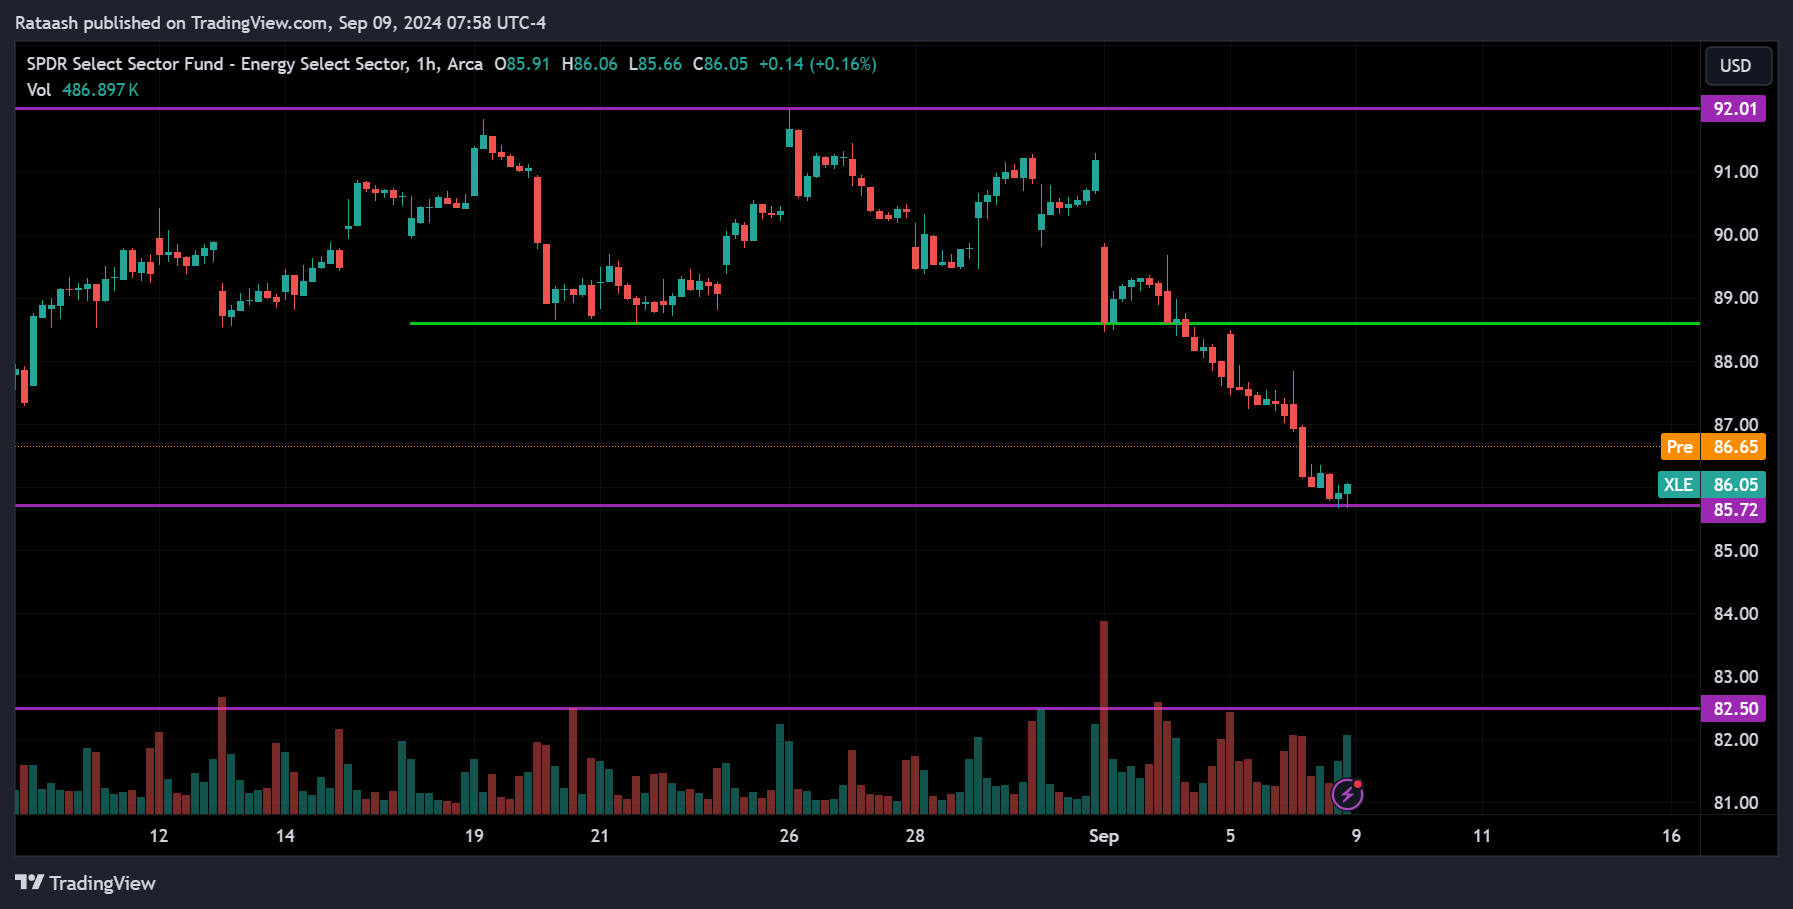
The XLE ETF, or the energy sector, is overall trending down. Right now, the price is at the 85.70 support level. If the price breaks below this support, we can expect the downtrend to continue toward 82.50. On the other hand, we might see a pullback if the price starts moving up again. It could drop again from the 89 resistance range, but if the price breaks above that level, we could expect an uptrend with the price heading toward 92.
Materials Sector(XLB):
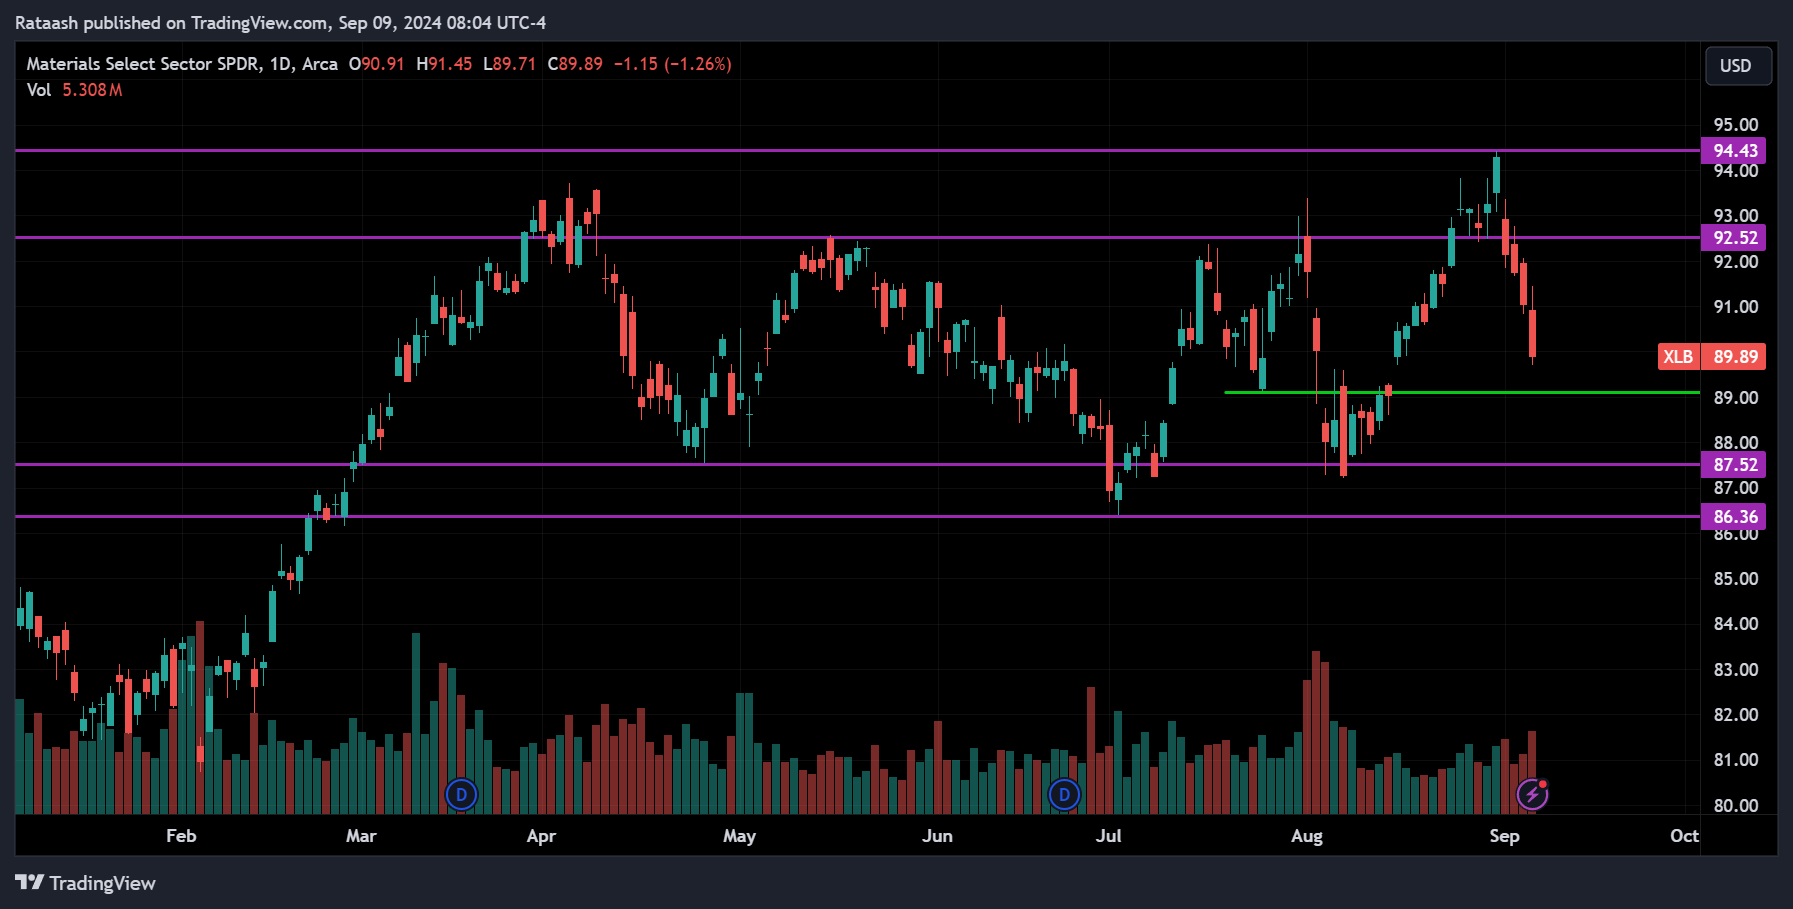
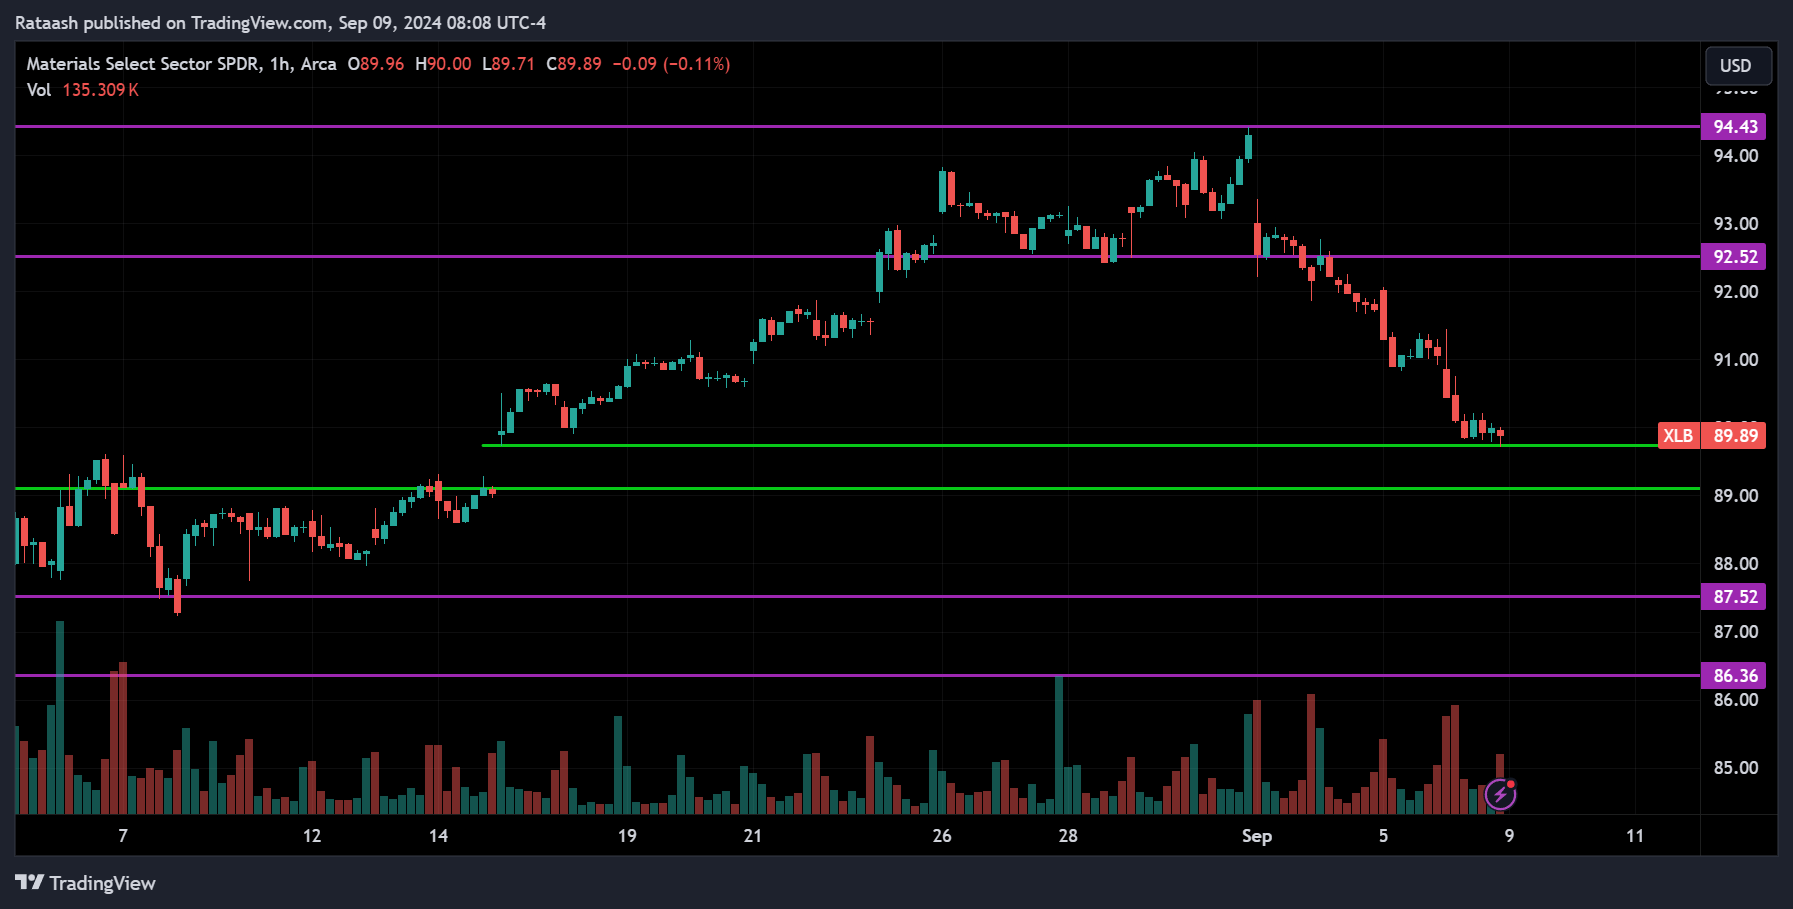
The XLB ETF, or Materials sector, is overall consolidating. Currently, the price is dropping from the 94.40 resistance level and is now at the 90 support. If the downtrend continues, we can expect the price to break below 90 and 89, heading toward the 87.50 level. On the other hand, we might also see a pullback toward 92.50 from where it’s trading now. Watch out for the price breaking above 92.50, as it could signal an uptrend.
Industrial Sector(XLI):
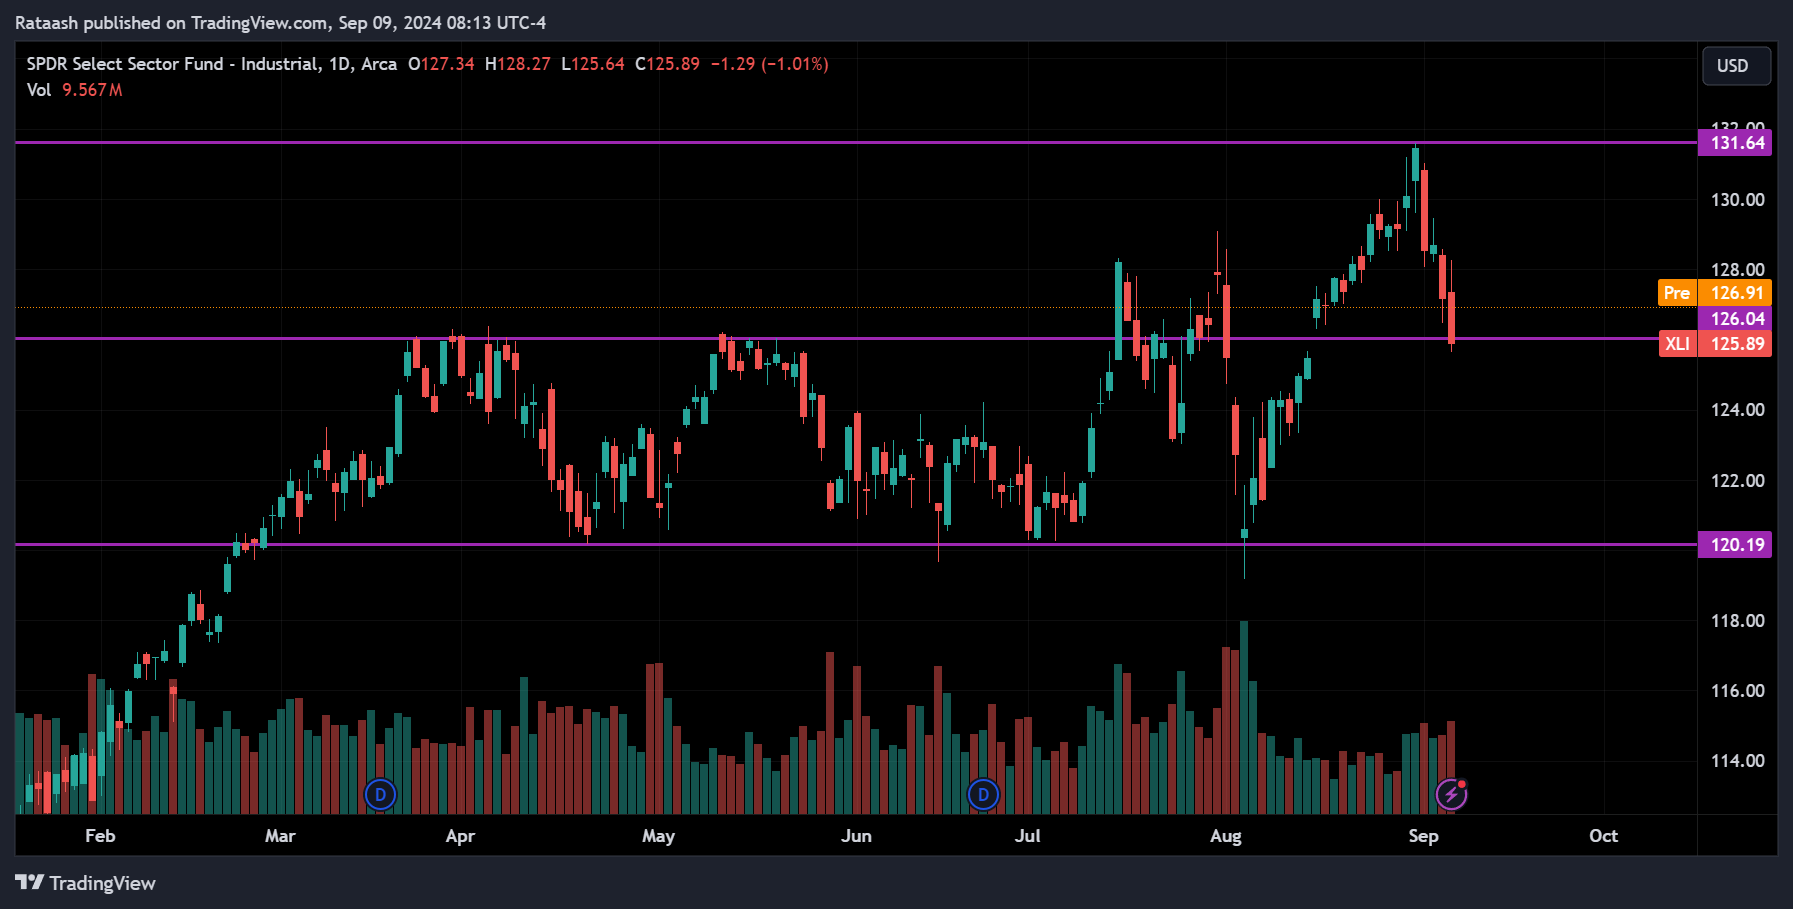
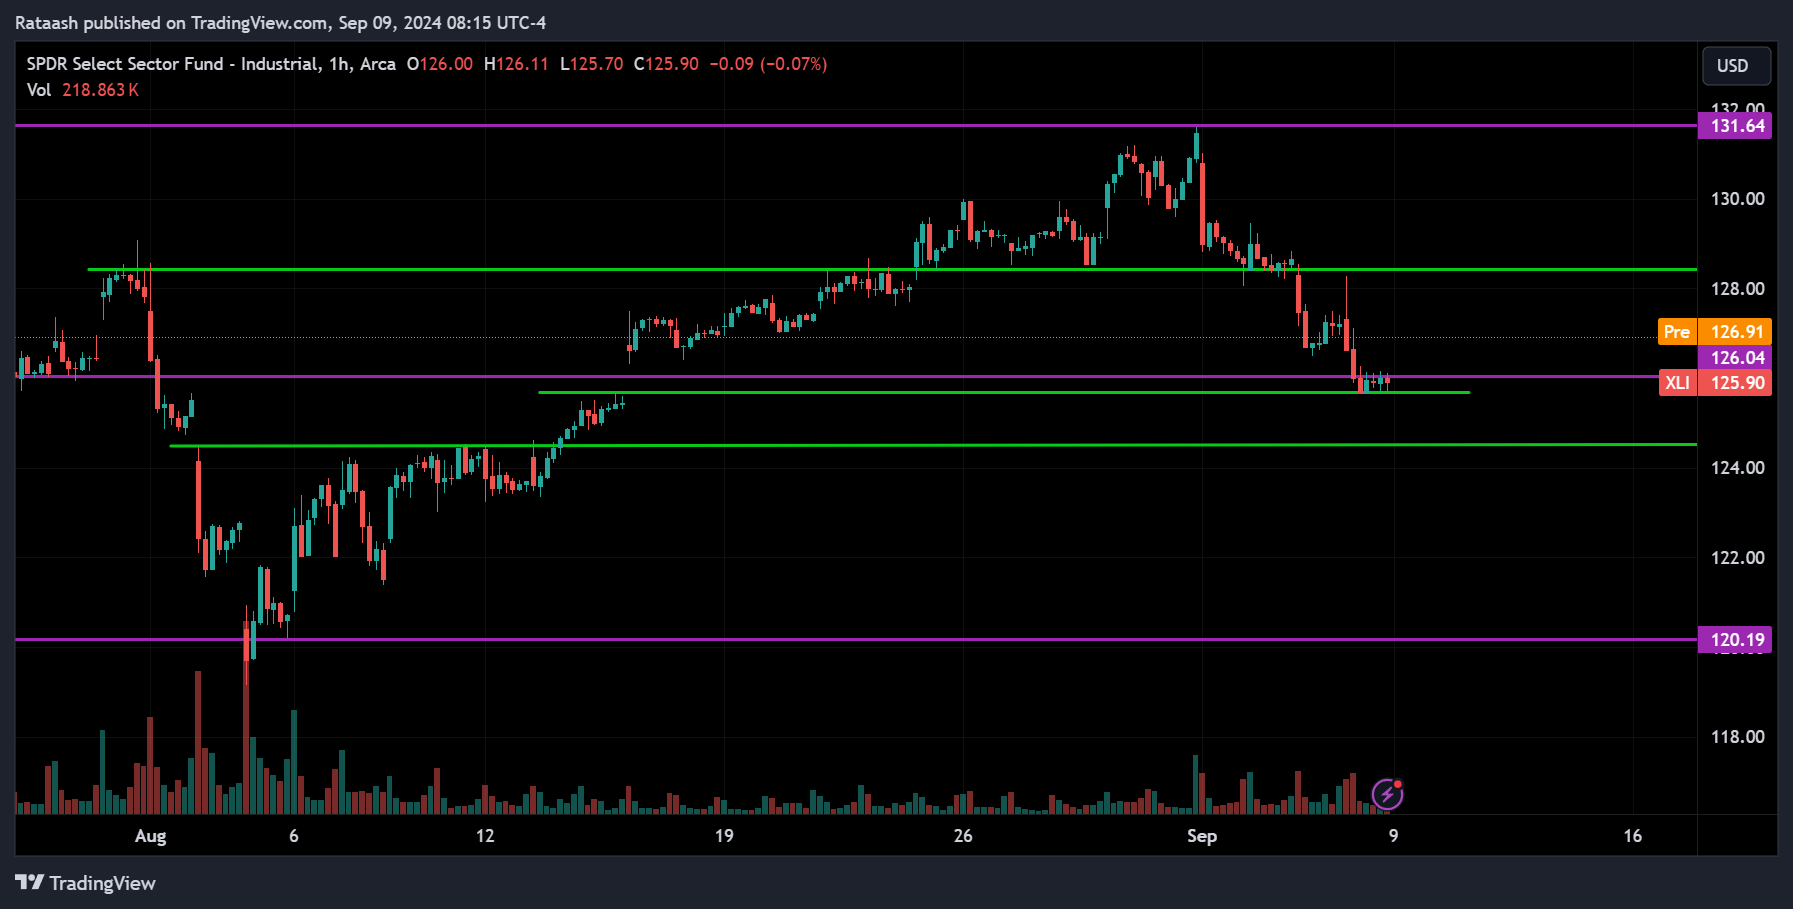
The XLI ETF, or Industrial sector, was in an uptrend, but right now, the price is pulling back from the 131.65 resistance. It’s currently at the 126 support level. If the downtrend continues, we can expect the price to break below this level and head toward the 125 support range. However, if the price reverses and starts going up, we can expect it to pull toward the 128 level.
Consumer Discretionary Sector(XLY):
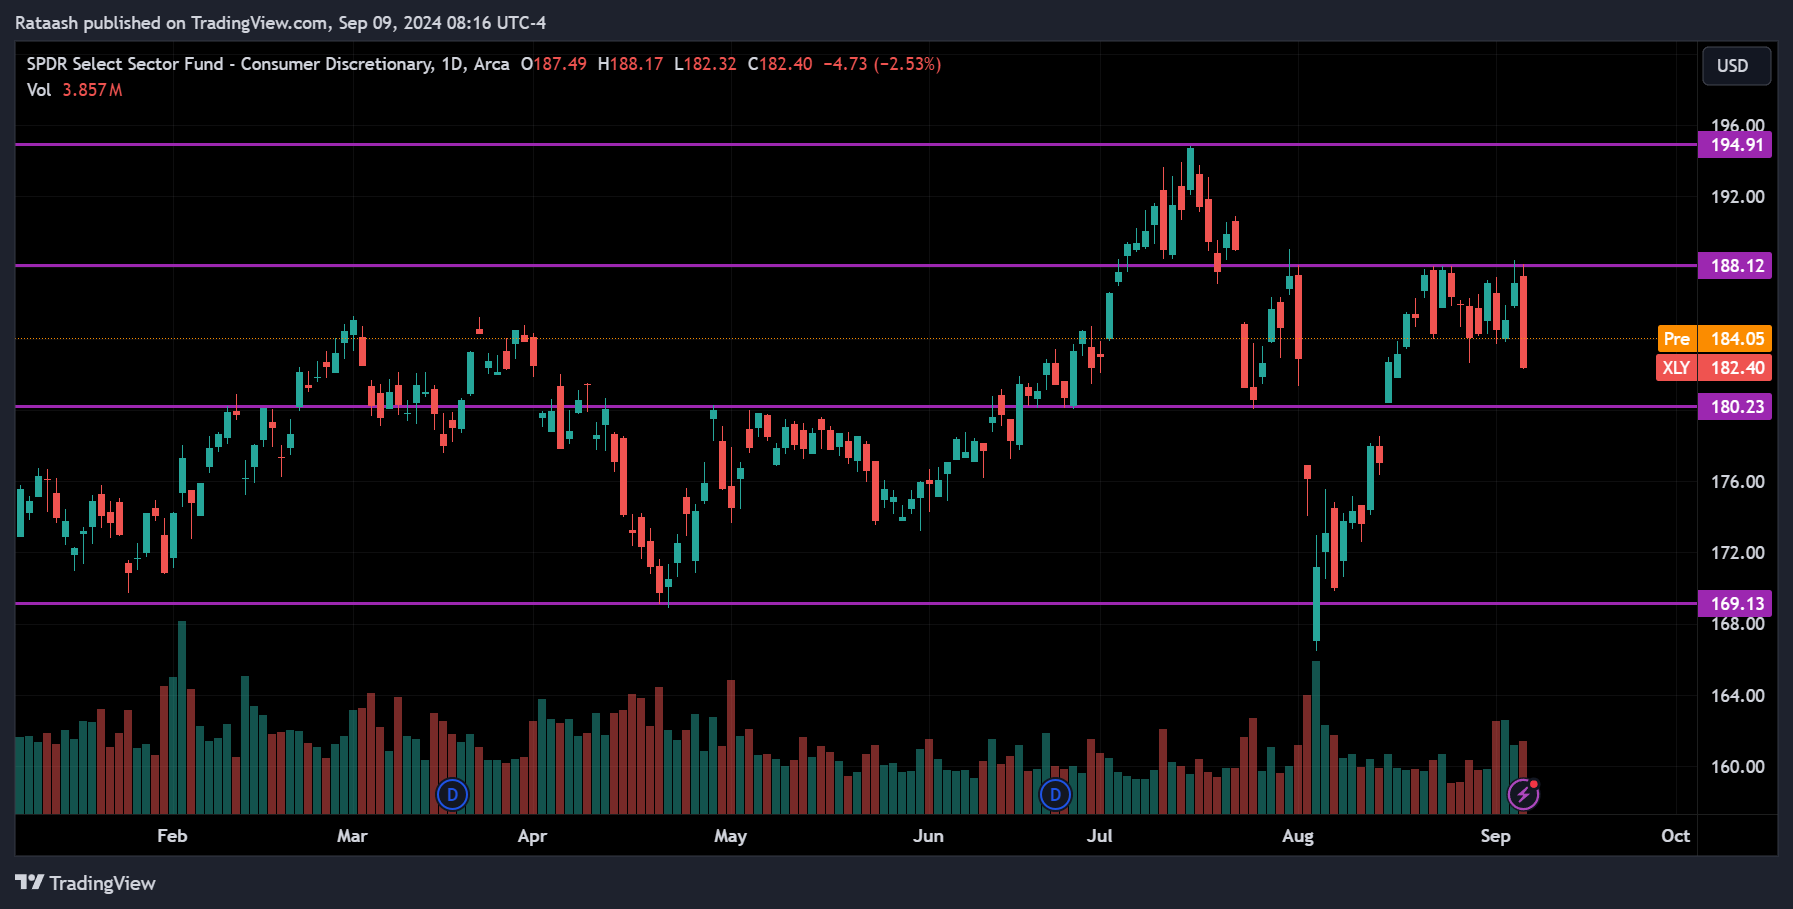
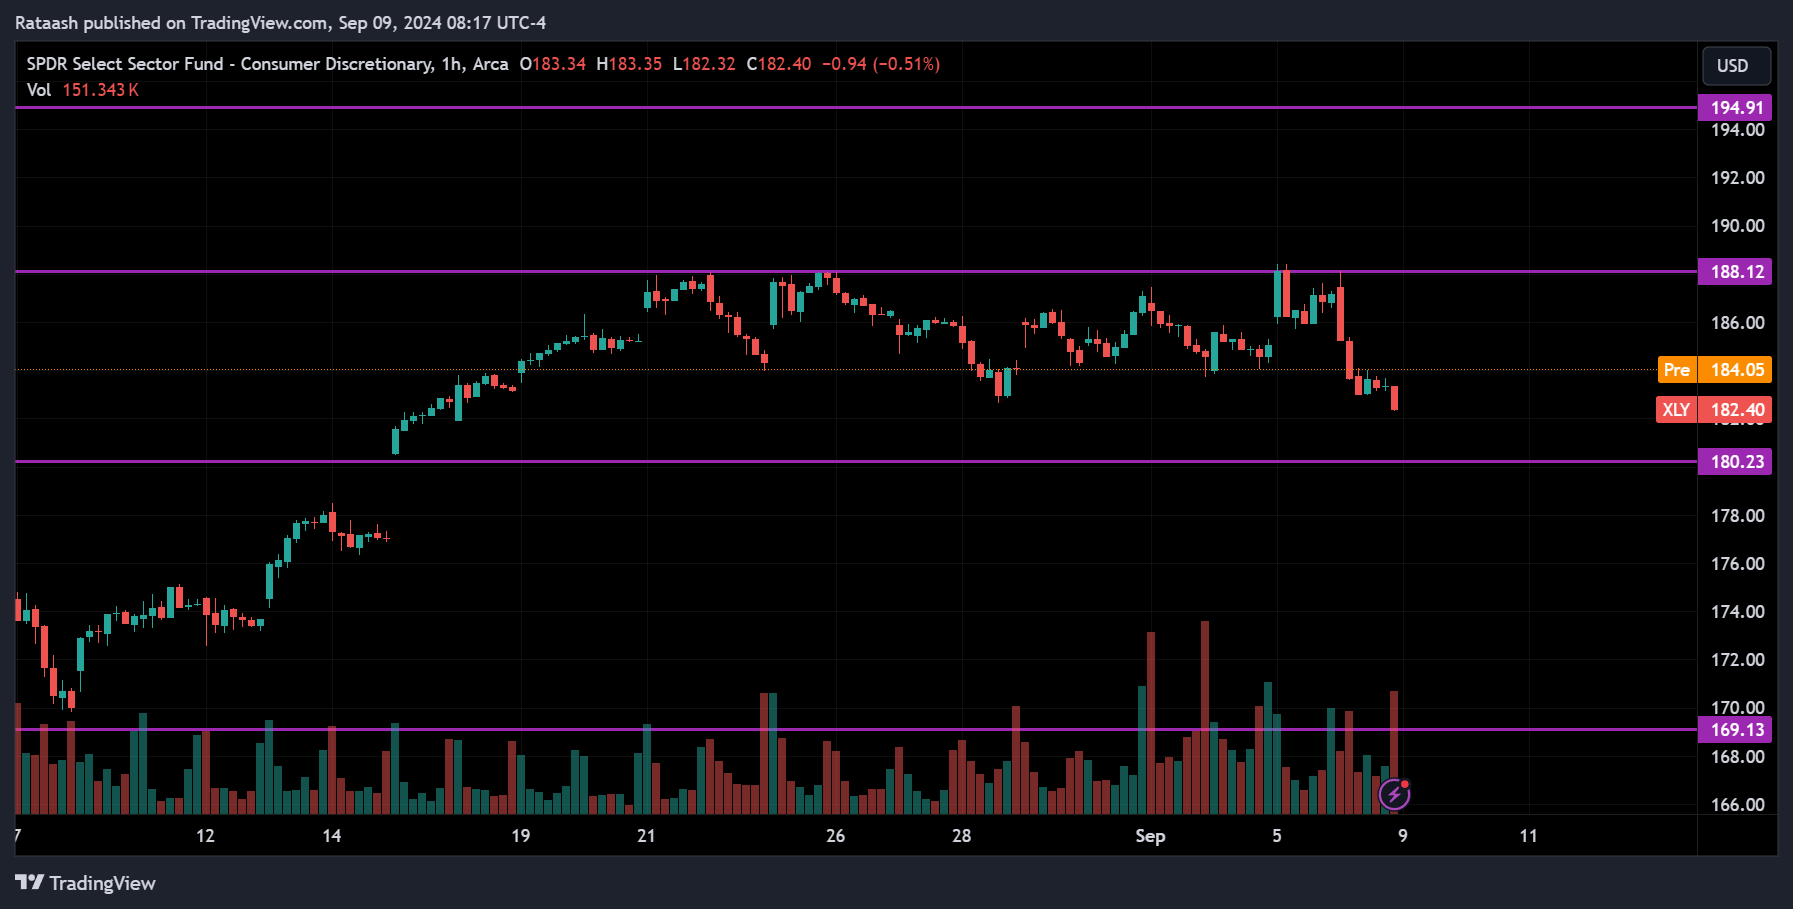
The XLY ETF, or consumer discretionary sector, is overall consolidating. Looking at the 1-hour chart, the price is moving between the 188.12 resistance and 180.20 support range. If the price breaks below or above either of these levels, that will indicate the next direction. So, it’s best to wait for the breakout to determine the trend.
Healthcare Sector(XLV):
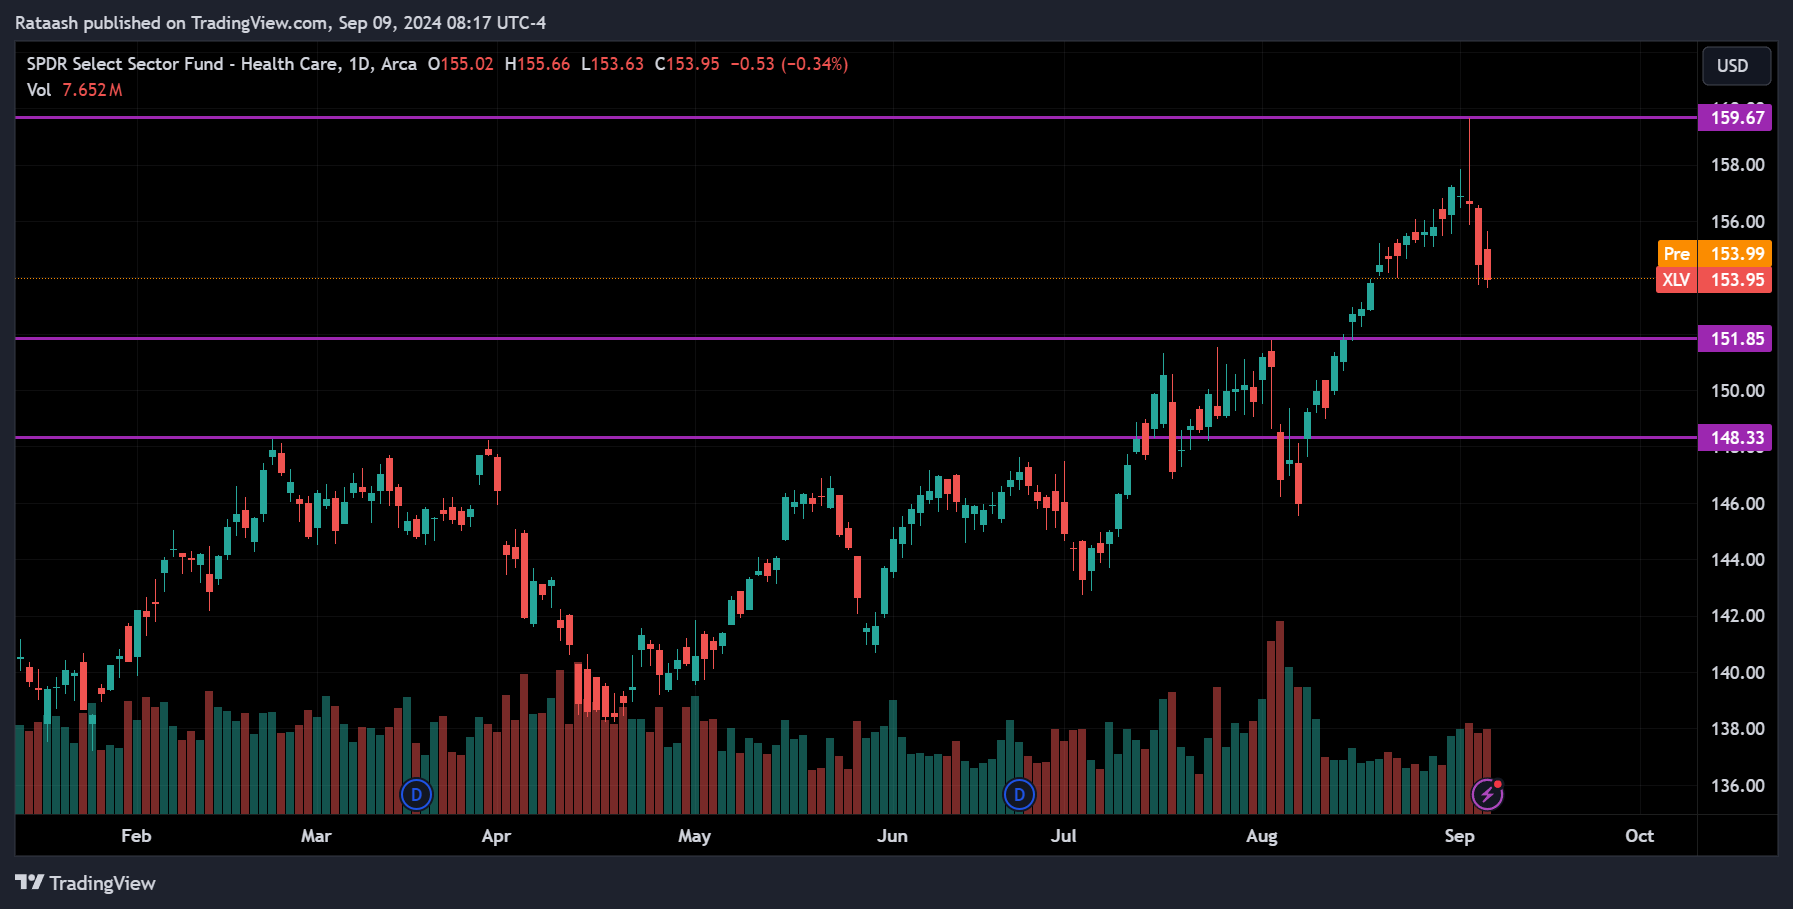
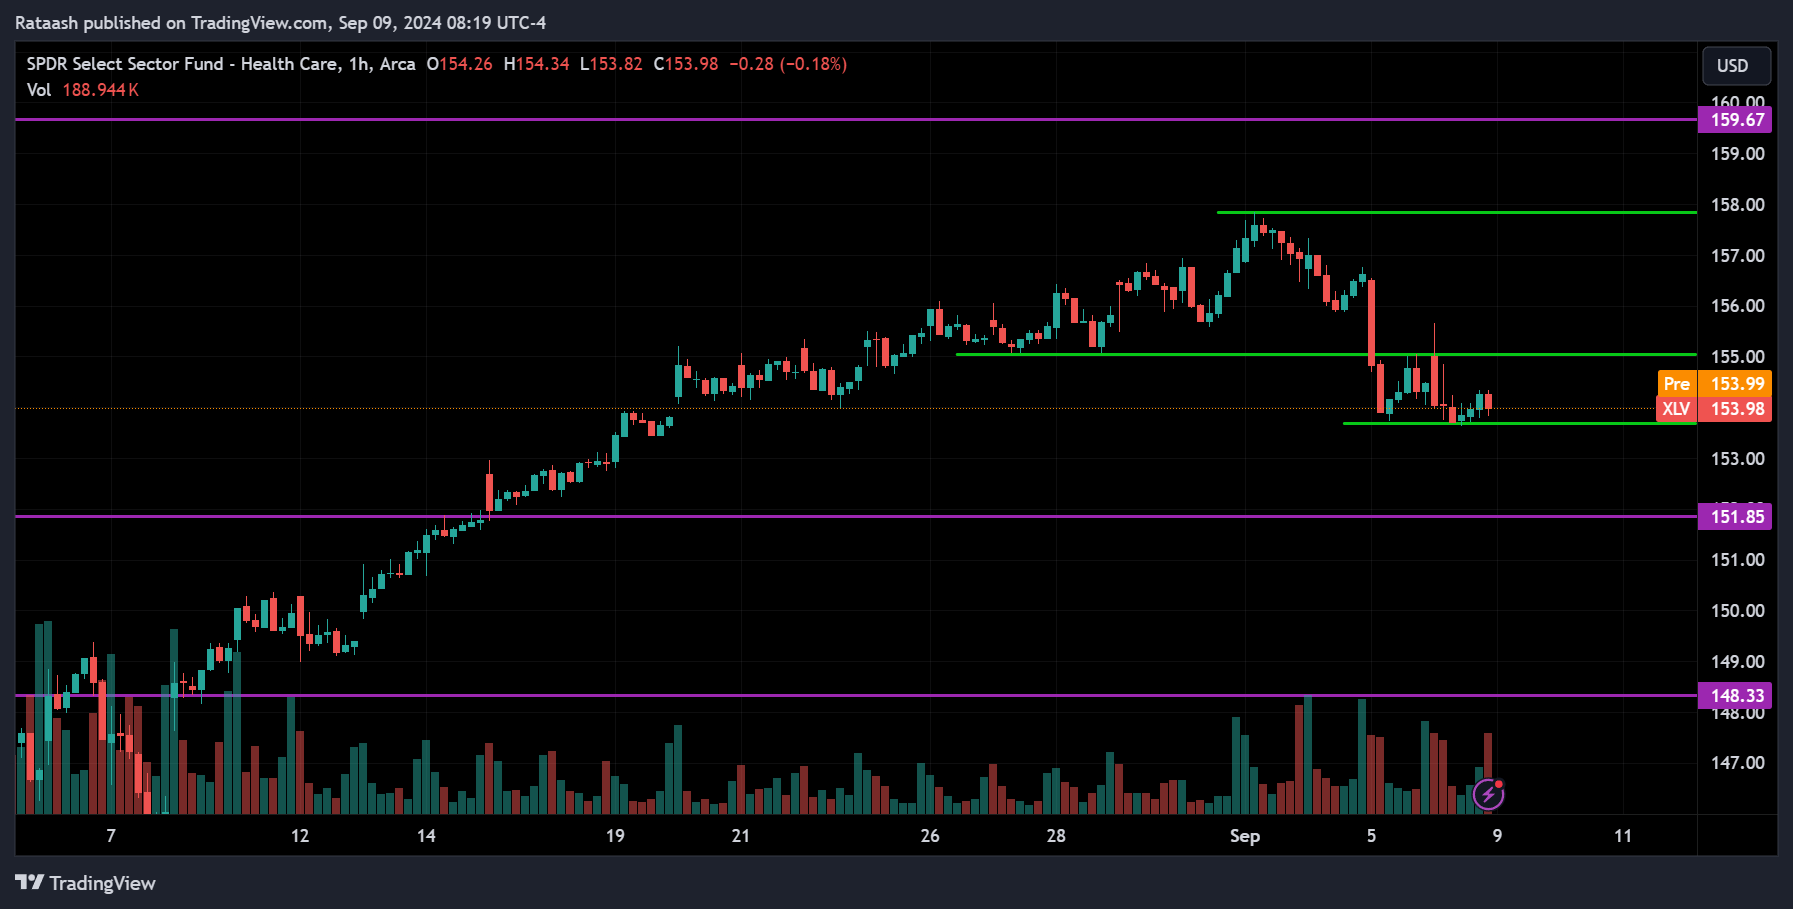
The XLV ETF, or healthcare sector, is overall trending up. Currently, the price is pulling back from the 160 resistance level and is consolidating between the 155 resistance and 153.60 support. If the pullback continues, we can expect the price to break below this support and head toward the 151.85 support range. On the other hand, if the price breaks above the 155 resistance, we can expect it to move toward the 158 range.
Financials Sector(XLF):
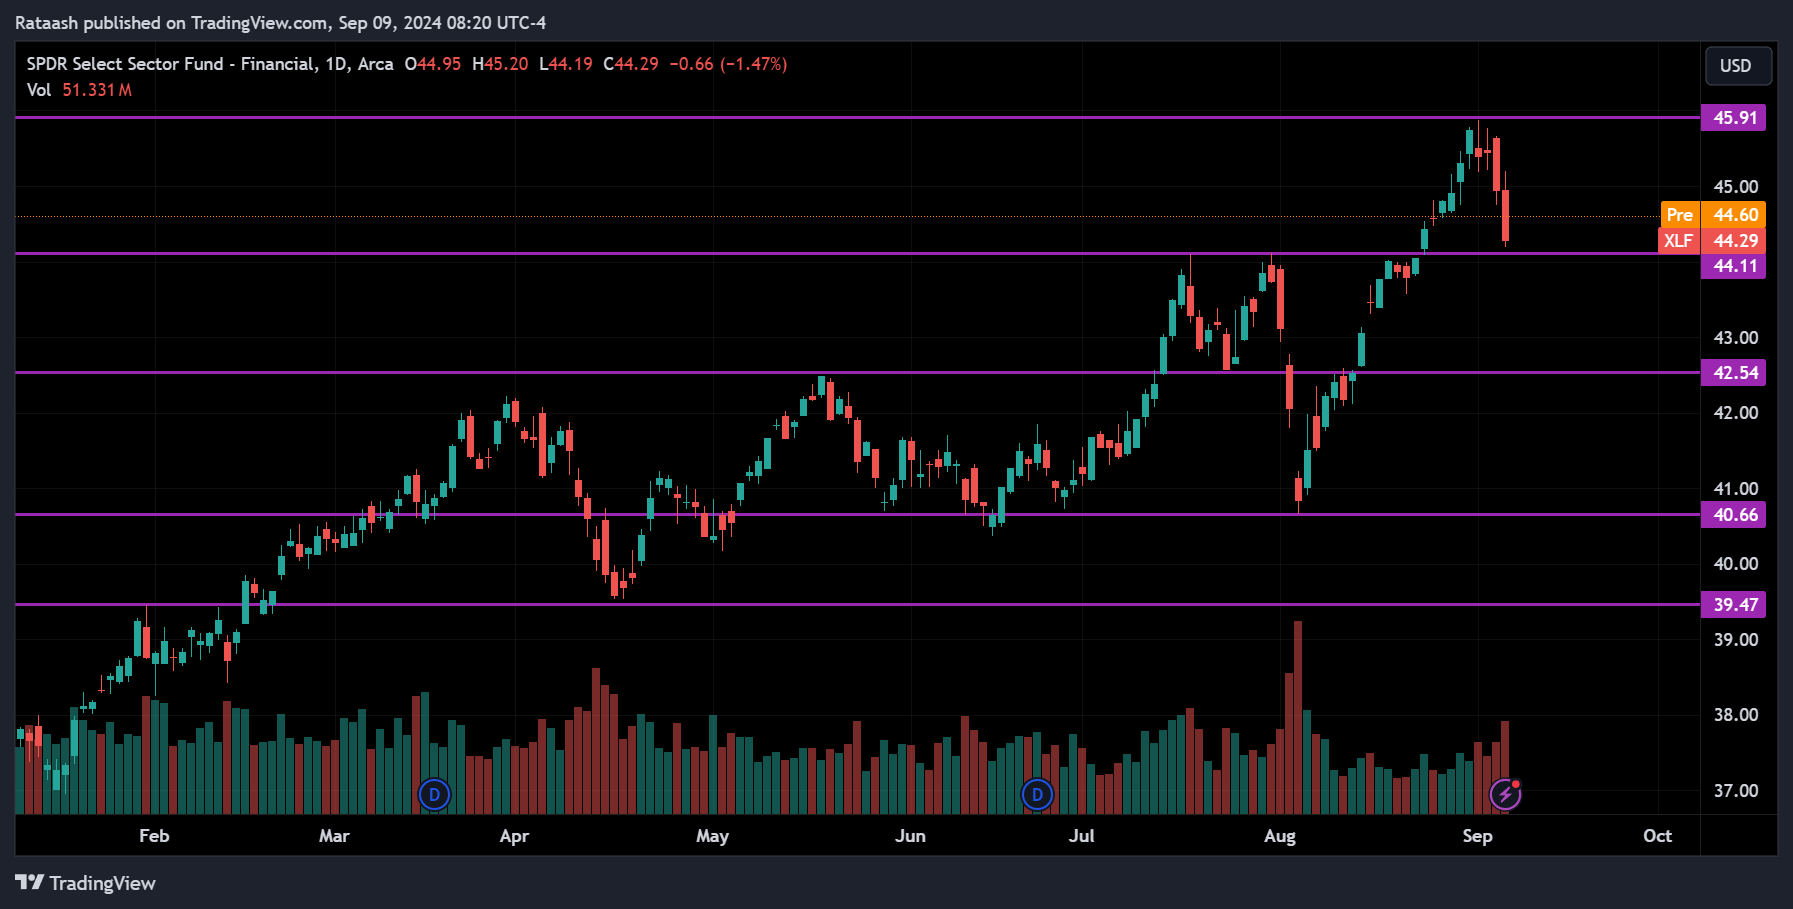
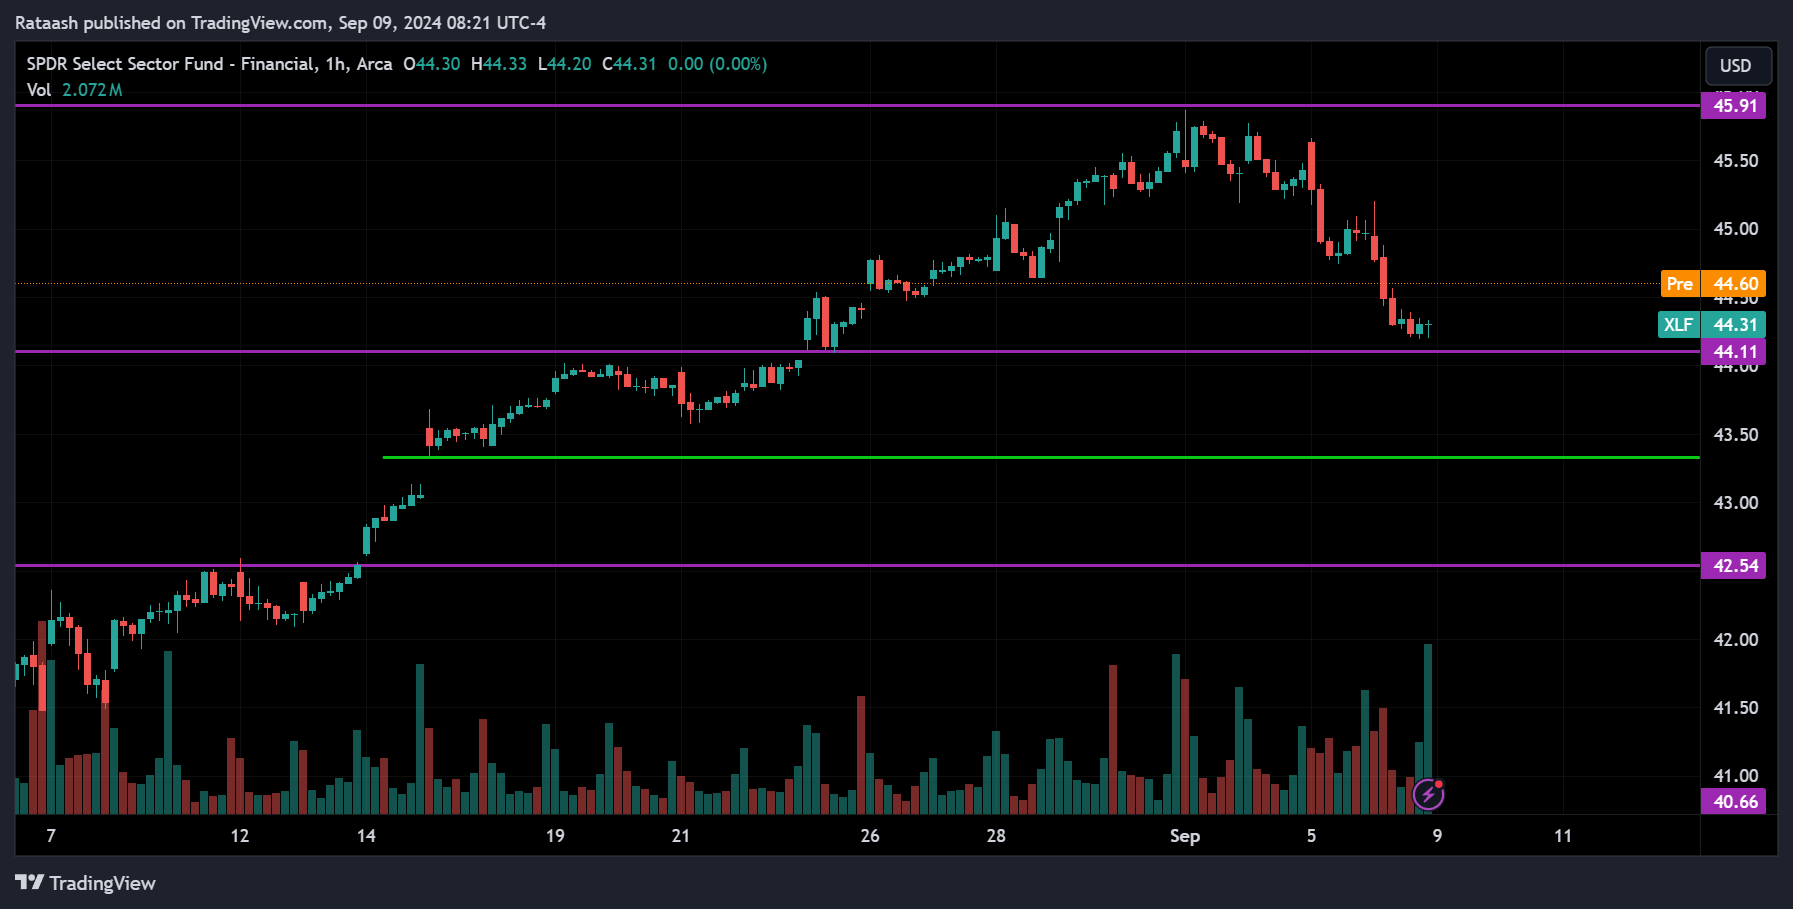
The XLF ETF, or financial sector, is overall trending up. The price is currently pulling back from the 45.90 resistance and is now at the 44.10 support. If the price breaks below this support, we can expect it to drop to 43.50. On the other hand, if the price reverses, we can expect it to move back up to the 45.90 level.
Technology Sector(XLK):
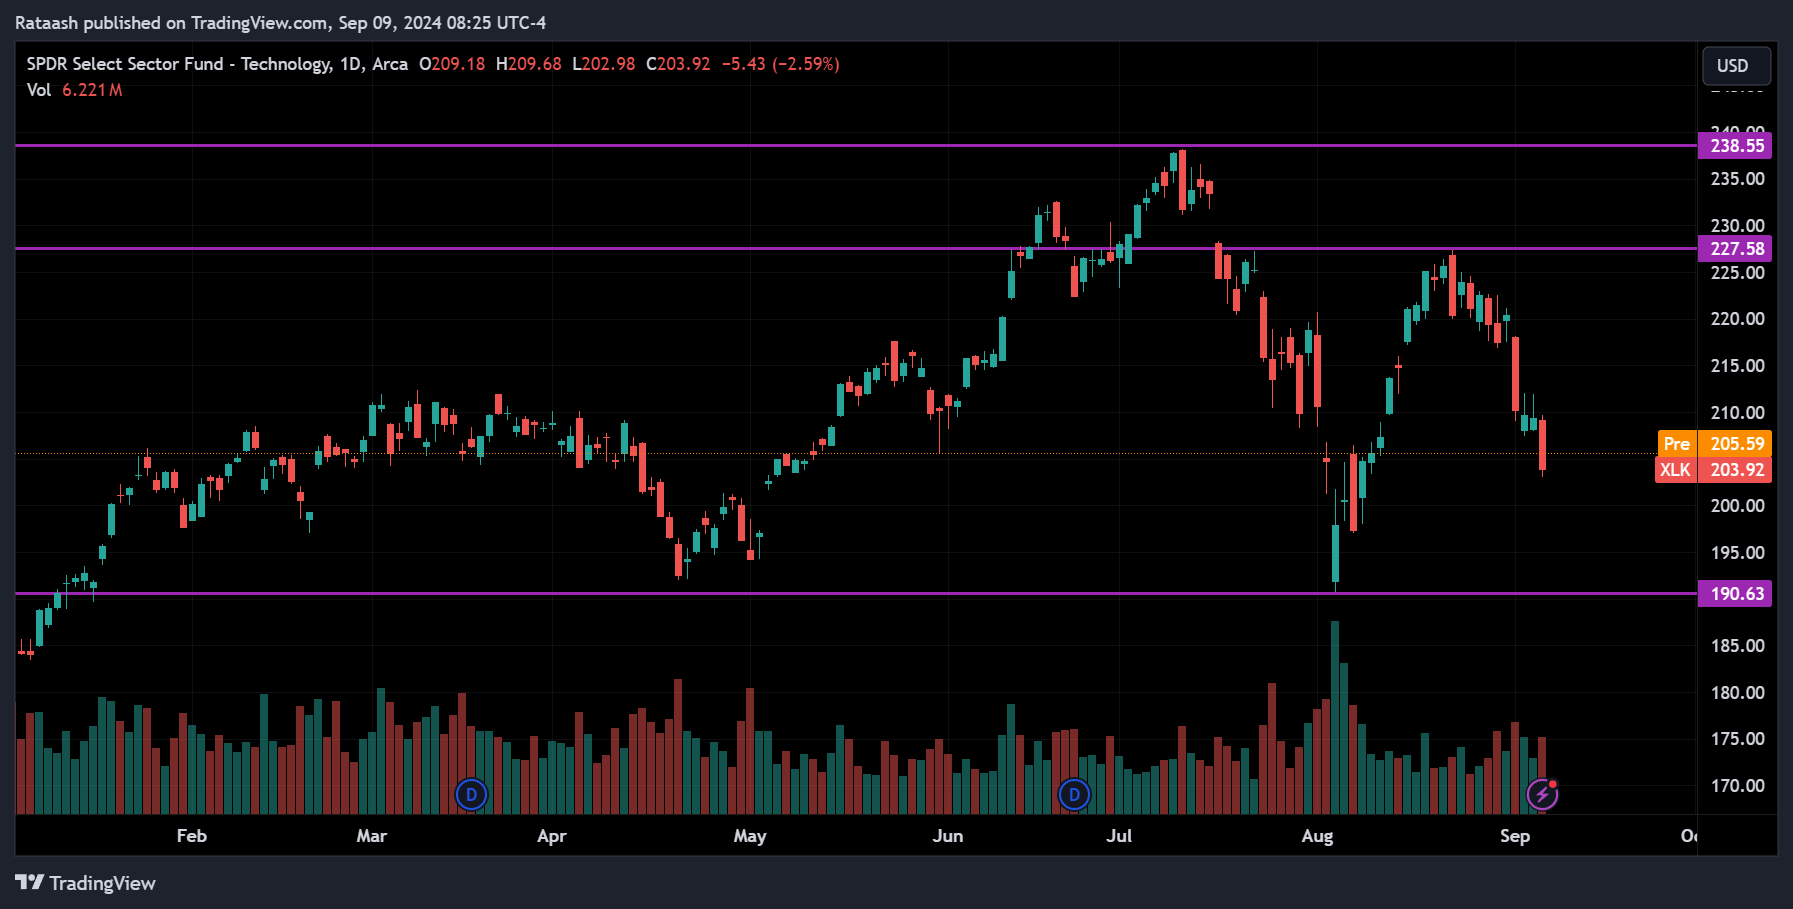
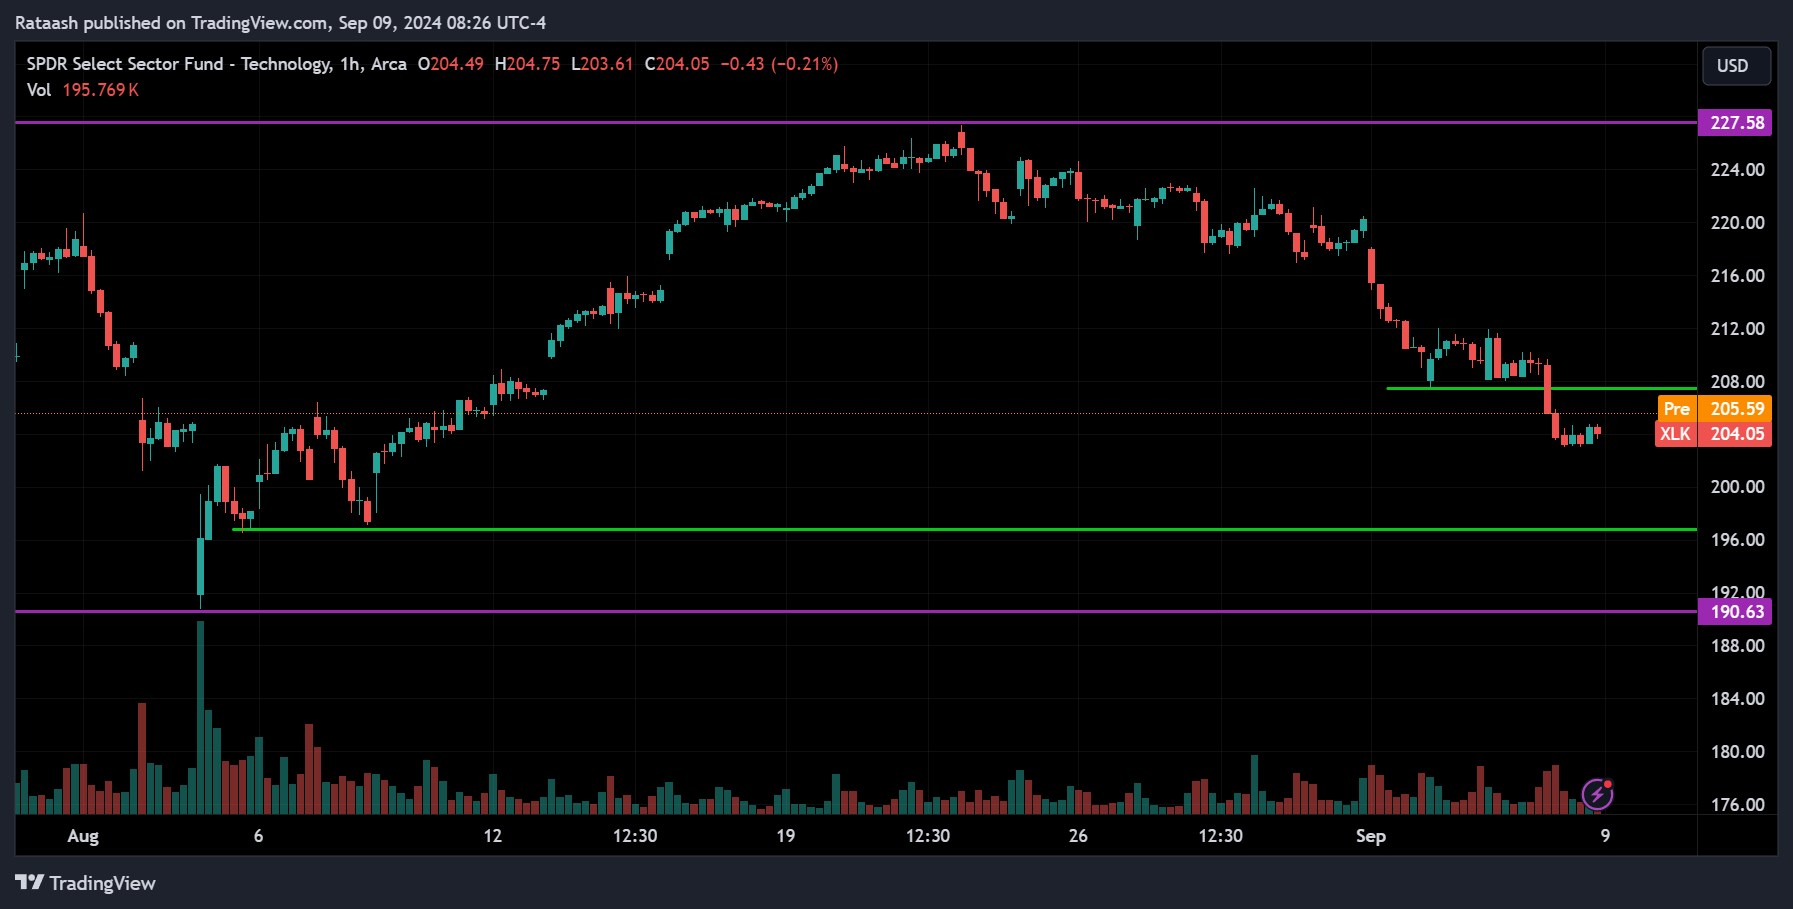
The XLK ETF, or technology sector, is overall consolidating. Looking at the 1-hour chart, the price is pulling back from the 227.50 resistance and is now nearing the 196 support. We can expect the price to break below 196 and head toward the 190 level, likely either pulling back or breaking out. There’s also a small resistance around 208, and if the price breaks above this level, it could start moving back up toward the 227.50 level.
Communications Sector(XLC):
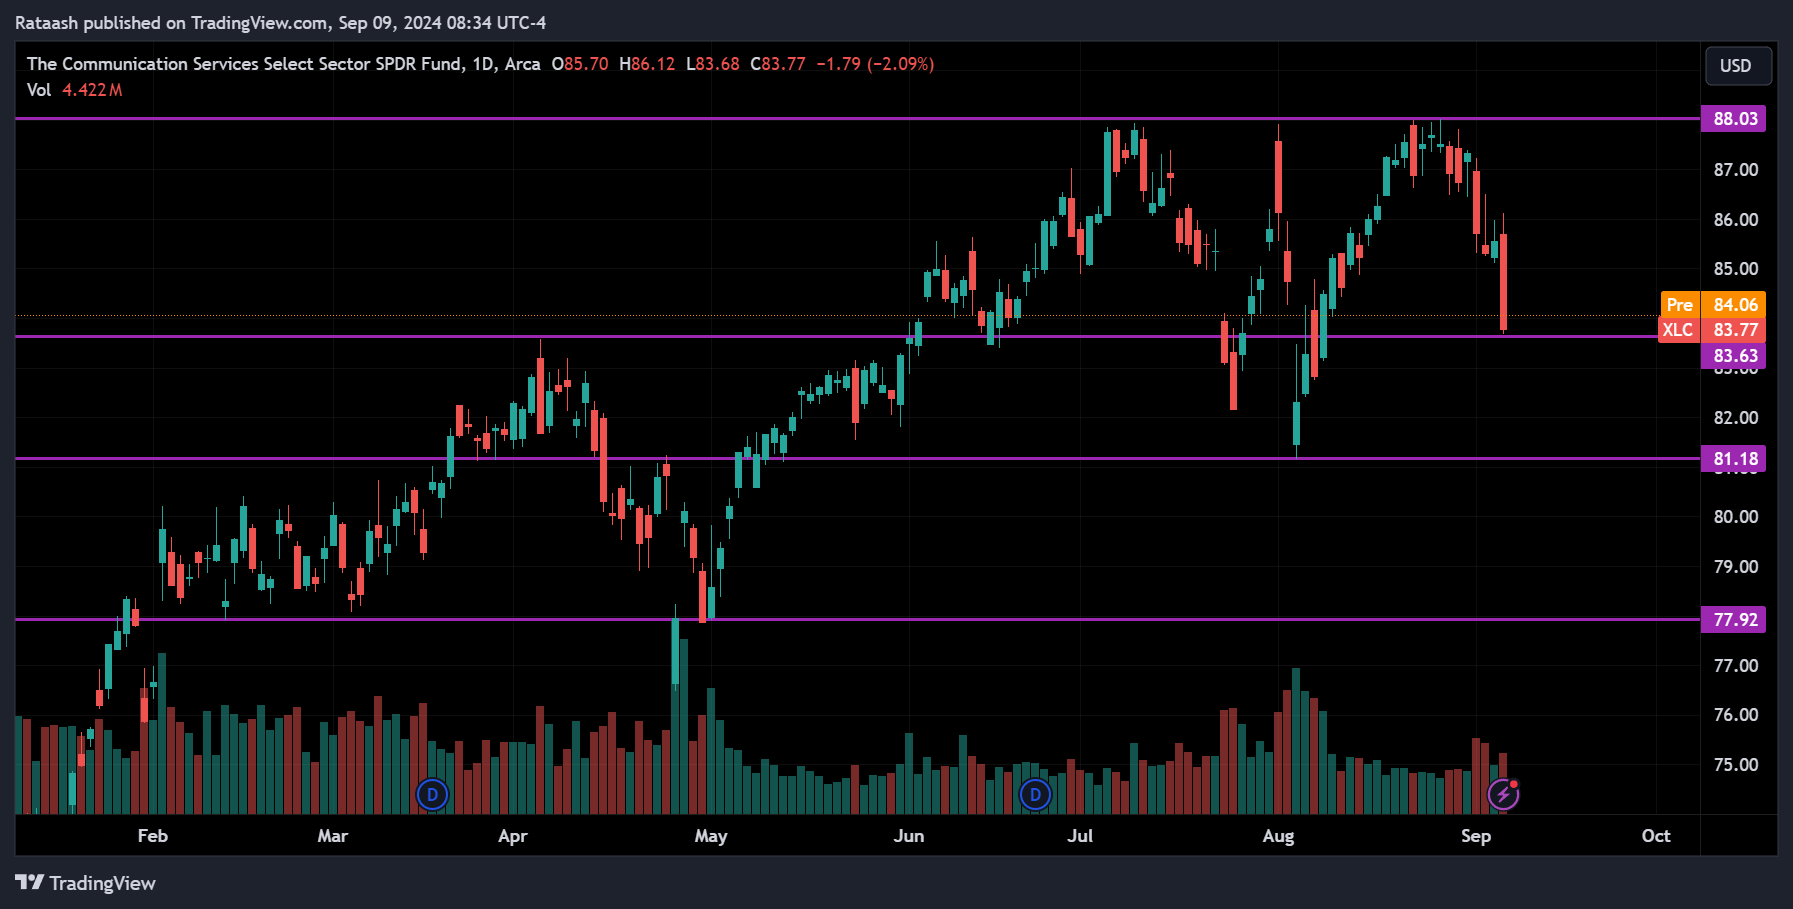
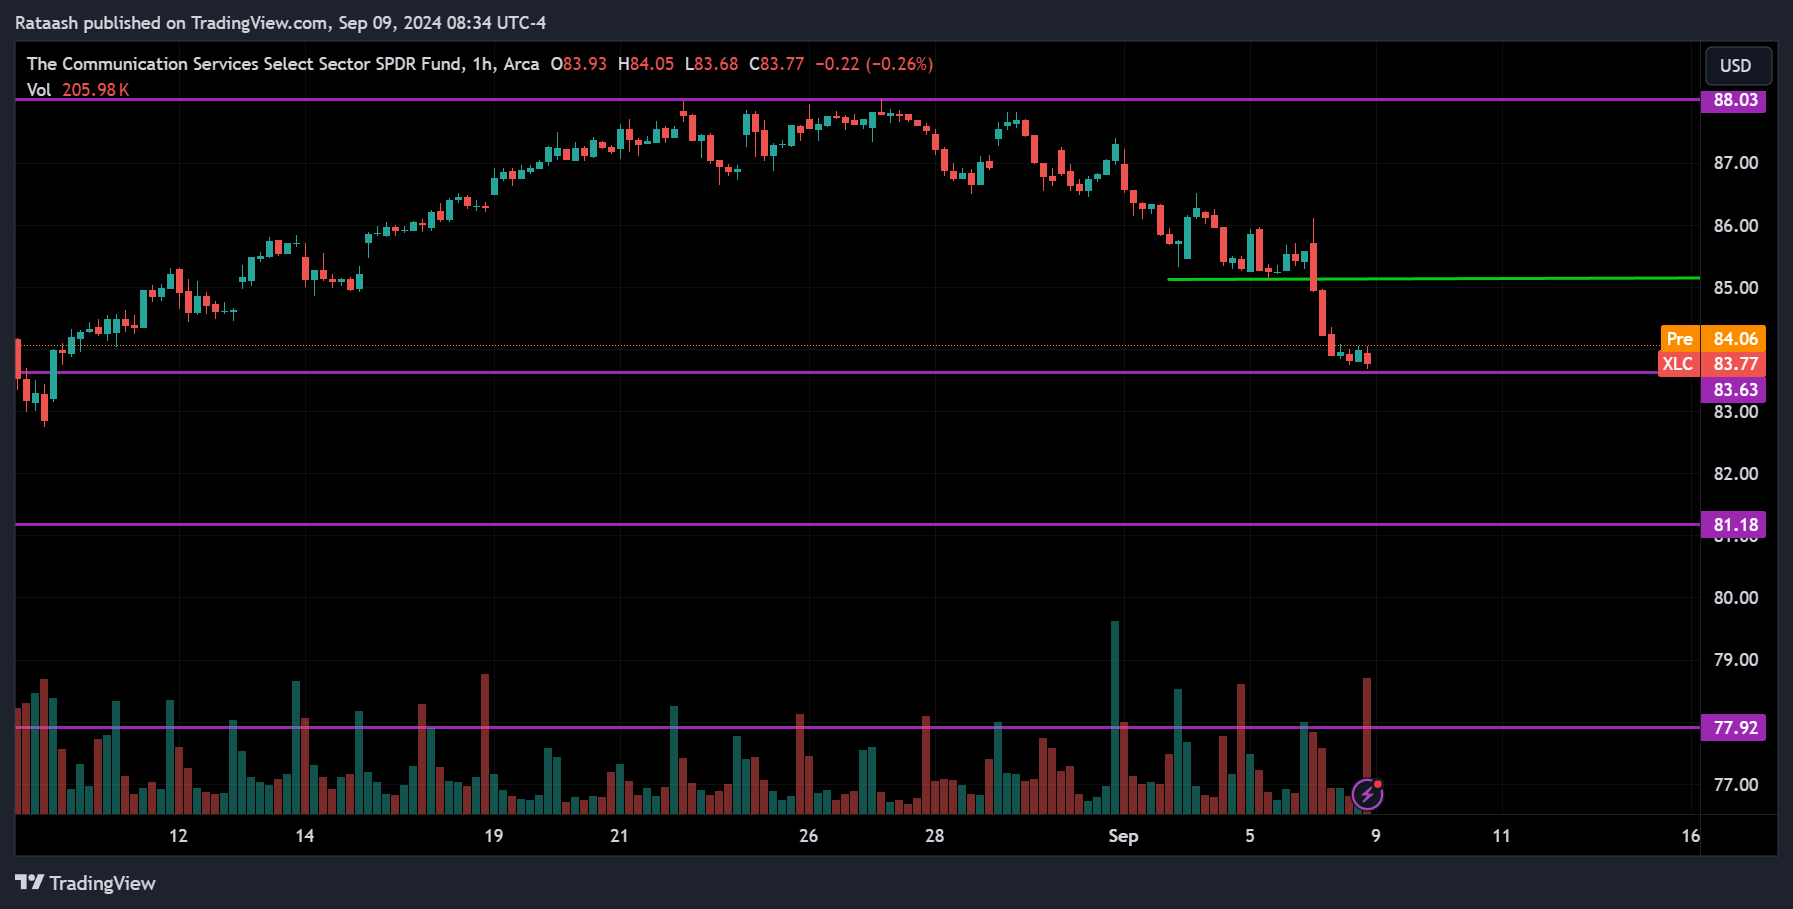
The XLC ETF, or Communication sector, is overall uptrending. The price is pulling back from the 88 resistance level and is now at the 83.60 support level. If the pullback continues, we can expect the price to break below this support and head toward the 81.10 support range. On the other hand, if the price starts going up and breaks above the 85 resistance, we can expect it to move toward 88.
Utility Sector(XLU):
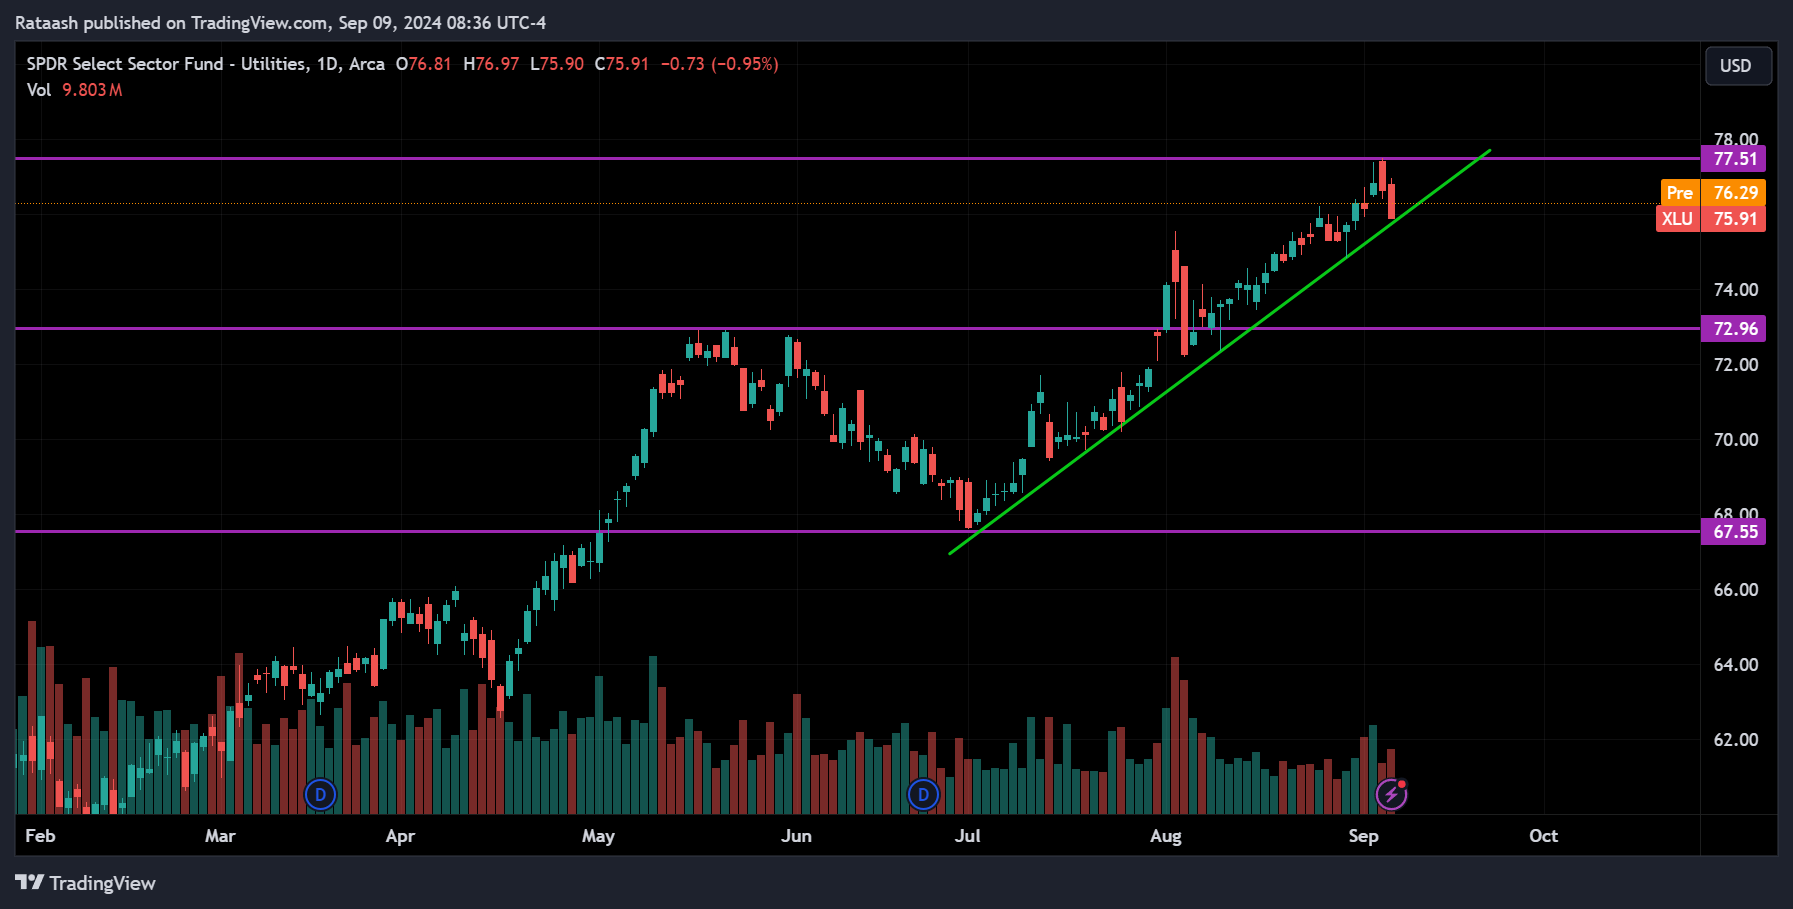
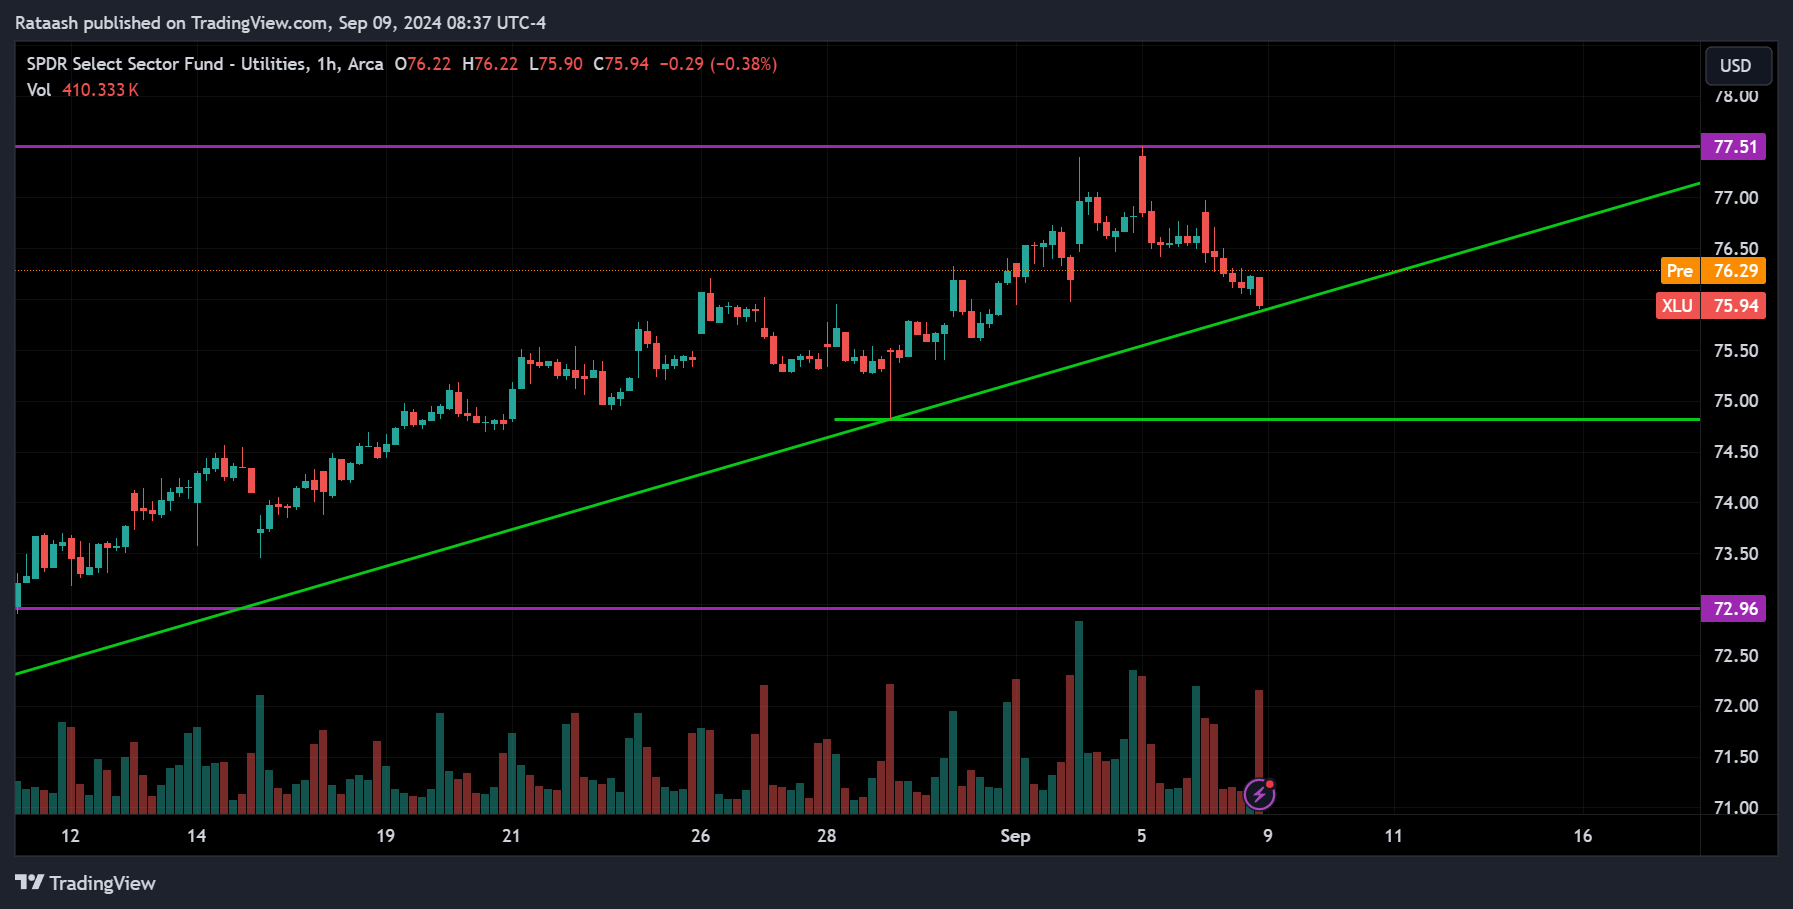
The XLU ETF, or Utilities sector, is overall trending up. The price is currently pulling back from the 77.50 resistance level. If the price breaks below the trend line, we can expect it to find support around 75, and if that level is also broken, the price may drop toward 73. On the other hand, if the price starts moving up and breaks above 77.50, we can expect the uptrend to continue.
Real Estate Sector(XLRE):
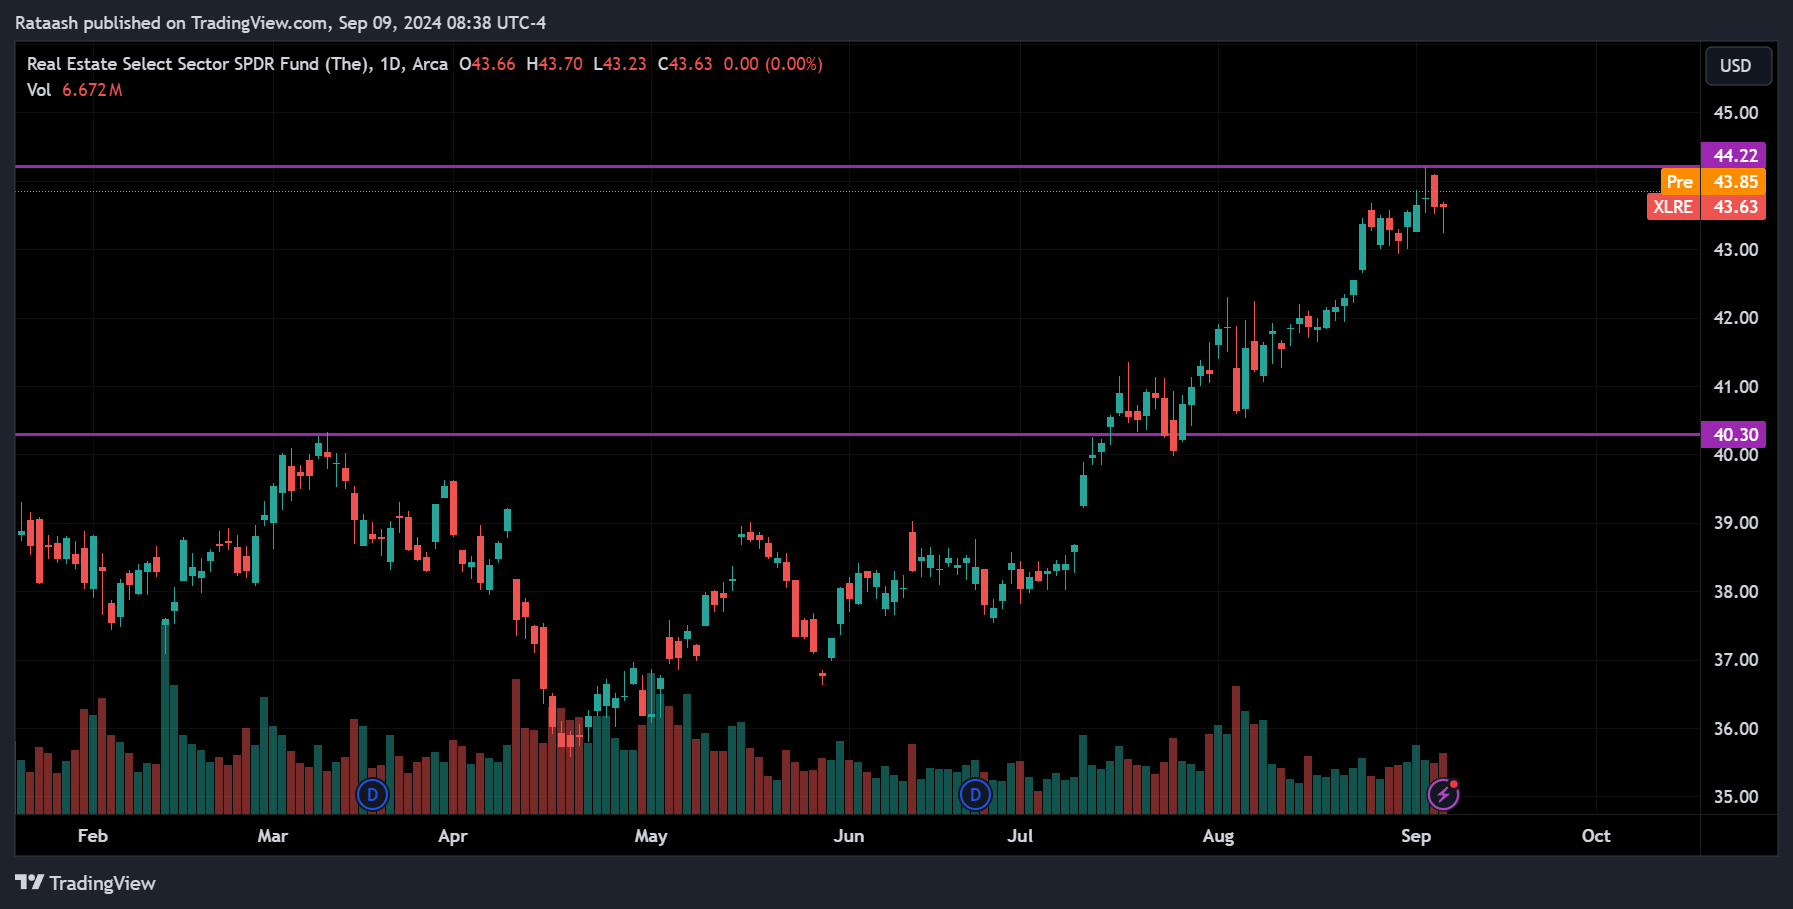
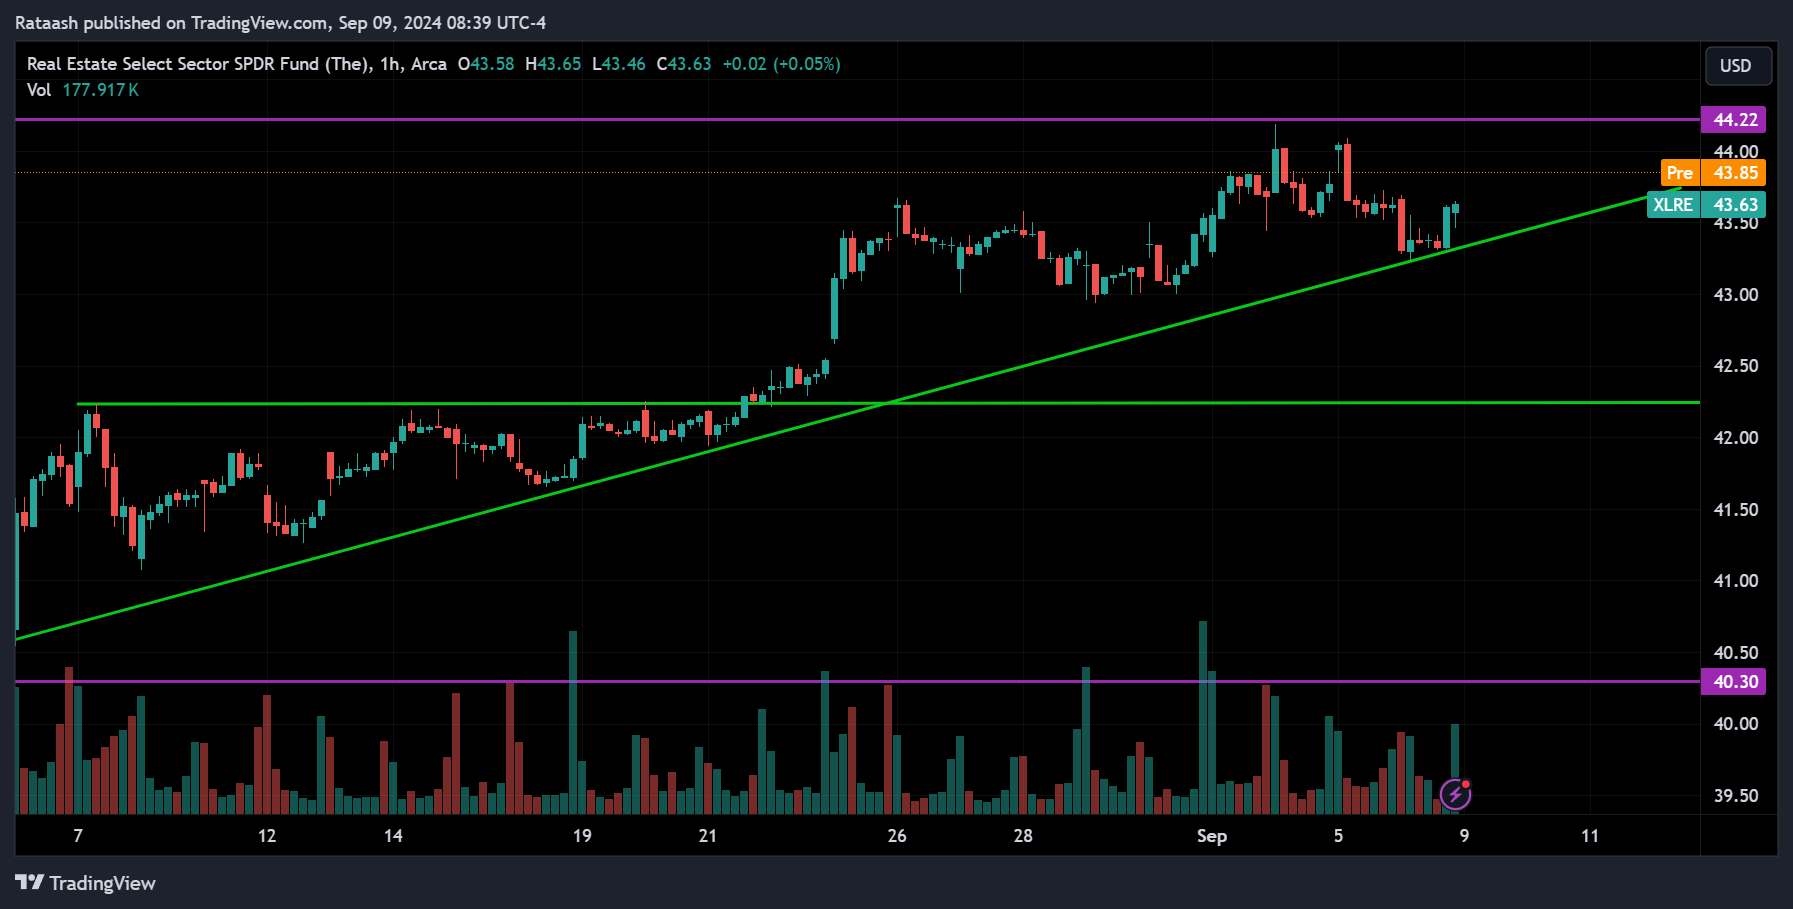
The XLRE ETF, or Real Estate sector, is overall trending up. The price has currently pulled back to the trend line from the 44.20 resistance range. If the price starts to rise and breaks above this resistance, we can expect it to continue upward. On the other hand, if the price breaks below the trend line, we can expect it to drop to the 42.25 support range.
Stocks to Watch Today
NVIDIA Corporation(NVDA):
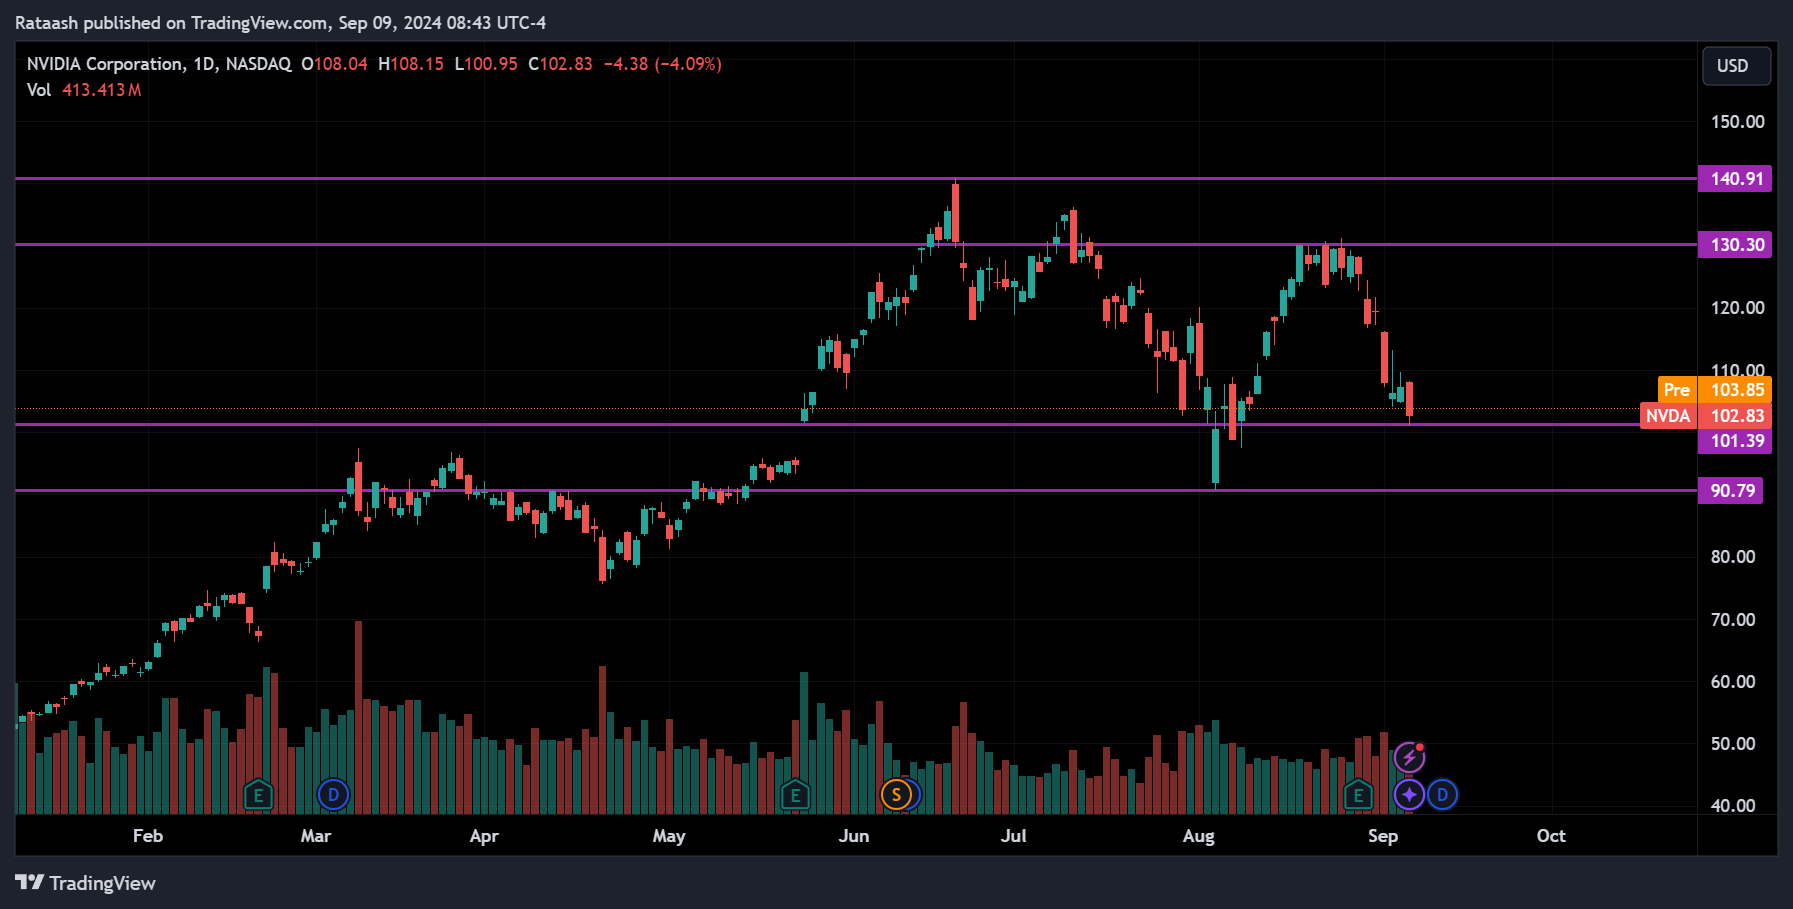
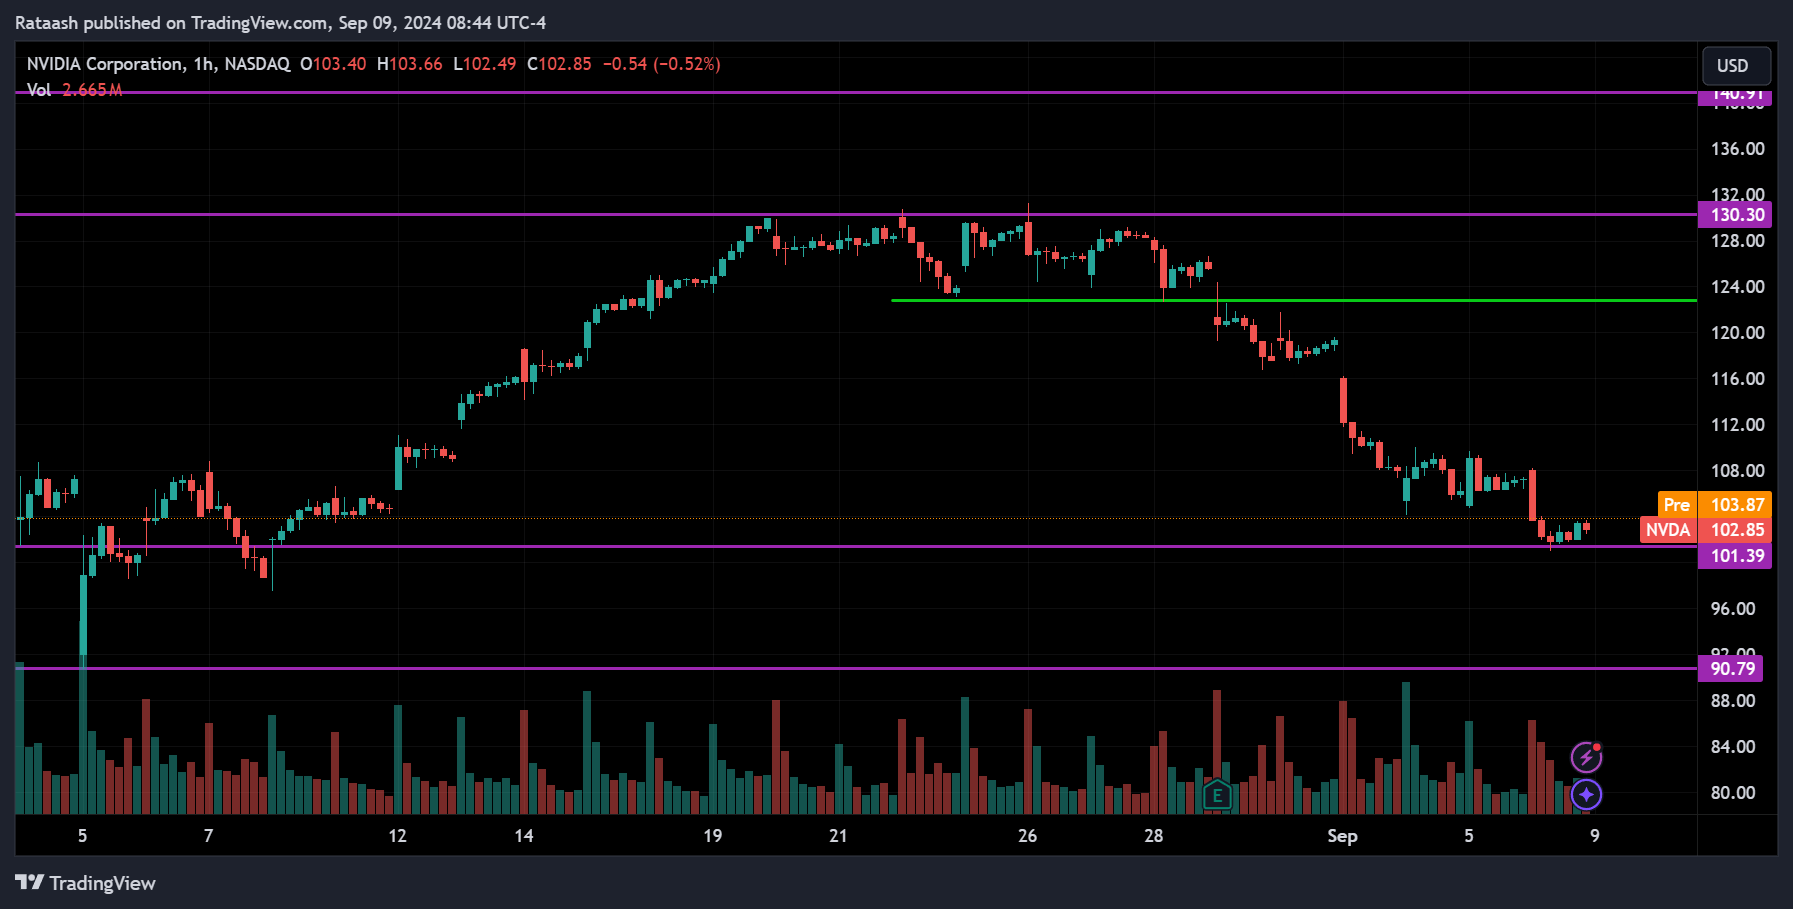
NVDA is pulling back from its all-time high levels and is currently at the 101.40 support level. If the price breaks below this level, the next support is around the 90.80 range. However, if the price starts moving back up, we can expect it to reach the 124 range.
Apple Inc.(AAPL):
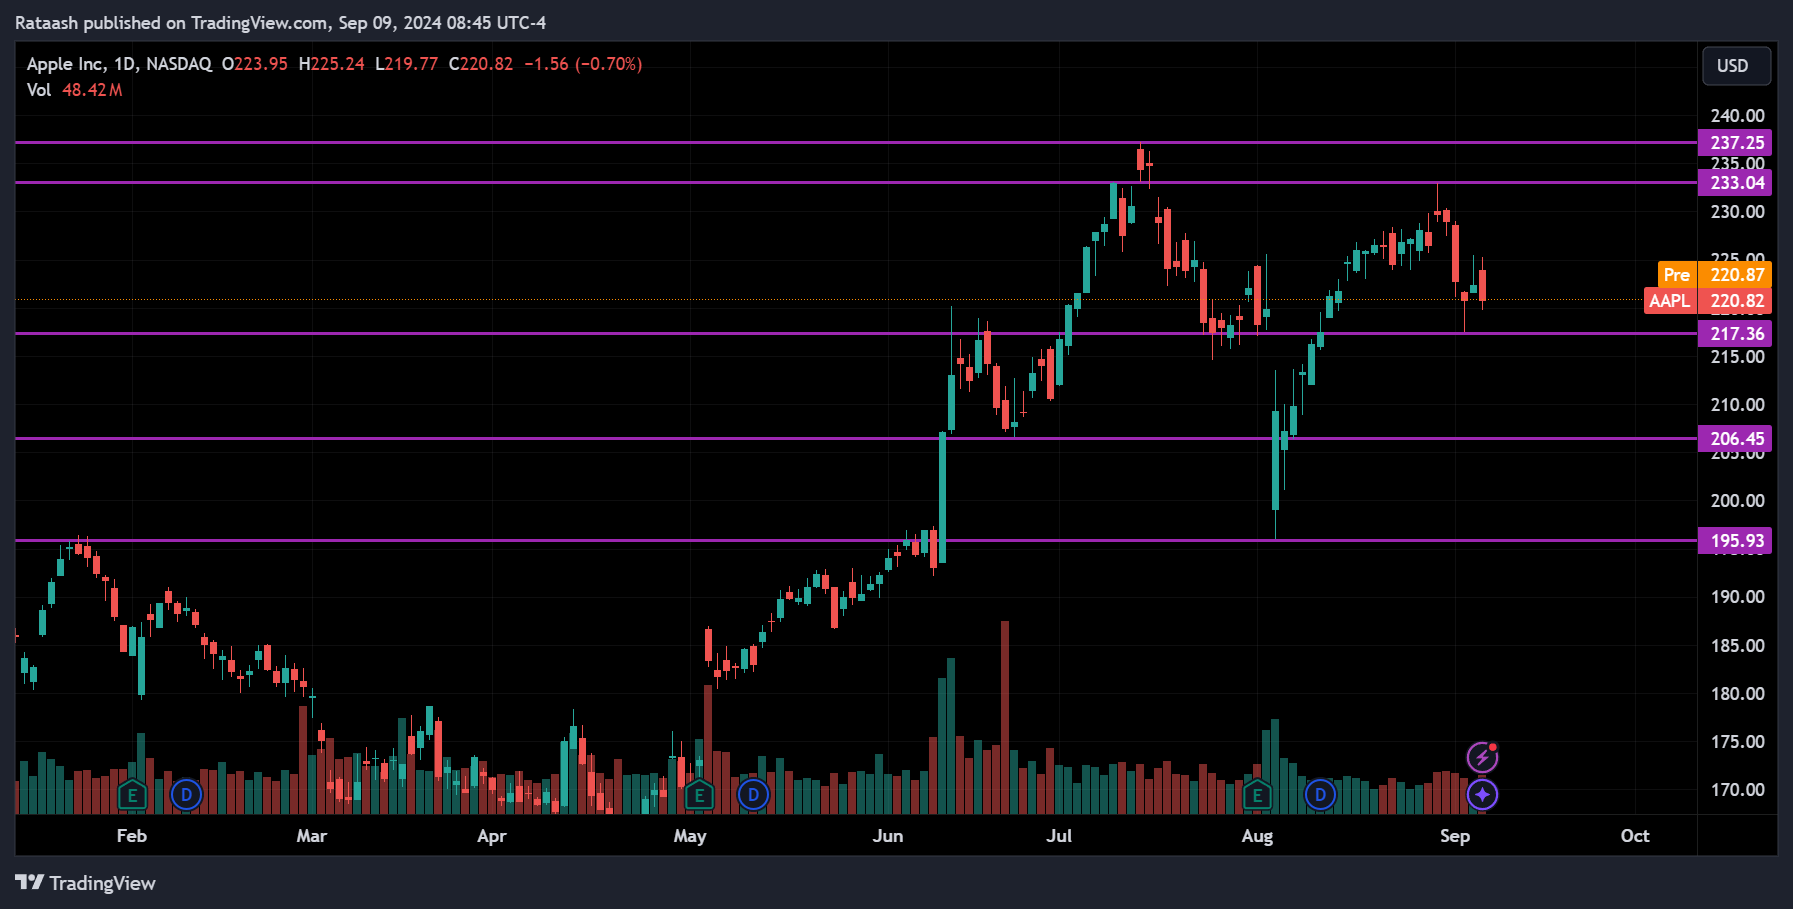
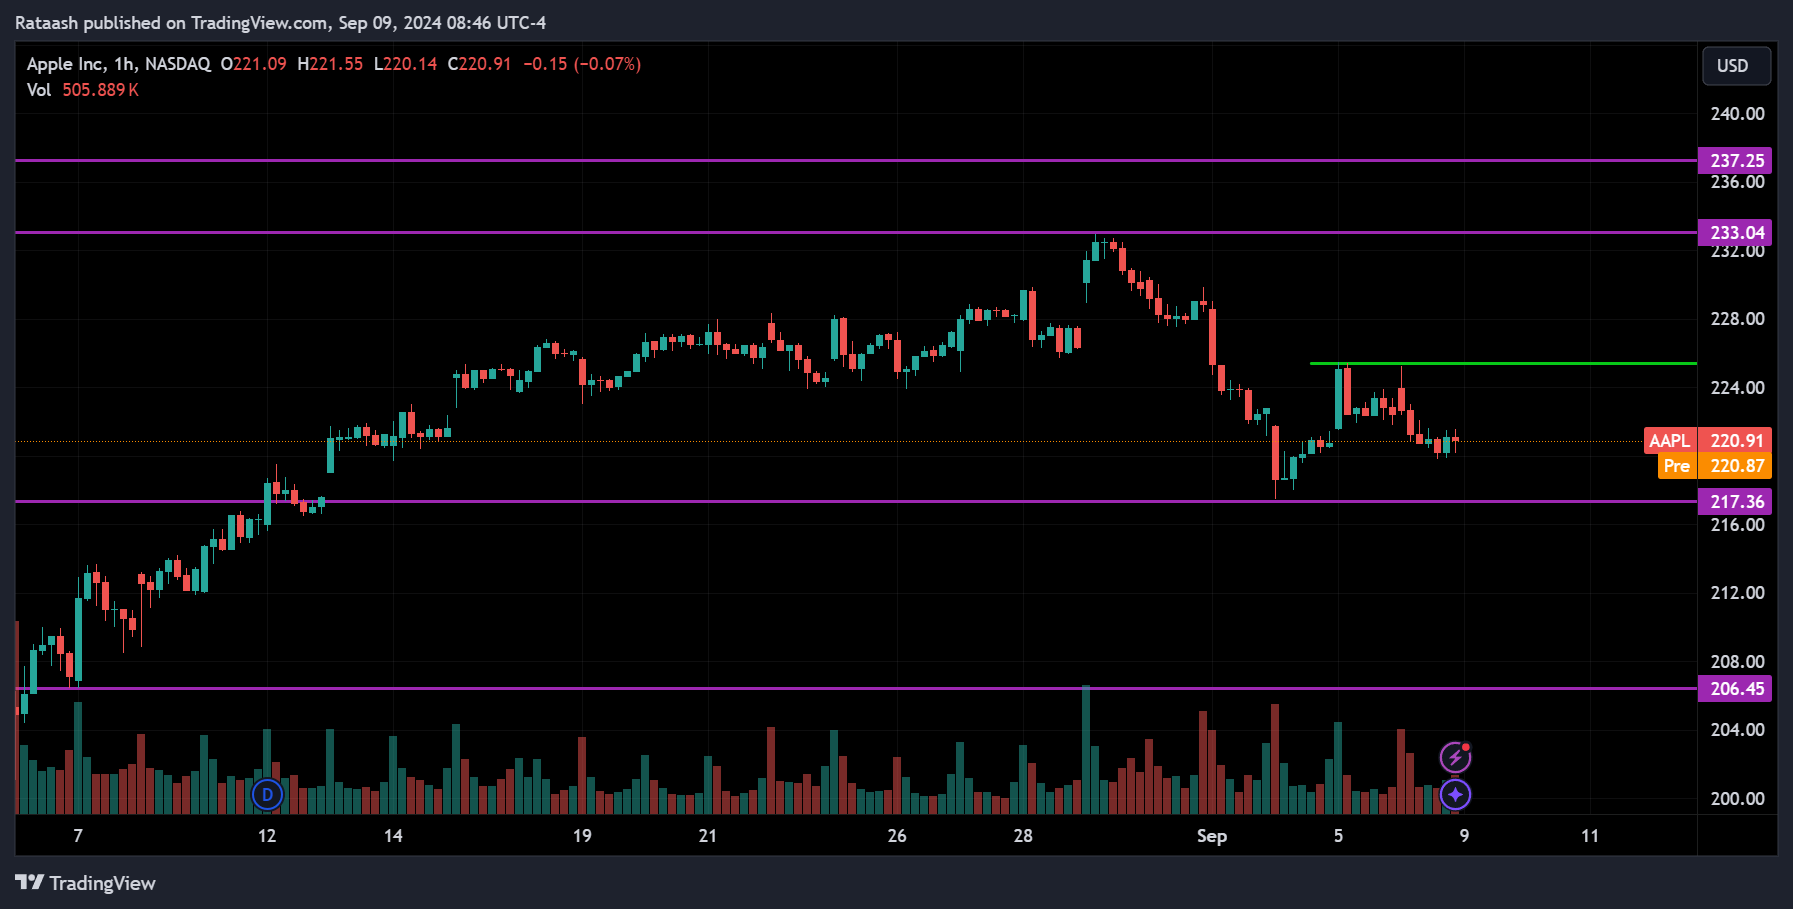
Apple is releasing their iPhone 16 today, making it a key stock to watch. Right now, the price is at the support range of 217.40. If the price breaks below this level, we can expect it to drop to the 206.45 range. On the other hand, if the price starts to rise and breaks above the small resistance around 225, we can expect it to continue toward 233.
Oracle Corporation(ORCL):
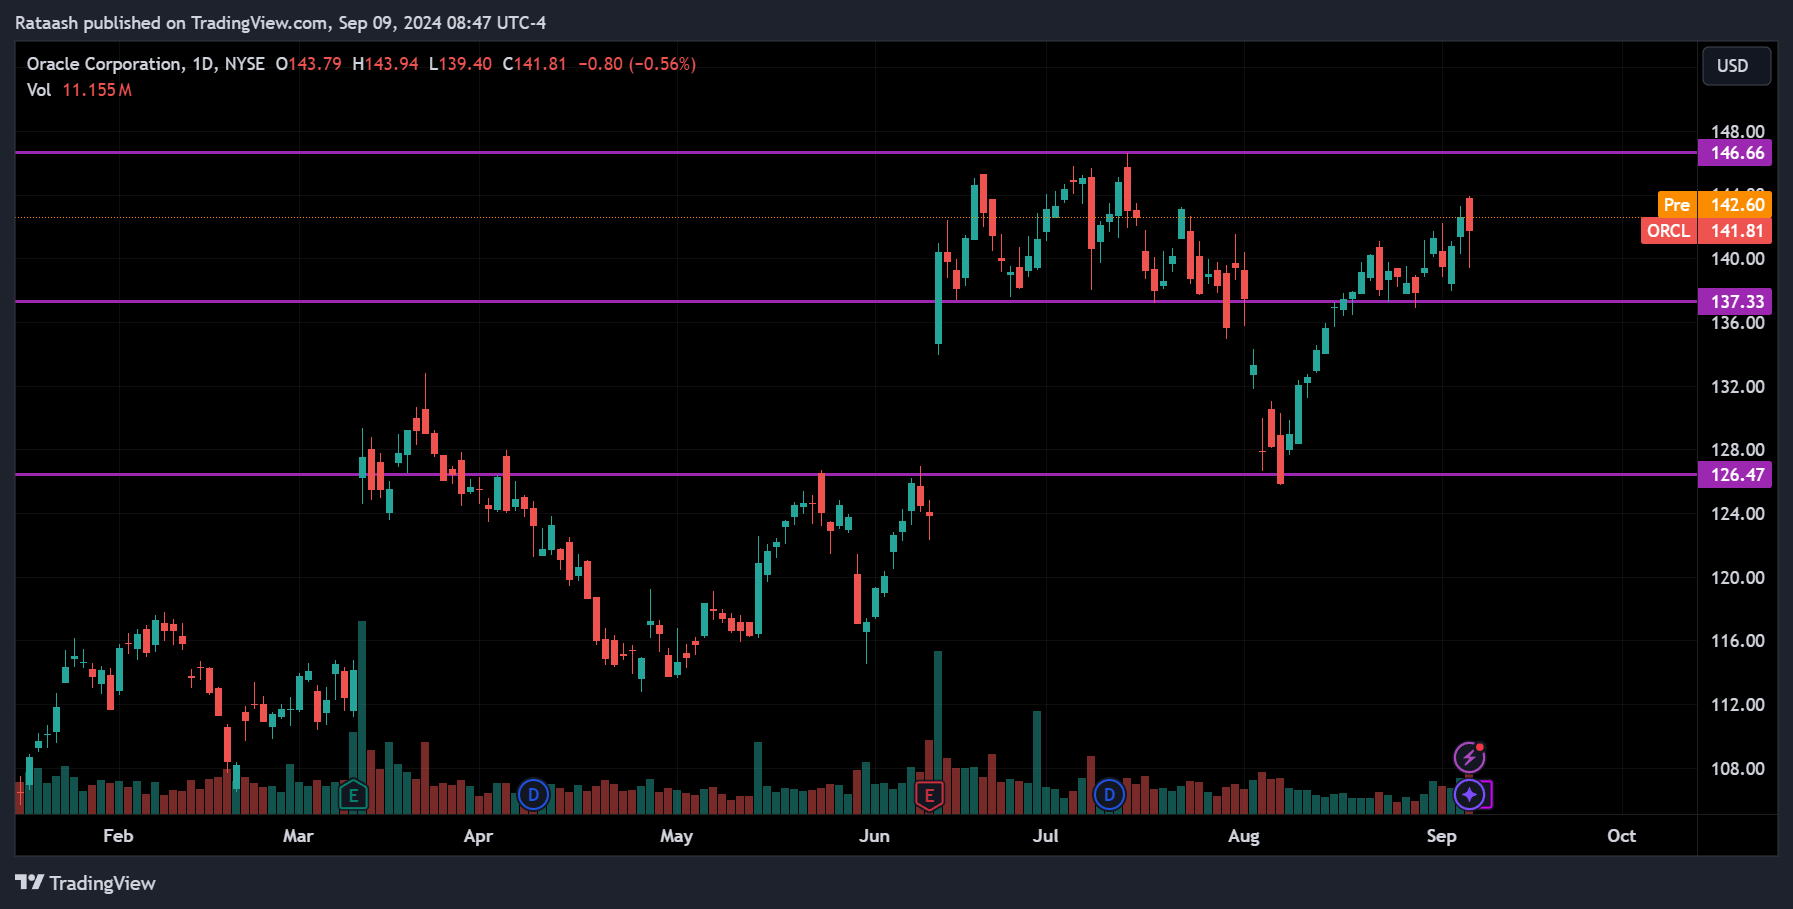
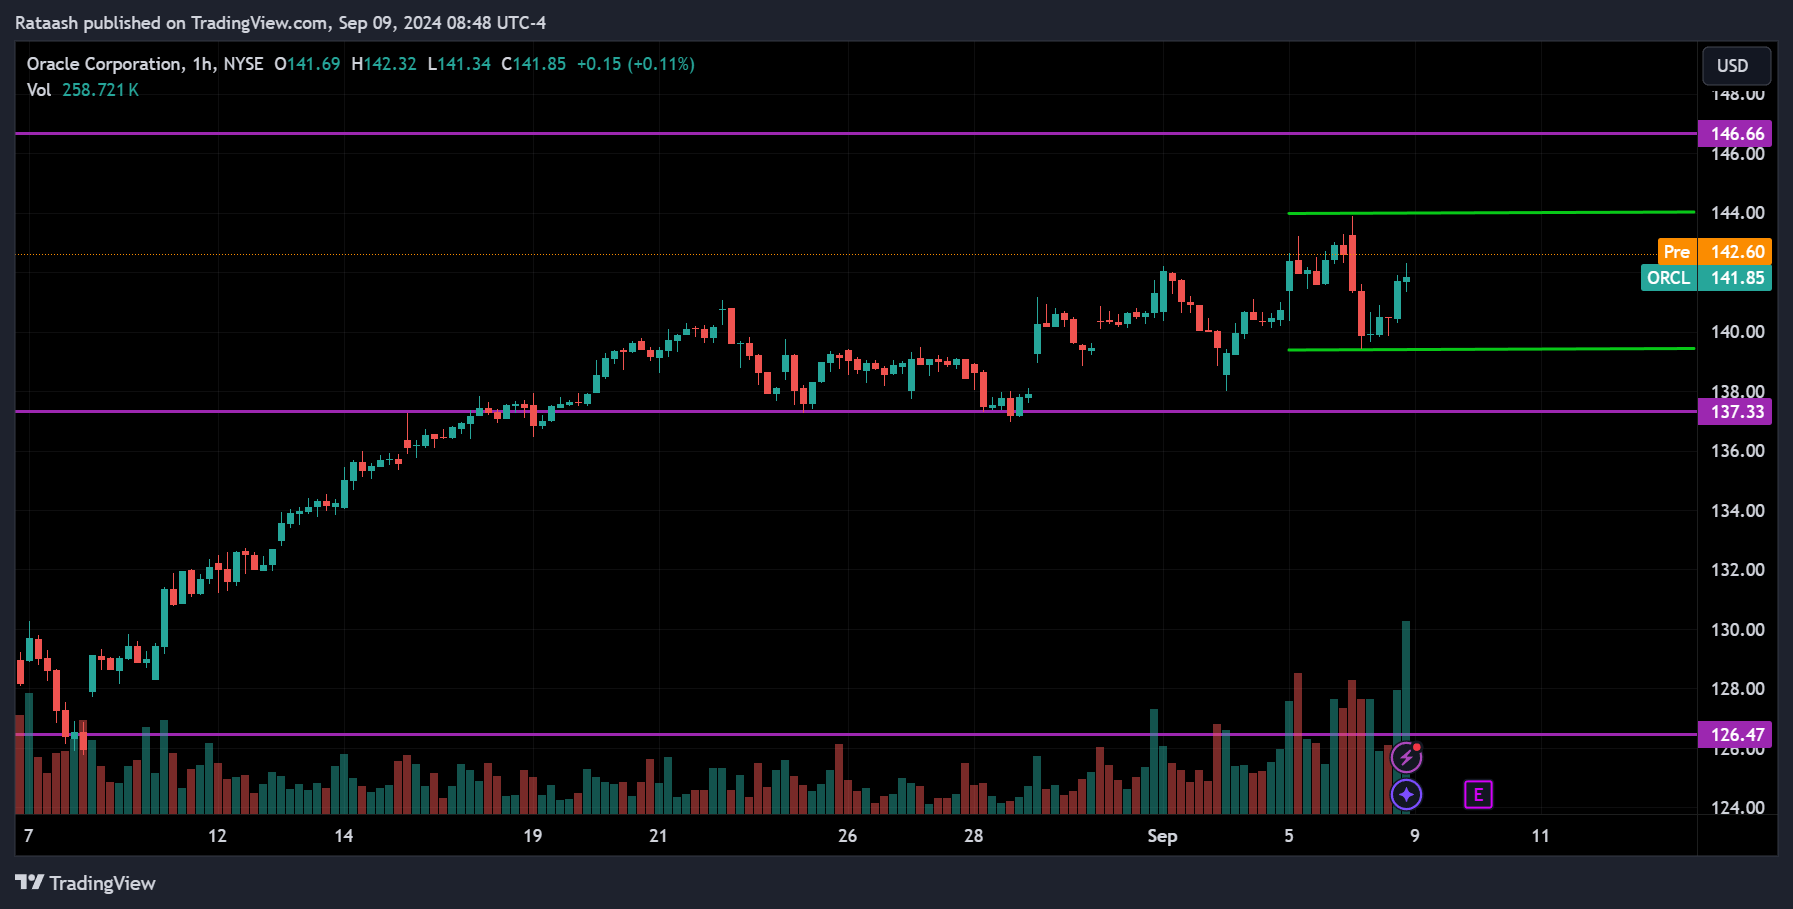
Oracle is reporting earnings today, making it a key stock to watch. If they beat estimates, the stock might start rising, but if they miss, the stock could drop. Currently, the price is pulling back from the small support at 140. If the price moves up to 144 and breaks above that level, we can expect it to reach the 146.60 range. If that level is also broken, the price could continue going up. On the other hand, if the price breaks below the 140 support, we can expect it to drop to the 137.30 range, and if that level is broken, it could fall toward 126.50.
Conclusion & Disclaimer
Subscribe to our Telegram channel to get instant updates on new articles.
Please provide your feedback on how we can improve this article. Thank you!
We discussed these sectors and markets because when the entire market or sector goes through certain movements, most of the stocks within that market will also experience similar movements. So, by understanding what the market is doing, you can conduct your own analysis on specific stocks.
These analyses are here to help you understand how to analyze the market. They’re not about giving buy or sell signals. It’s simply about observing price action market behavior. I don’t recommend when to buy or sell because trading doesn’t work that way. You need a strategy to guide your decisions about when to enter or exit positions. That’s the key to making consistent profits in the financial markets over time.
The information provided in this market analysis is for educational and informational purposes only. It should not be construed as financial advice or a recommendation to buy, sell, or hold any securities or investments.
All investments involve risk, and past performance is not indicative of future results. The analysis provided may not be suitable for all investors and should be used at their own discretion.
Readers are encouraged to conduct their own research.
Trading and investing in financial markets carry inherent risks, including the risk of losing invested capital. It is important to carefully consider your investment objectives, risk tolerance, and financial situation before making any investment decisions.
GOOD LUCK✌!!!