
Hello, and welcome to xlearn’s US stock market forecast article series. If this is your first time here, I recommend reading our guide on how to use our market analysis article before diving into this one.
We will use a top-down approach in our analysis. First, we will analyze the overall market, focusing on the S&P 500. Then, we will analyze each sector one by one for their price action performance so we can trade stocks in those sectors with confidence. Finally, we will look at some stocks to watch for this week.
The U.S. stock market is slightly dipping today as investors prepare for a critical week of employment data. Key reports include job openings, the ADP employment report, and the September jobs report, which could influence the Federal Reserve’s decisions on future interest rate cuts.
Now, Before we get into the analysis, let’s quickly review the major economic events that could impact the market.
Major Economic Events This Week
These events include important news that could impact the stock market, macroeconomic reports, and economic indicators. For more details, you can check the bloomberg calendar & yahoo finance.
2024.09.30
- 13:55 ET: Fed Chair Powell is scheduled to speak at the National Association for Business Economics Annual Meeting in Nashville, participating in a moderated discussion titled “A View from the Federal Reserve Board.” Audience questions are expected. If Powell is more hawkish than expected, it’s positive for the currency. As the head of the central bank, he has significant control over short-term interest rates, making his comments highly influential on the currency’s value. Traders closely follow his public appearances for hints about future monetary policy decisions.
2024.10.01
- There are no major events on this day that could affect the stock market.
2024.10.02
- 8:30 ET: Unemployment Rate report will be released, showing the percentage of the total workforce that is unemployed and actively seeking work during the previous month. The previous and forecast values are both 4.2%. If the ‘Actual’ rate is lower than the ‘Forecast,’ it’s positive for the currency. While it is generally seen as a lagging indicator, the number of unemployed individuals is a key signal of overall economic health since consumer spending is closely tied to labor market conditions. Unemployment is also a crucial factor in shaping the country’s monetary policy.
2024.10.03
- There are no major events on this day that could affect the stock market.
2024.10.04
- 8:30 ET: Unemployment Rate will be released, showing the percentage of the workforce that is unemployed and actively looking for work during the previous month. The previous and forecast values are both 4.2%. If the ‘Actual’ rate is lower than the ‘Forecast,’ it’s positive for the currency. Although it’s considered a lagging indicator, unemployment numbers are a key sign of economic health since consumer spending is closely tied to job conditions. Unemployment also plays a big role in shaping the country’s monetary policy decisions.
Stocks with Earnings This Week:
- NKE – NIKE, Inc.
- PAYX – Paychex, Inc.
- STZ – Constellation Brands, Inc.
- CCL – Carnival Corporation & plc
- MKC – McCormick & Company, Incorporated
- RPM – RPM International Inc.
- CAG – Conagra Brands, Inc.
- LW – Lamb Weston Holdings, Inc.
- LEVI – Levi Strauss & Co.
- AYI – Acuity Brands, Inc.
- CALM – Cal-Maine Foods, Inc.
- APOG – Apogee Enterprises, Inc.
- NG – NovaGold Resources Inc.
- UNFI – United Natural Foods, Inc.
- TRAK – ReposiTrak, Inc.
- RGP – Resources Connection, Inc.
- ANGO – AngioDynamics, Inc.
Only stocks with a Market Cap over 300M are listed here. To see all the stocks, visit finviz.com.
S&P 500
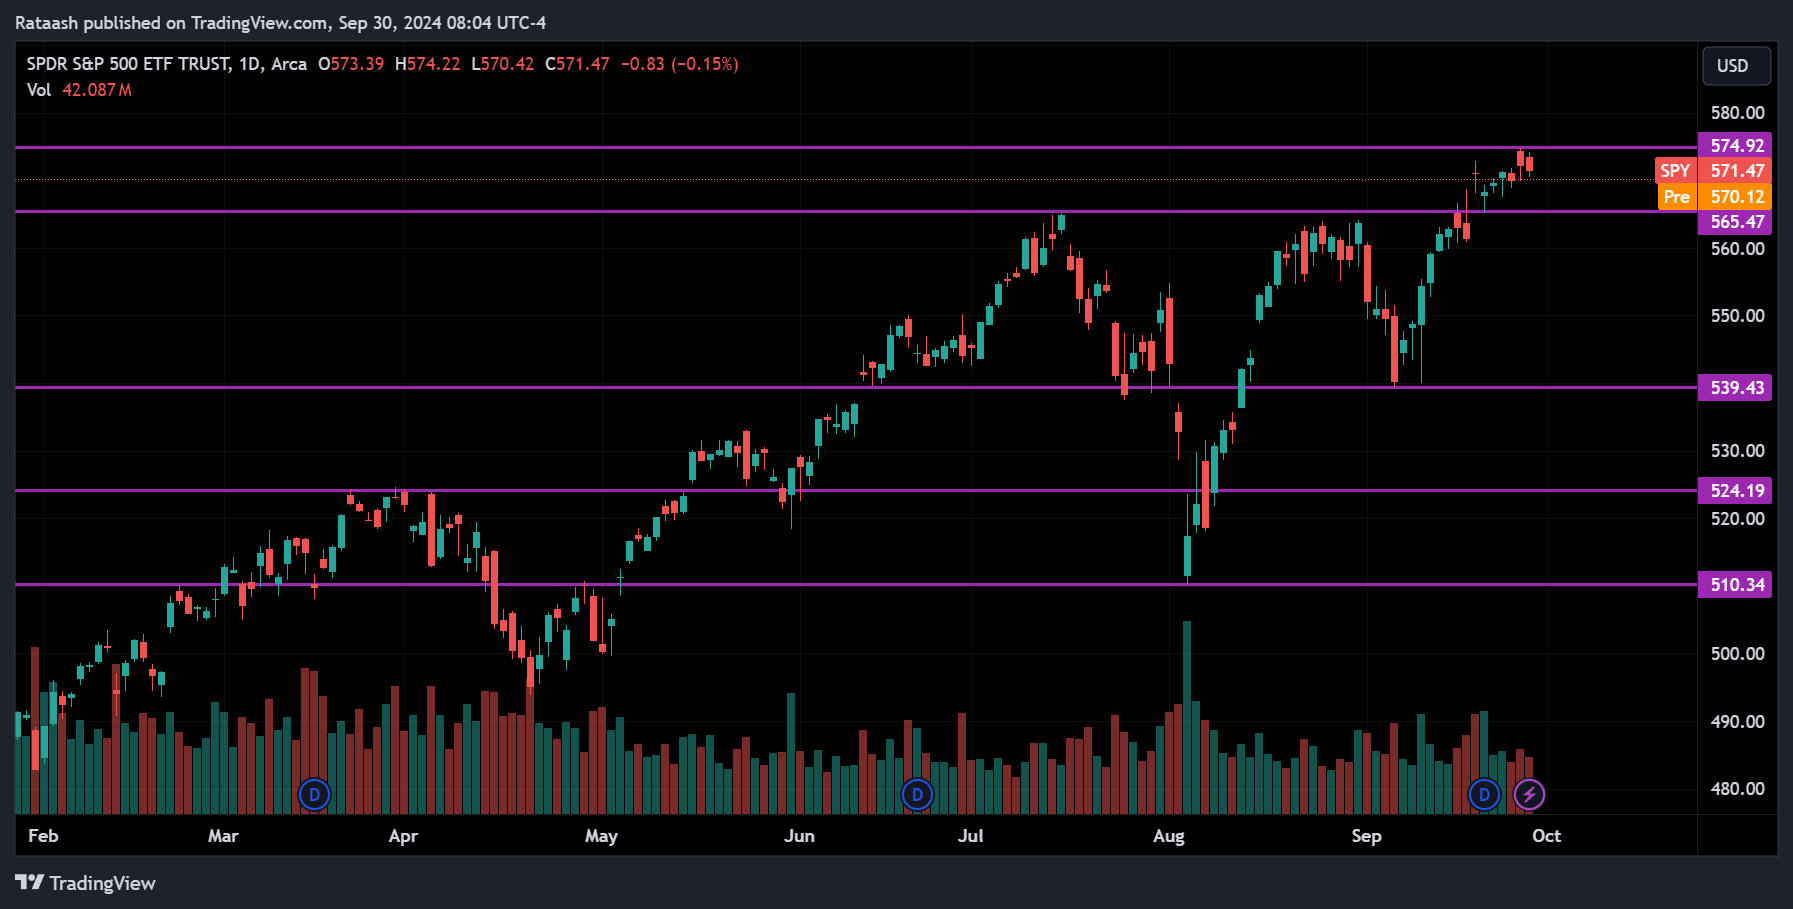
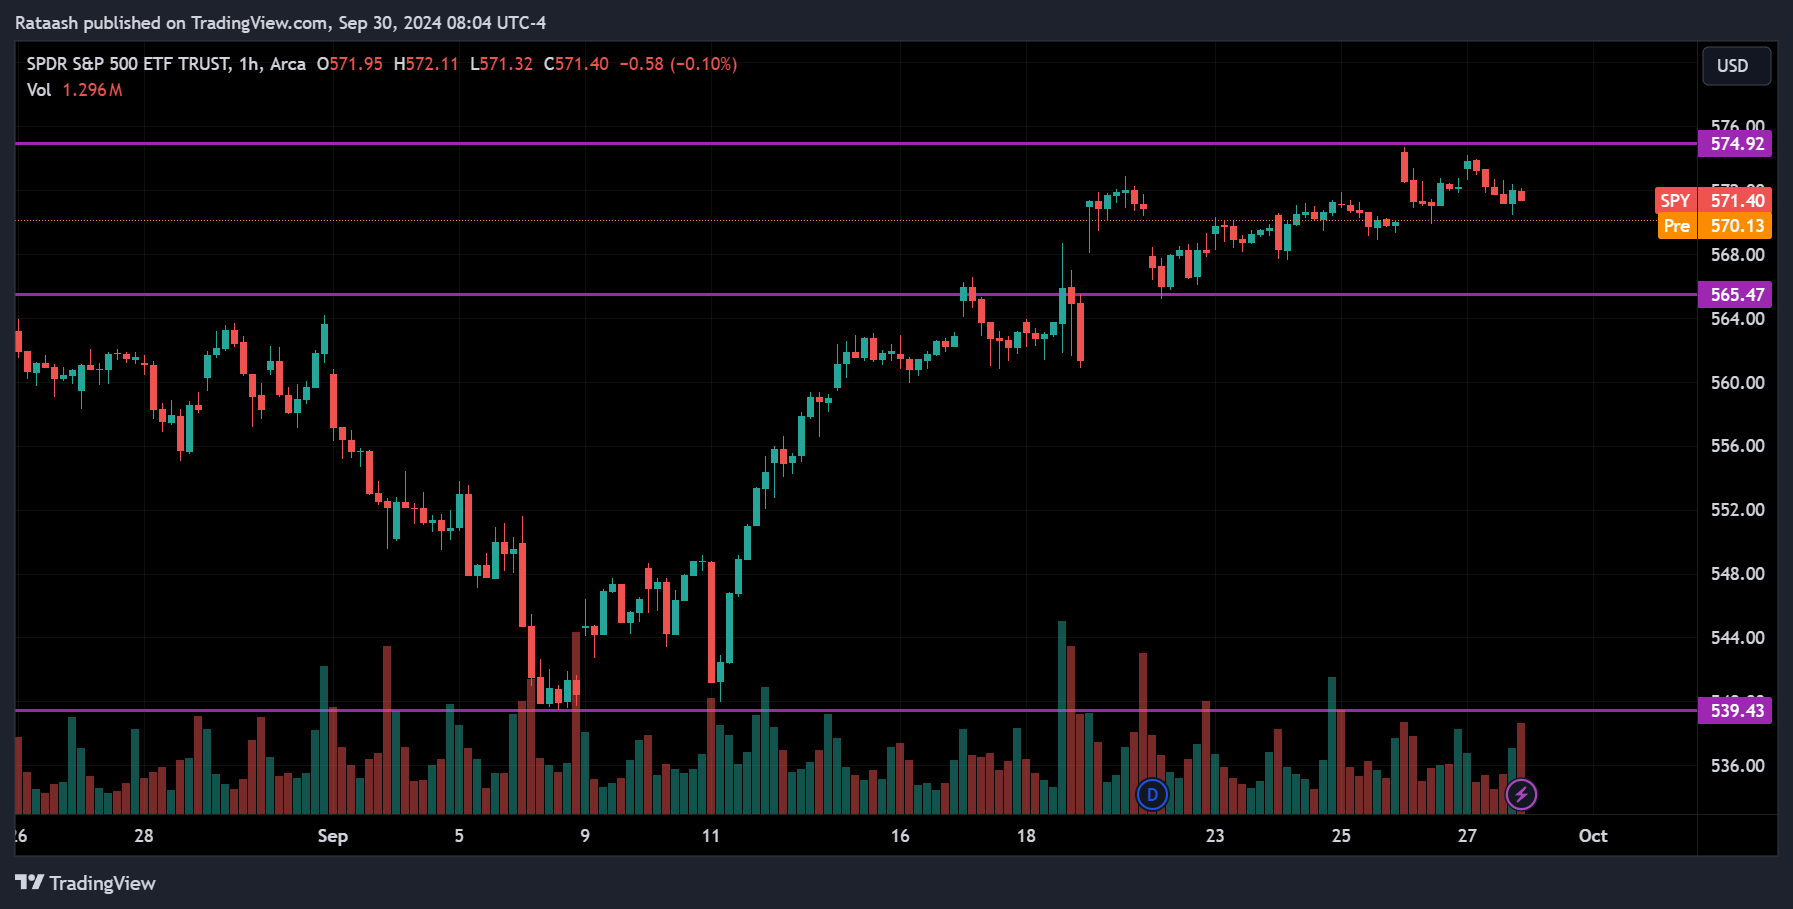
The S&P 500 is at all-time high levels, and with the FED cutting rates, increased spending is expected, leading to more buying and pushing asset prices higher. We can anticipate the market to reach new highs in the coming days. Currently, the price is just below the all-time high resistance level of 575. If the price breaks above this level, the uptrend is likely to continue, reaching new highs. However, if the price pulls back and breaks below the support at 565, a correction could follow, with the price potentially falling towards 539.50. Keep an eye on the breakout direction.
Now, let’s take a look at the sectors and analyze how each individual sector is performing.
Consumer Staples Sector(XLP):
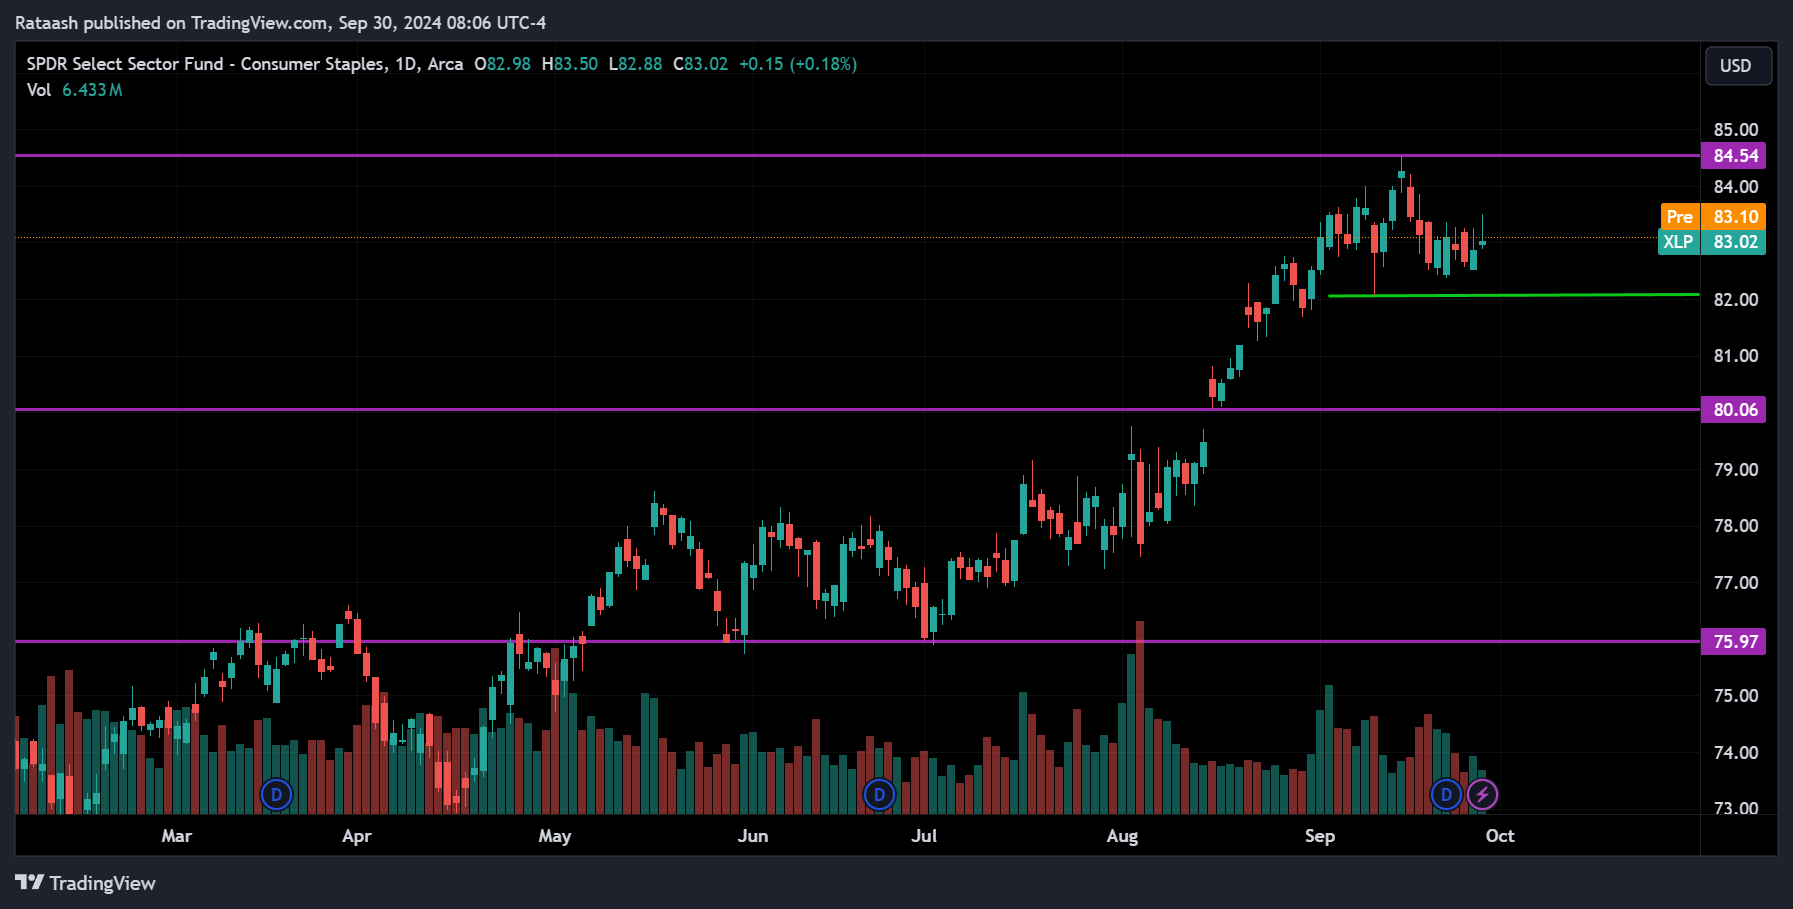
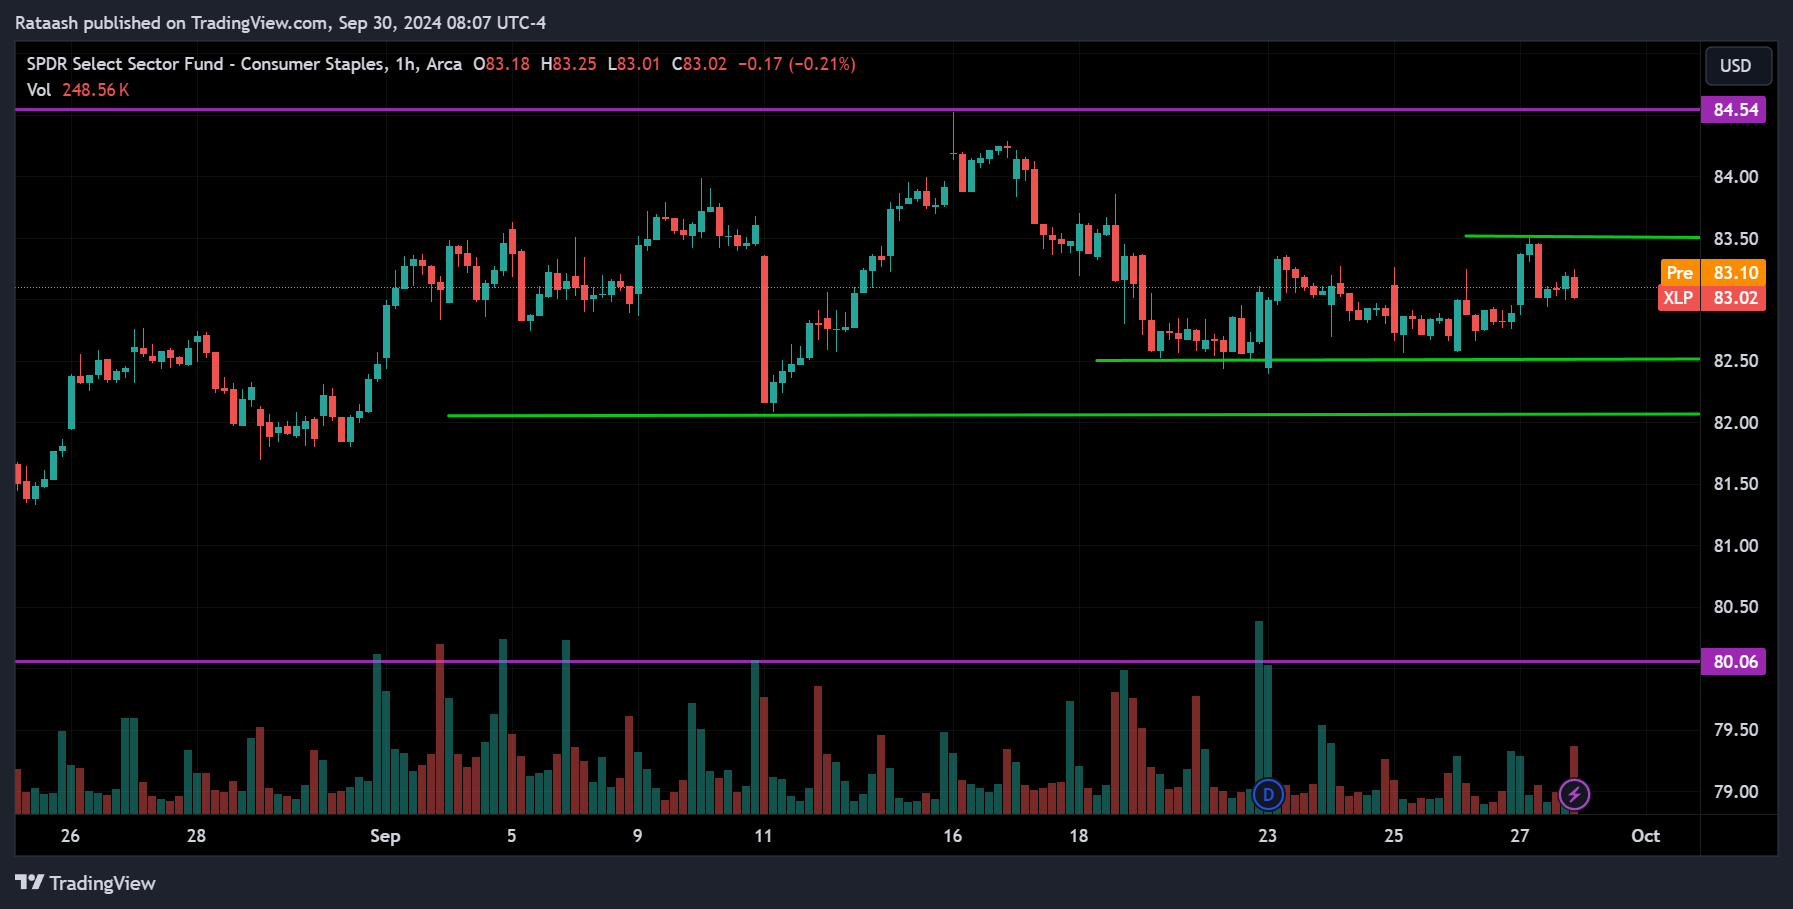
Looking at XLP, the price is consolidating just above the support level at 82.50, with resistance around 83.50. Since the price is in consolidation, the breakout will decide the next trend. If the price breaks above the resistance, which is likely given the overall bullish market phase, we can expect it to continue rising towards the major resistance at 84.50. On the other hand, if the price breaks below the 82.50 support, it could drop to 82, and if that level is also broken, the price may fall further towards 80.
Energy Sector(XLE):
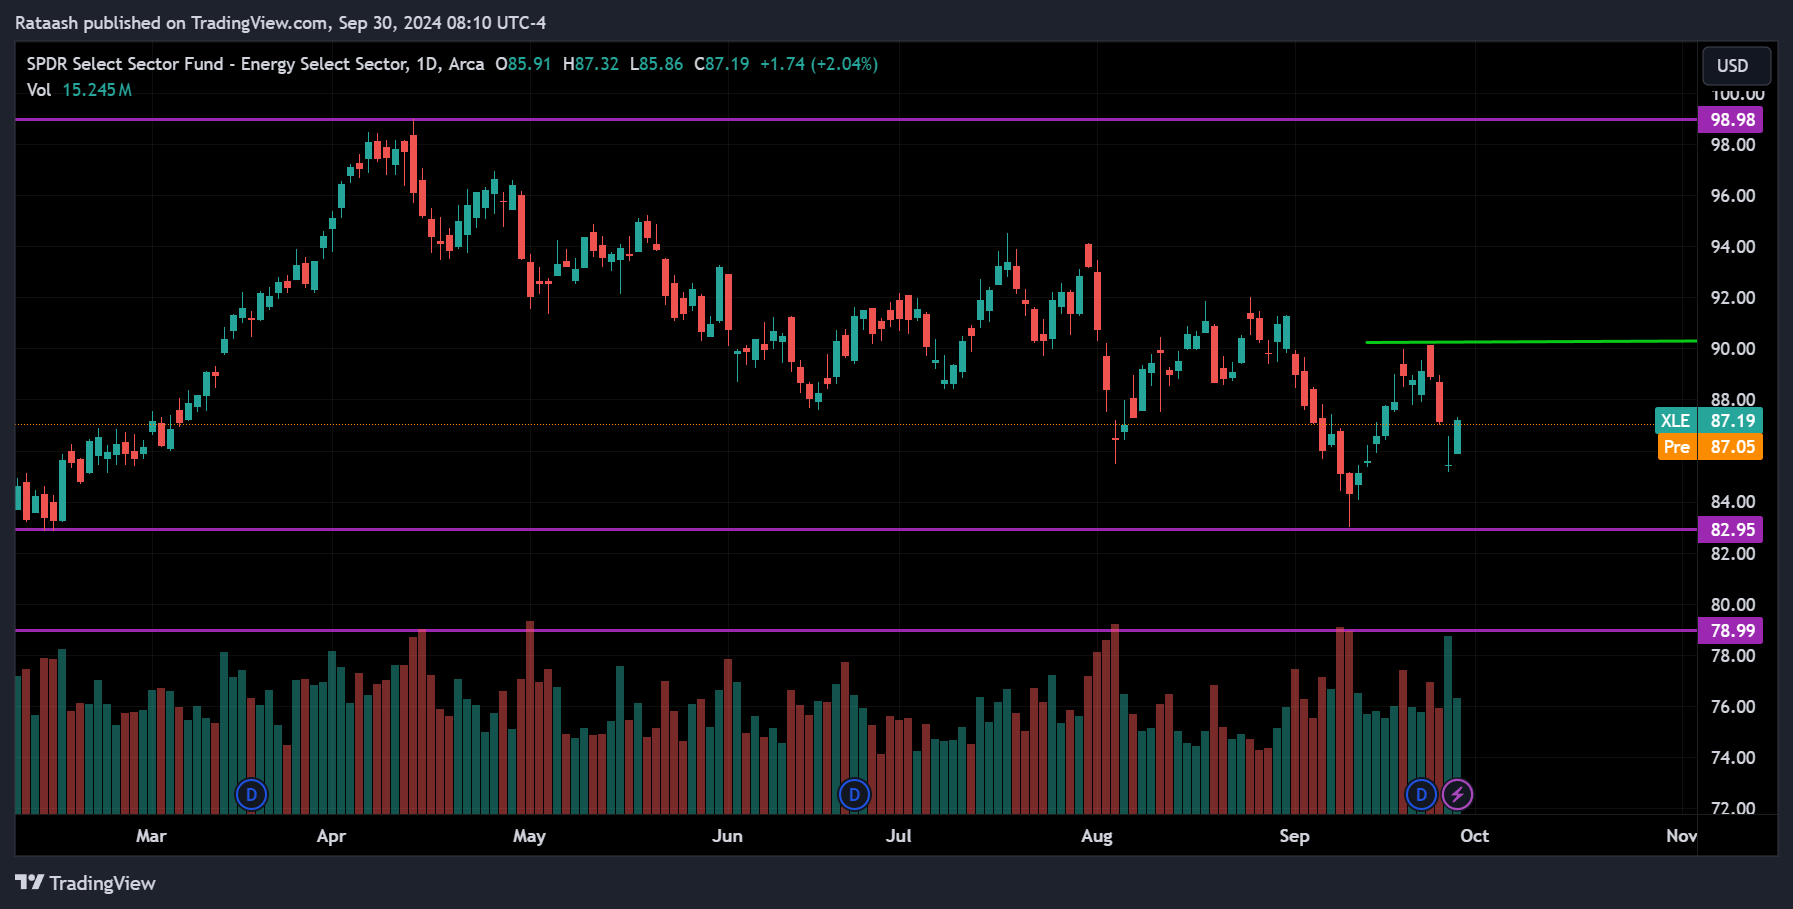
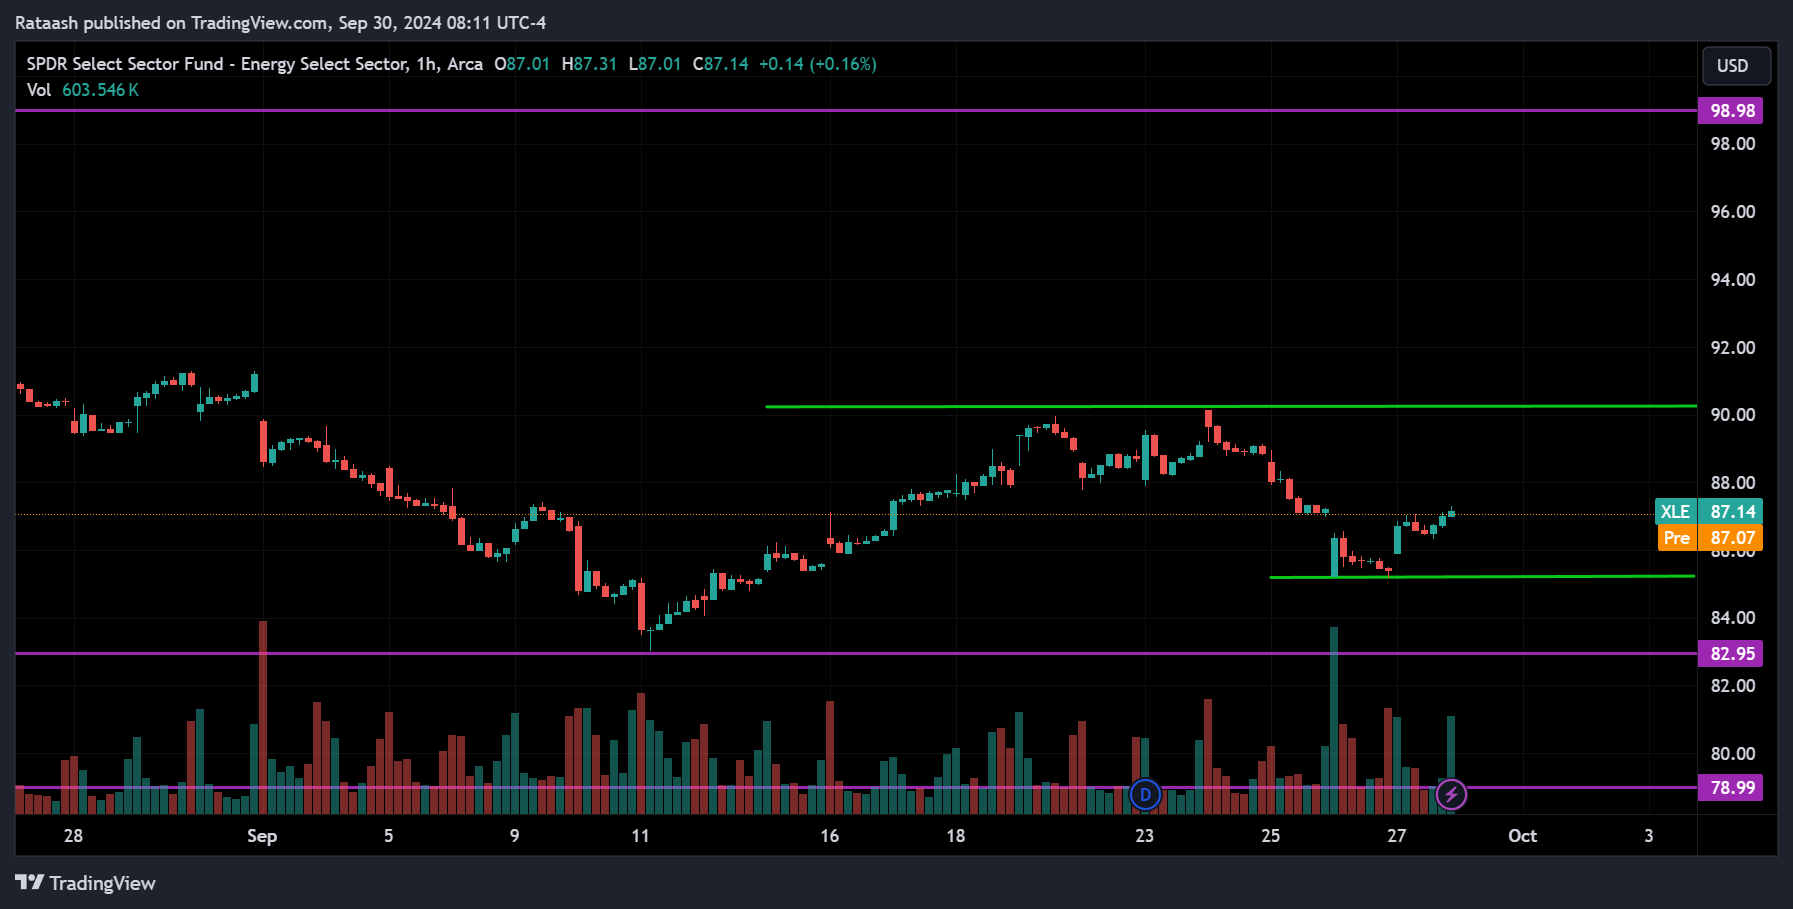
The Energy sector (XLE) is overall trending down. Looking at the 1-hour chart, after the price reached the support at 82.95, it pulled back up to the resistance at 90 and has since started dropping again. Currently, it’s near the 85 support level. Given the downtrend, we can expect the price to break below this support and continue dropping towards 82.95, possibly breaking further down to the 79 range. However, if the price breaks above the 90 resistance, we can expect it to rise toward the 99 range, marking the start of an uptrend.
Materials Sector(XLB):
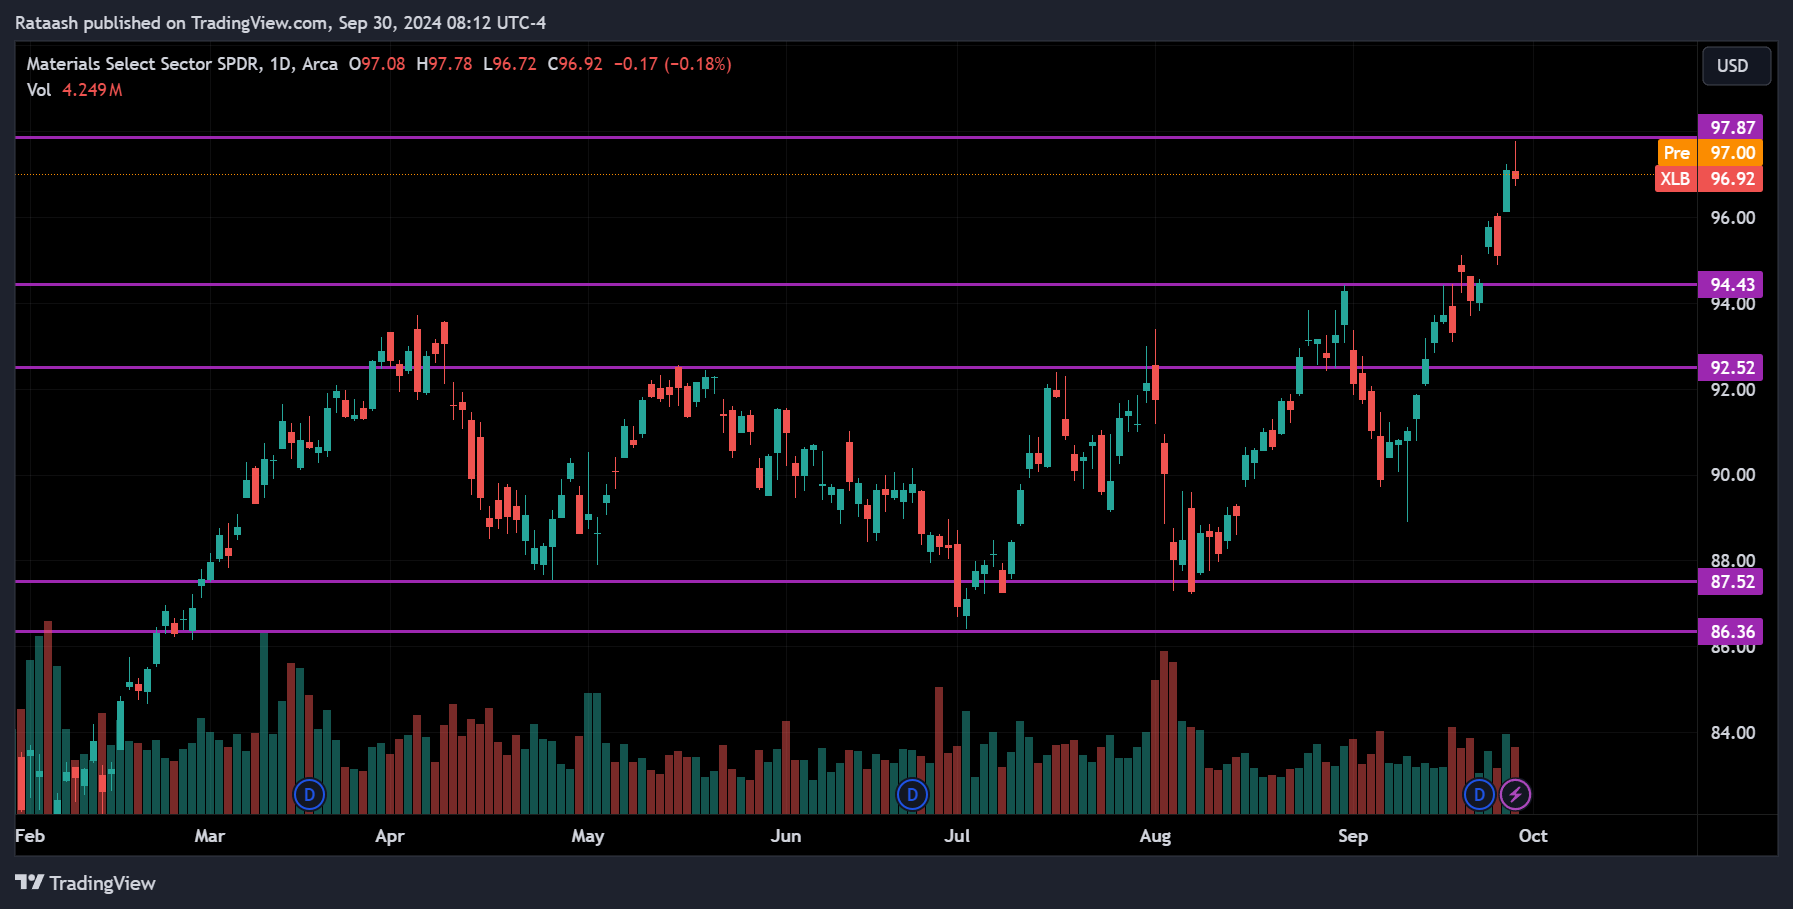
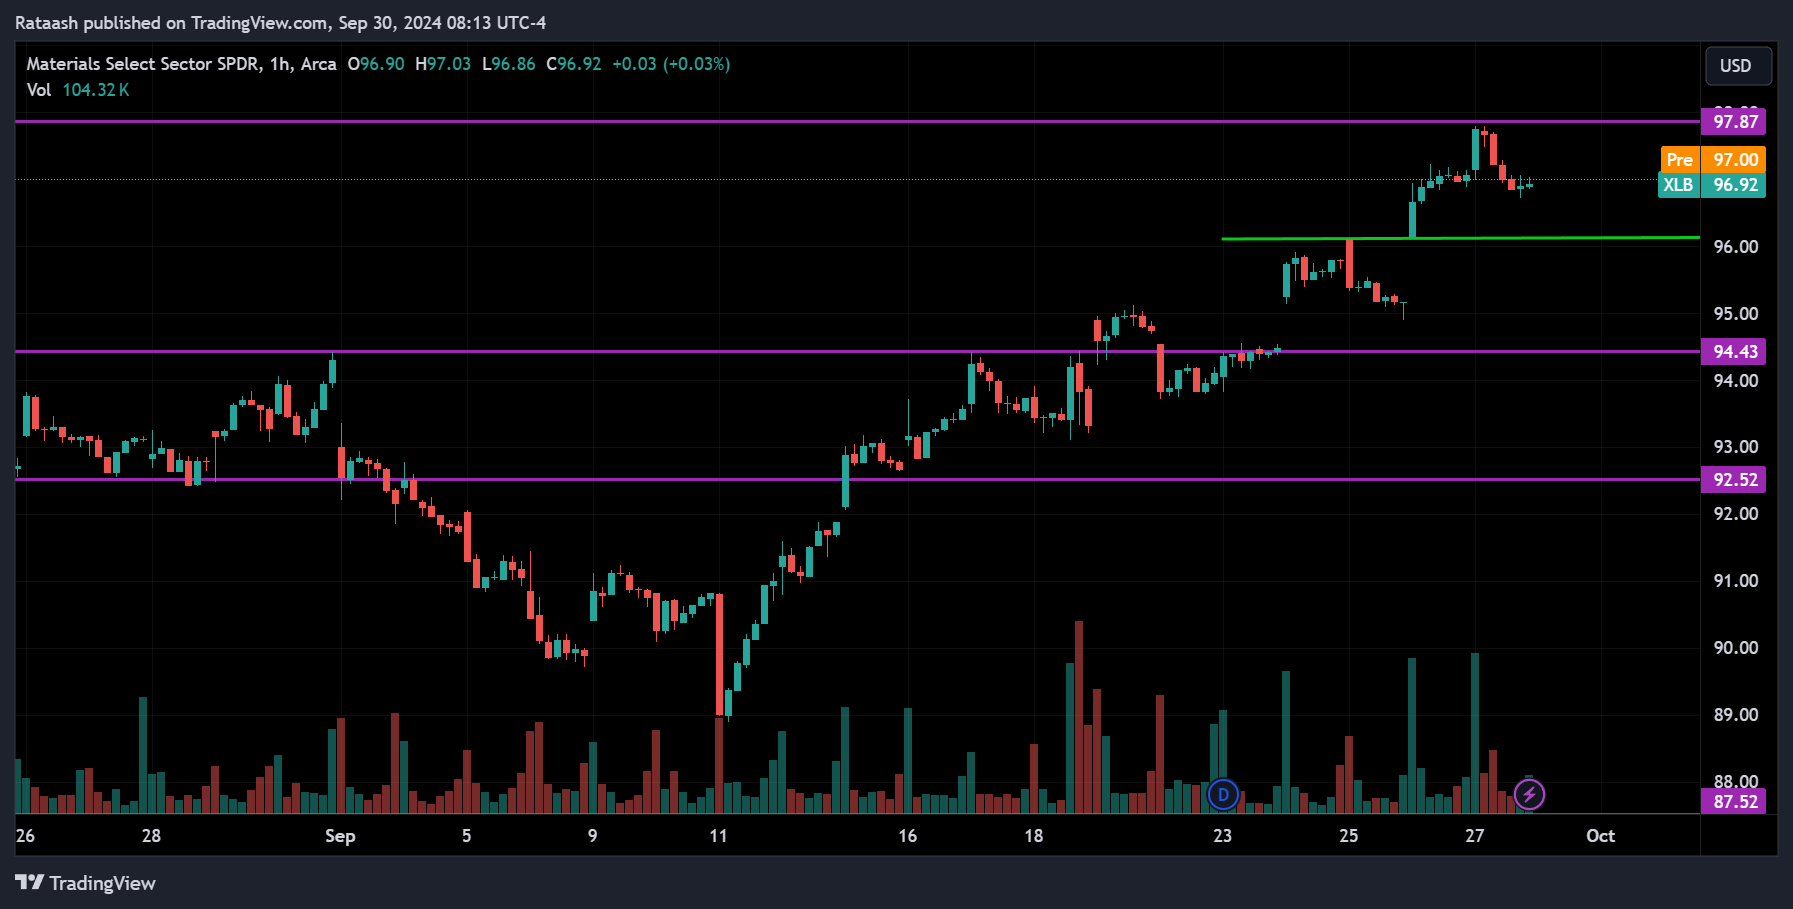
The Materials sector is following the S&P 500 and is currently near its all-time high around 98. If the price breaks above this resistance, we can expect the upward momentum to continue. However, if the price breaks below the minor support at 96, we could see a drop to the 94.50 level. If that level is also broken, it may signal the start of a correction, potentially bringing the price down to 92.50.
Industrial Sector(XLI):
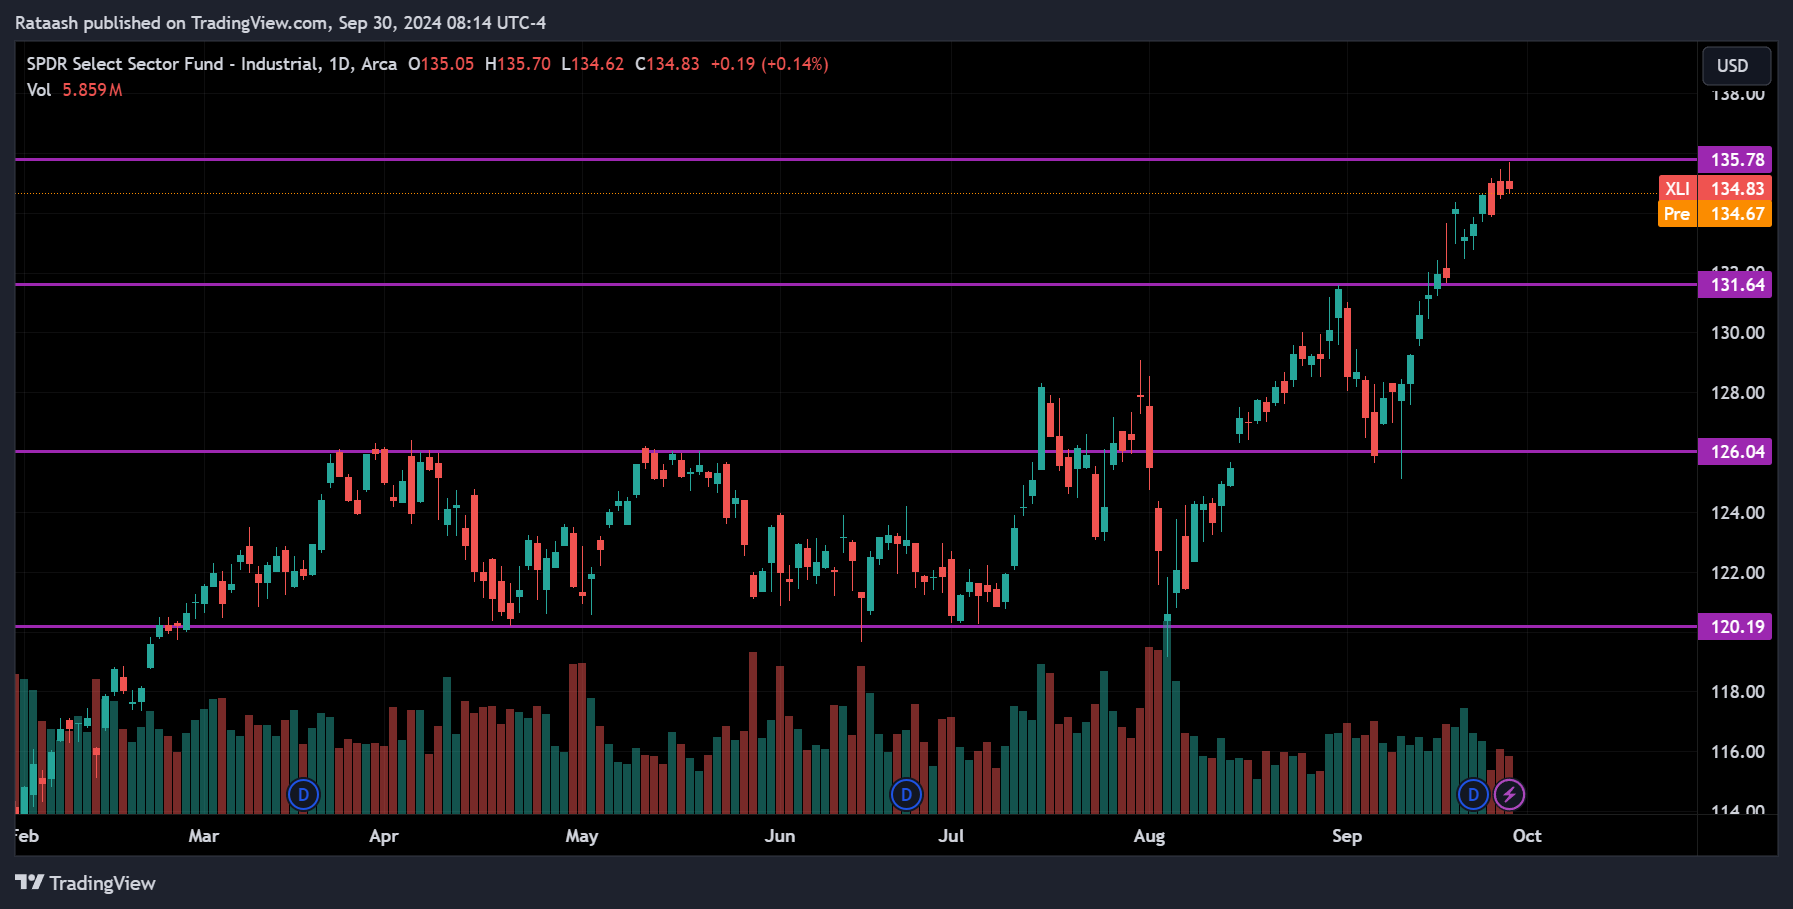
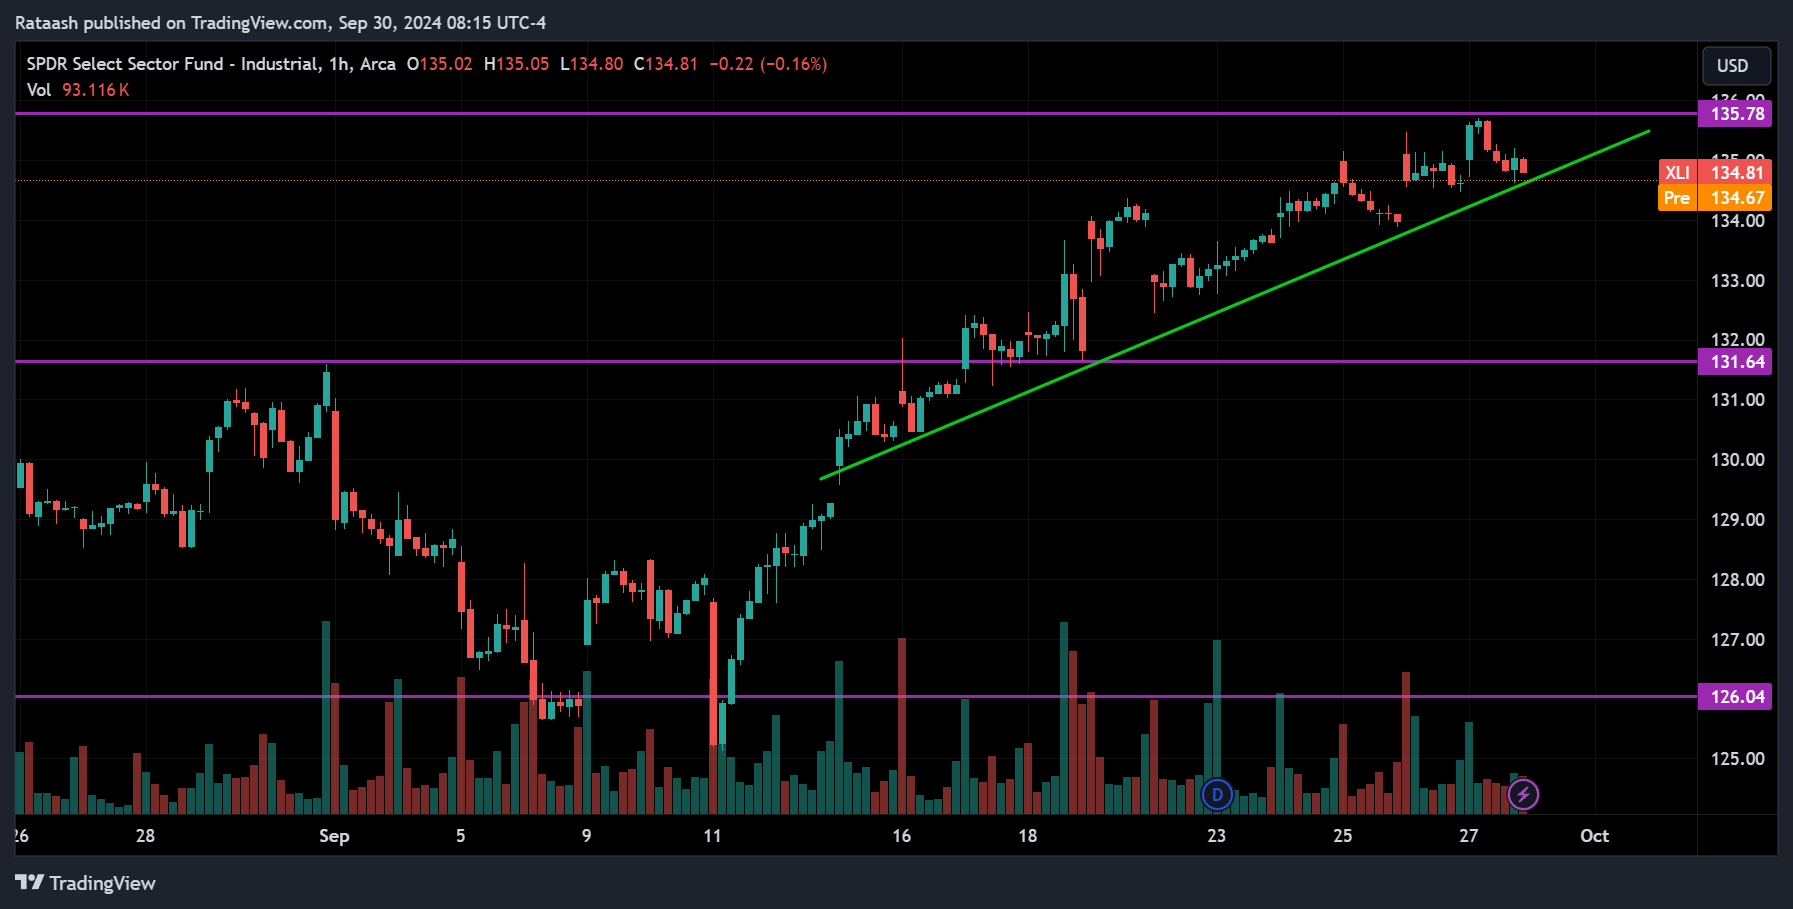
The Industrial sector is also at all-time high levels, with 136 acting as a major resistance. We expect the price to break above this resistance and continue rising in the coming days, as the 1-hour chart shows a clear uptrend. However, be cautious of the price breaking below the trend line, as this could signal a correction. If that happens, the price might drop to the support level around 131.60.
Consumer Discretionary Sector(XLY):
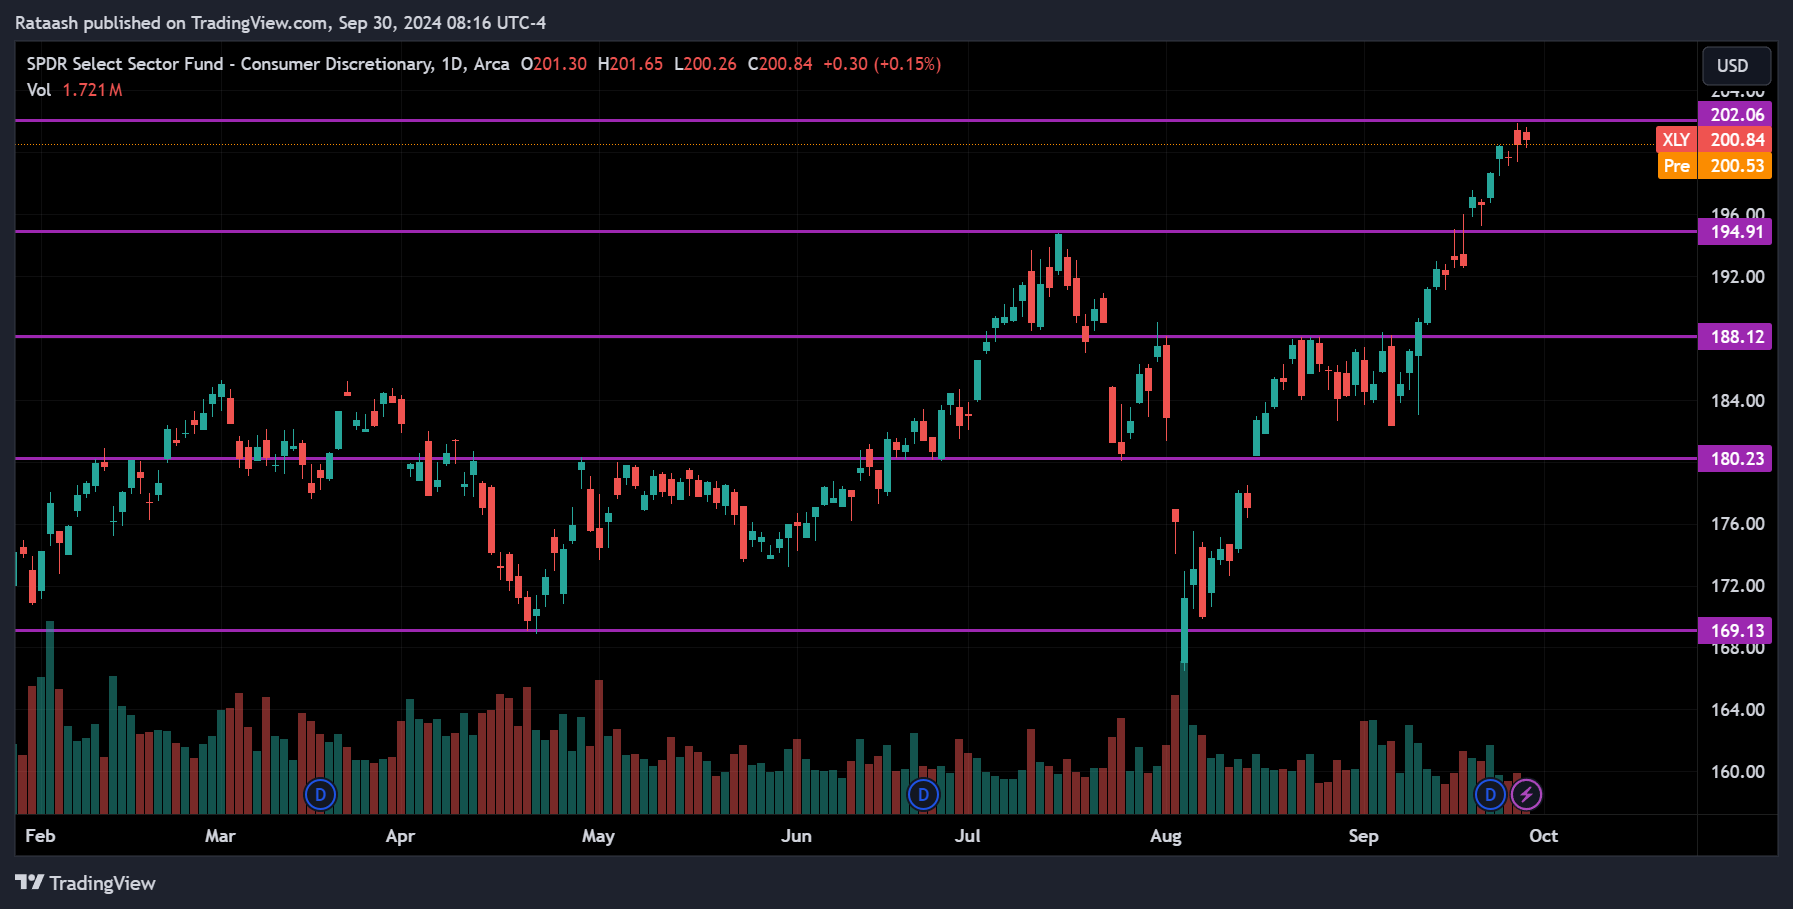
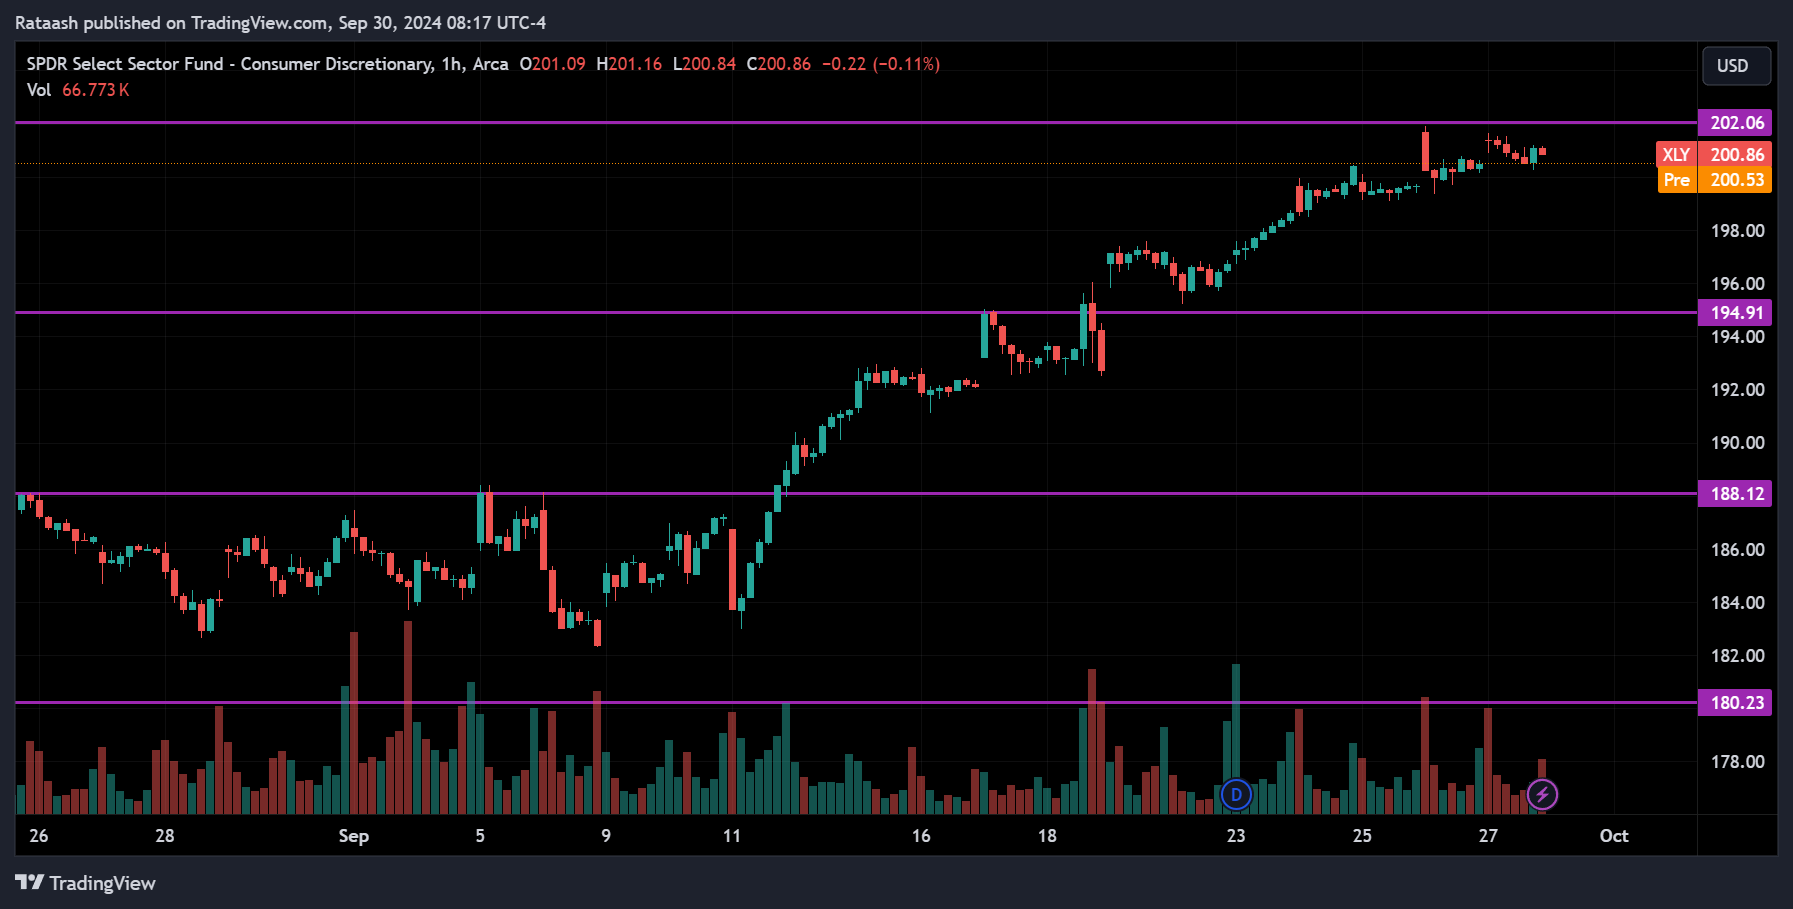
XLY is also at all-time high levels, with the price just below the major resistance at 202. We can expect the price to break above this level and continue upward. However, if the price pulls back from this resistance, it could signal a correction, with the price likely dropping to the 195 support range. If the price breaks below this support, it may enter a downtrend.
Healthcare Sector(XLV):
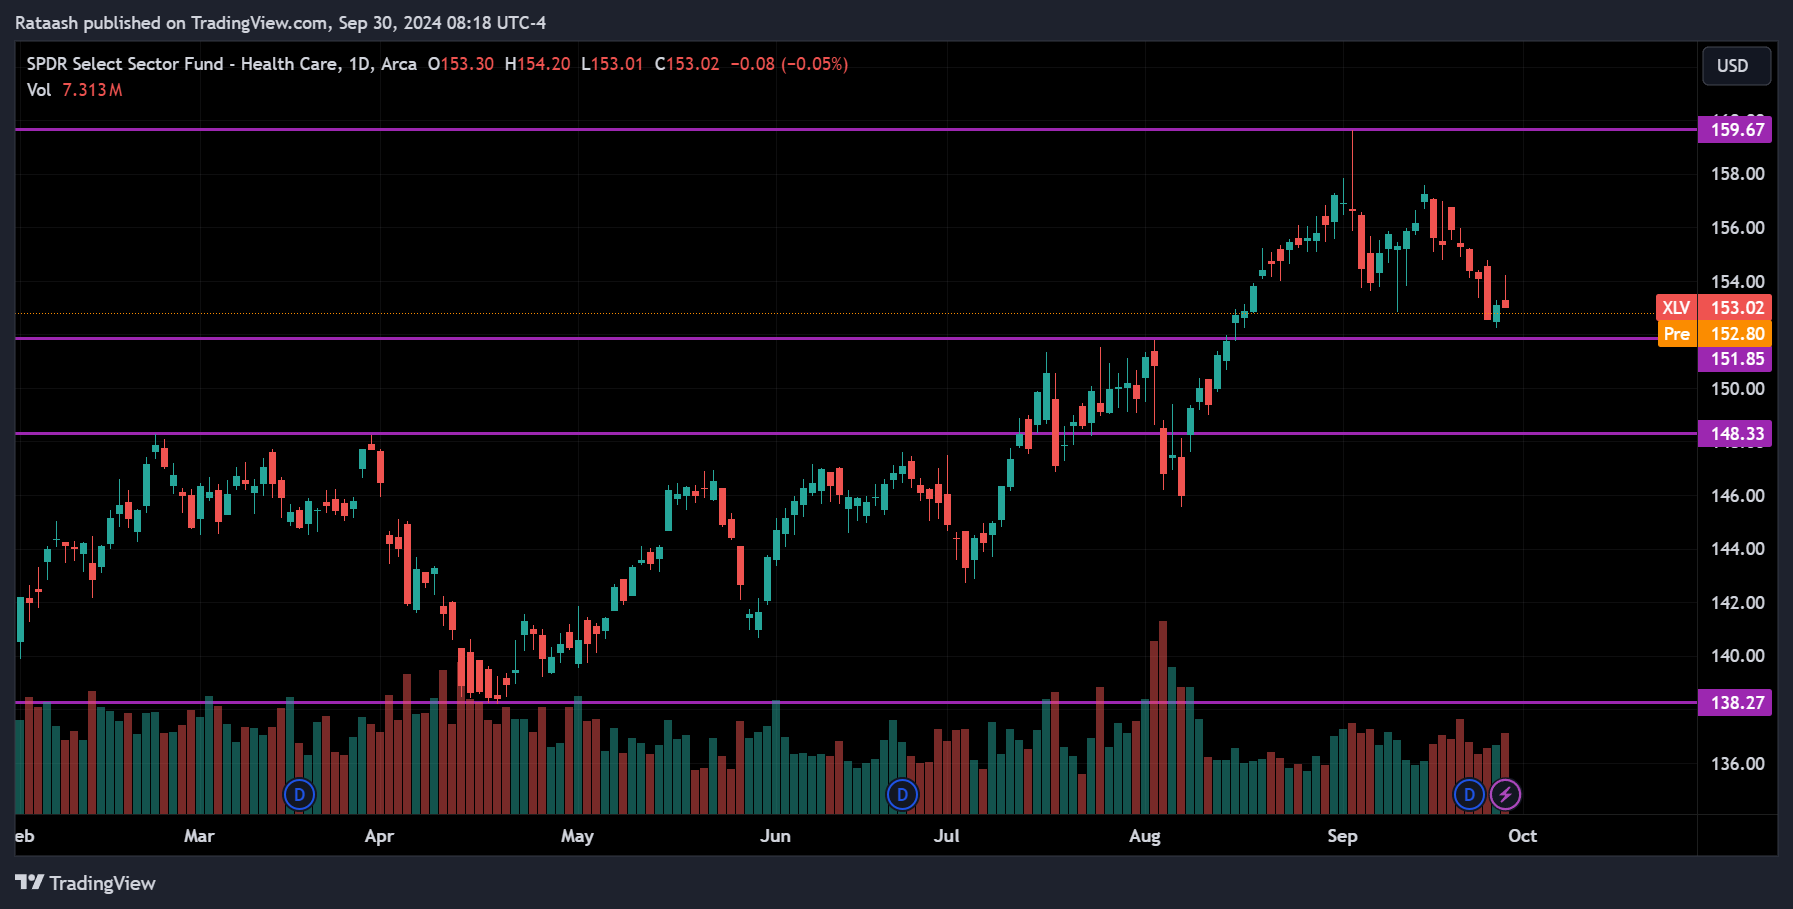
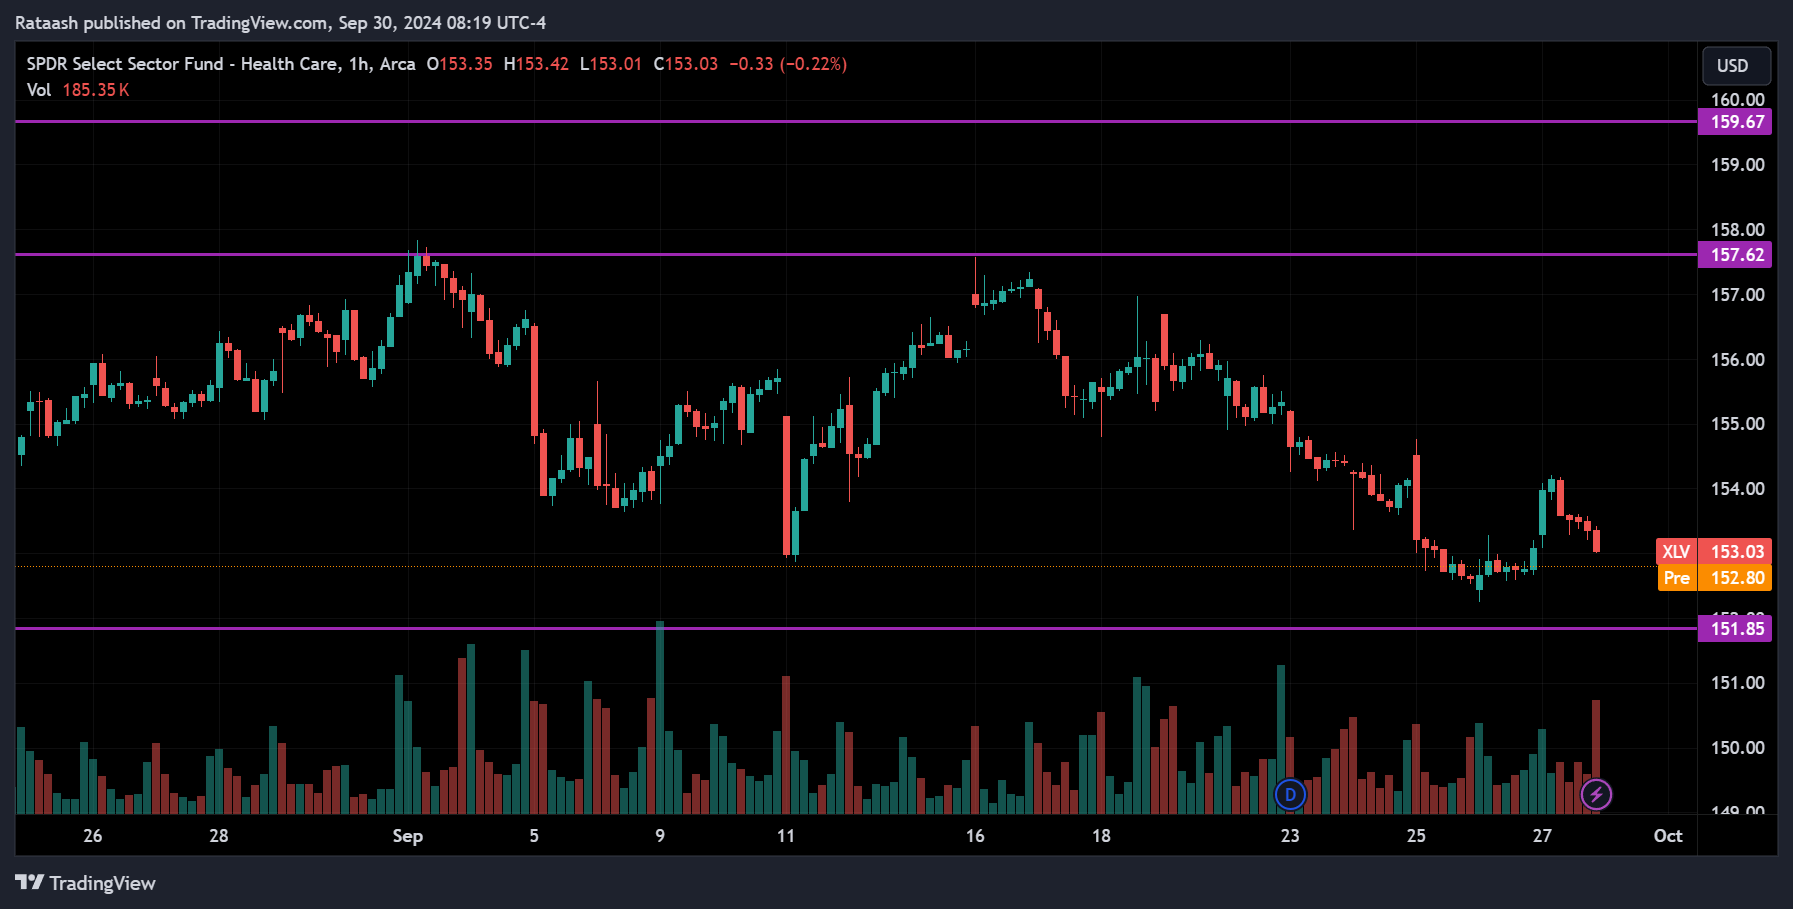
The Healthcare sector is pulling back from the major resistance at 160 and is currently just above the support at 152. If the price breaks below this support, it could signal the start of a downtrend, with the price likely continuing to drop toward 148. On the other hand, since the overall market is trending up, we could also expect the price to rebound from this 152 support level and start moving upward again.
Financials Sector(XLF):
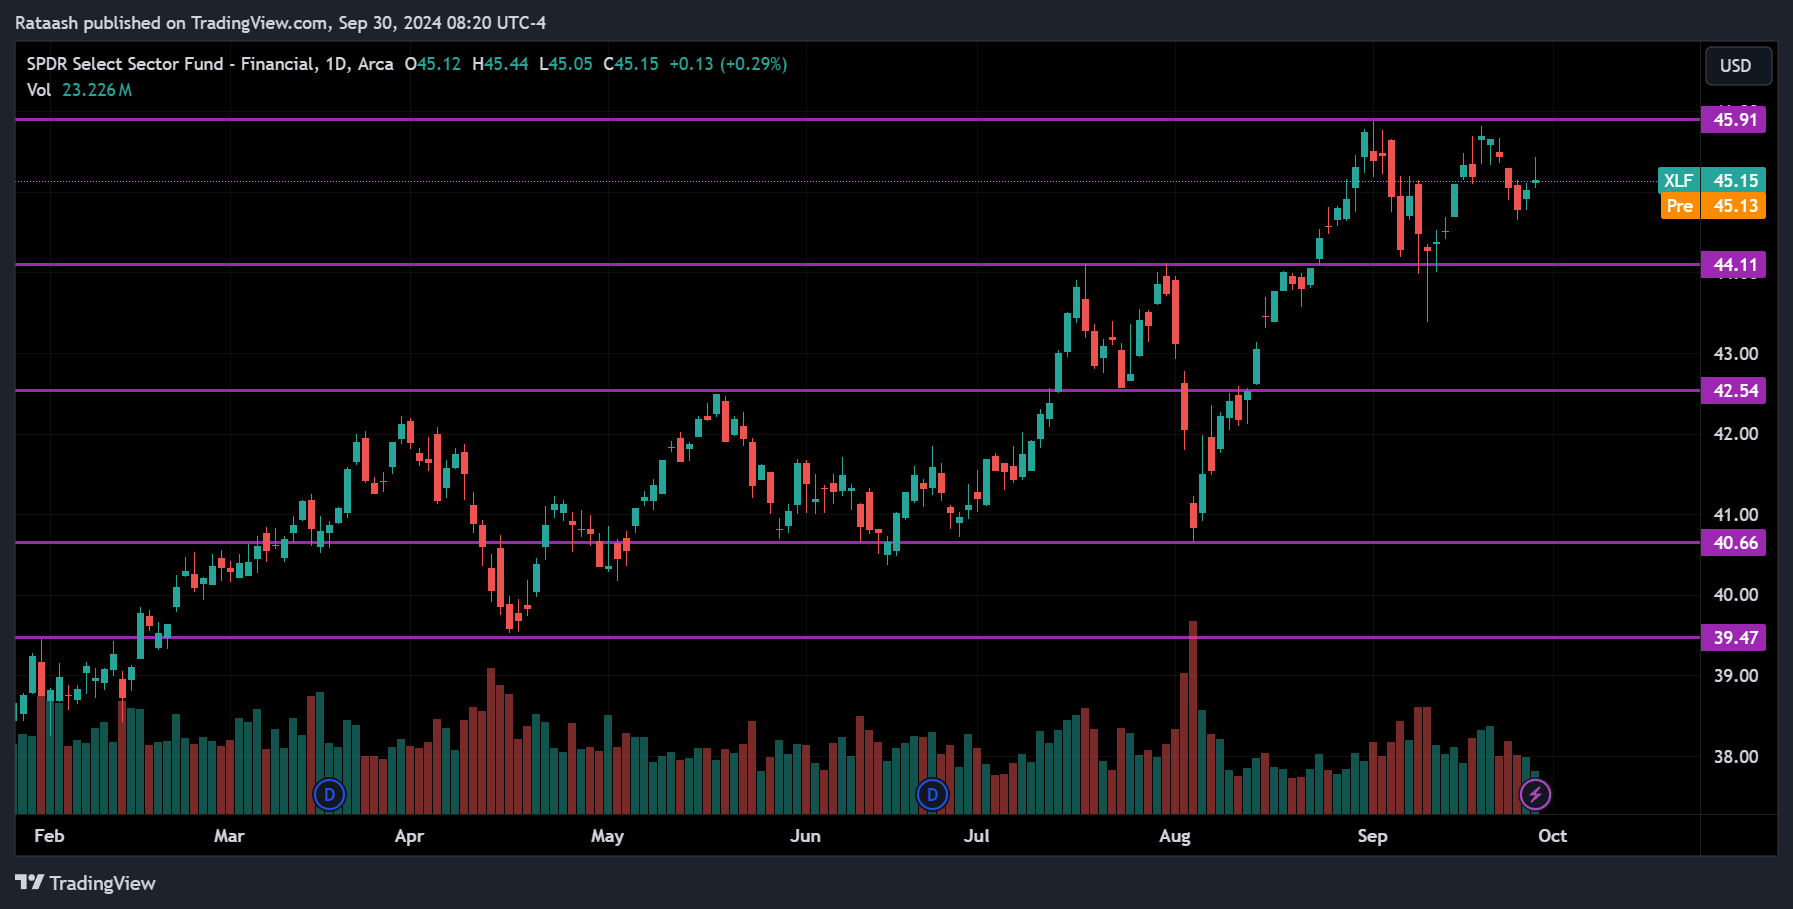
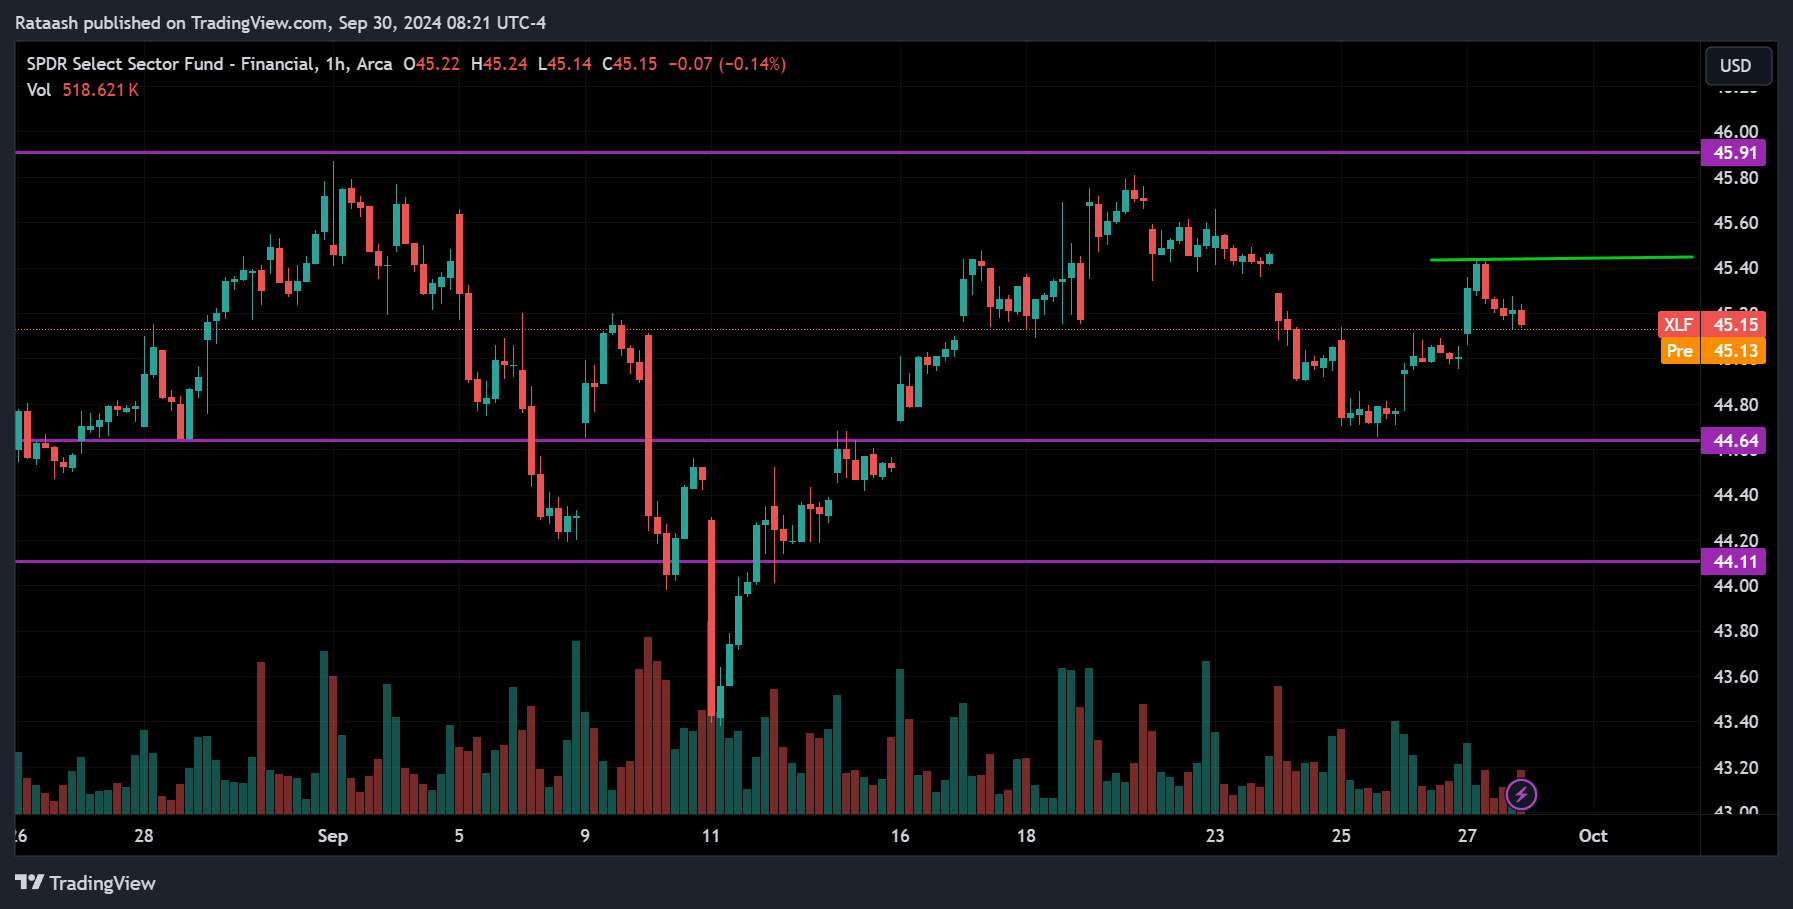
Looking at the Financial sector, it’s also around its all-time high at 46. On the 1-hour chart, the price pulled back from this resistance, found support around 44.60, and has started moving back up. There’s a minor resistance at 45.40, and if the price breaks above this level, we can expect it to continue rising towards 46. However, if the price starts to drop and breaks below the 44.60 support, we could see it fall further to the 44 range.
Technology Sector(XLK):
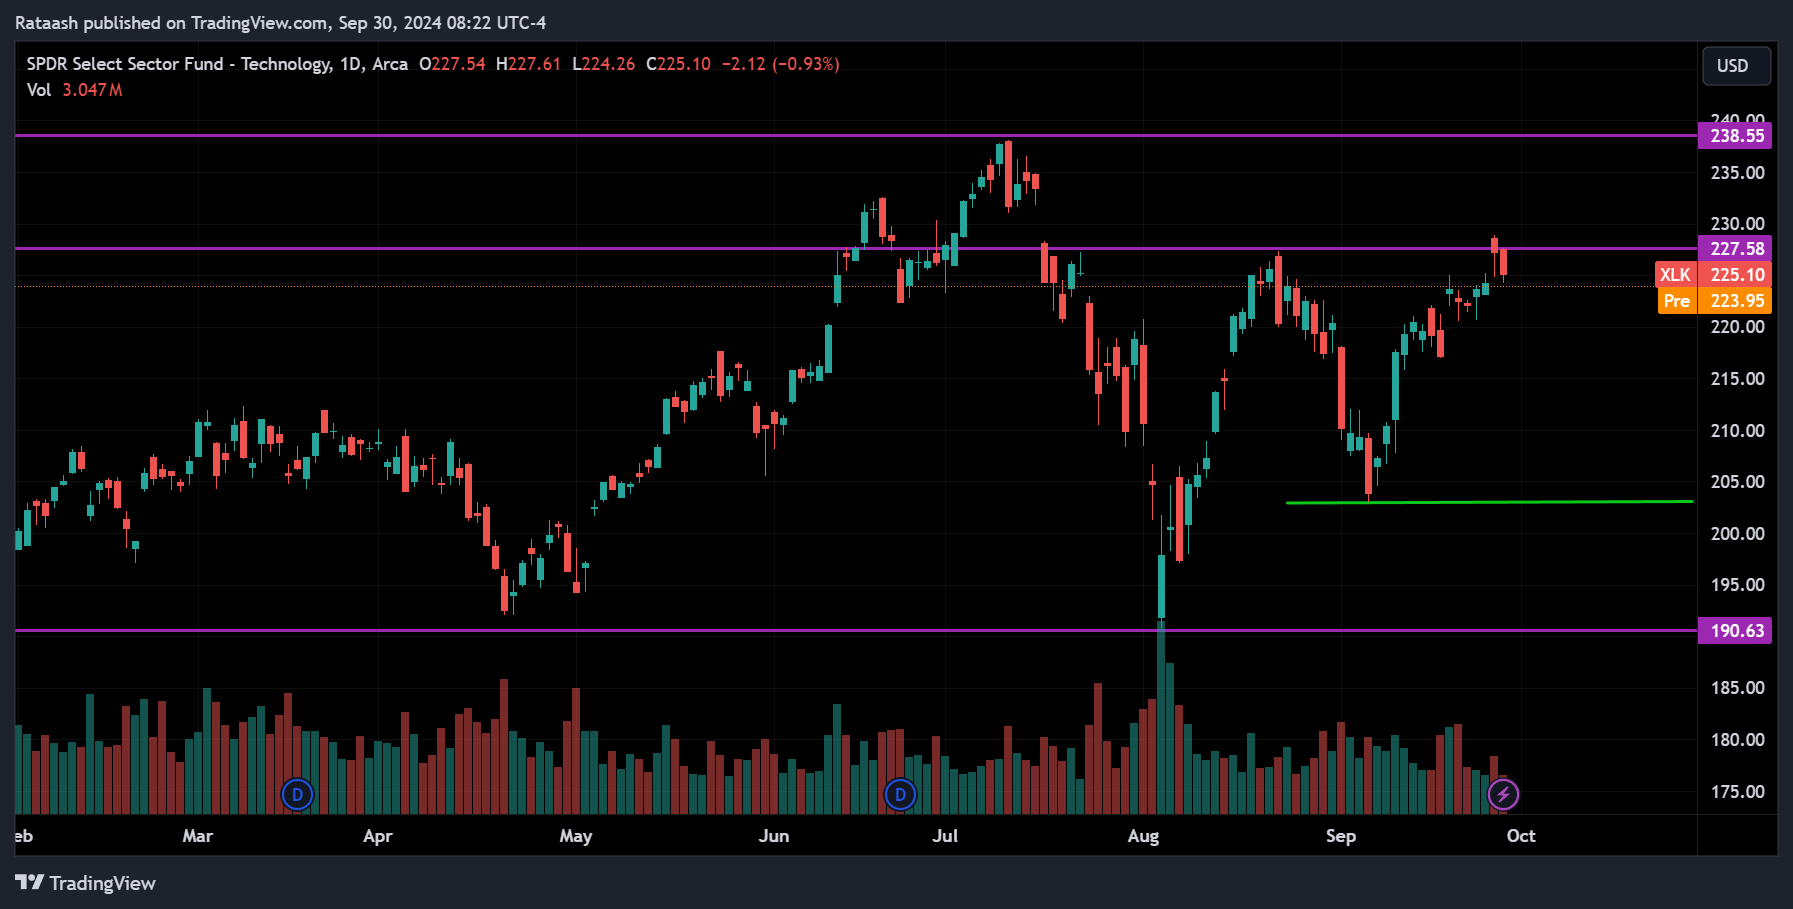
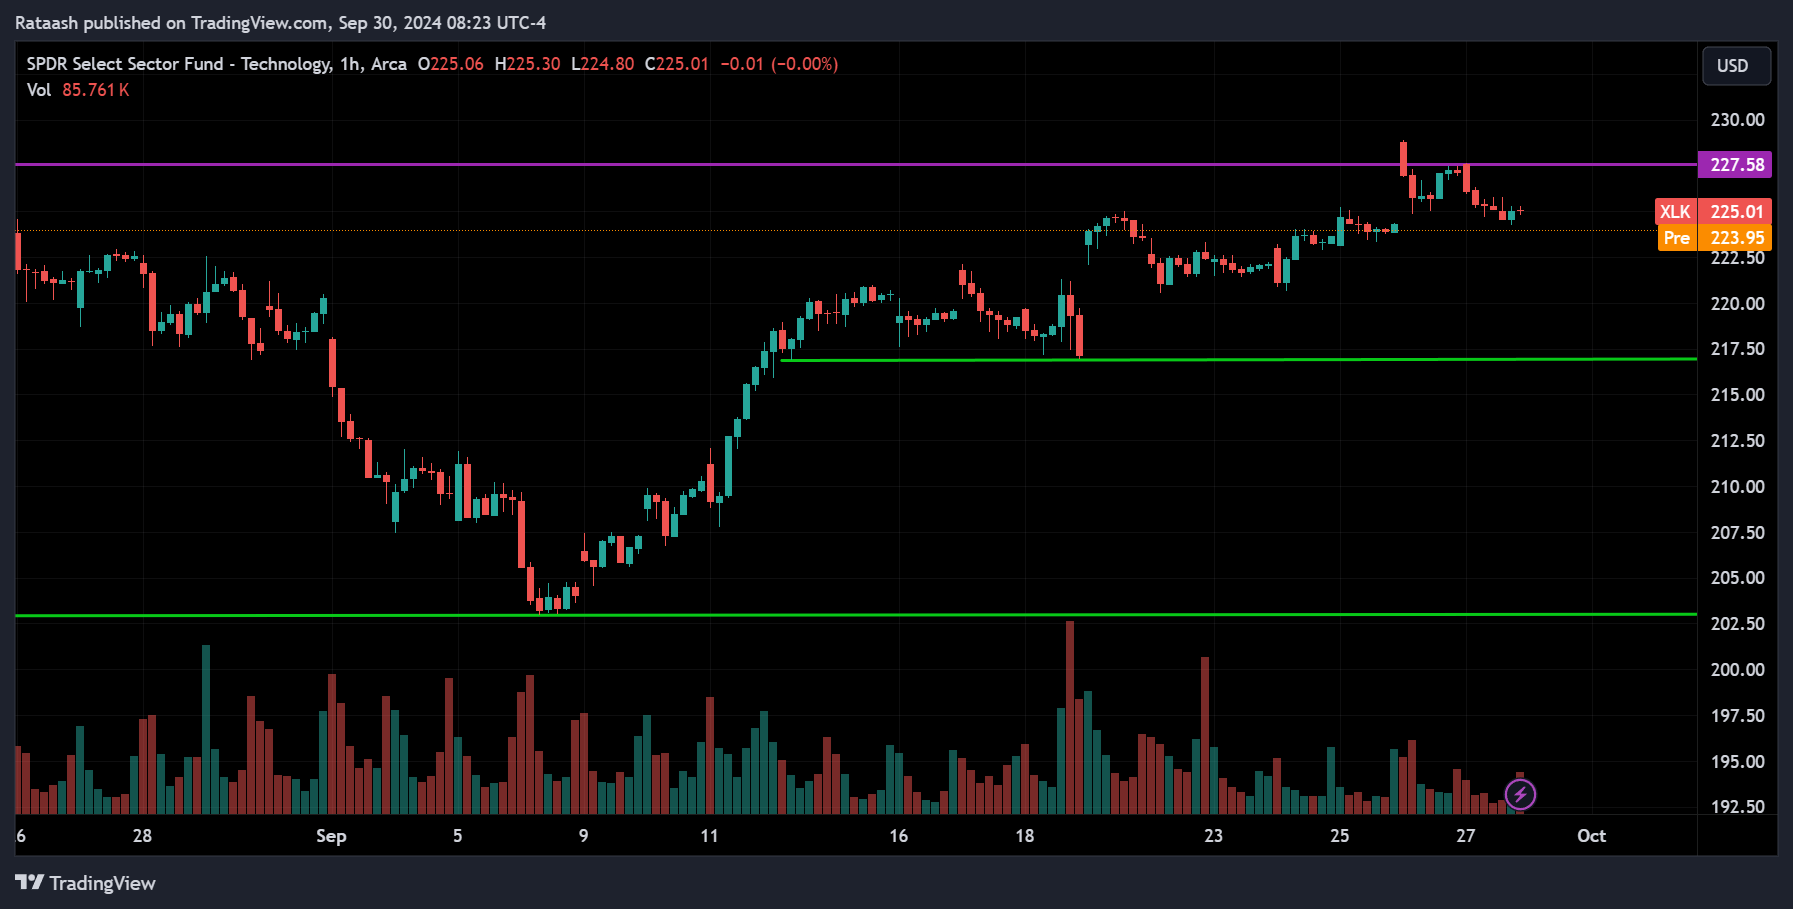
The Technology sector is overall trending up, with the price currently at the resistance level of 227.50. If the price breaks above this resistance, we can expect it to continue rising toward the all-time high of 240. However, if the price begins to drop from the 227.50 resistance and breaks below the support around 217.50, we could see the price continue to fall toward the 202.50 range.
Communications Sector(XLC):
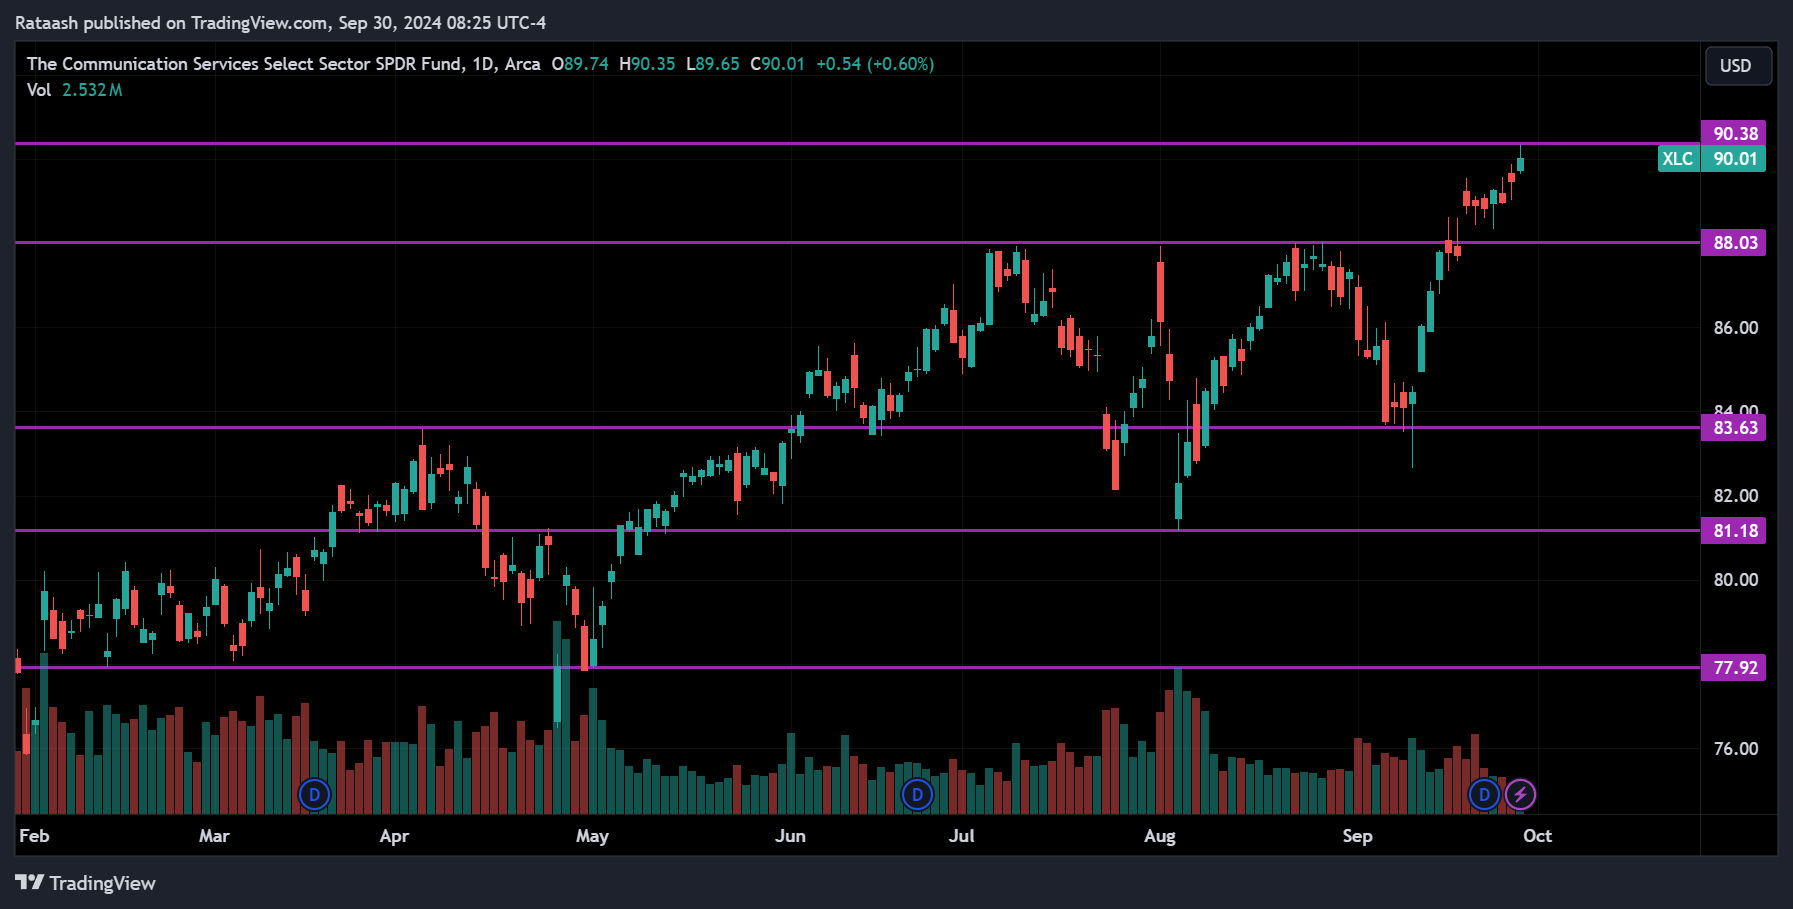
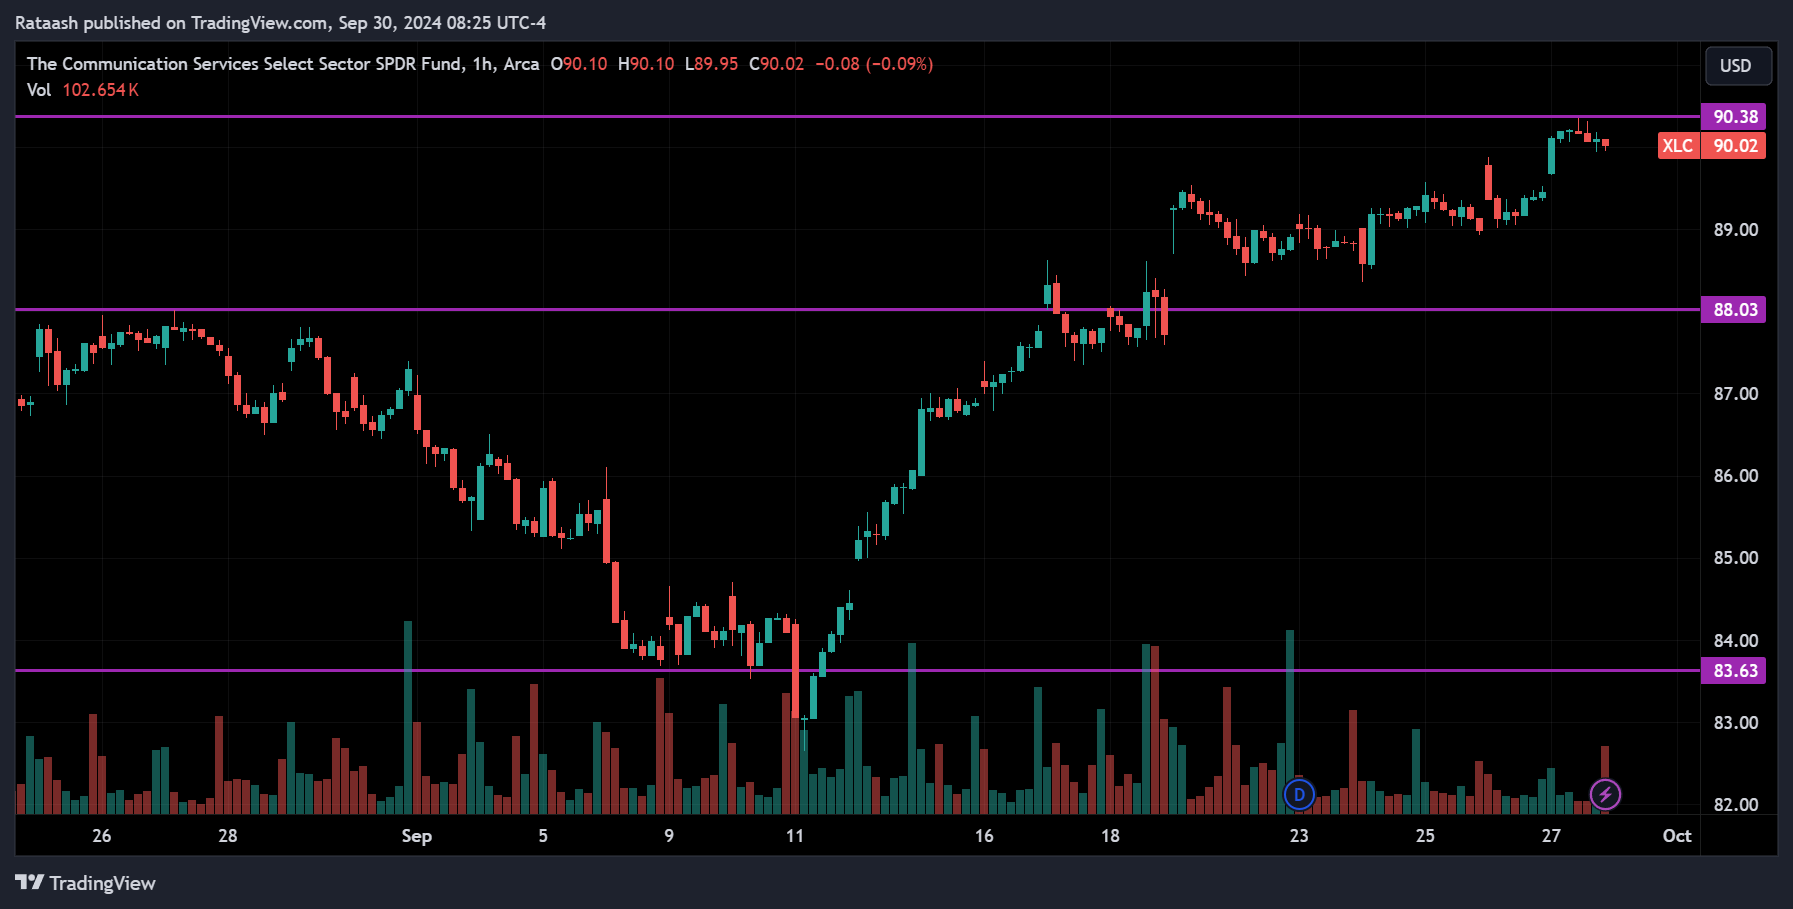
The Communication sector is also at all-time high levels, around 90. We can expect the price to break above this resistance and continue moving upward. However, if the price pulls back and breaks below the support around 88, it could signal the start of a correction, with the price potentially dropping toward 83.60.
Utility Sector(XLU):
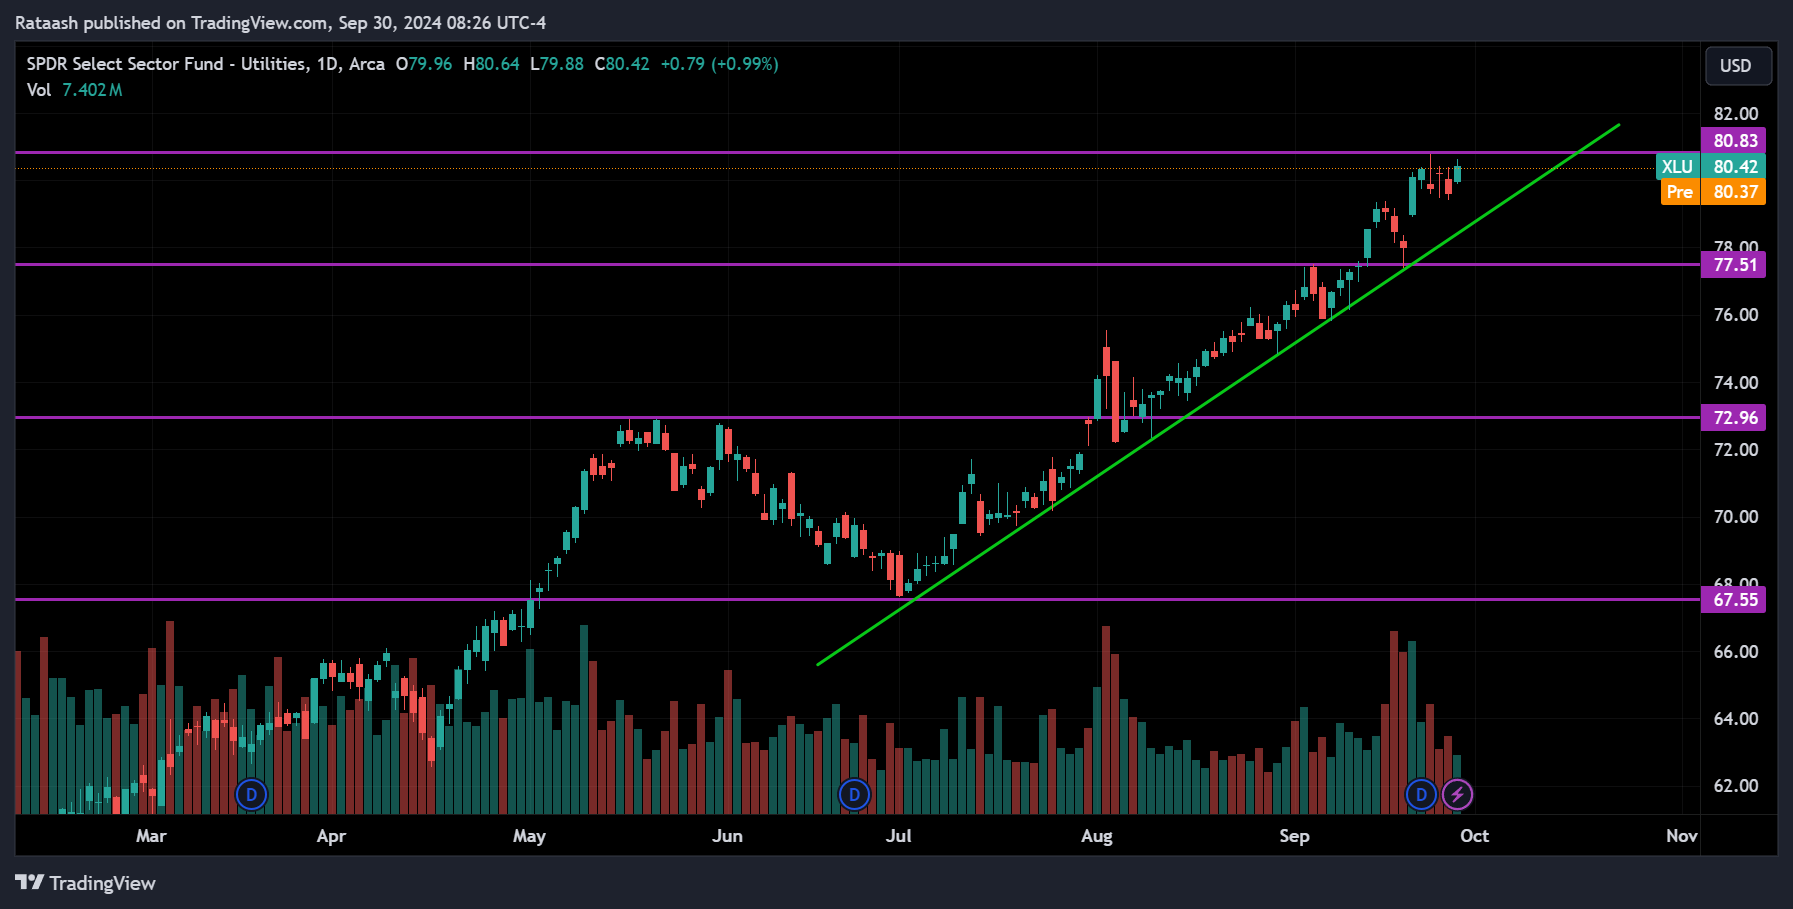
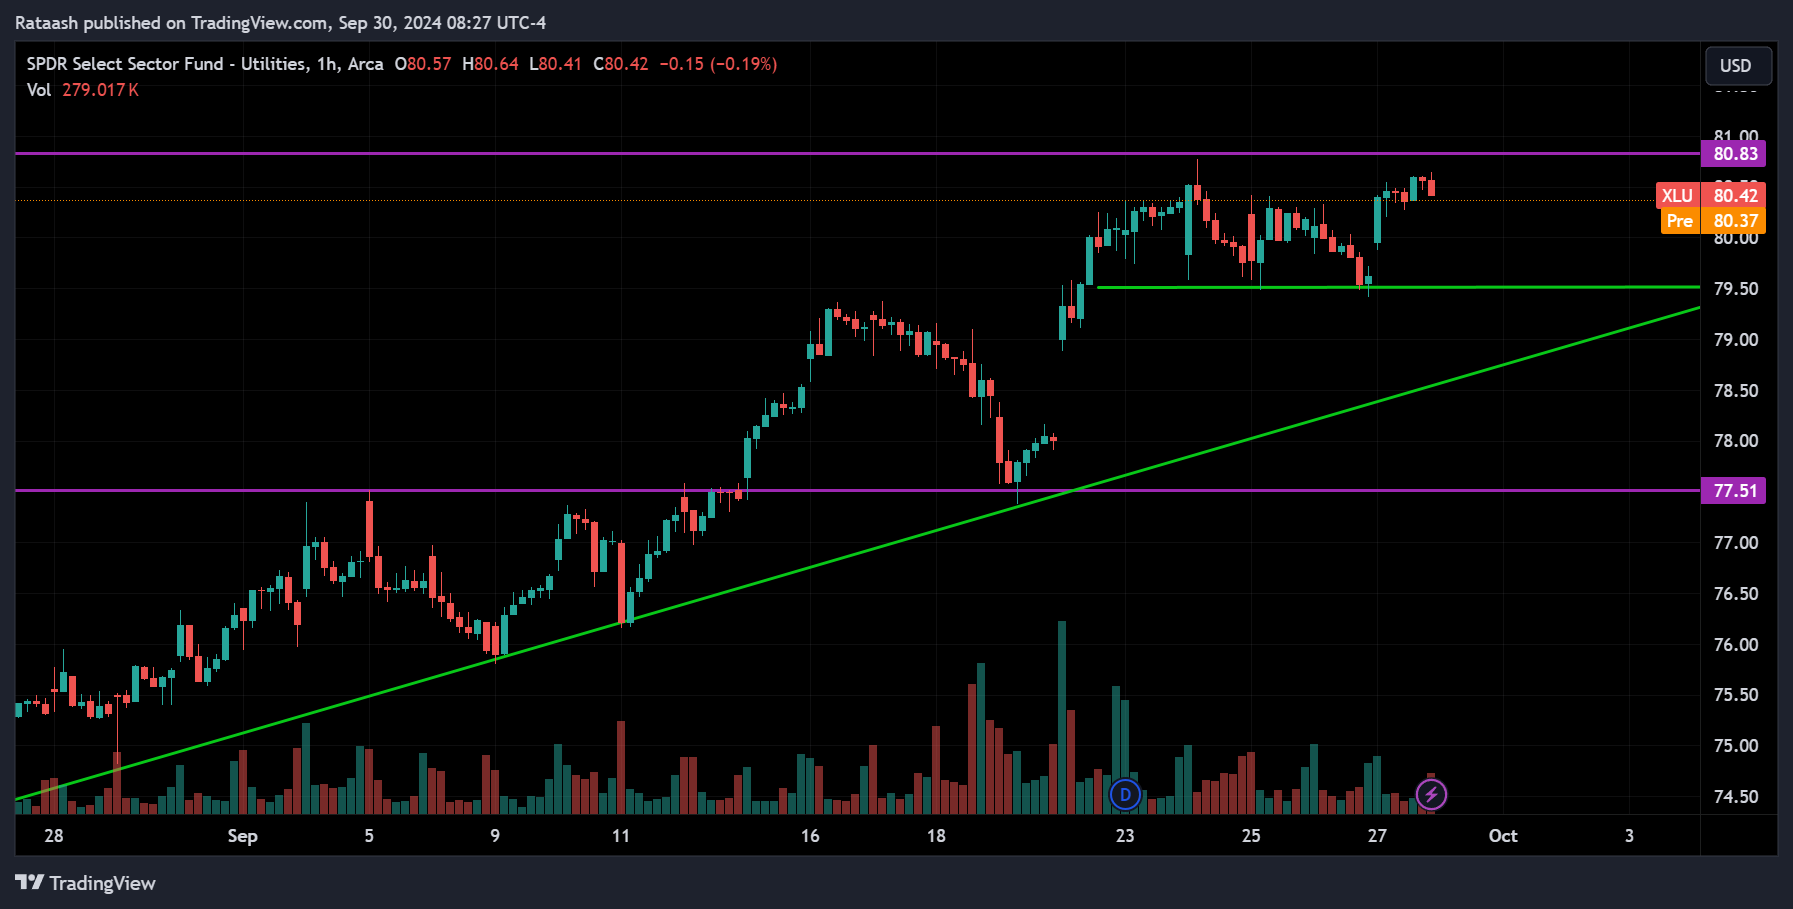
The Utilities sector is in an overall uptrend, with the price at the resistance level of 80.80 and support around 79.50, consolidating between these levels in the short term. Given the uptrend, we can expect the price to break above the 80.80 resistance and continue moving upward. However, if the price breaks below the 79.50 support, it might drop to the trend line. If the price also breaks below the trend line, it could signal the start of a downtrend, possibly heading toward 77.50.
Real Estate Sector(XLRE):
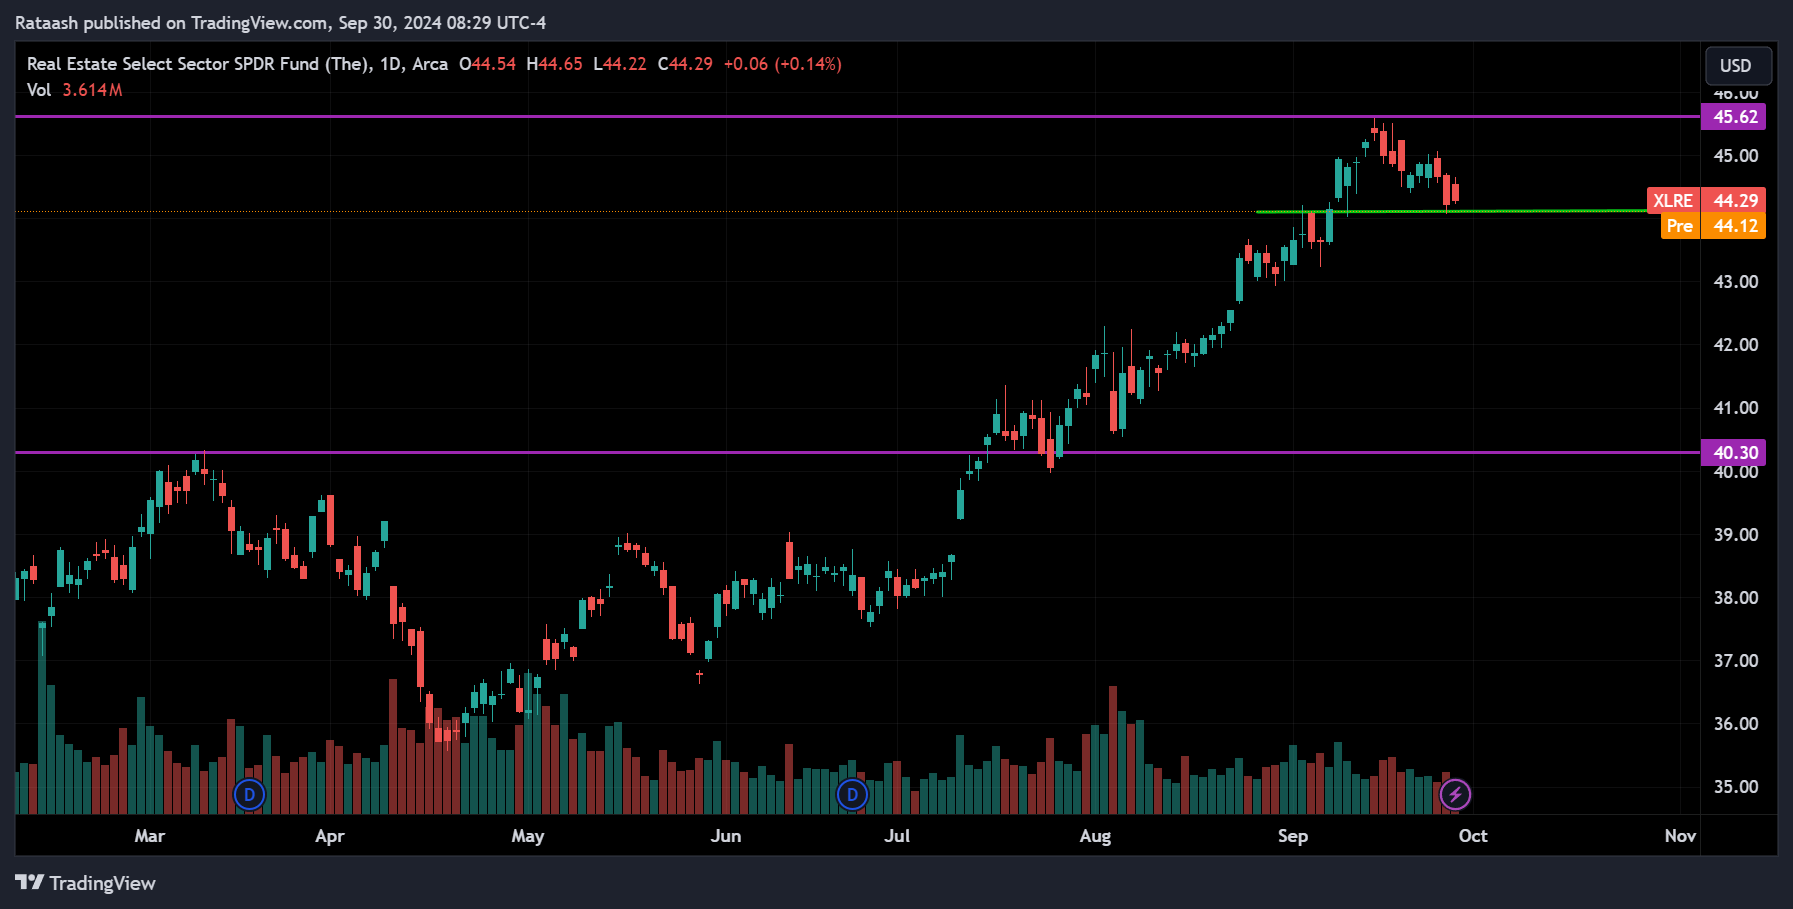
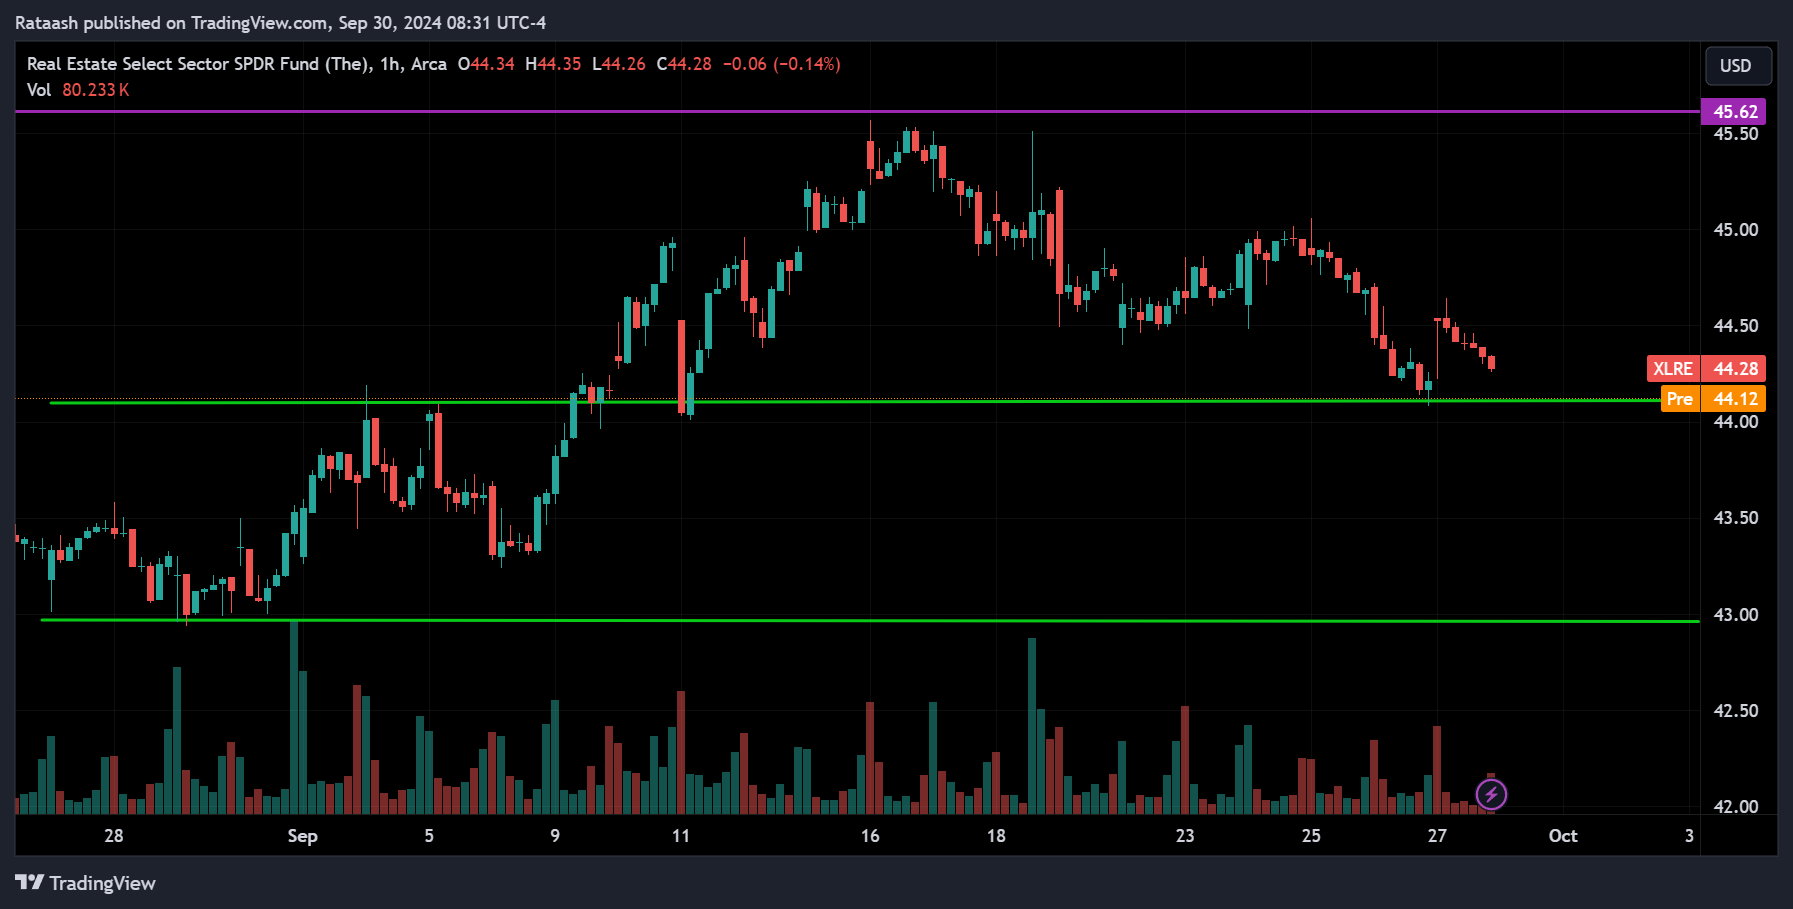
Looking at the Real Estate sector, it’s in an overall uptrend, with the price pulling back from the resistance at 45.60 and currently sitting at the support level of 44. If the price breaks below this support, we can expect it to drop further to the 43 range. However, it’s also possible that the price could start moving upward from this support level, continuing the uptrend.
Stocks to Watch This Week
The following stocks that we are about to analyze play a significant role in the S&P 500, making them crucial to watch. Many of these stocks are Technology related, Technology set to dominate the stock market in the 21st century and beyond. Now, let’s dive into the price action for these key stocks.
NKE – NIKE, Inc.
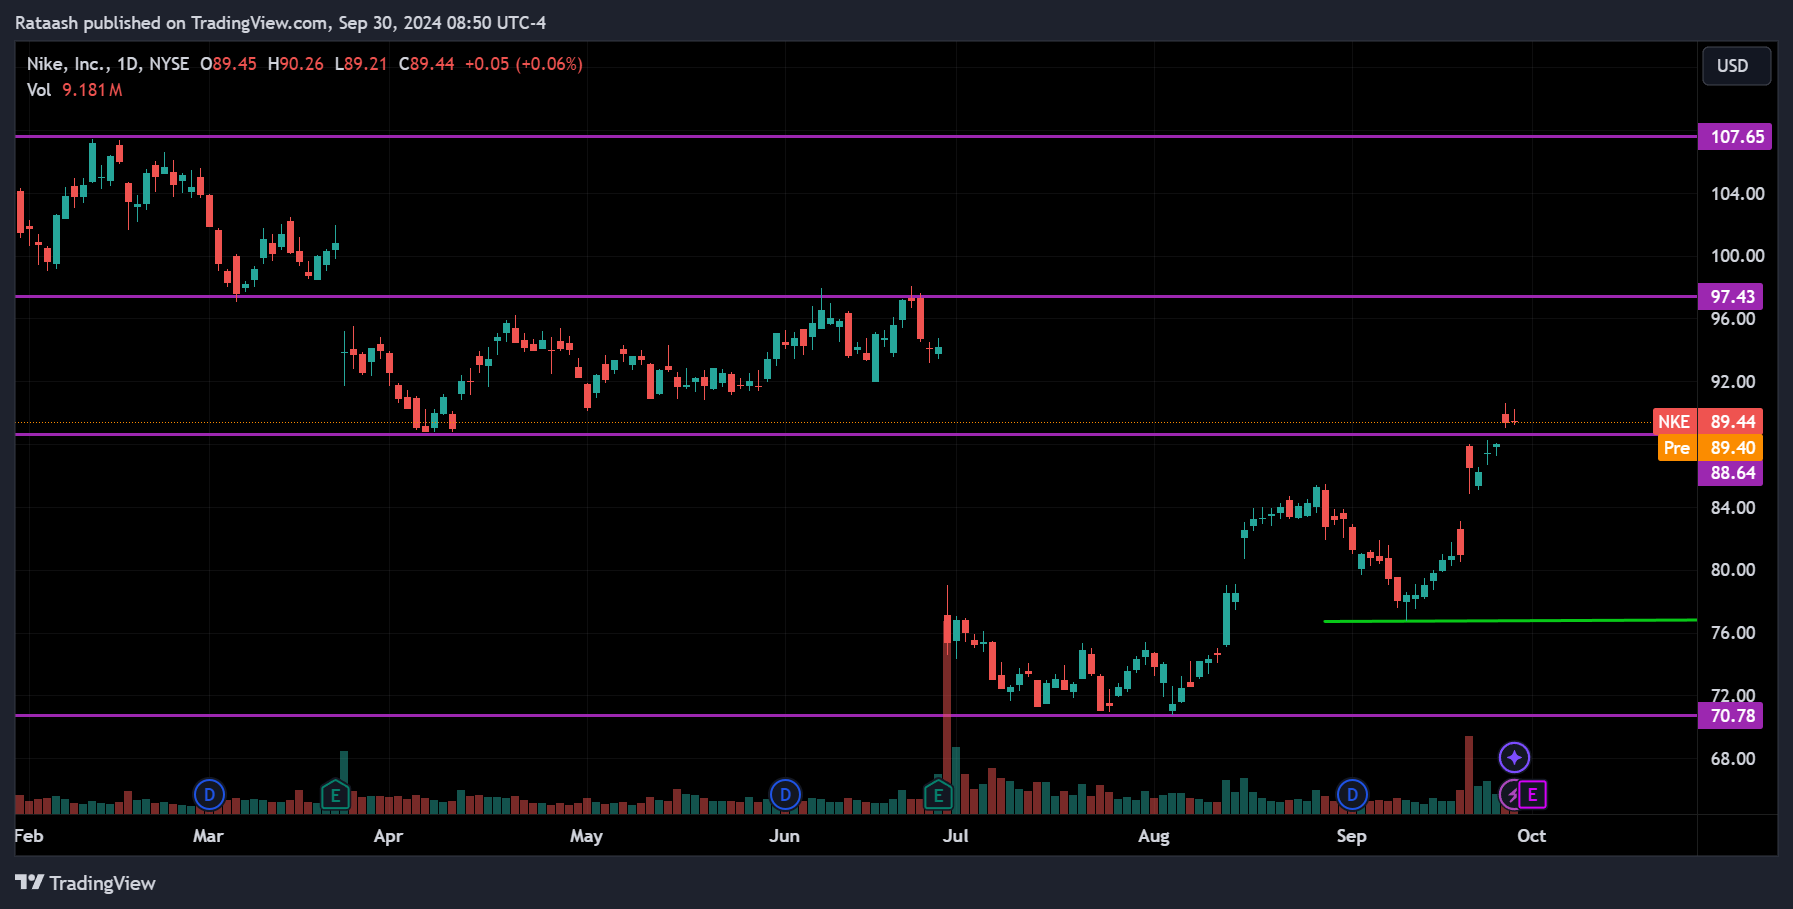
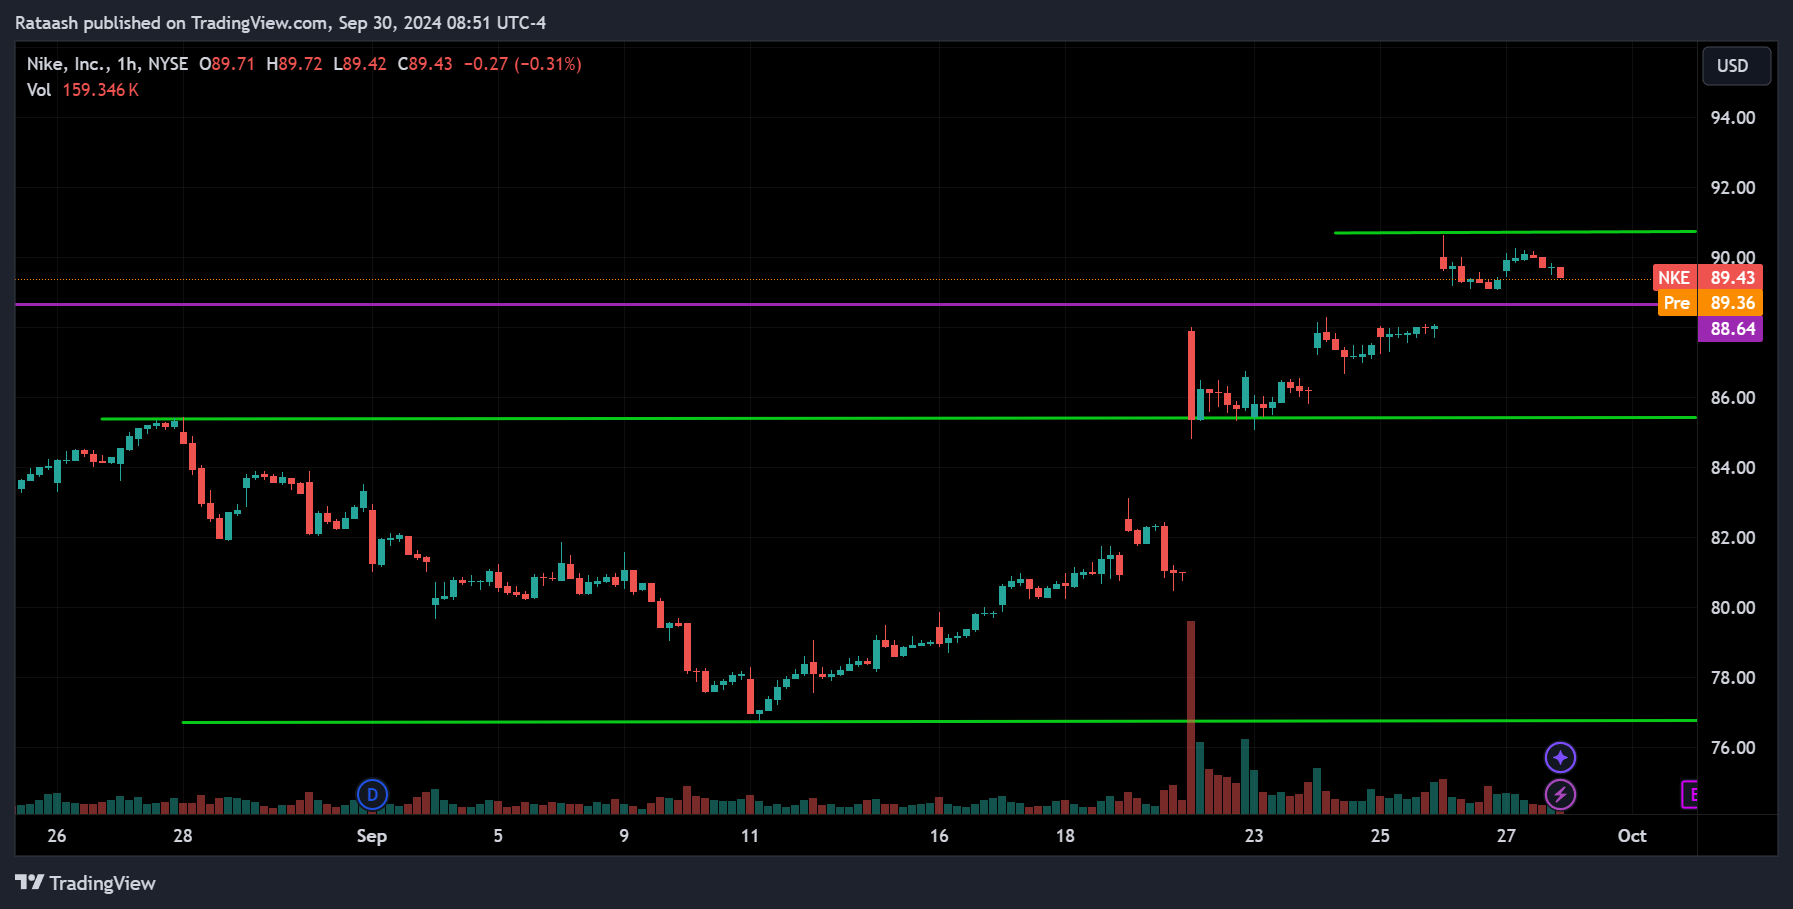
NKE has started an uptrend from its major support around the 77 range. Currently, the price is at the resistance level of 91, with the next resistance around 97.40. If the price breaks above the 91 resistance, we can expect it to continue toward 97.40. However, if the price breaks below the support at 88.60, it could fall to 86, and if that level is also broken, it may drop back to the 77 range.
META – Meta Platforms, Inc.
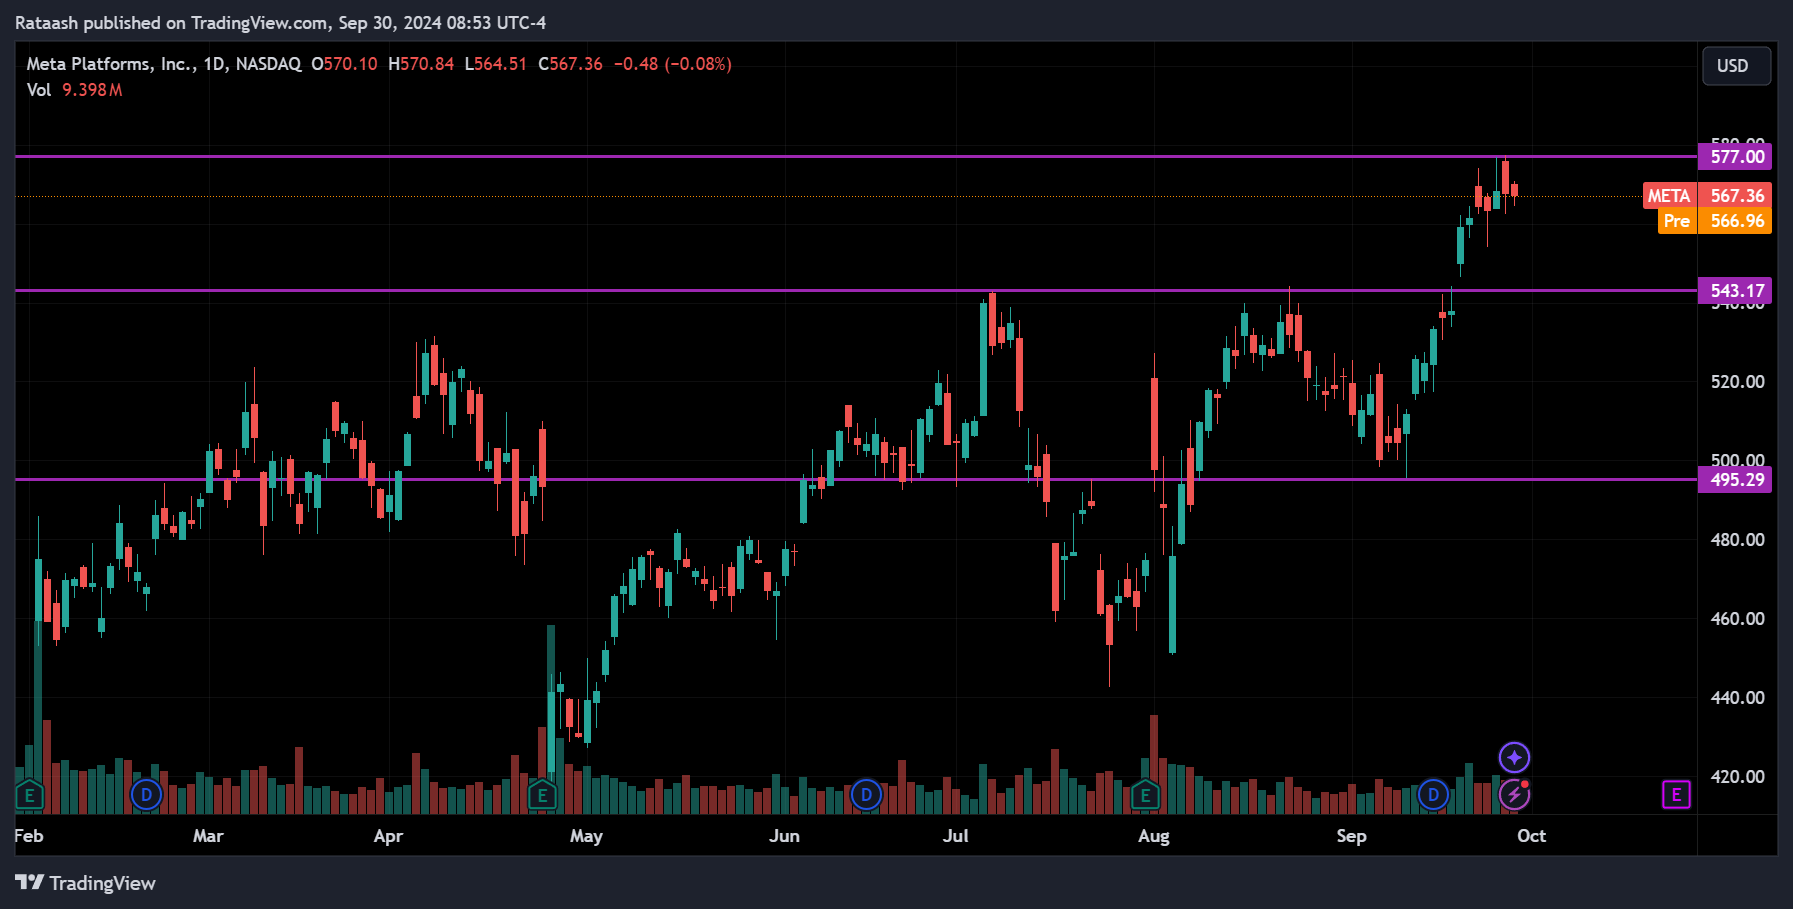
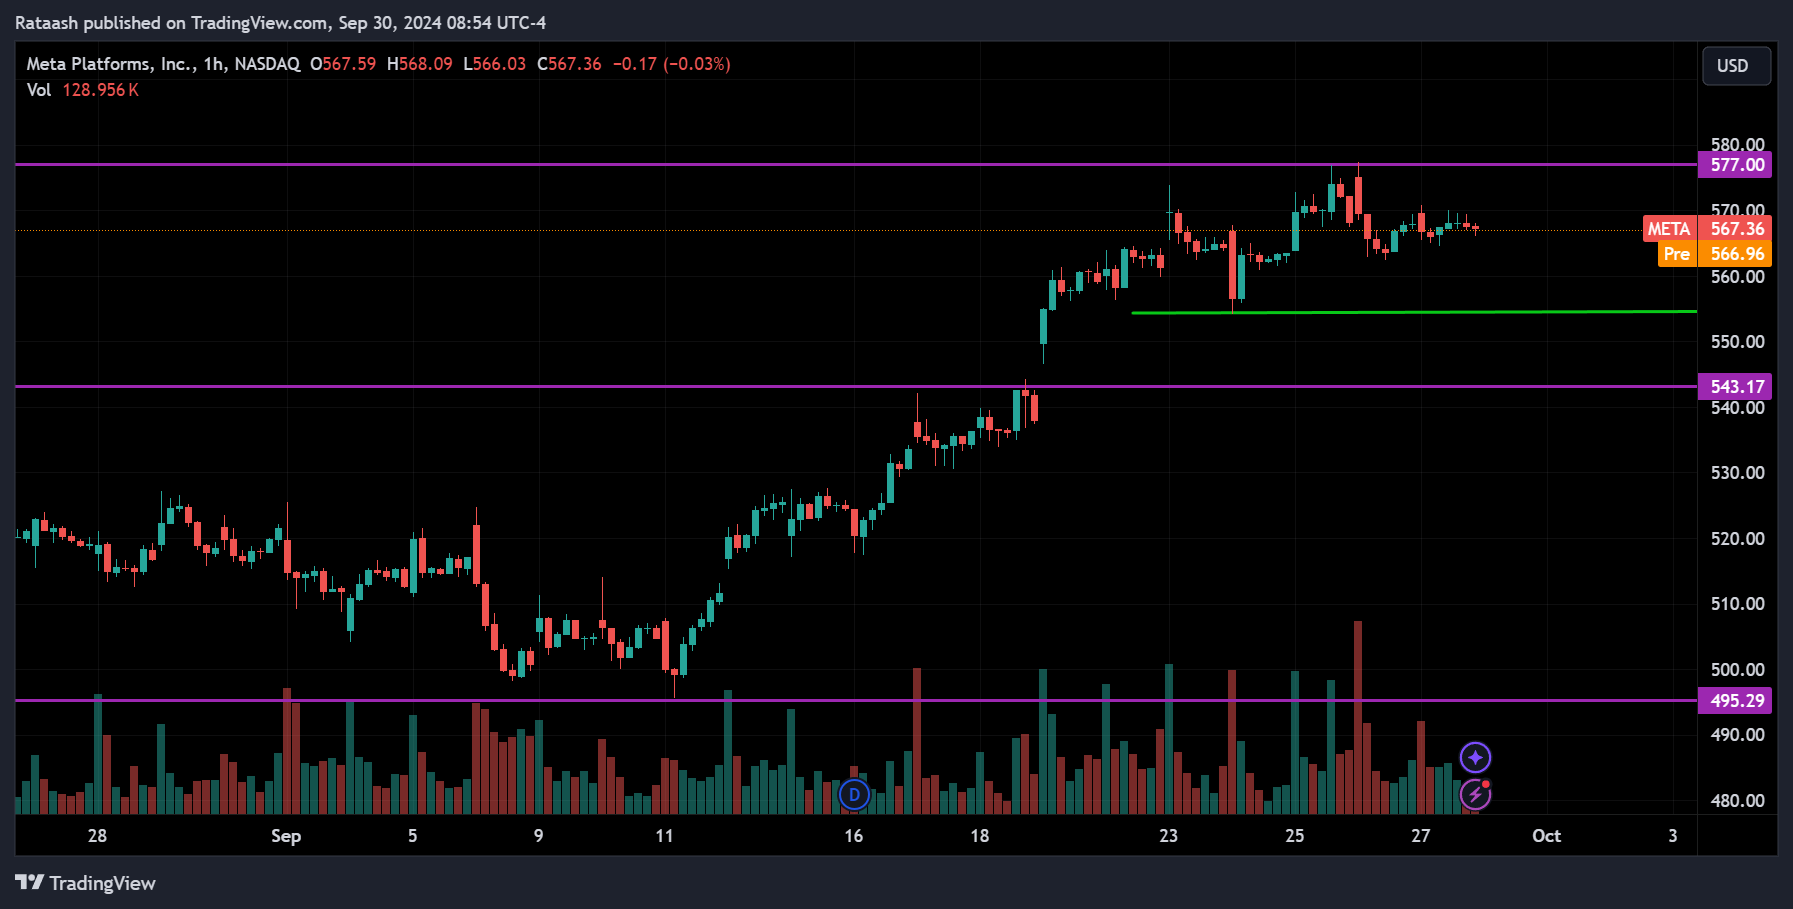
META is at all-time high levels, especially with the recent introduction of Meta Quest 3s and Llama 3.2, which is setting a strong foundation for an upcoming bull run. This makes META an important stock to watch, beyond just being a social media company.
Looking at the price action, the price is currently between the support at 555 and the resistance at 580. If the price breaks above the 580 resistance, we can expect the uptrend to continue. On the other hand, if the price breaks below the 555 support, it could drop to the major support around 543. If that level is also broken, the price could fall further toward 495. However, overall, the stock remains bullish.
NVDA – NVIDIA Corporation
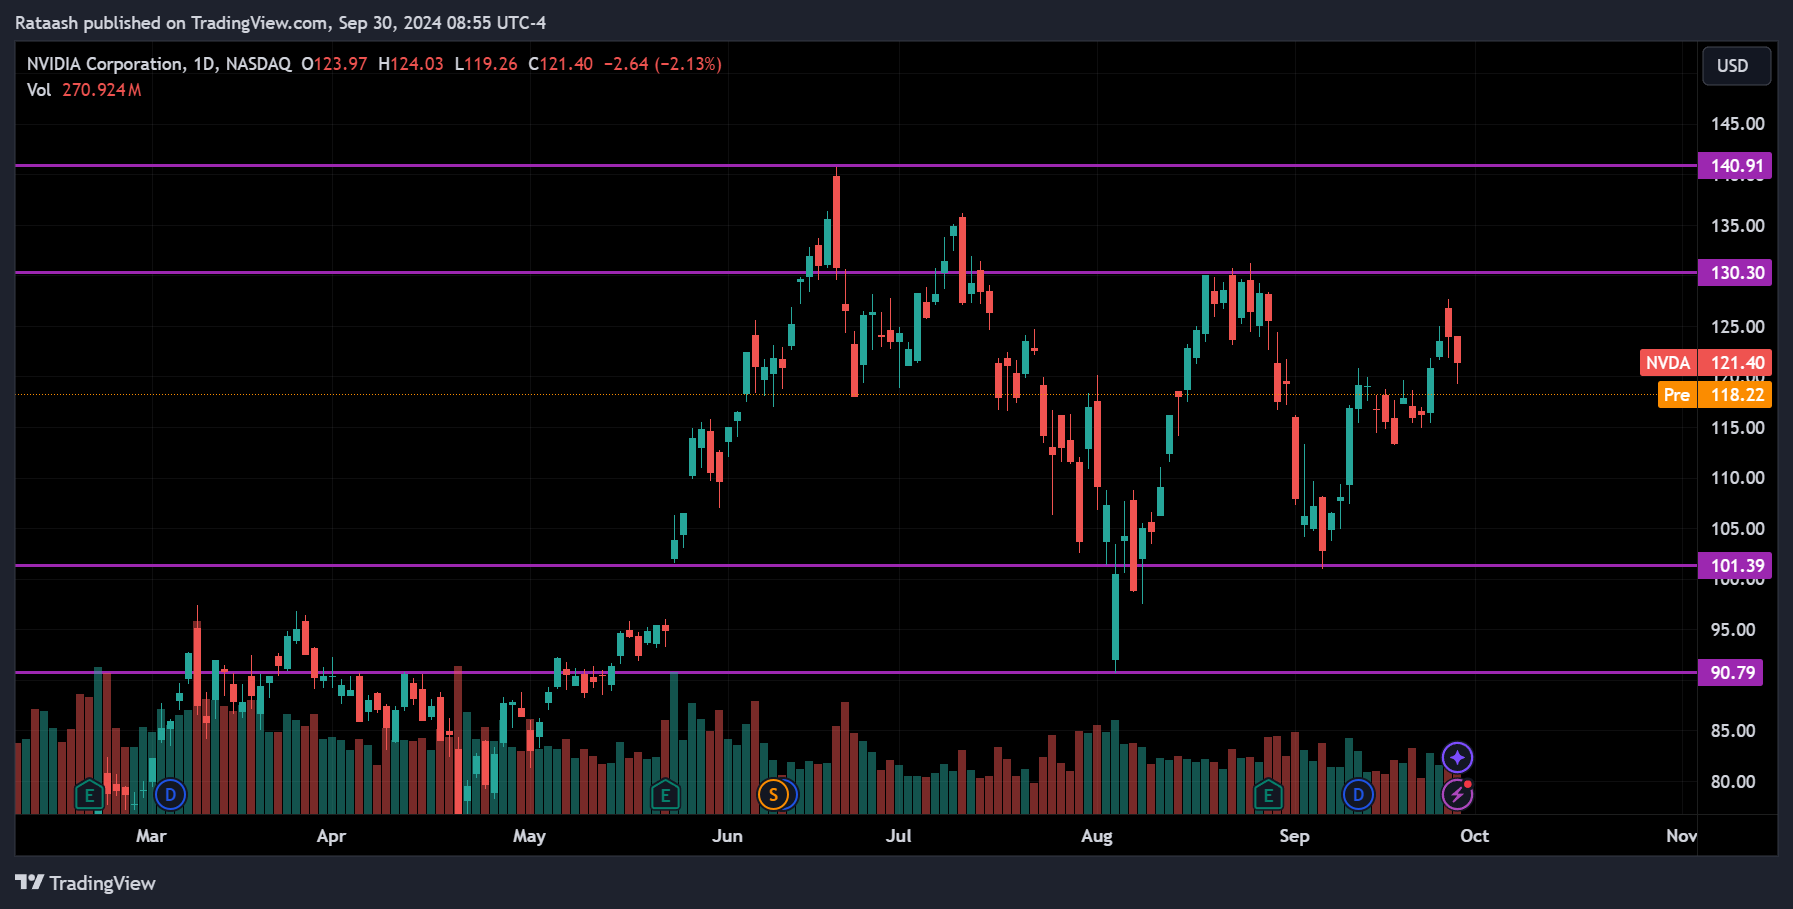
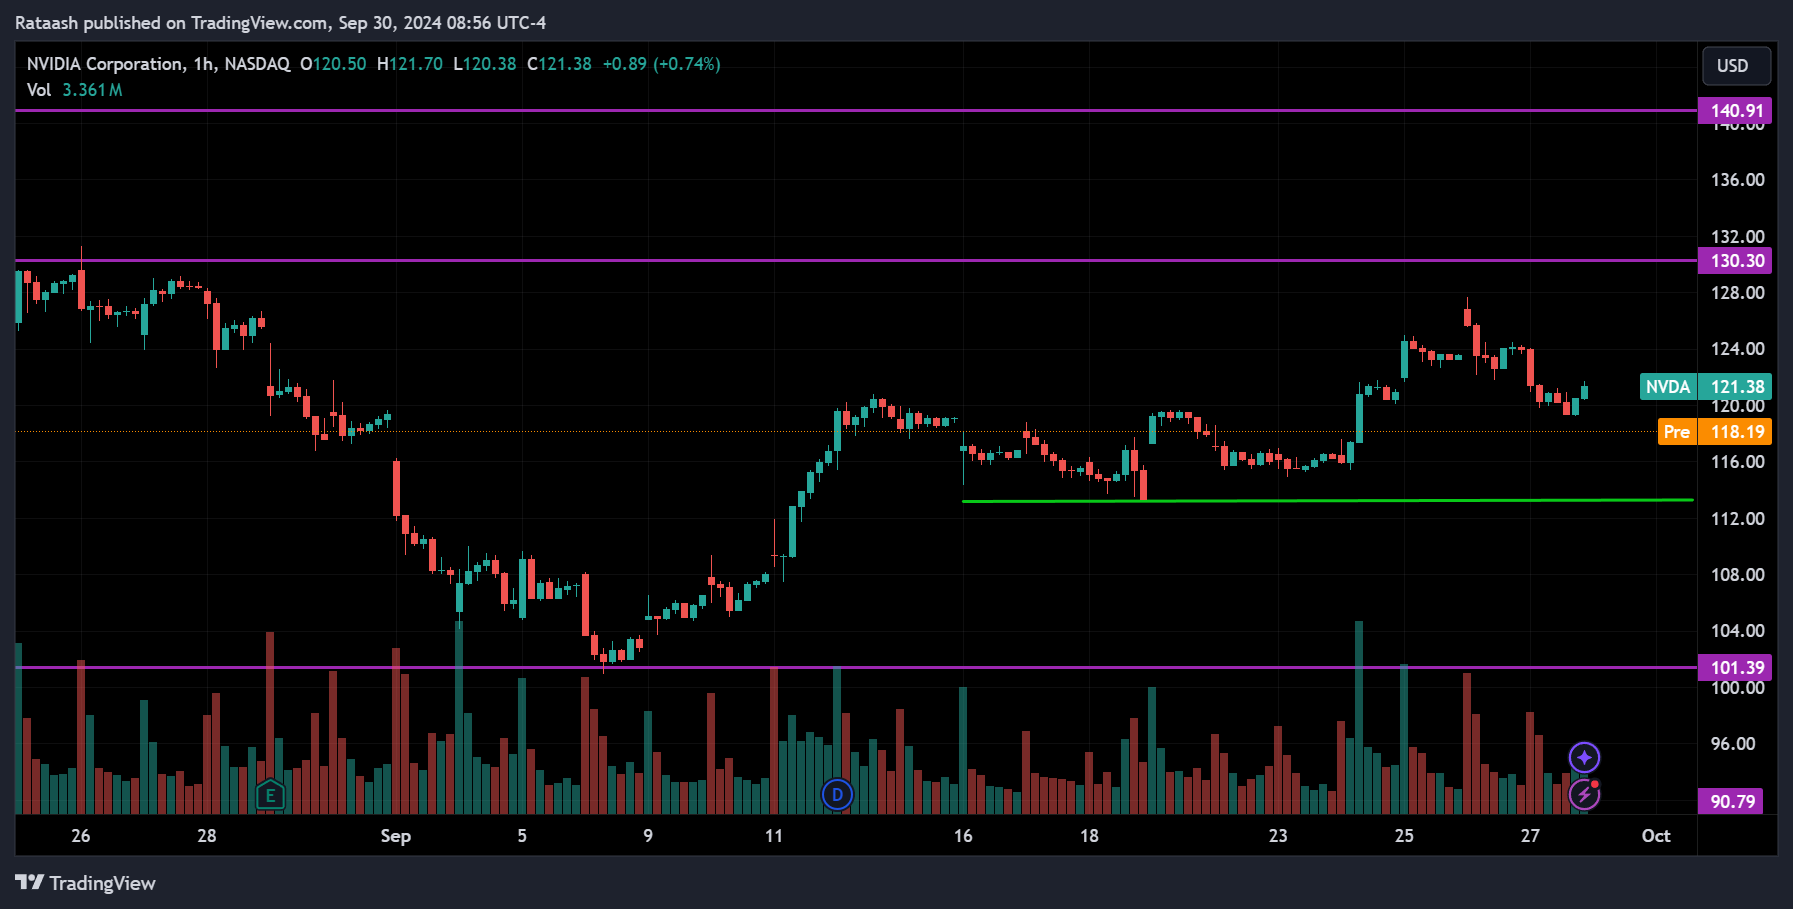
After a long bull run, NVDA has shown some signs of exhaustion but remains in an uptrend. The price is near the resistance at 130.30, and if it breaks above this level, we can expect the price to continue toward 140.90. However, if the price breaks below the support around 114, it could drop further to the next support level at 101.40.
AAPL – Apple Inc.
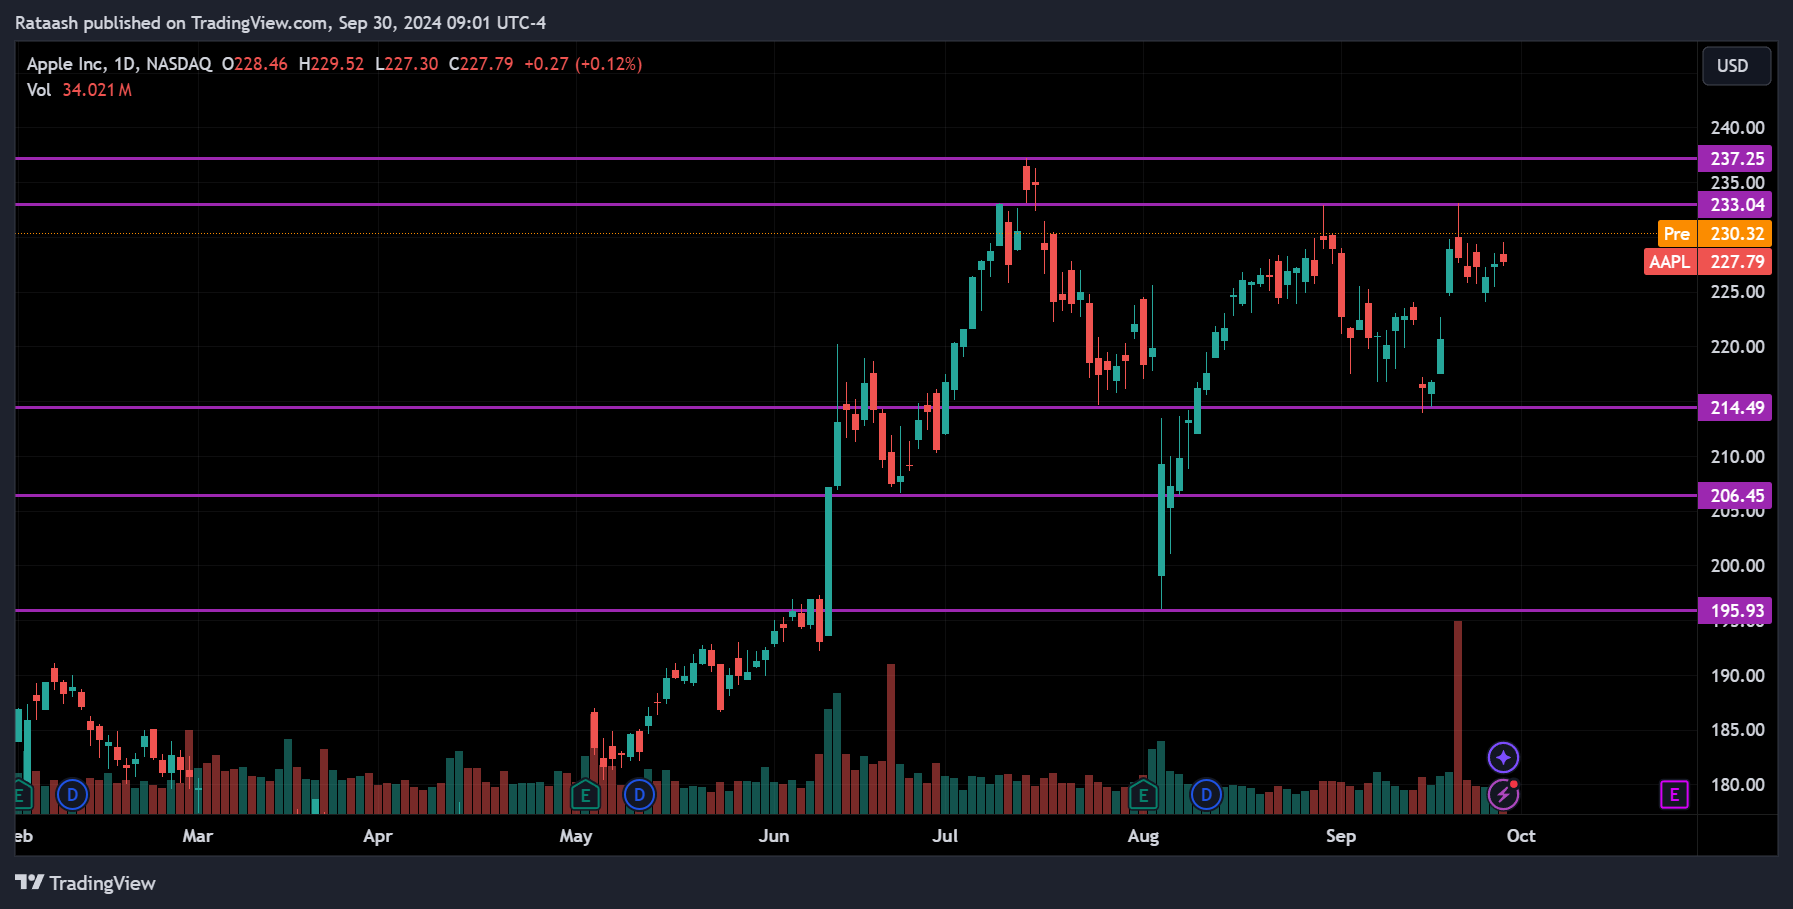
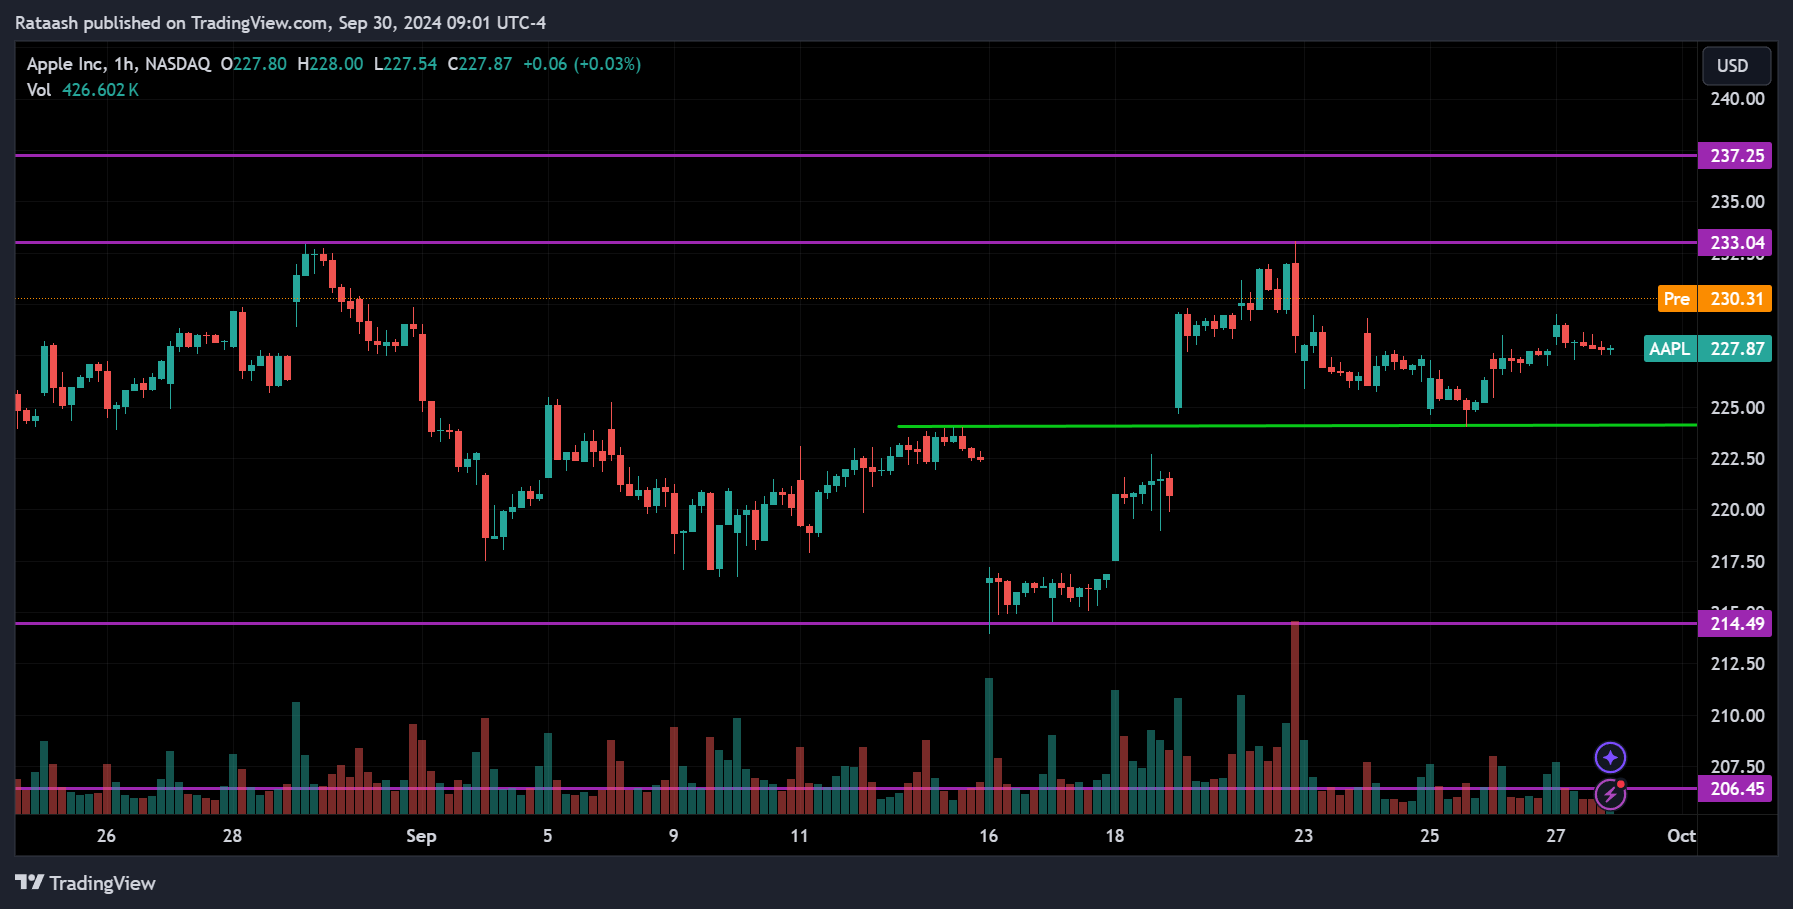
Apple recently introduced the iPhone 16, and although it’s not a major upgrade, the stock is still trending upward. On the 1-hour chart, the price is near the support at 225. If the price breaks below this level, we can expect it to drop to the major support around 214.50. However, since the stock is trending up, it’s more likely to break above the resistance at 233 and continue rising toward the 237.25 level.
MSFT – Microsoft Corporation
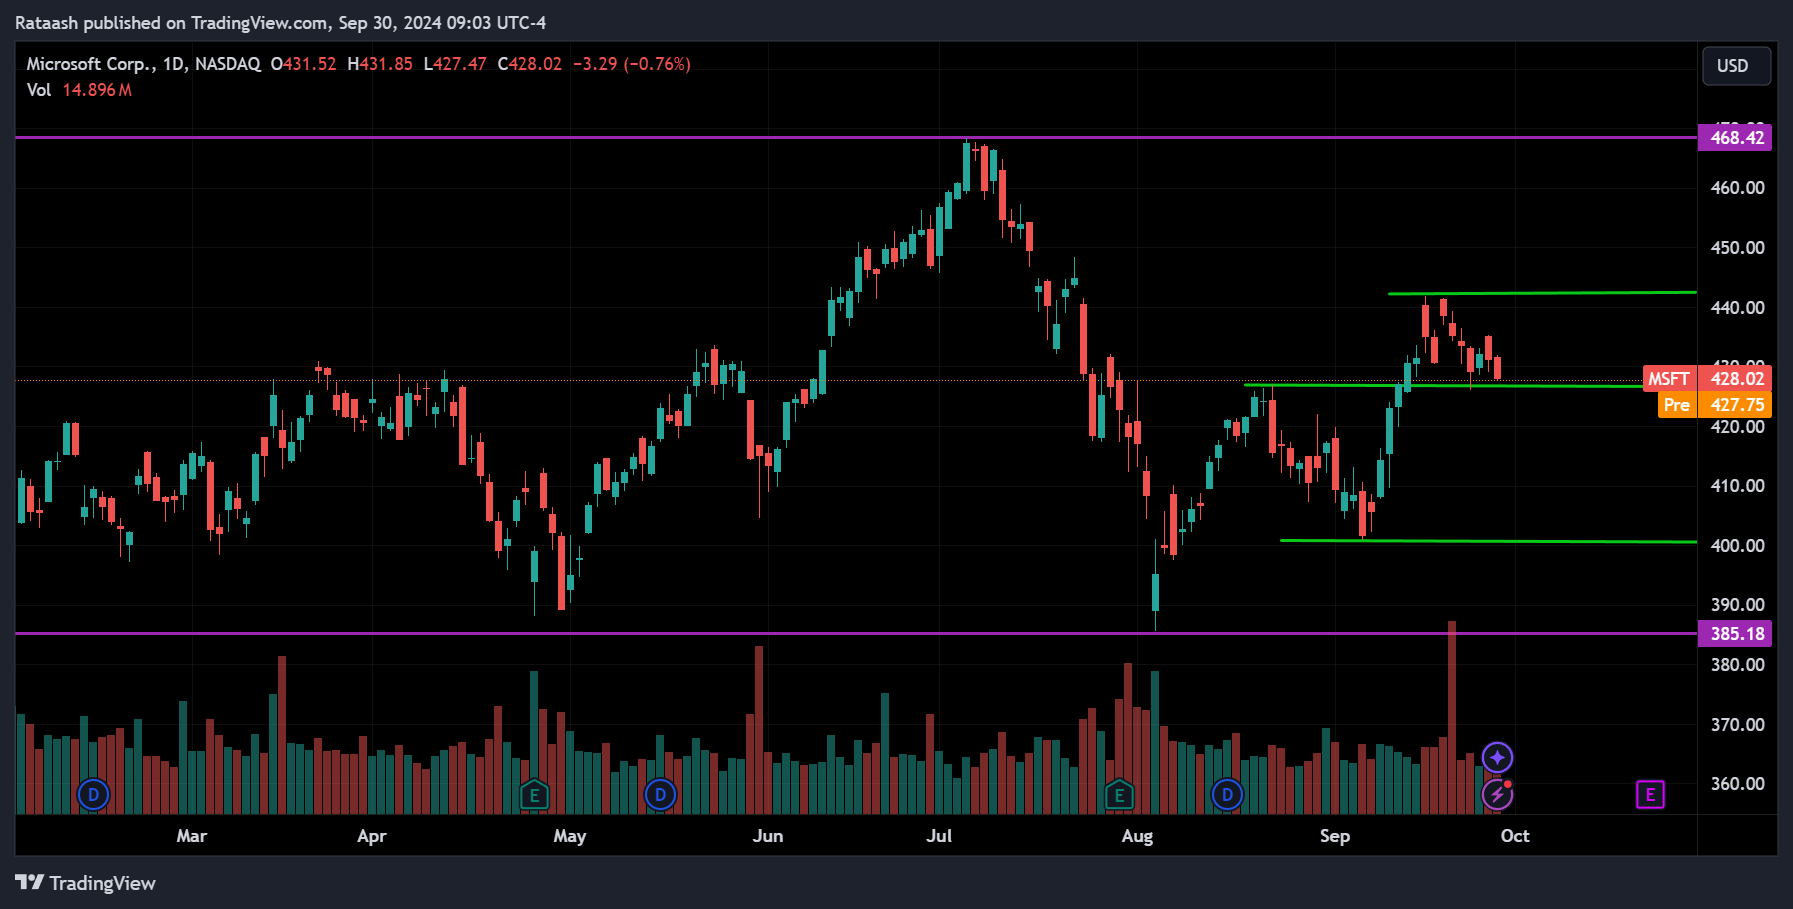
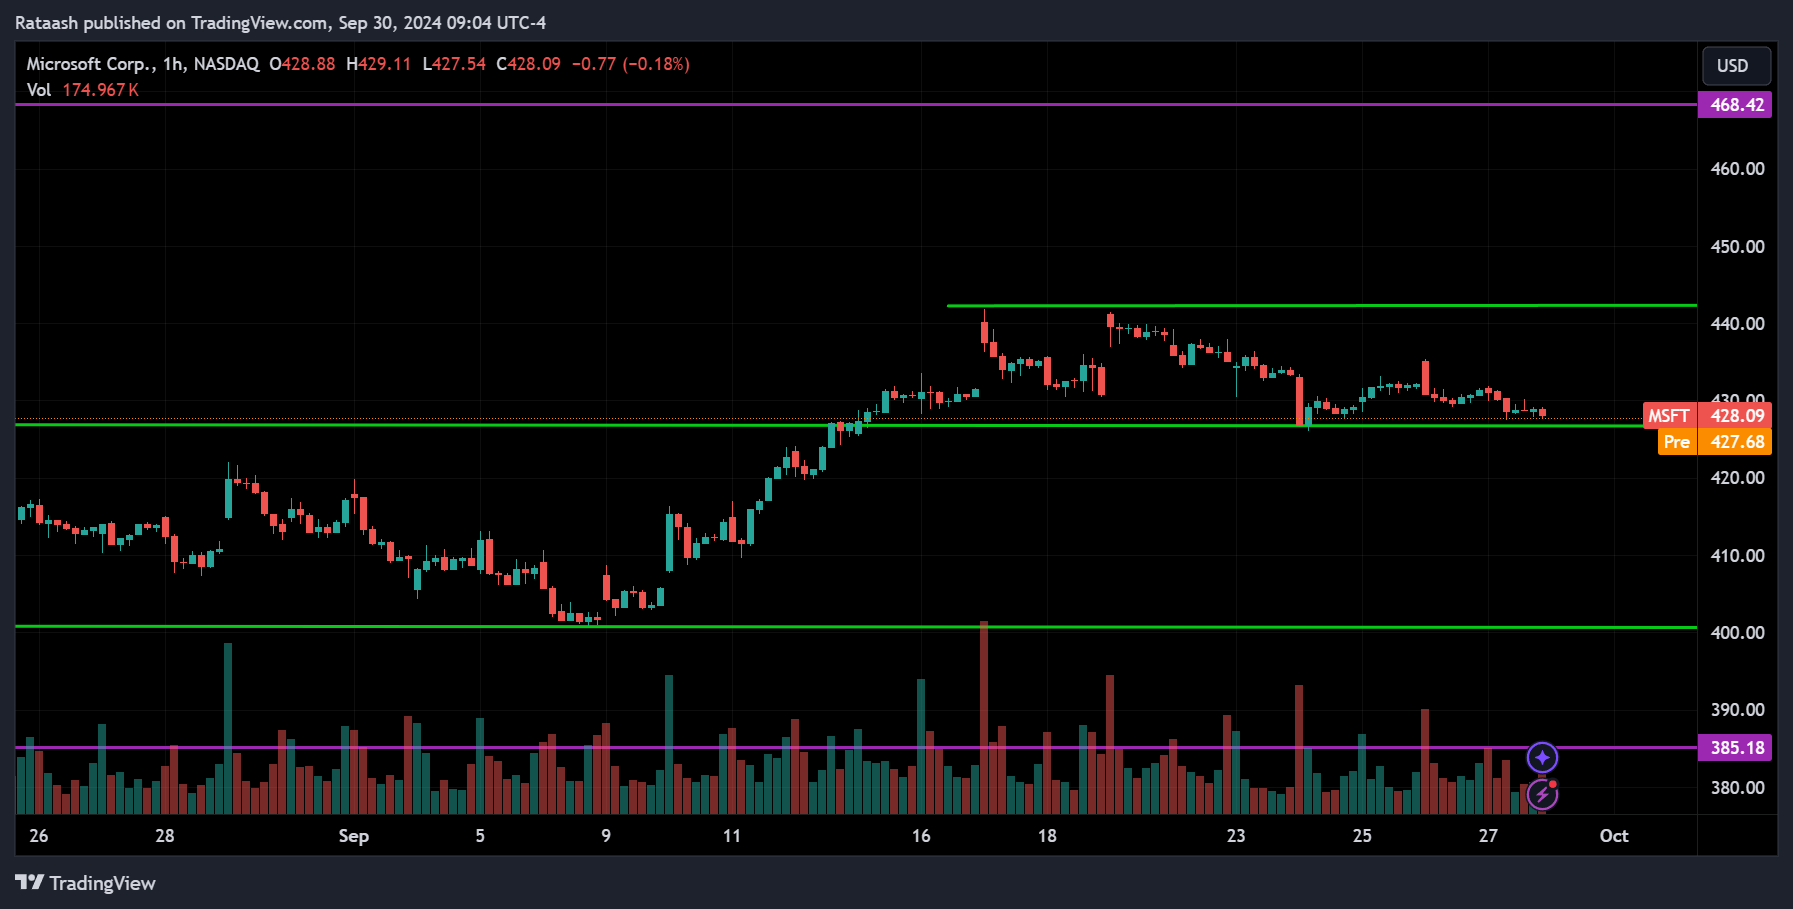
Microsoft is overall trending up, but on the 1-hour chart, the price is currently consolidating between the support at 428 and the resistance at 440. If the price breaks below the 428 support, we can expect it to drop toward the 400 level. However, if the price breaks above the 440 resistance, we can expect it to continue upward toward the 468.40 range.
ORCL – Oracle Corporation
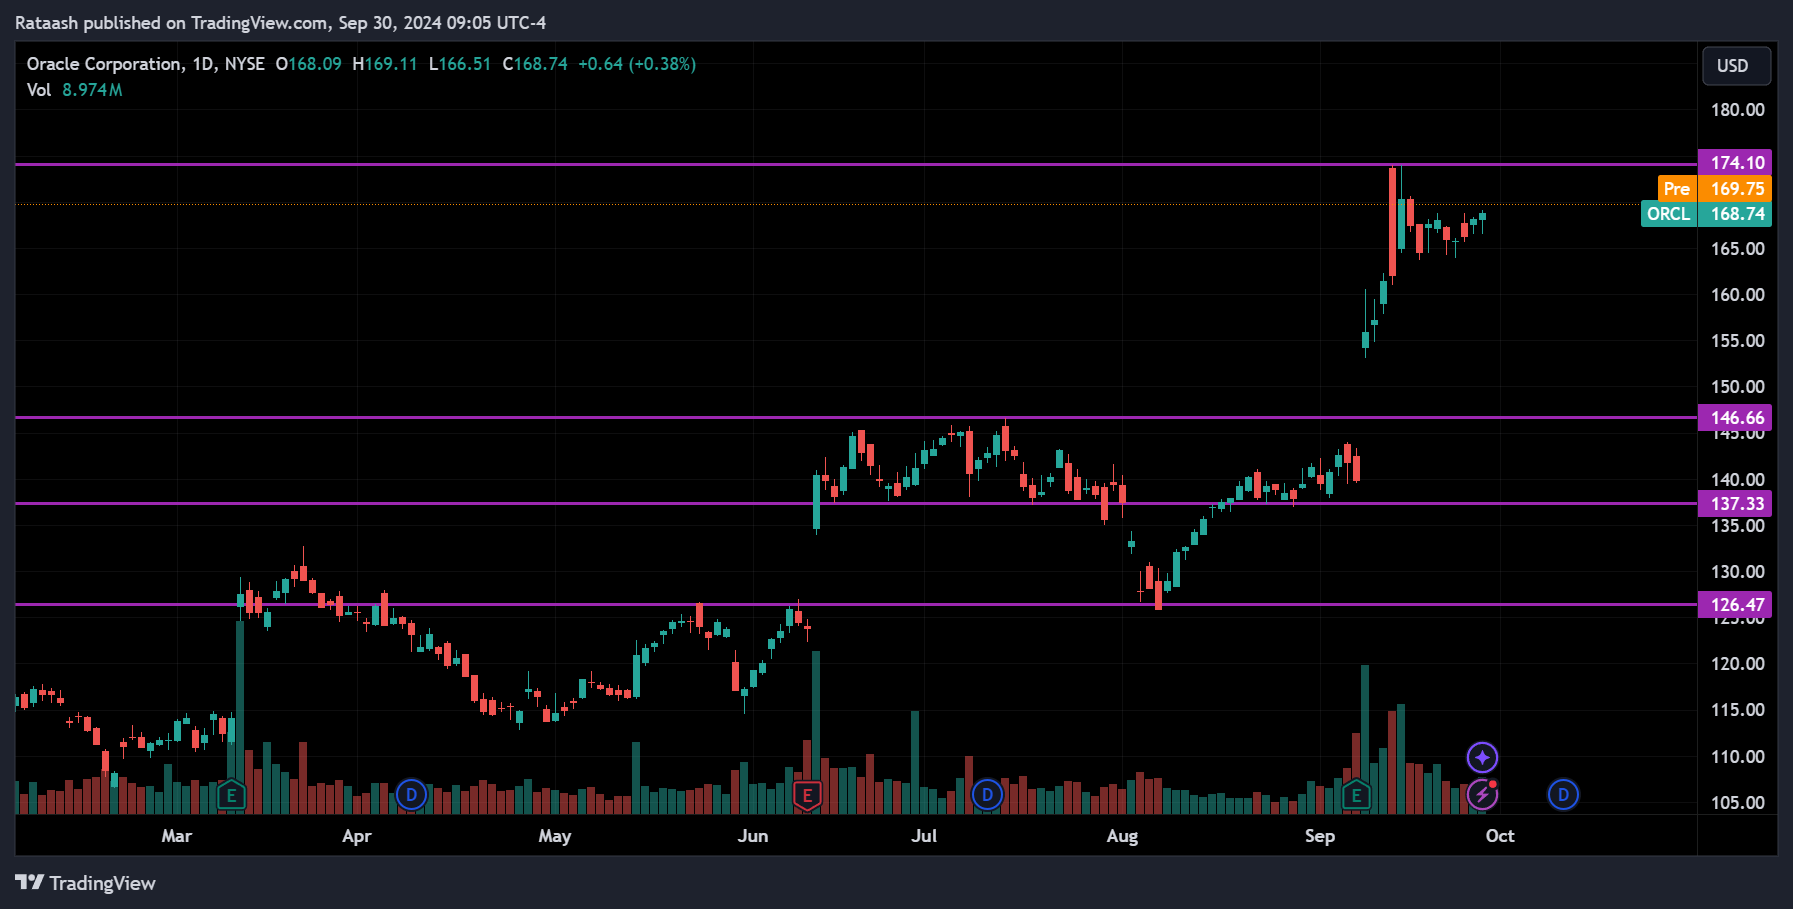
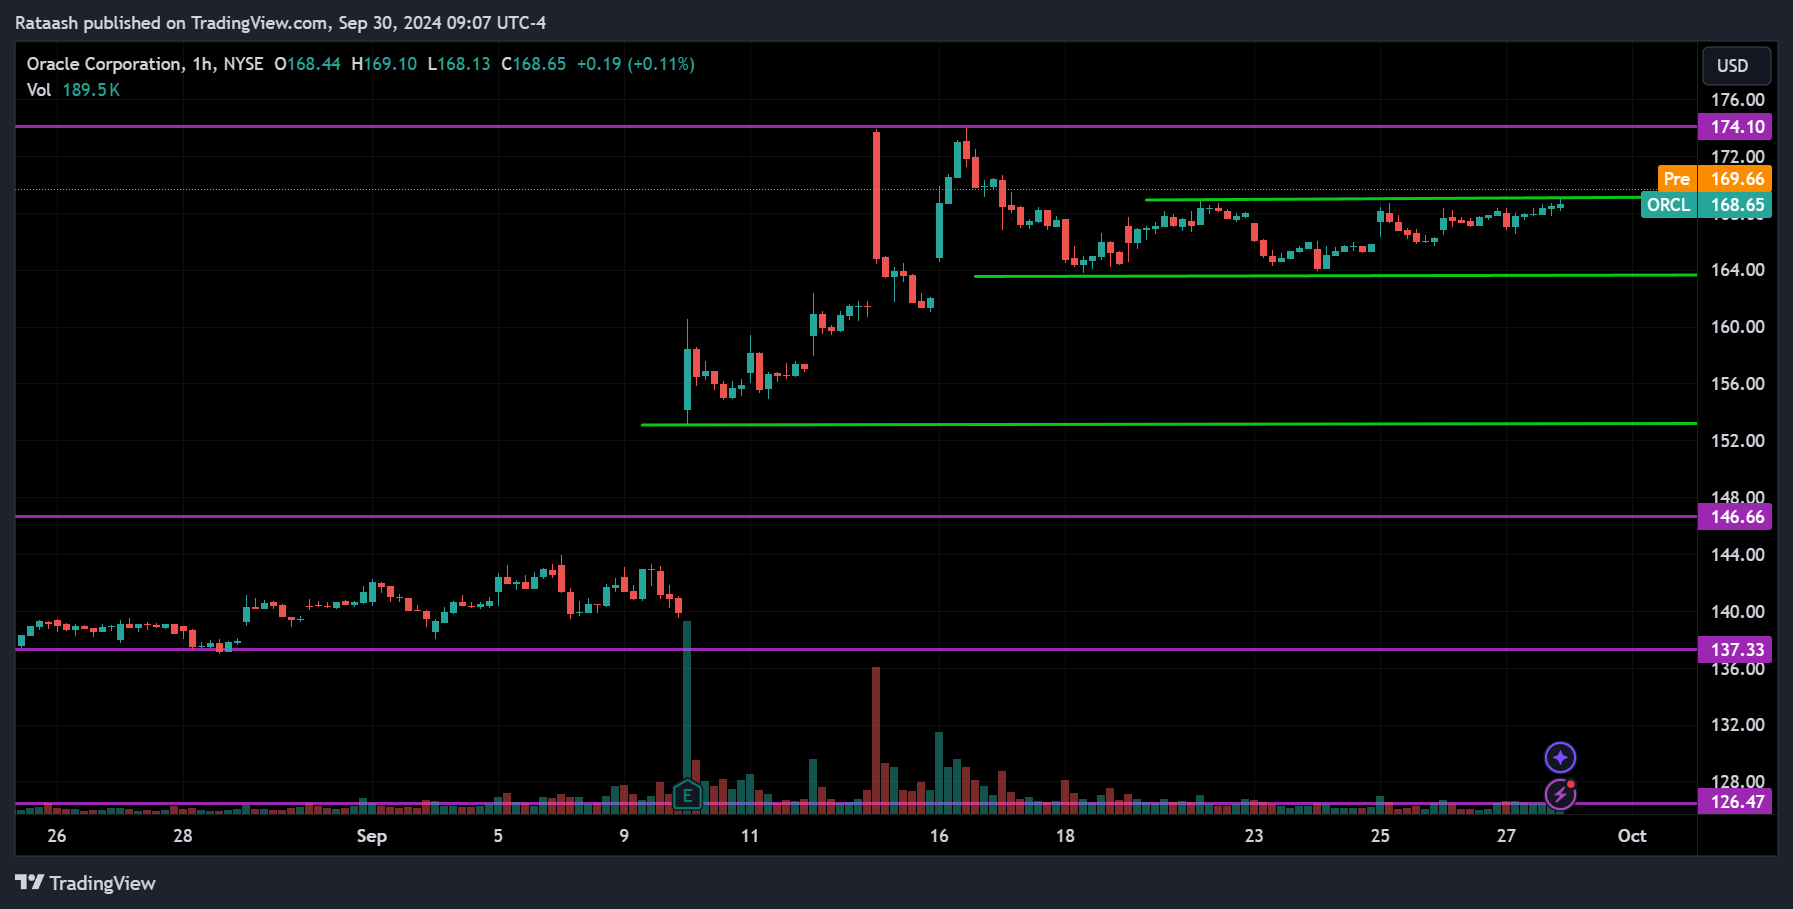
After beating earnings estimates, ORCL reached an all-time high of 174.10. Looking at the 1-hour chart, the price is currently consolidating. If the price breaks above the resistance, we can expect it to continue toward 174.10, and if that level is broken, the price could keep rising. However, if the price breaks below the support at 164, we can expect it to drop toward the 152 range.
TSLA – Tesla, Inc.
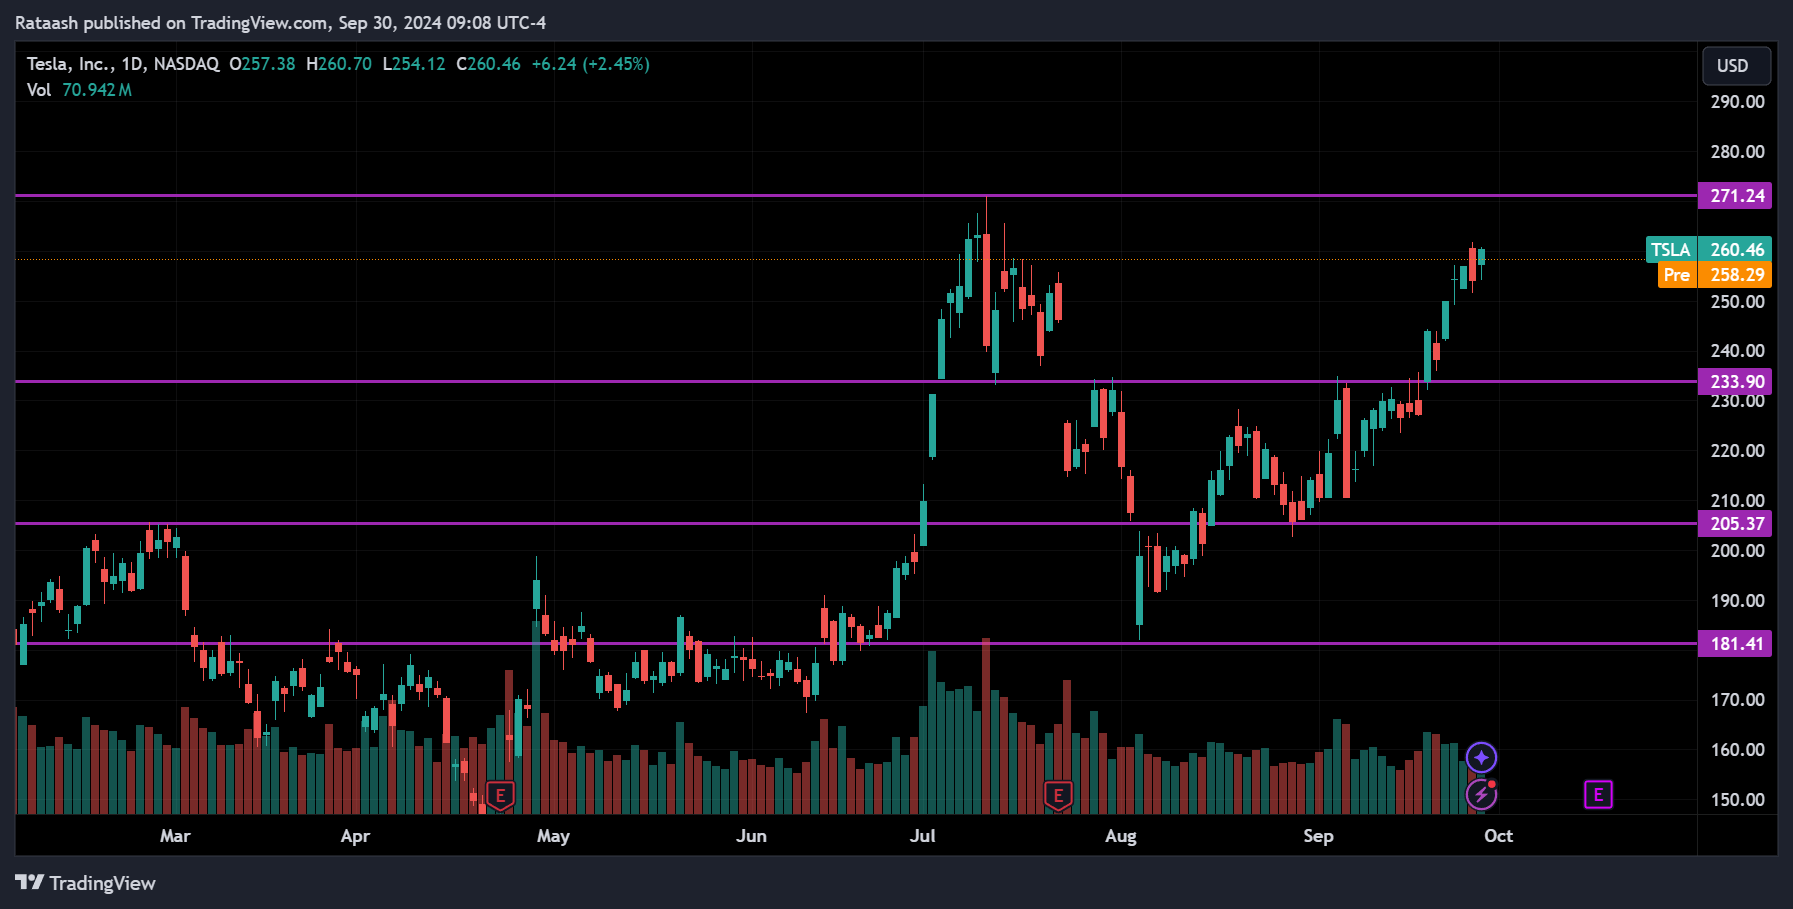
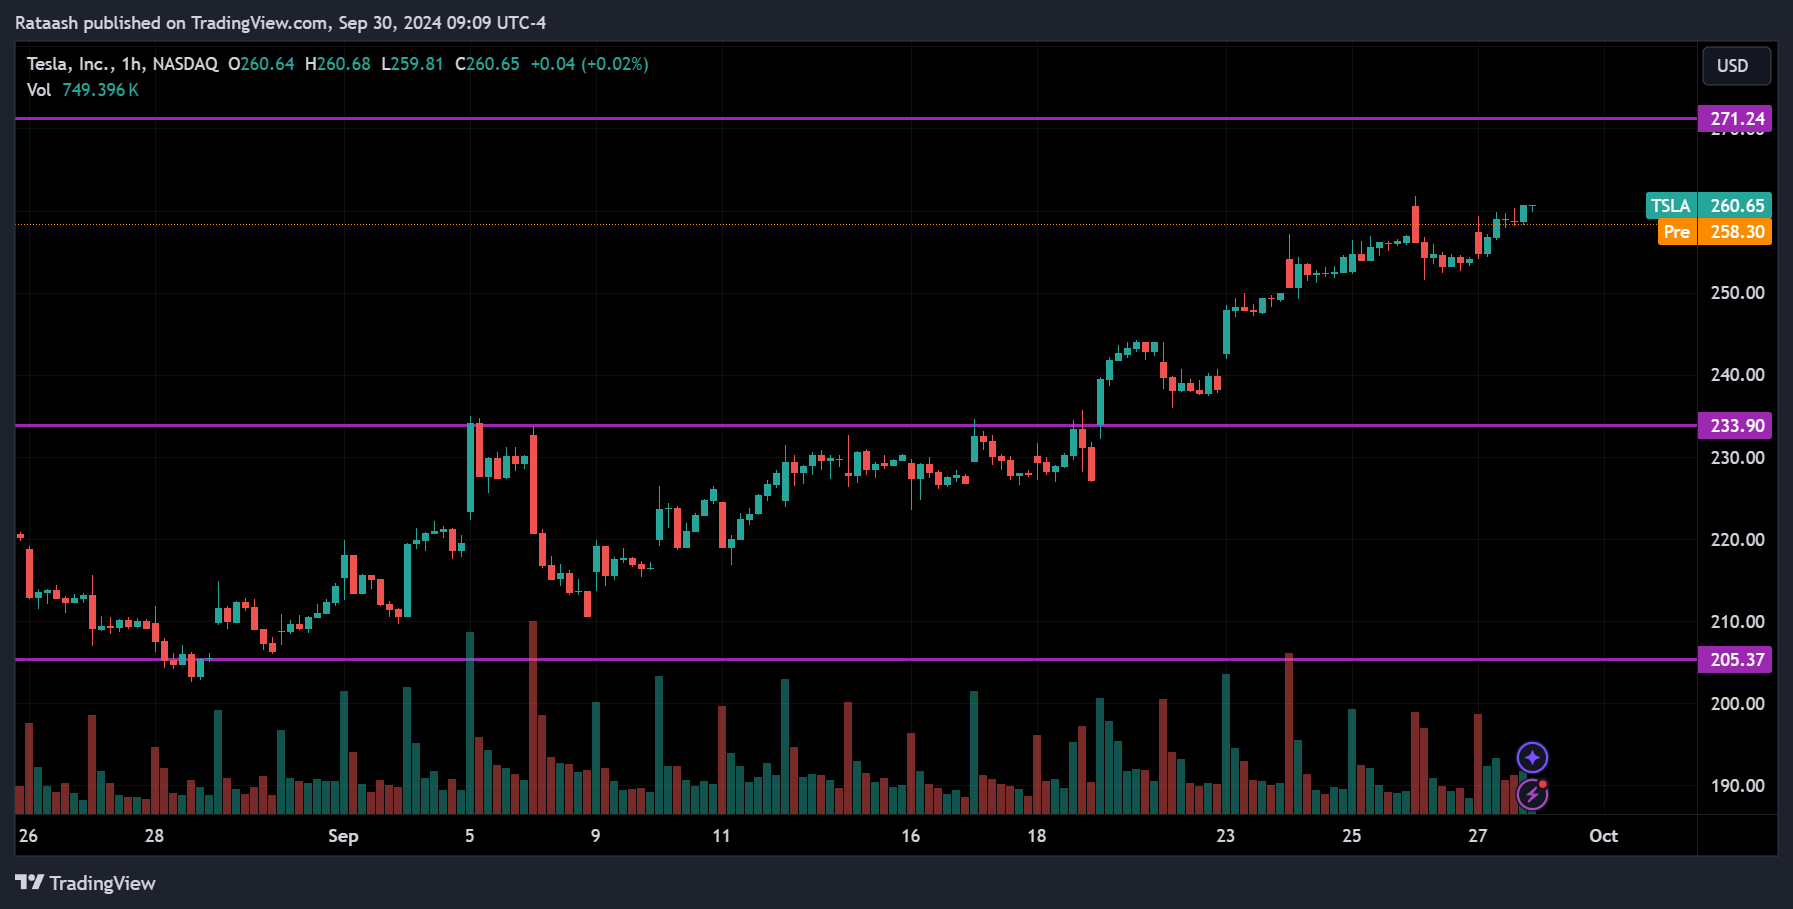
Looking at Tesla, it’s also trending up, with the next resistance around the 271.24 range. We can expect the price to either reach this level and pull back or break above the resistance and continue rising. If the price pulls back, we could see it drop toward the 233.90 range.
NIO – NIO Inc.
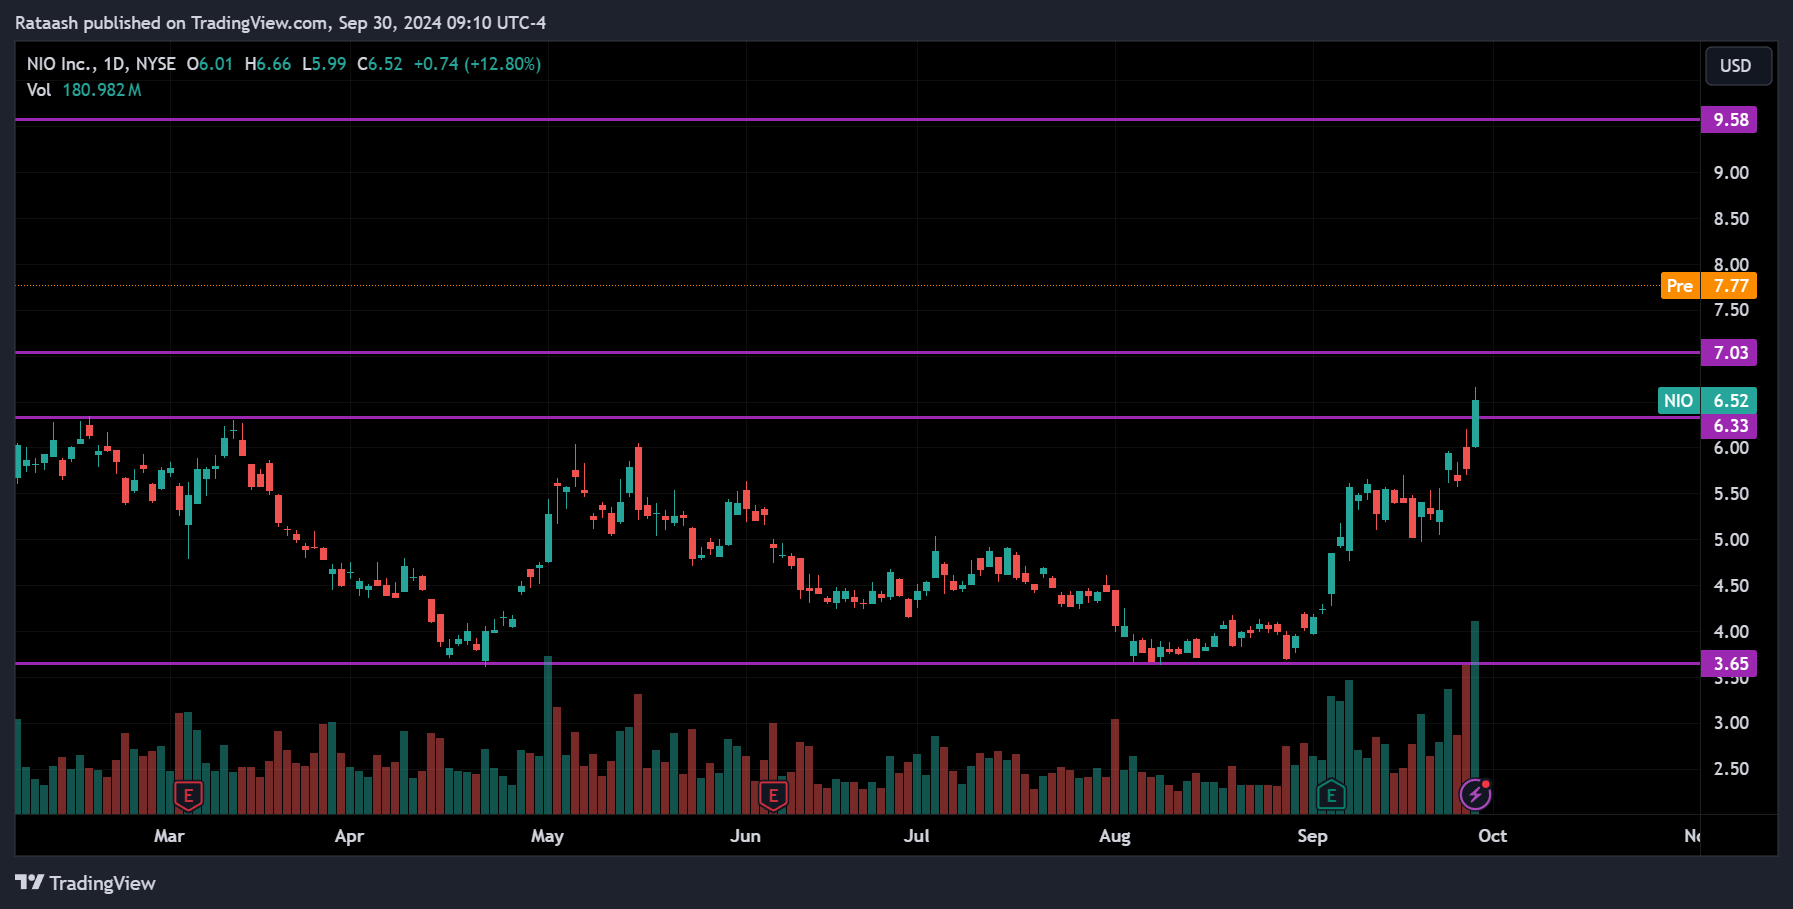
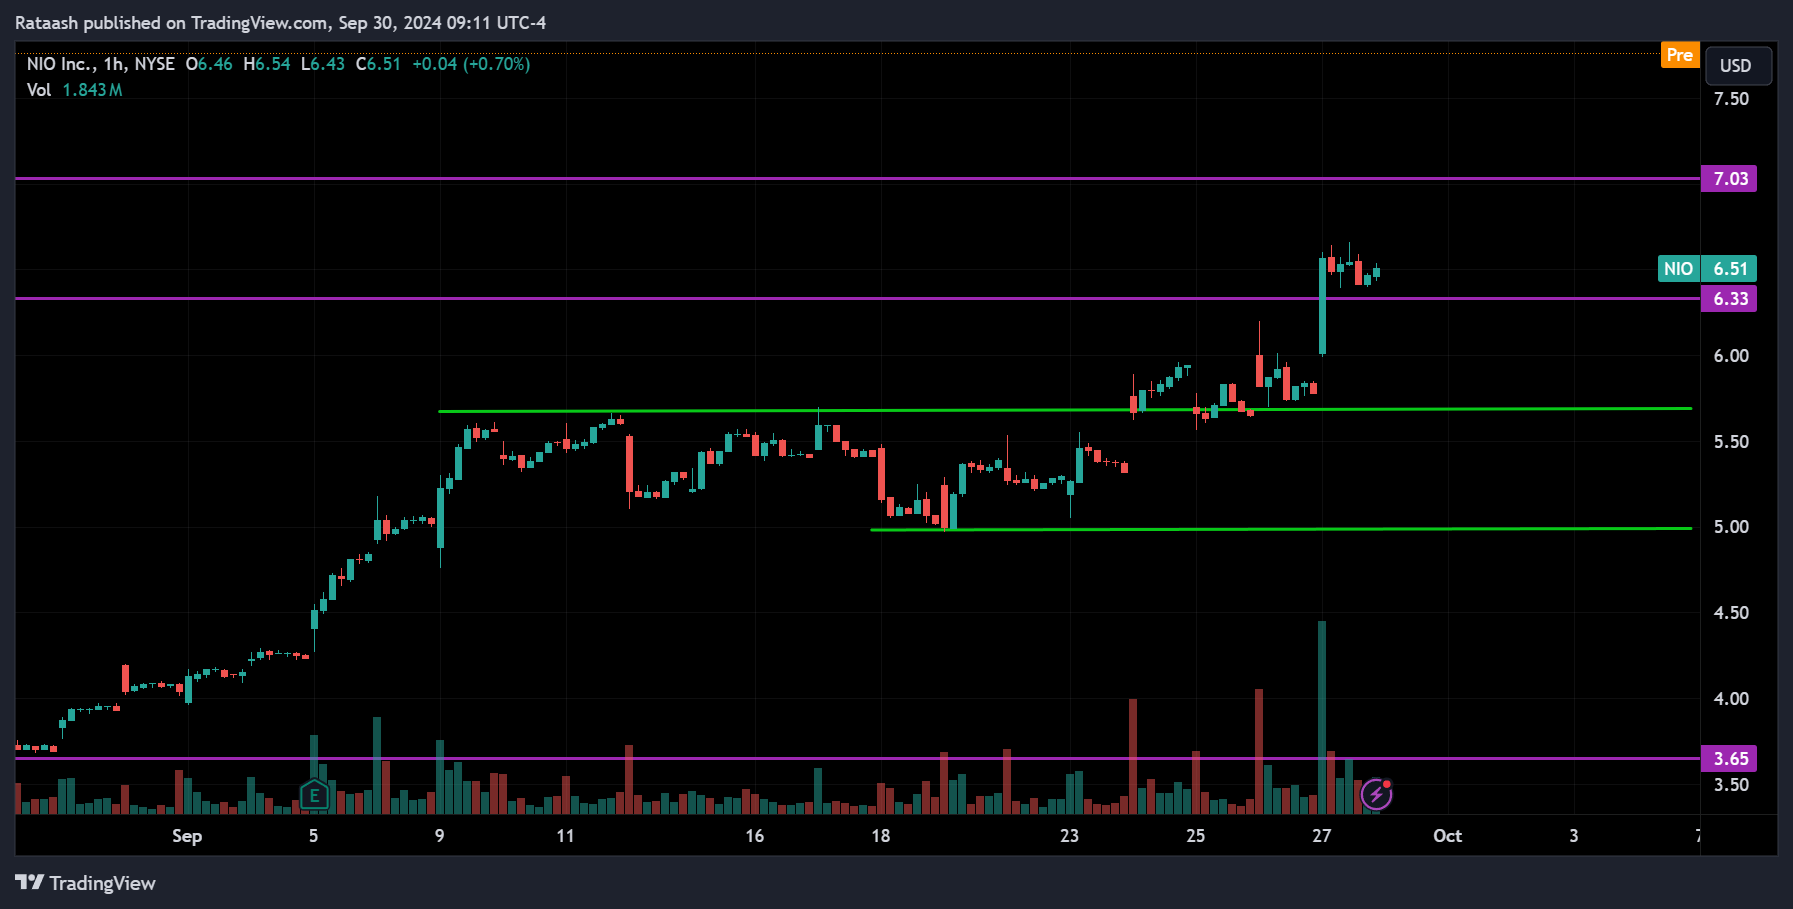
This Chinese EV maker is gaining a lot of attention in the stock market. The price is overall consolidating, but on the 1-hour chart, it shows signs of trending upward. In pre-market trading, it gapped up, and as more people take notice, the stock is likely to become more volatile. It’s definitely something to keep an eye on in the coming days.
INTC – Intel Corporation
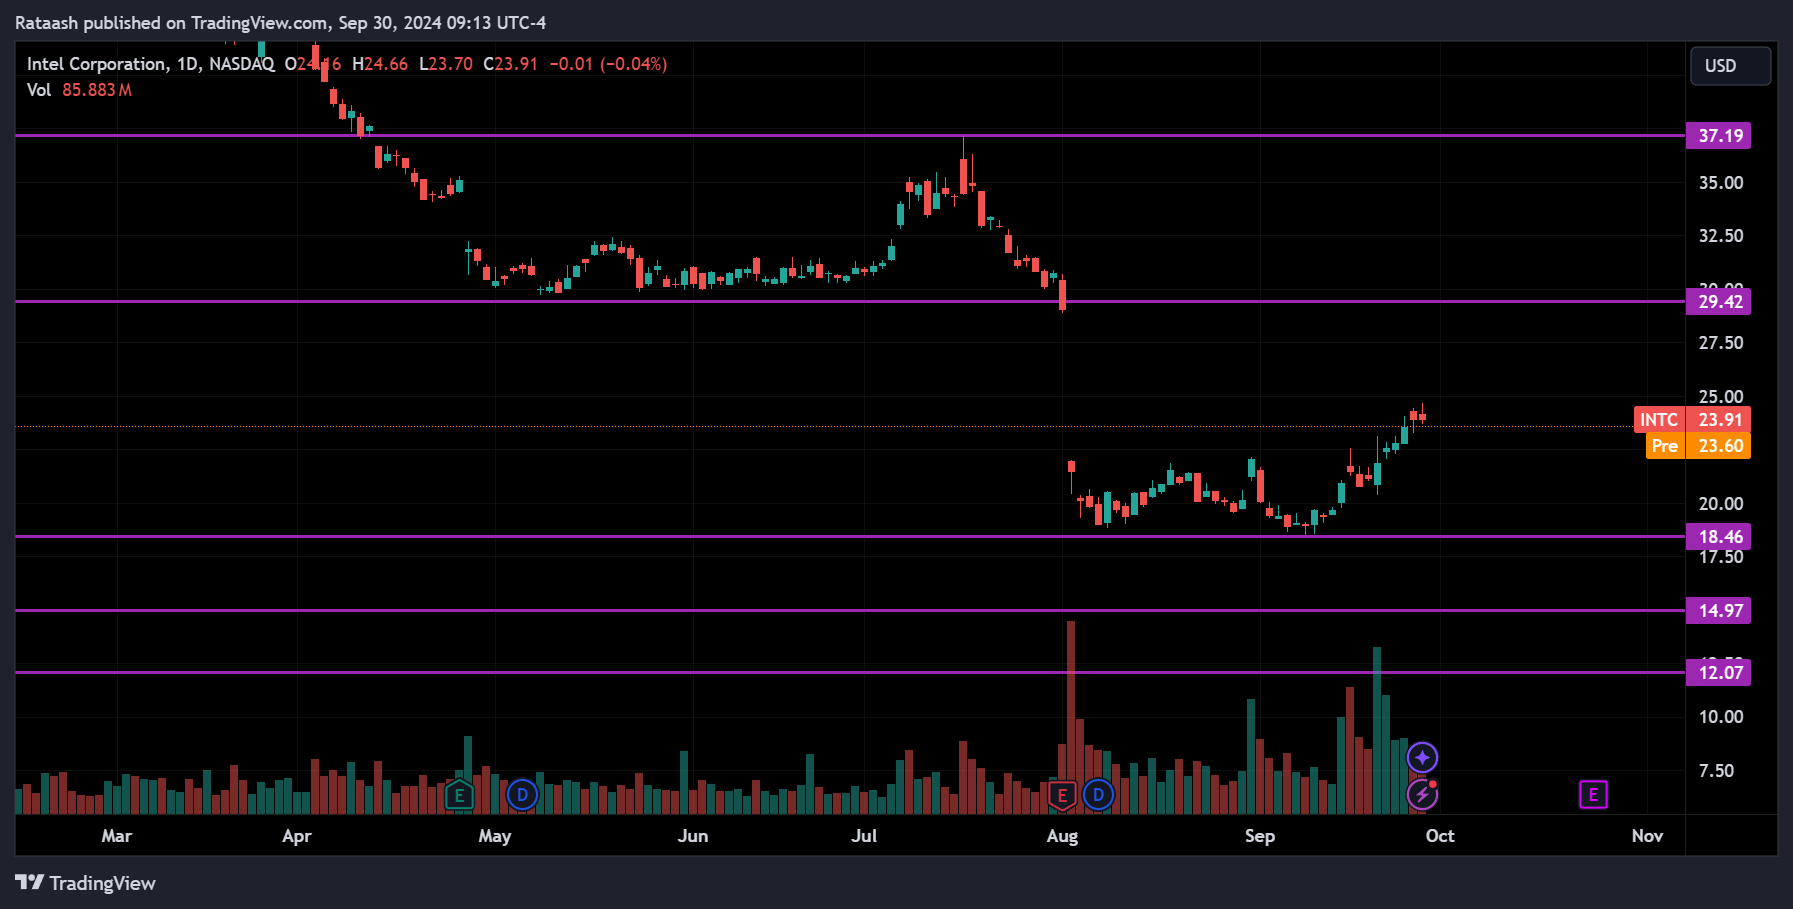
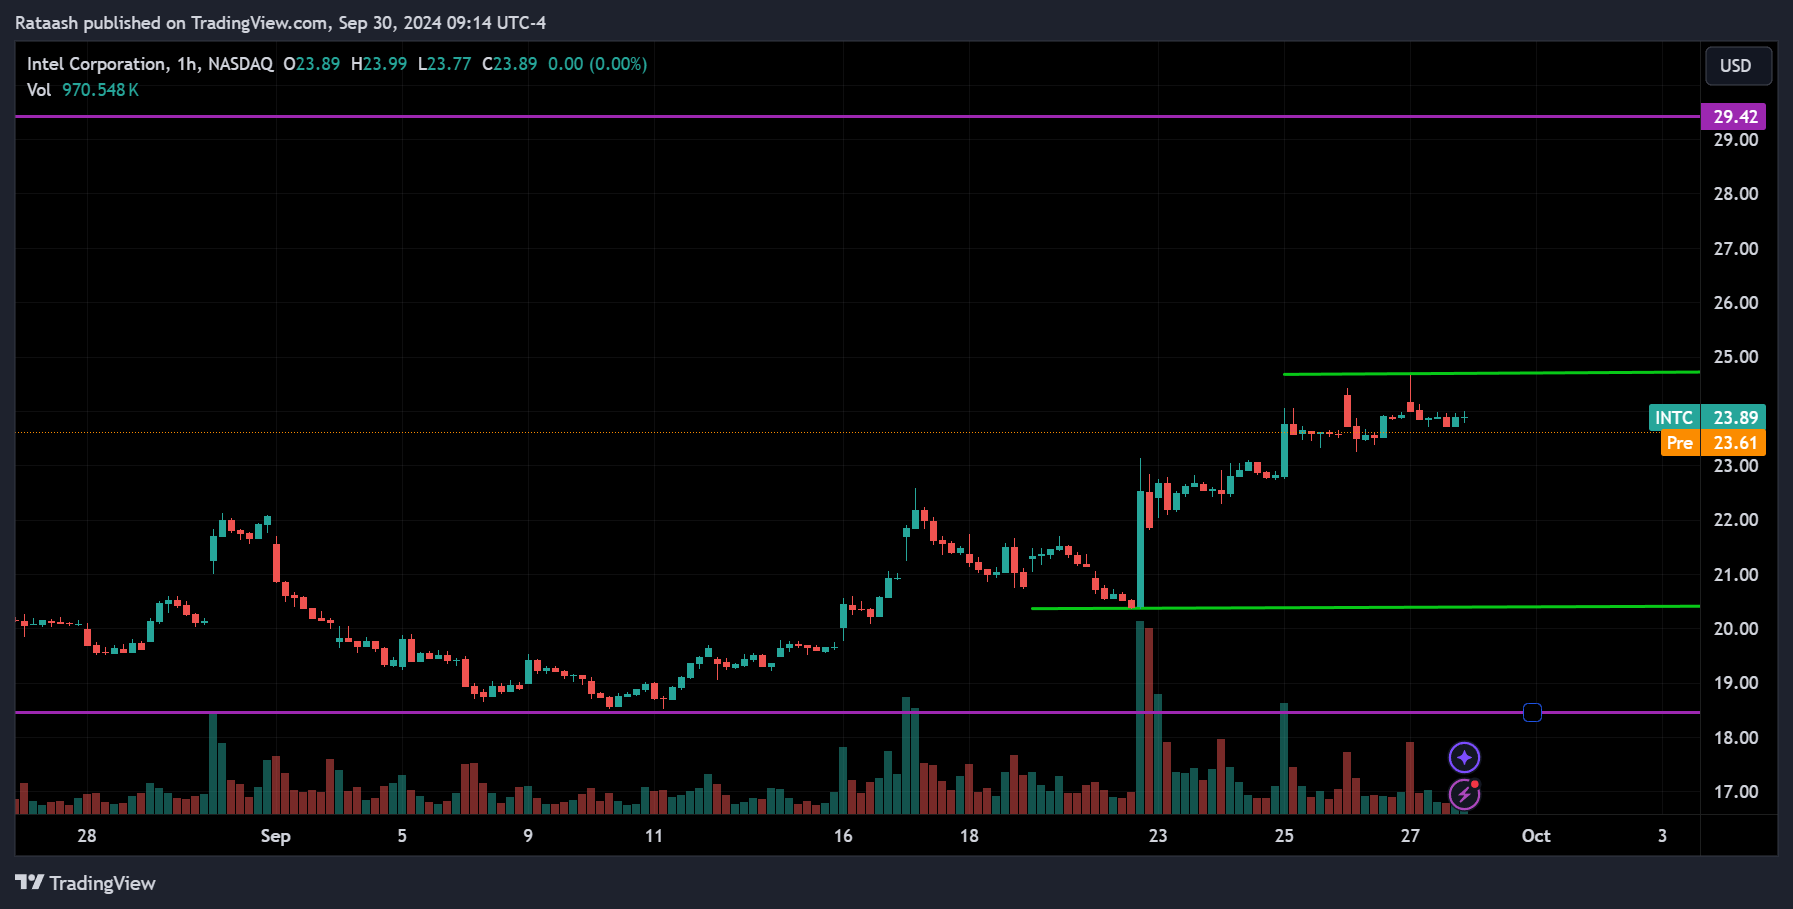
Finally, looking at Intel, the price is overall trending down due to the lack of major new product releases to attract buyers. Based on the price action, the stock has started moving up from the support at 18.50 and is now just below the 25 resistance. If the price breaks above this resistance, we can expect it to rise toward the 29.40 range. However, if the price drops from the 25 resistance, it could fall to 20.50, and if that level is also broken, it may drop further to 18.50.
Conclusion
Subscribe to our Telegram channel to get instant updates on new articles.
Please provide your feedback on how we can improve this article. Thank you!
We discussed these sectors and markets because when the entire market or sector goes through certain movements, most of the stocks within that market will also experience similar movements. So, by understanding what the market is doing, you can conduct your own analysis on specific stocks.
These analyses are here to help you understand how to analyze the market. They’re not about giving buy or sell signals. It’s simply about observing price action market behavior. I don’t recommend when to buy or sell because trading doesn’t work that way. You need a strategy to guide your decisions about when to enter or exit positions. That’s the key to making consistent profits in the financial markets over time.
Disclaimer
The information provided in this market analysis is for educational and informational purposes only. It should not be construed as financial advice or a recommendation to buy, sell, or hold any securities or investments.
All investments involve risk, and past performance is not indicative of future results. The analysis provided may not be suitable for all investors and should be used at their own discretion.
Readers are encouraged to conduct their own research.
Trading and investing in financial markets carry inherent risks, including the risk of losing invested capital. It is important to carefully consider your investment objectives, risk tolerance, and financial situation before making any investment decisions.
GOOD LUCK✌!!!