![Forex Price Action Forecast [2024.07.15]: Key Support and Resistance Levels and Trends to Watch - USDJPY Entering Bearish?
xlearnonline.com](https://xlearnonline.com/wp-content/uploads/2024/07/Forex-Analysis-1-2.jpg)
Hi, welcome to xlearn’s daily forex market analysis for day traders, this analysis is all about price action trading.
Before we jump into actual analysis, lets take a look at major economic events that could affect the market.
Key Economic Events Today
These events encompass important global news, macroeconomic reports, and economic indicators. For more details, you can check the forex factory.
8:30 ET: Empire State Manufacturing Index Release
This report shows how manufacturers in New York are feeling about the economy. It’s important because their reactions to the market can hint at future trends in spending, hiring, and investment.
12:00 ET: Fed Chair Powell Speaks
As the leader of the central bank, Powell’s words have a big impact on short-term interest rates and the value of the nation’s currency.
EURUSD:
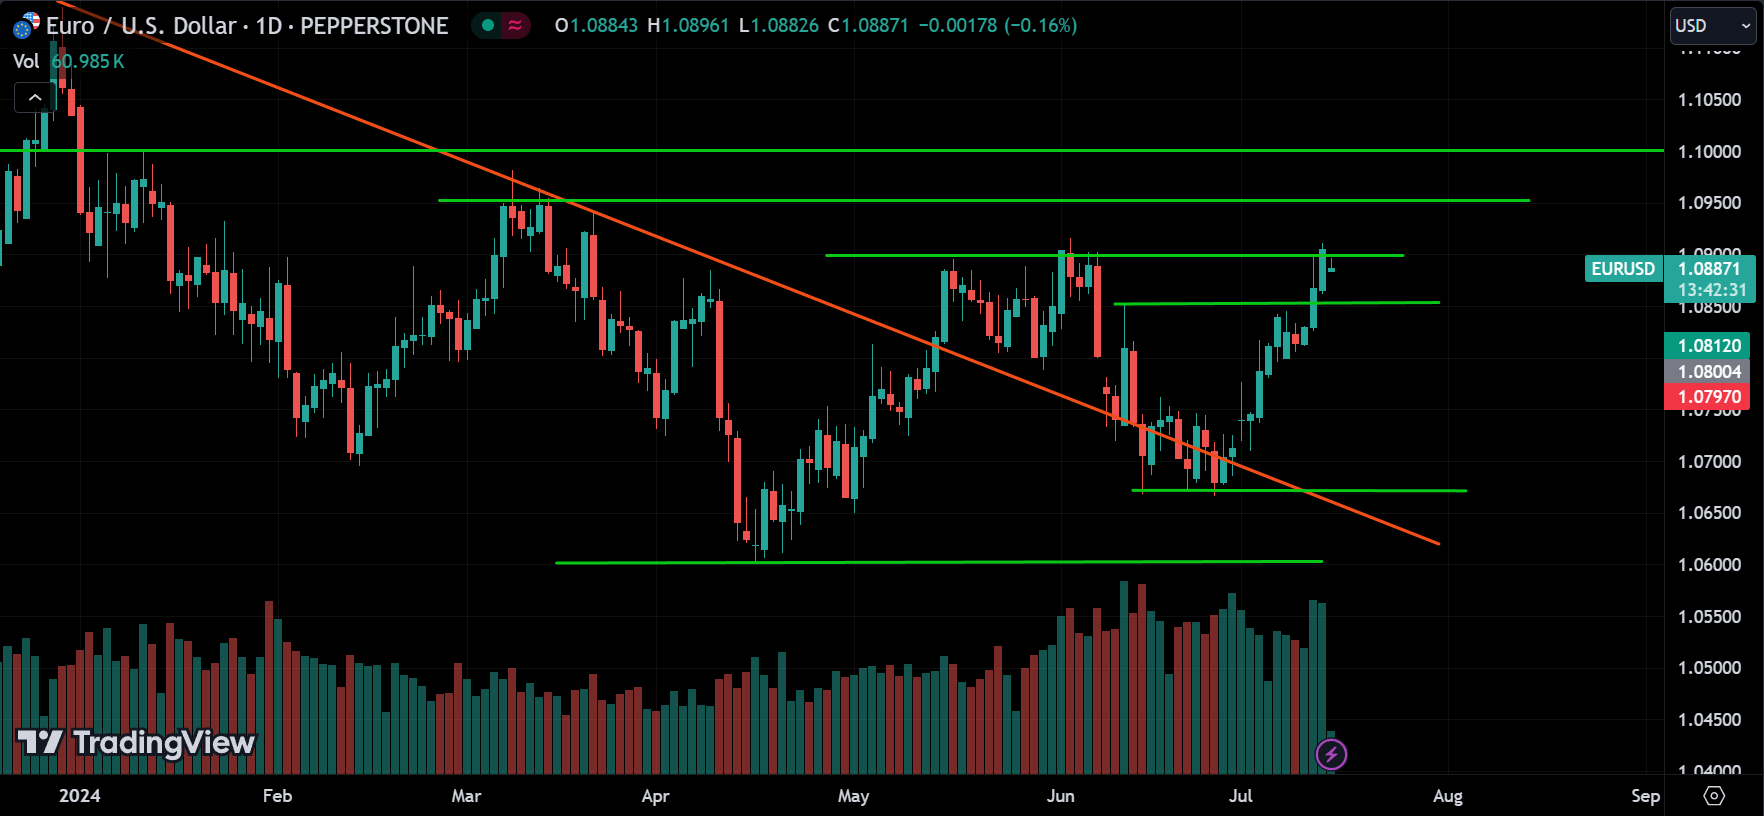
Looking at EURUSD, it’s in an uptrend. Right now, it’s at a resistance level of 1.09000.
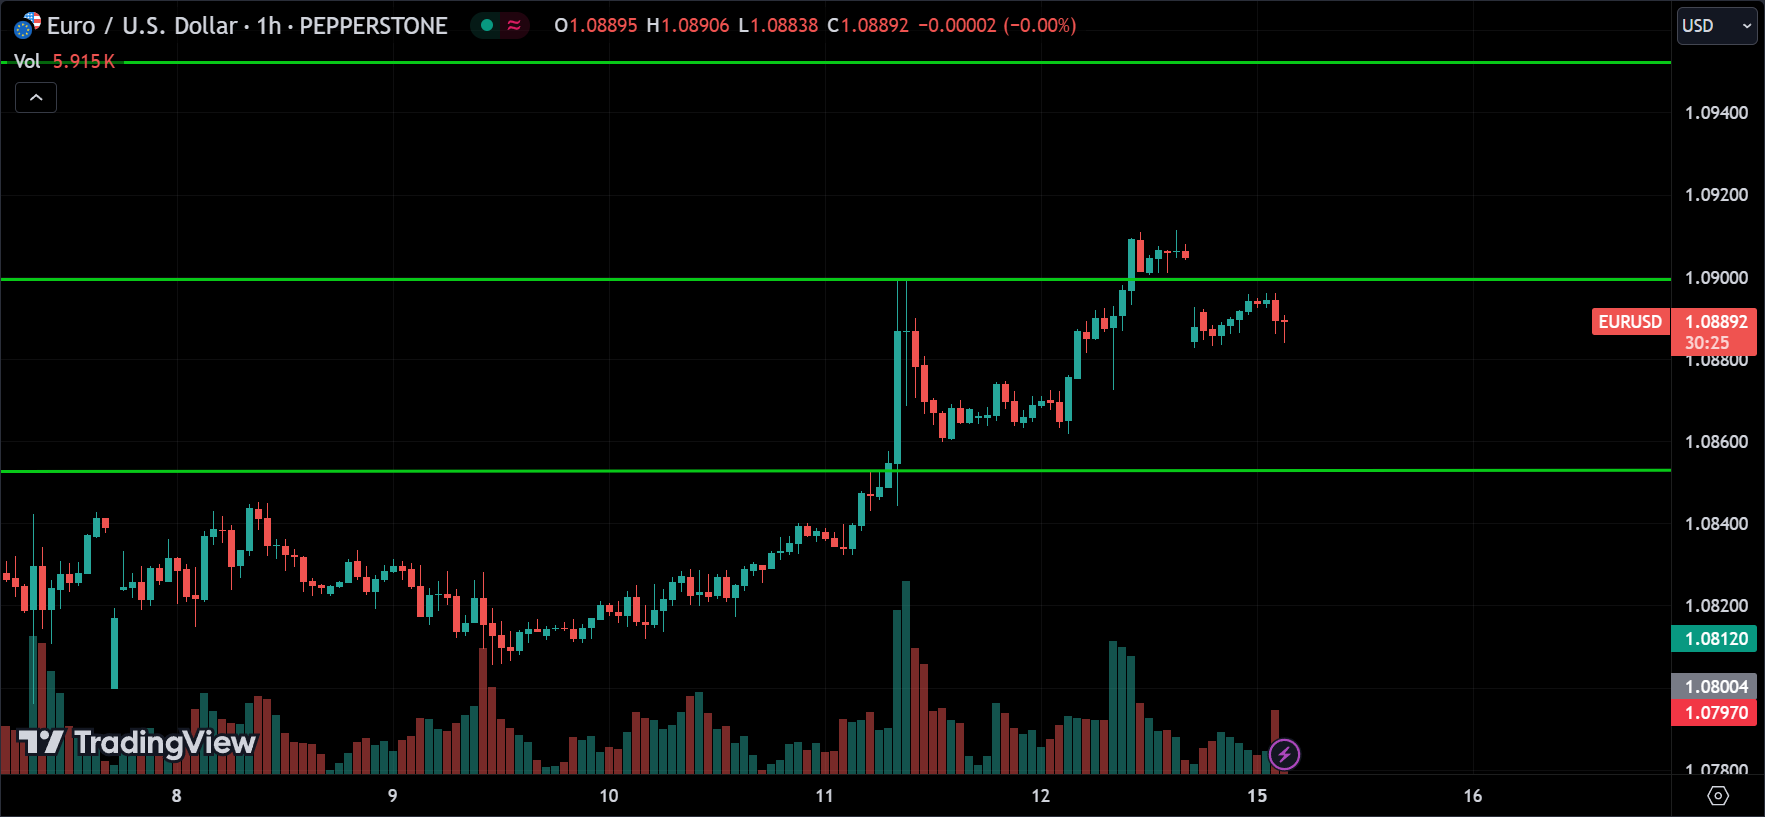
Looking at the 1-hour chart, you can see that the price opened lower today. We can expect a pullback from here, but since the overall trend is bullish, the price might start to rise again. Wait for the price to break above the resistance line around 1.09000 to confirm the upward momentum.
USDCAD:
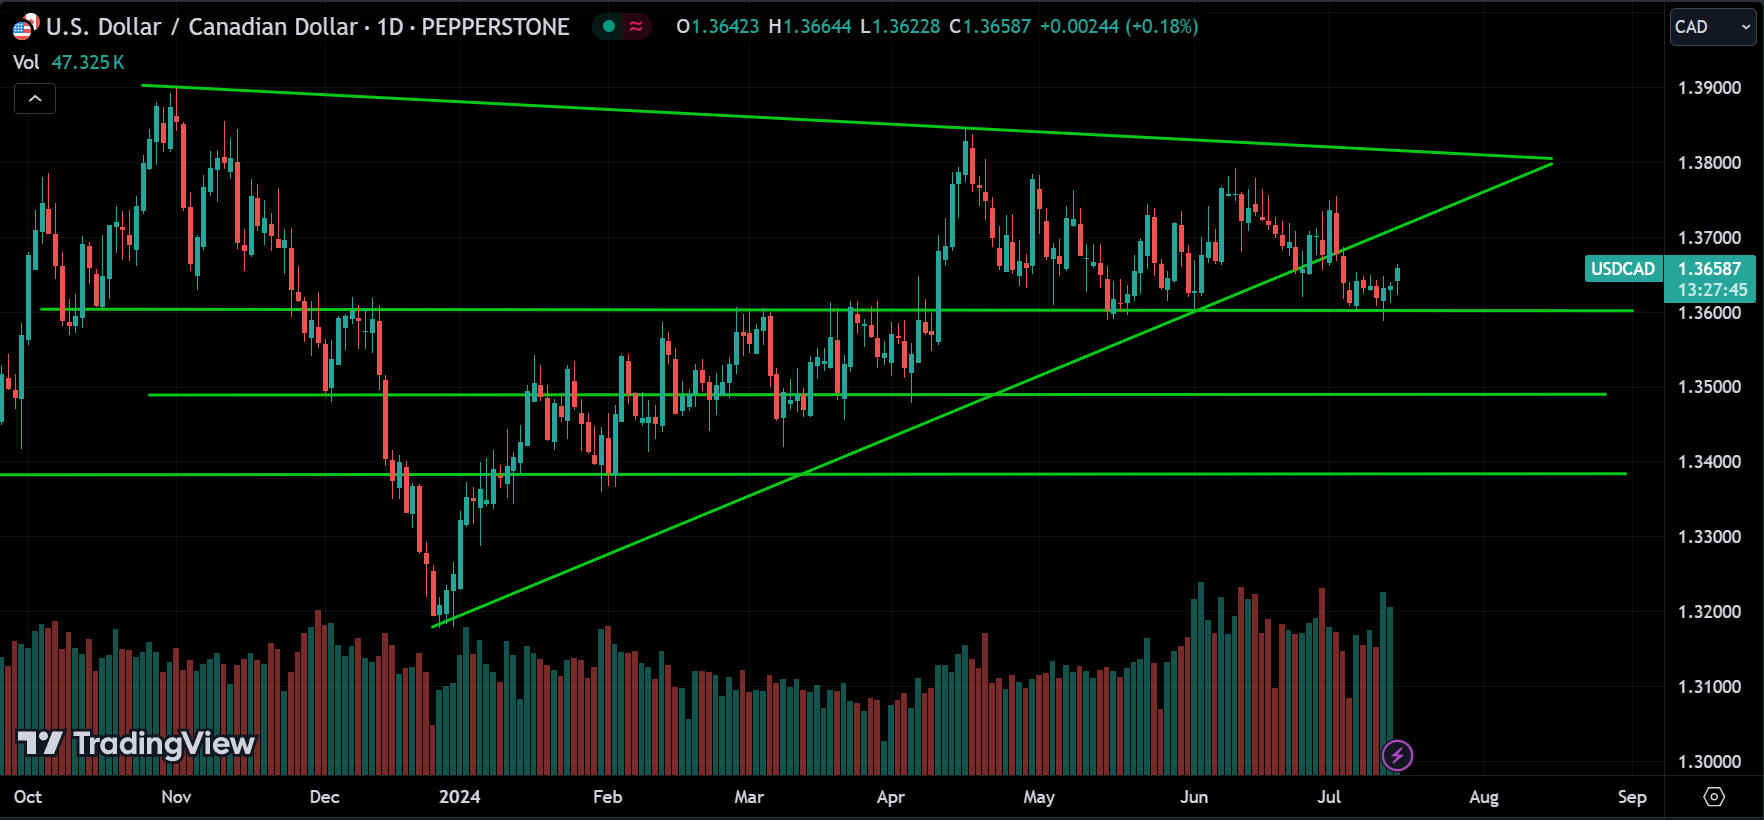
Looking at USDCAD, it was trending up, but now it has broken the major support. This likely means it’s entering a new trend.
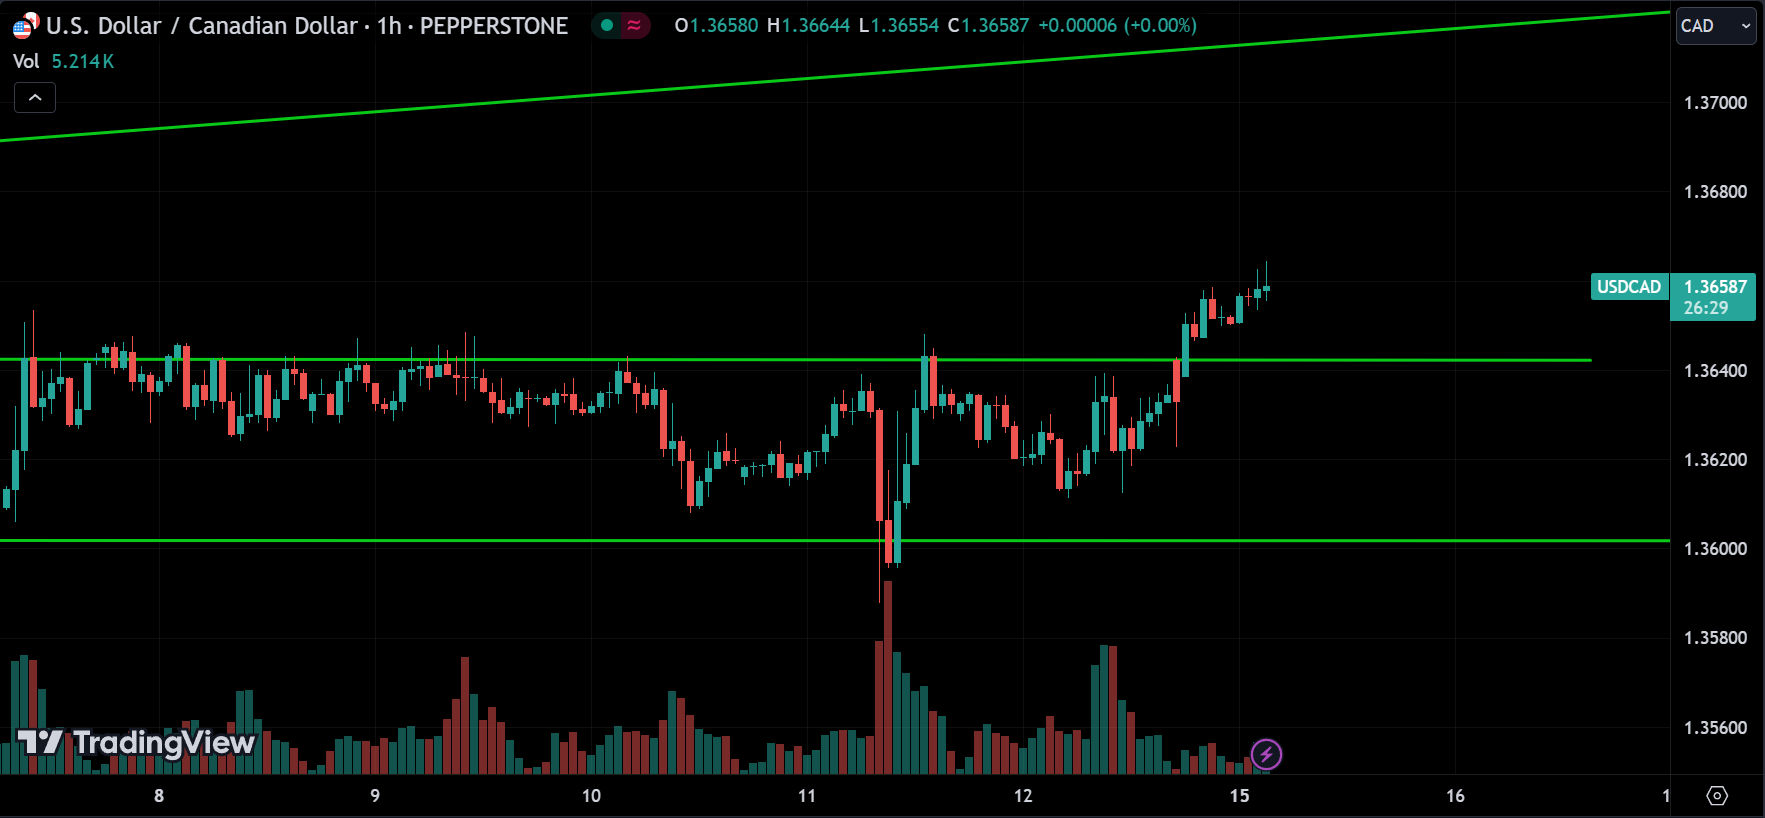
Looking at the 1-hour chart, you can see that after consolidating for a while, the price broke above the resistance level, showing buyer pressure. We can expect the price to continue rising to the previously broken major support level. However, if the price falls back below the support at 1.36400, it means there is still uncertainty about the trend.
USDJPY:
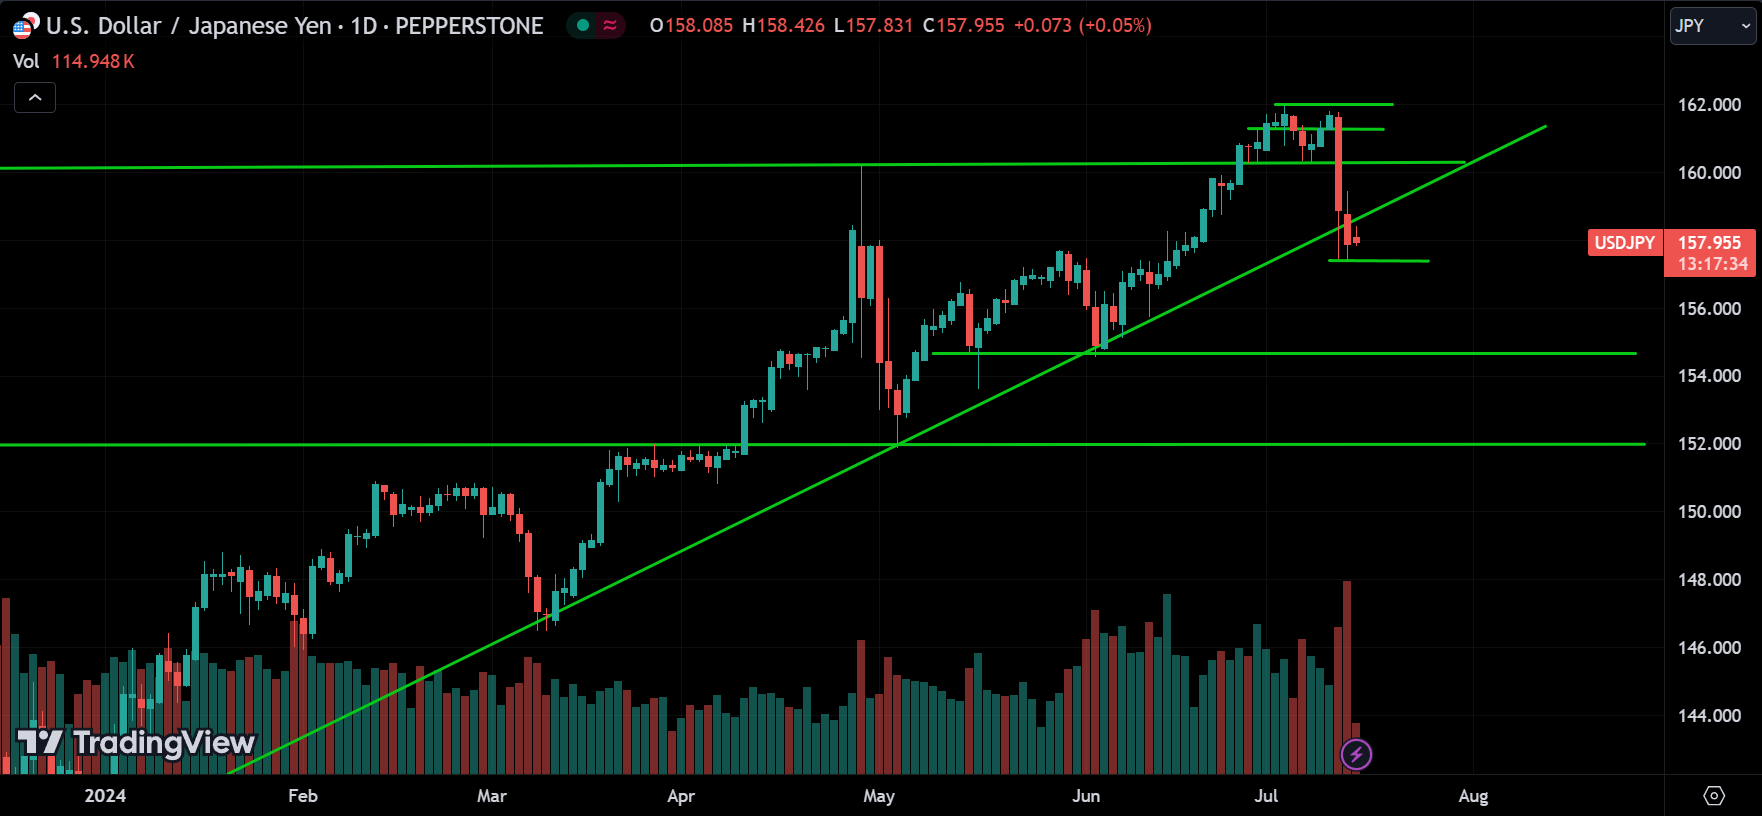
Looking at USDJPY, it was in an uptrend, but now it seems to have broken the major support level, so it might be entering a new trend. However, we can’t confirm it yet.
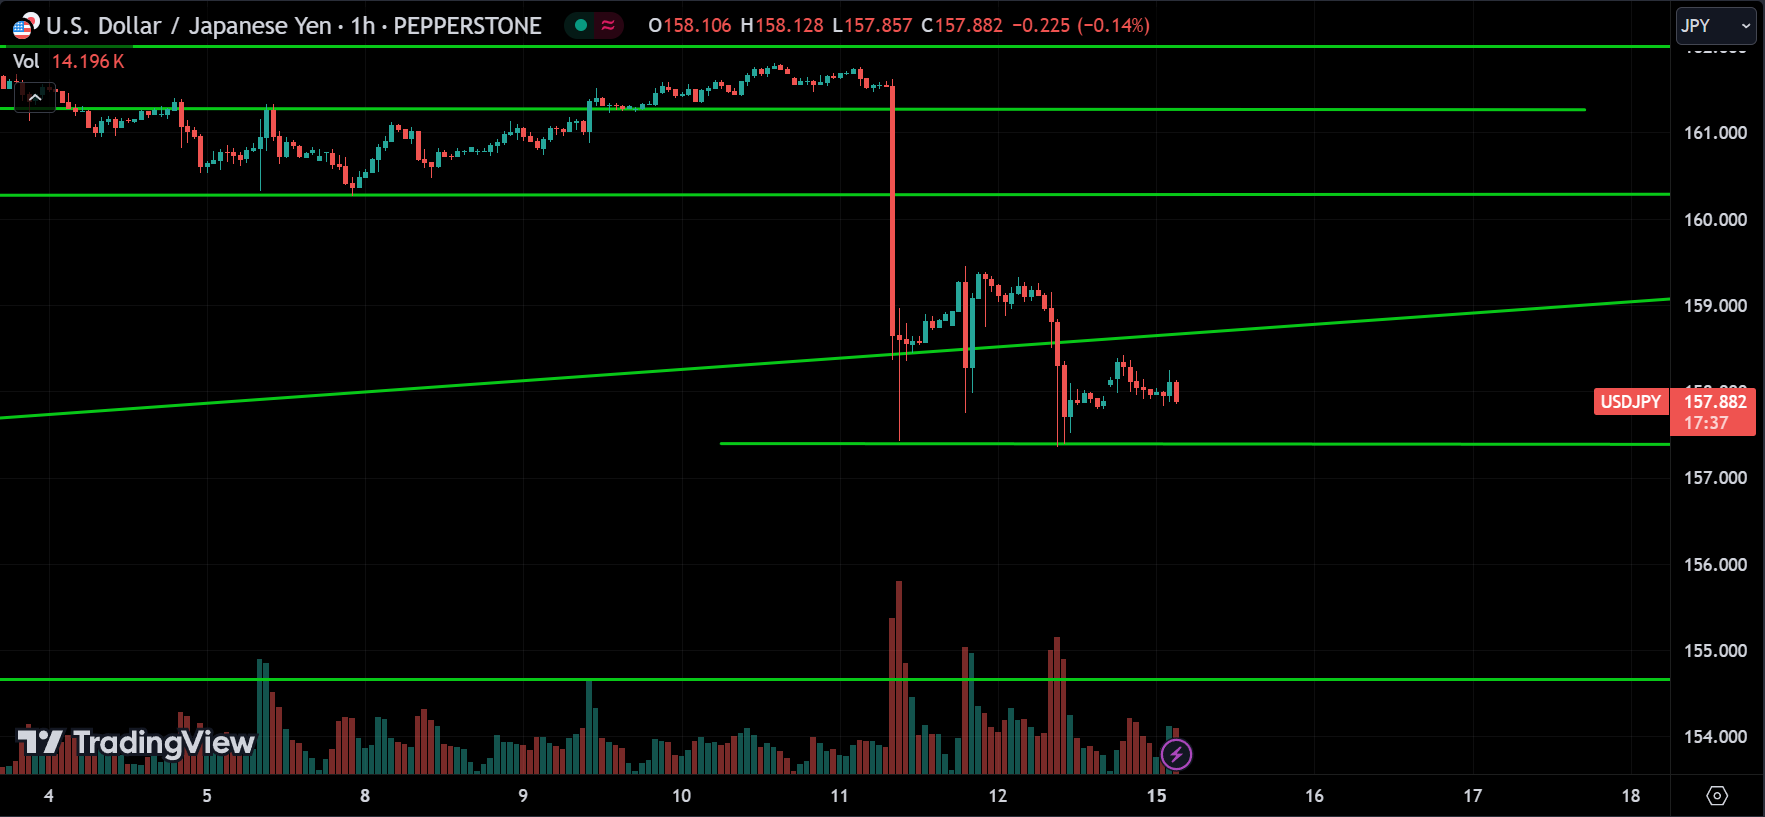
Looking at the 1-hour chart, you can see the price dropped and is now at the support level of 157.000. To confirm a downtrend, wait for the price to break below this support. If this drop is just due to news, we might see the price start going up from this level. Wait for the breakout to confirm the trend.
USDCHF:
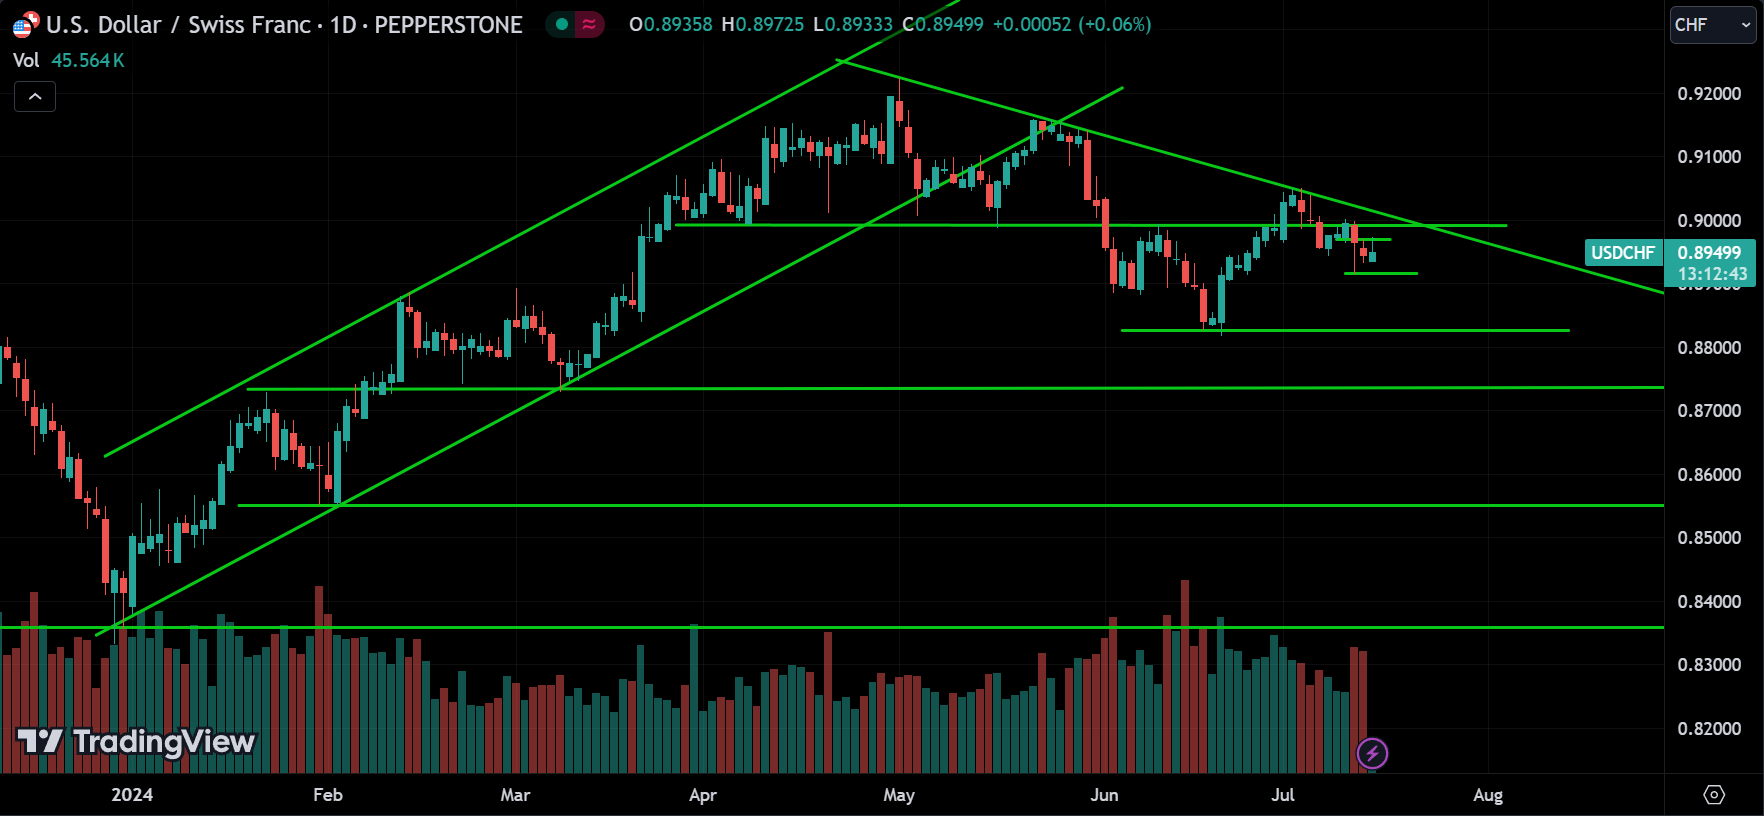
Looking at USDCHF, it’s trending down, and right now it’s pulling back from the resistance level of 0.90000.
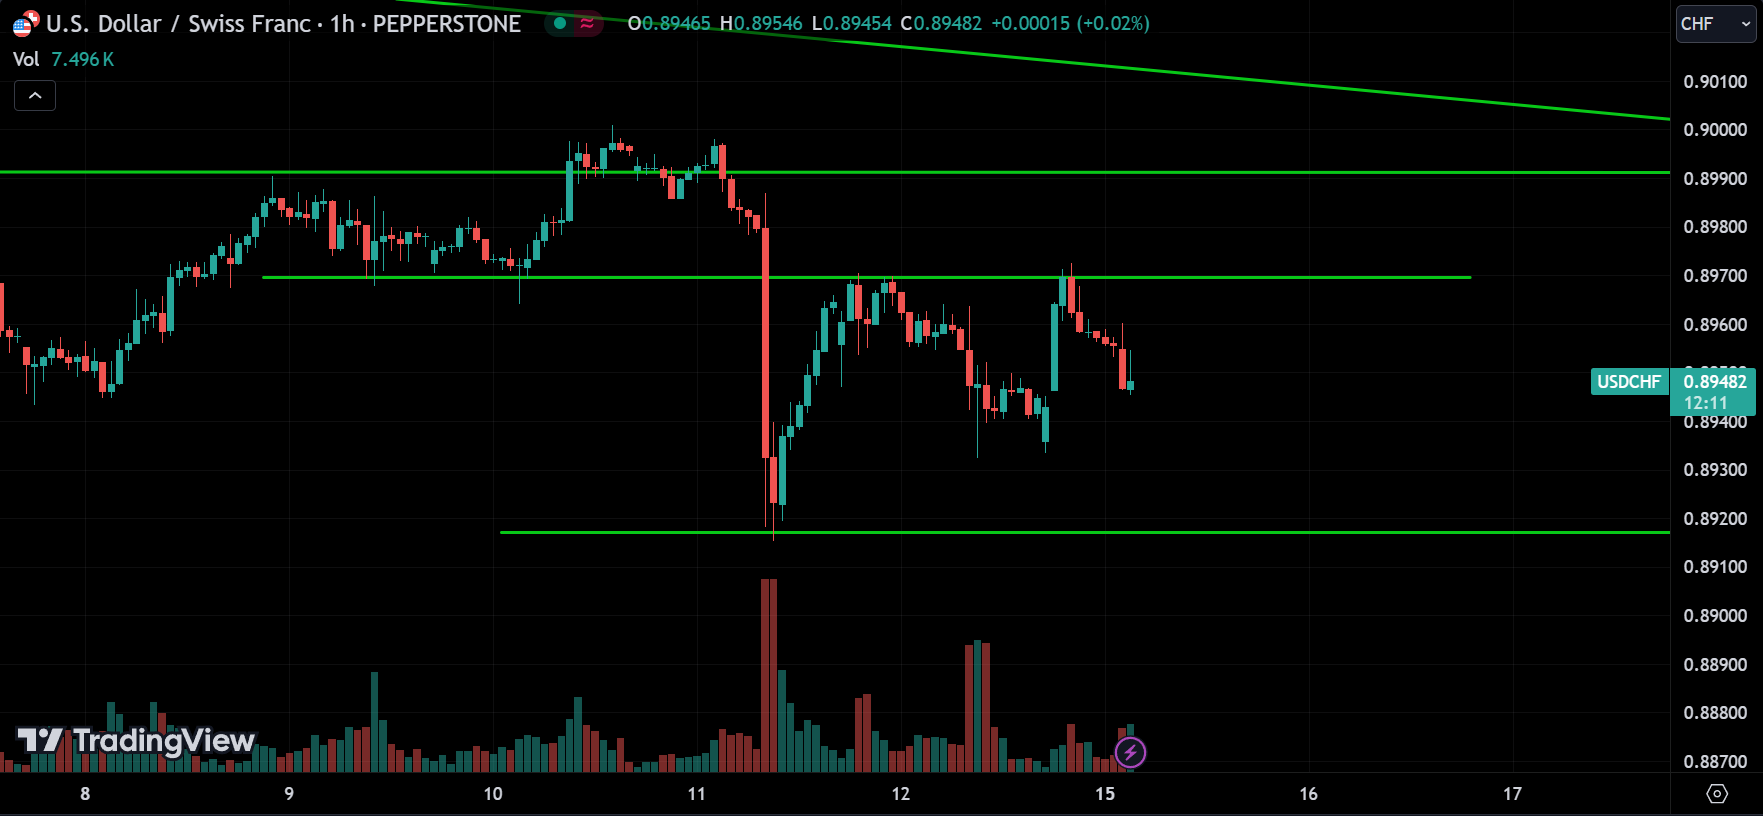
Looking at the 1-hour chart, you can see that the price is moving sideways between support and resistance. Since the overall trend is down, we can expect the price to fall to the support and possibly break below today. However, the price could also correct and start going up, breaking the resistance. So, keep an eye on that.
GBPUSD:
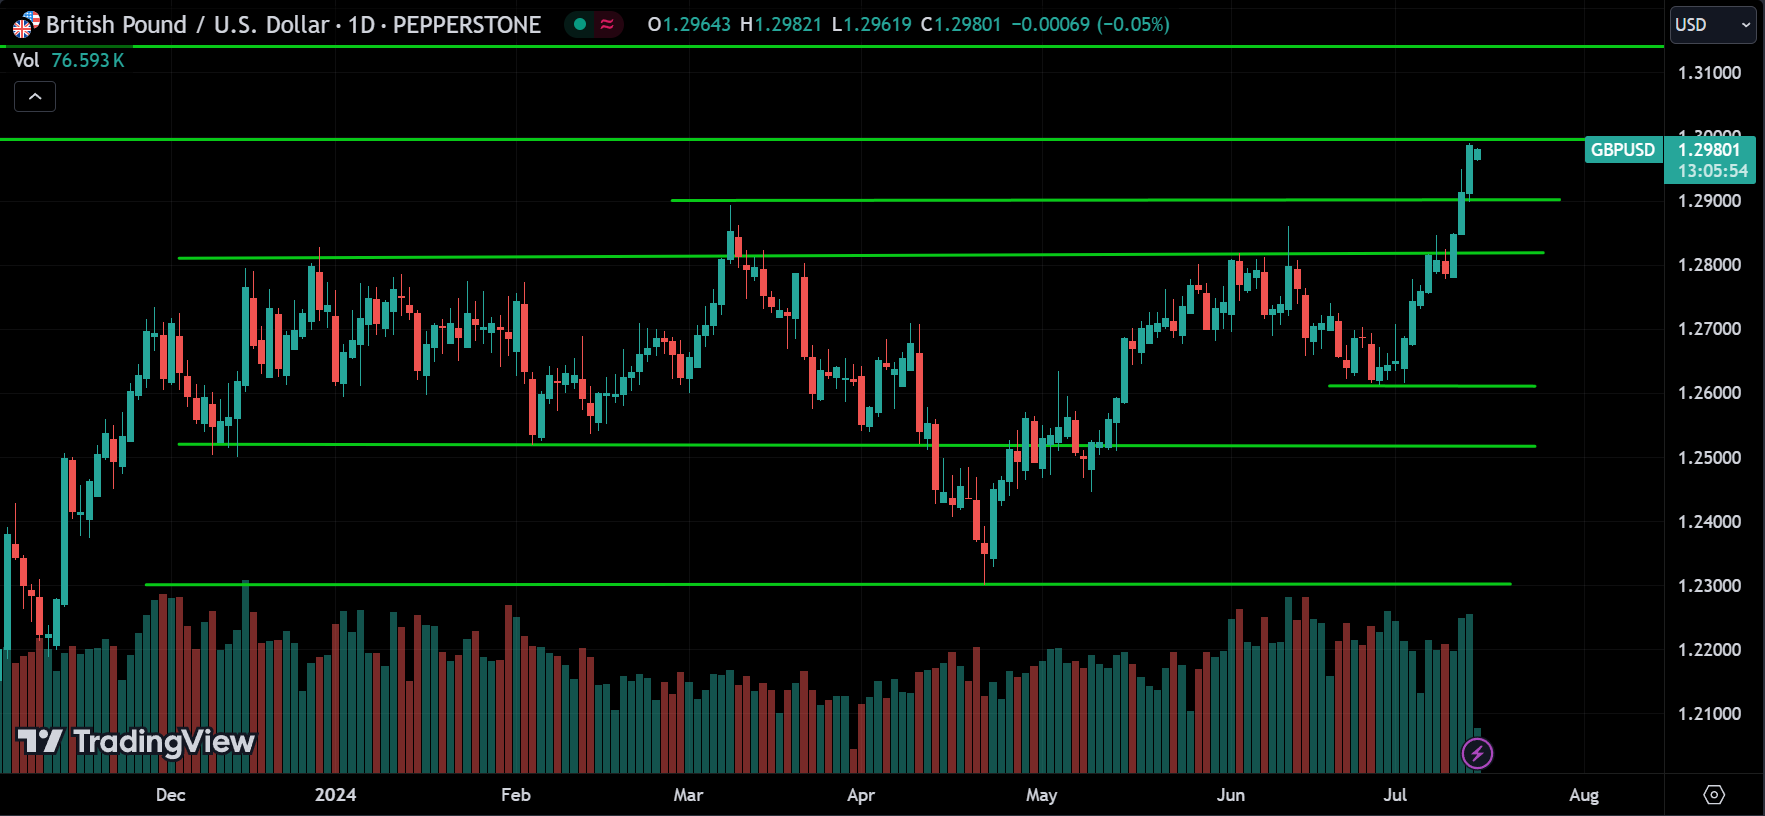
Looking at GBPUSD, it’s in an uptrend and is currently at the resistance level of 1.30000.
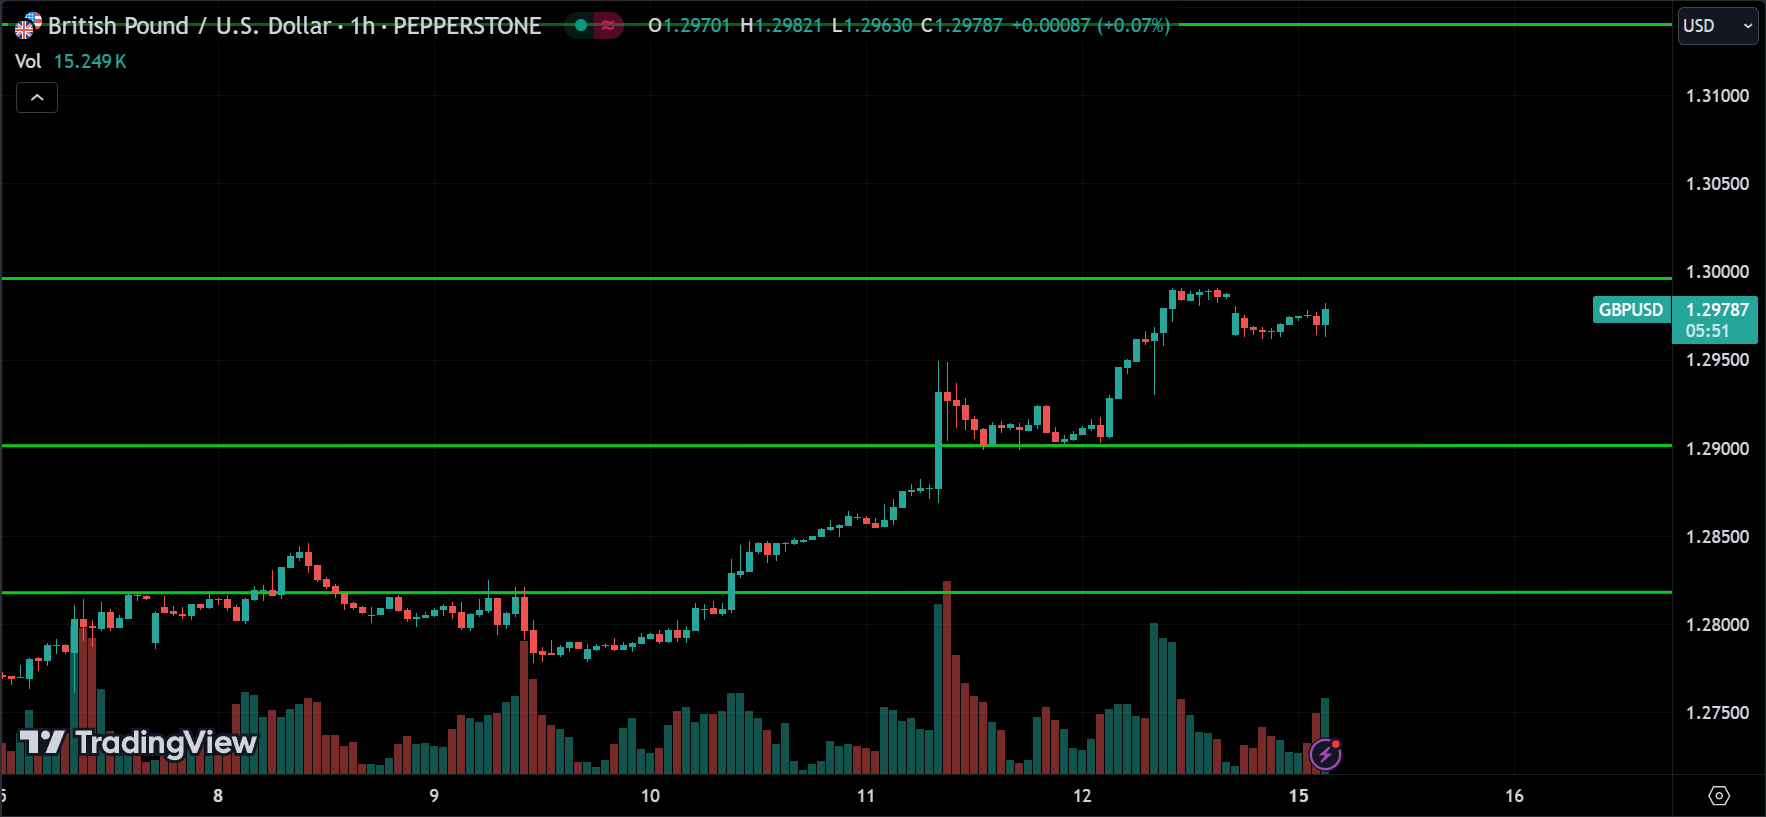
Looking at the 1-hour chart, you can see that the price pulled back slightly from the resistance. Since the overall trend is bullish, the price is more likely to break above this resistance and continue going up. However, it could also reverse from this level because it’s a major resistance. If the price breaks above this resistance, we can expect the upward momentum to continue. If the price reverses and breaks below the support at 1.29000, we can expect a downtrend.
AUDUSD:
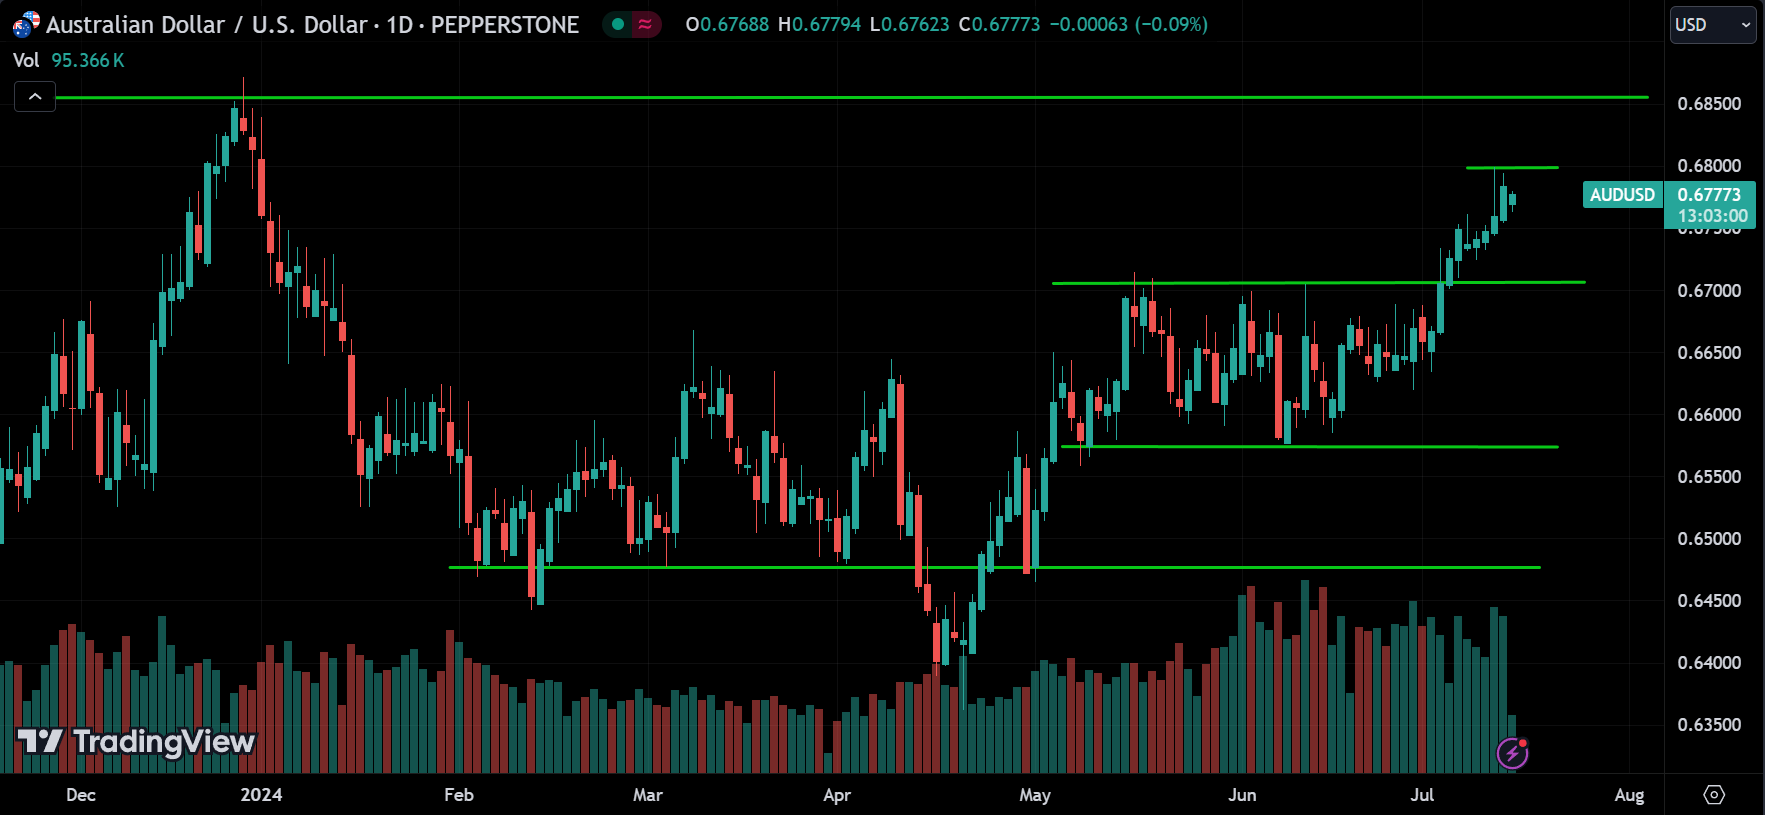
Looking at AUDUSD, it’s also trending up and is currently at the resistance level of 0.68000.
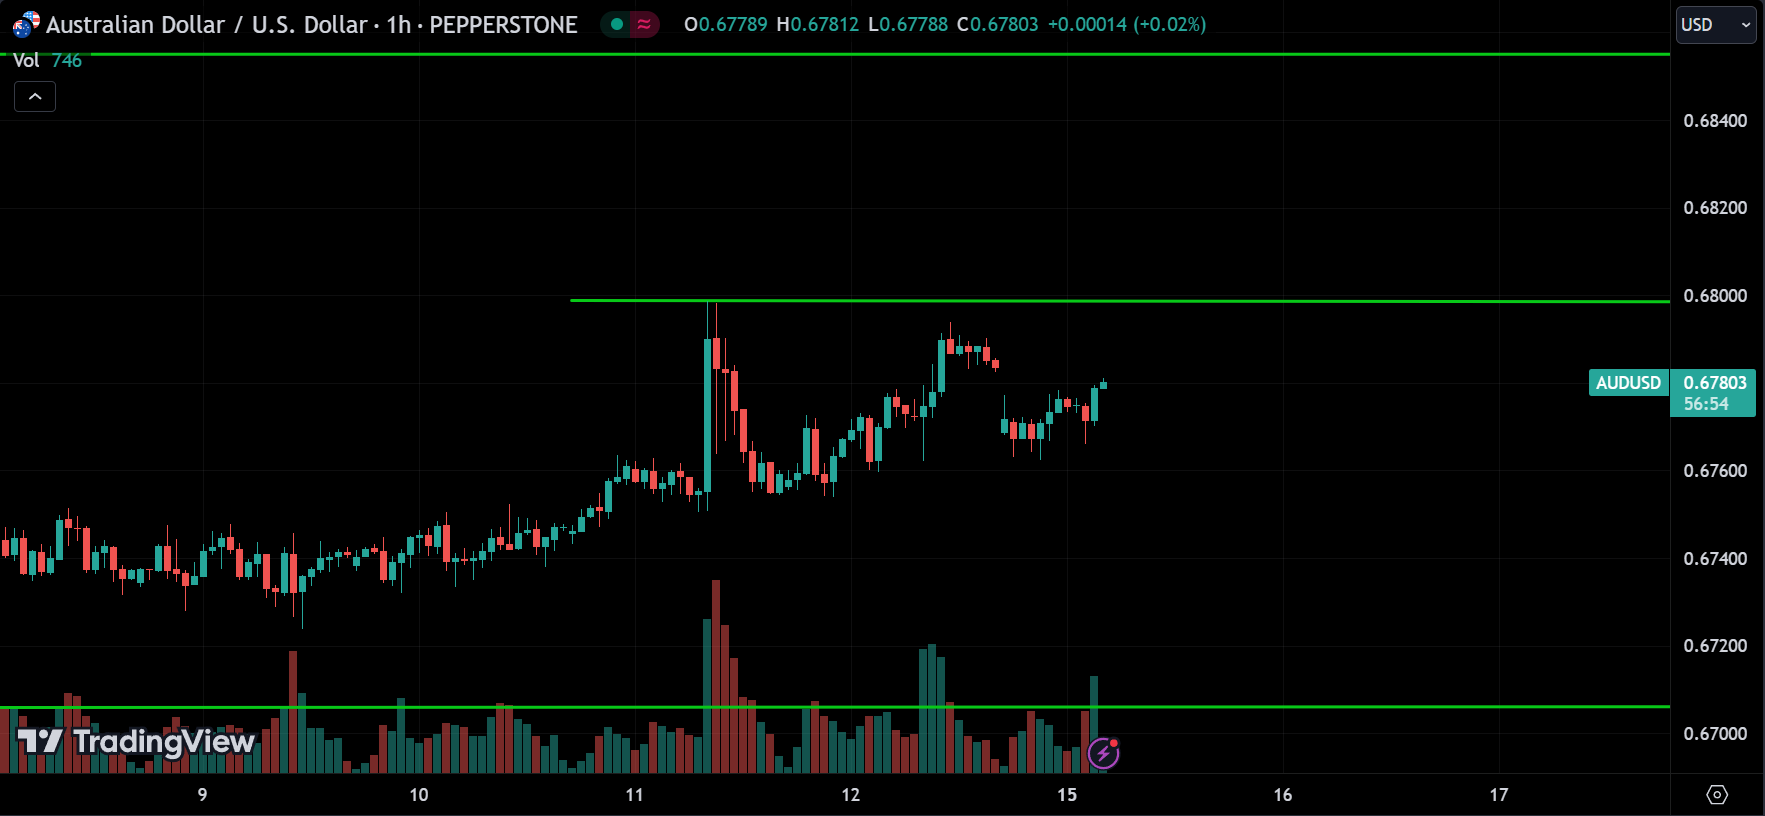
Looking at the 1-hour chart, you can see that the price pulled back from the resistance. Since the overall trend is bullish, we can expect the price to go back, break above the resistance, and continue up to the next resistance. However, it could also reverse from this resistance, so wait for confirmation.
NZDUSD:
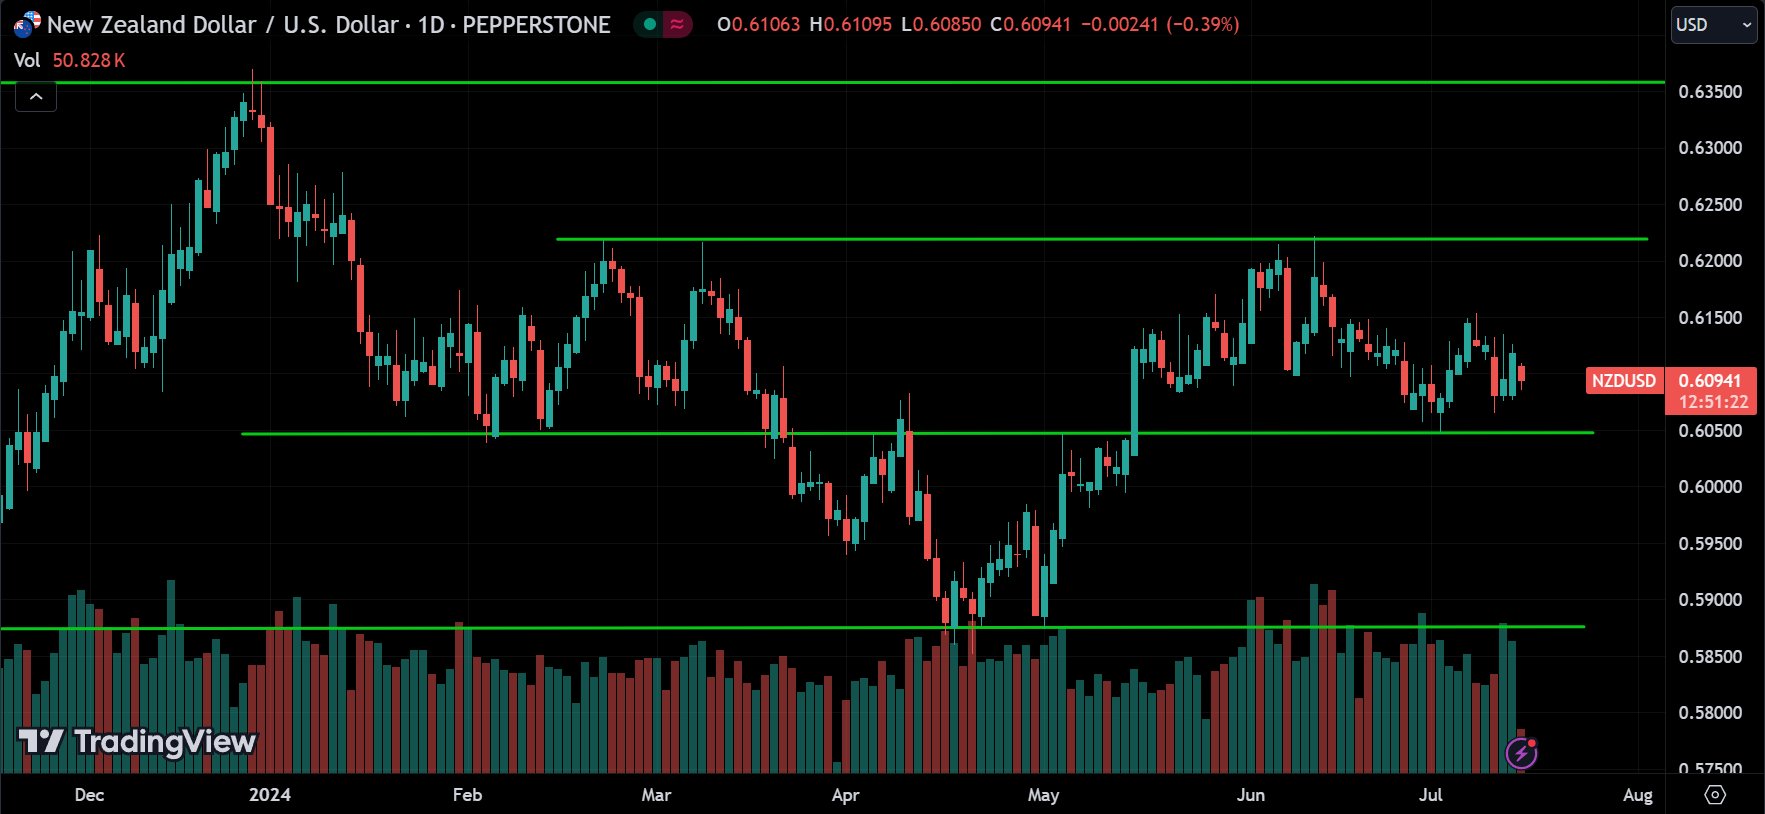
Looking at NZDUSD, it’s consolidating between 0.60500 and 0.62250.
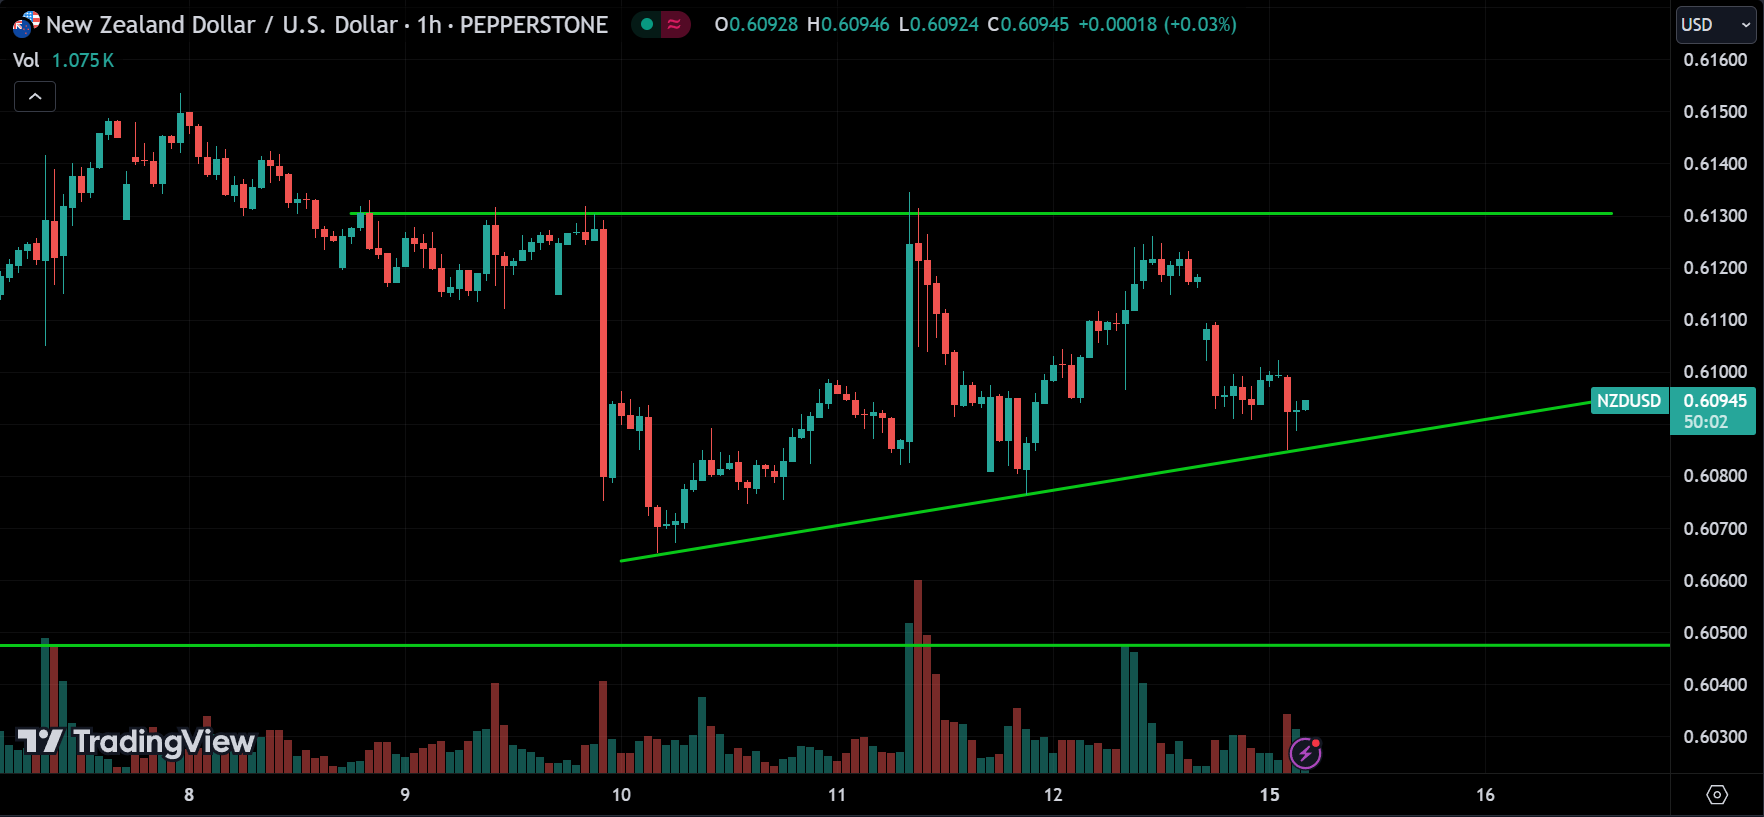
Looking at the 1-hour chart, you can see a small upward trend. If the price breaks below this trend line, we can expect it to go to the support and pull back there. Alternatively, the price might start going up from this trend line. So, watch for reversal signals.
Conclusion & Disclaimer
Please provide your feedback on how we can improve this article. Thank you!
These analyses are here to help you understand how to analyze the market. They’re not about giving buy or sell signals. It’s simply about observing price action market behavior. I don’t recommend when to buy or sell because trading doesn’t work that way. You need a strategy to guide your decisions about when to enter or exit positions. That’s the key to making consistent profits in the financial markets over time.
The information provided in this market analysis is for educational and informational purposes only. It should not be construed as financial advice or a recommendation to buy, sell, or hold any securities or investments.
All investments involve risk, and past performance is not indicative of future results. The analysis provided may not be suitable for all investors and should be used at their own discretion.
Readers are encouraged to conduct their own research.
Trading and investing in financial markets carry inherent risks, including the risk of losing invested capital. It is important to carefully consider your investment objectives, risk tolerance, and financial situation before making any investment decisions.
GOOD LUCK✌!!!