
![Market Analysis Today[2024.03.25]: It's High Time
xlearnonline.com](https://xlearnonline.com/wp-content/uploads/2024/03/Green-Professional-Finance-YouTube-Thumbnail.jpg)
Today starts the final week of March 2024. Let’s see what the market has to say today.
Market Analysis Today
Forex
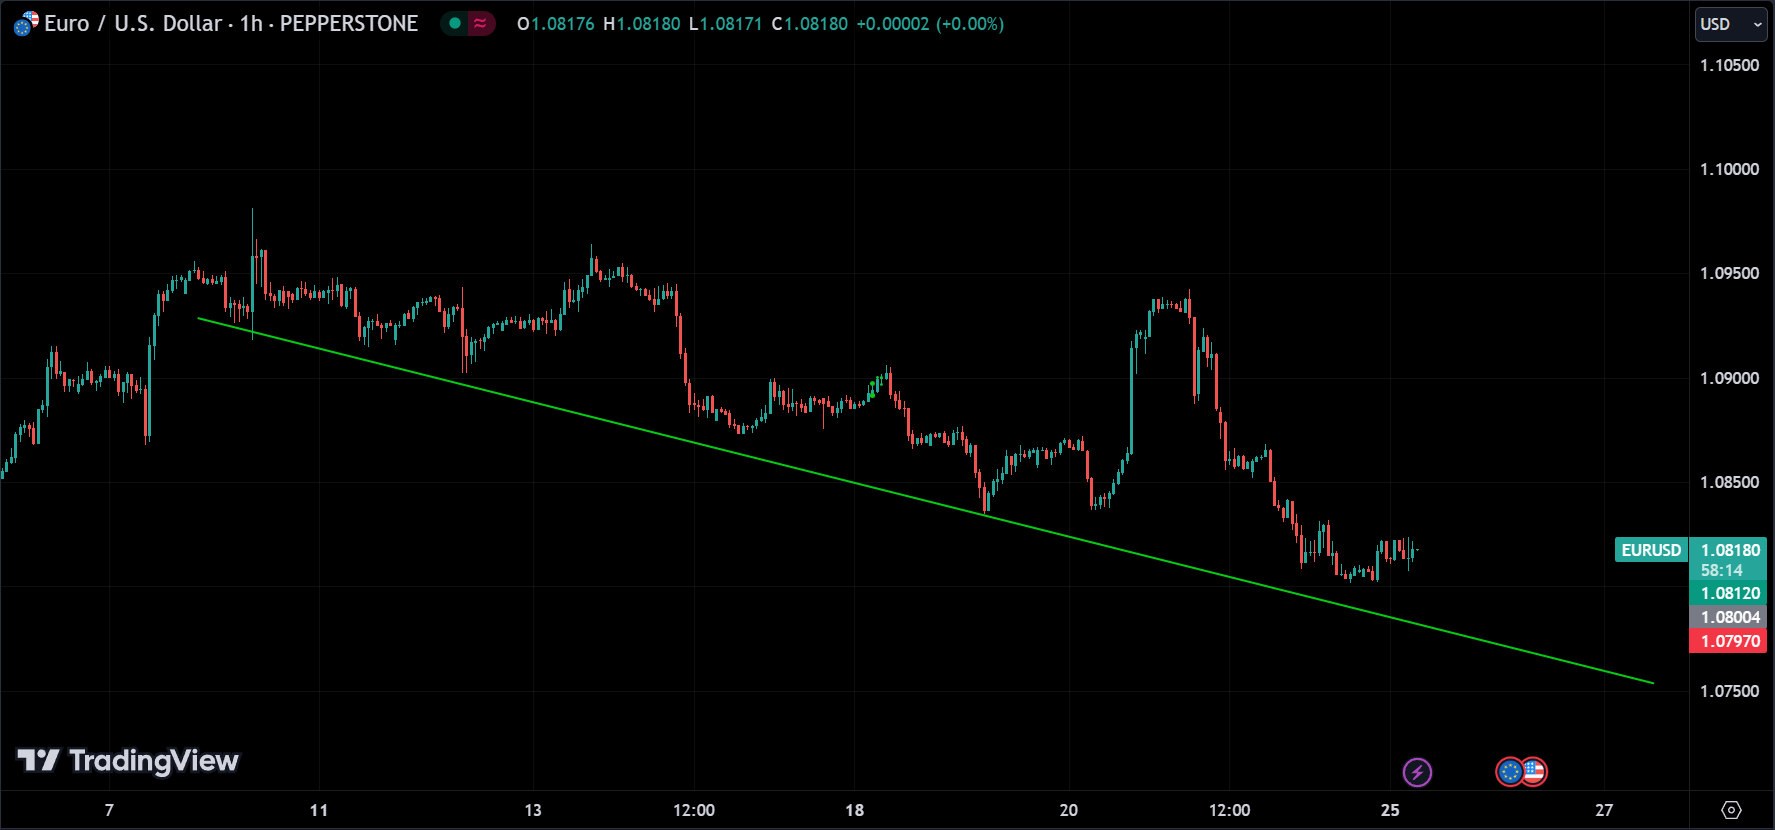
Understanding what’s going on in the currency markets is really useful. It gives us insight into what might happen in other markets because forex impacts everything in some way.
Looking at the big picture, the market has been moving sideways since early 2023. It appears that the price has encountered resistance around 1.10000, which isn’t unexpected. We can say that the market is on a downward trend. It might find support around 1.8000, but if it breaks this level, it indicates a clear downward trend that could go down further to perhaps 1.07400 or nearby. Conversely, if the price rebounds from 1.08000, it could be a sign of an upward trend or possibly a correction.
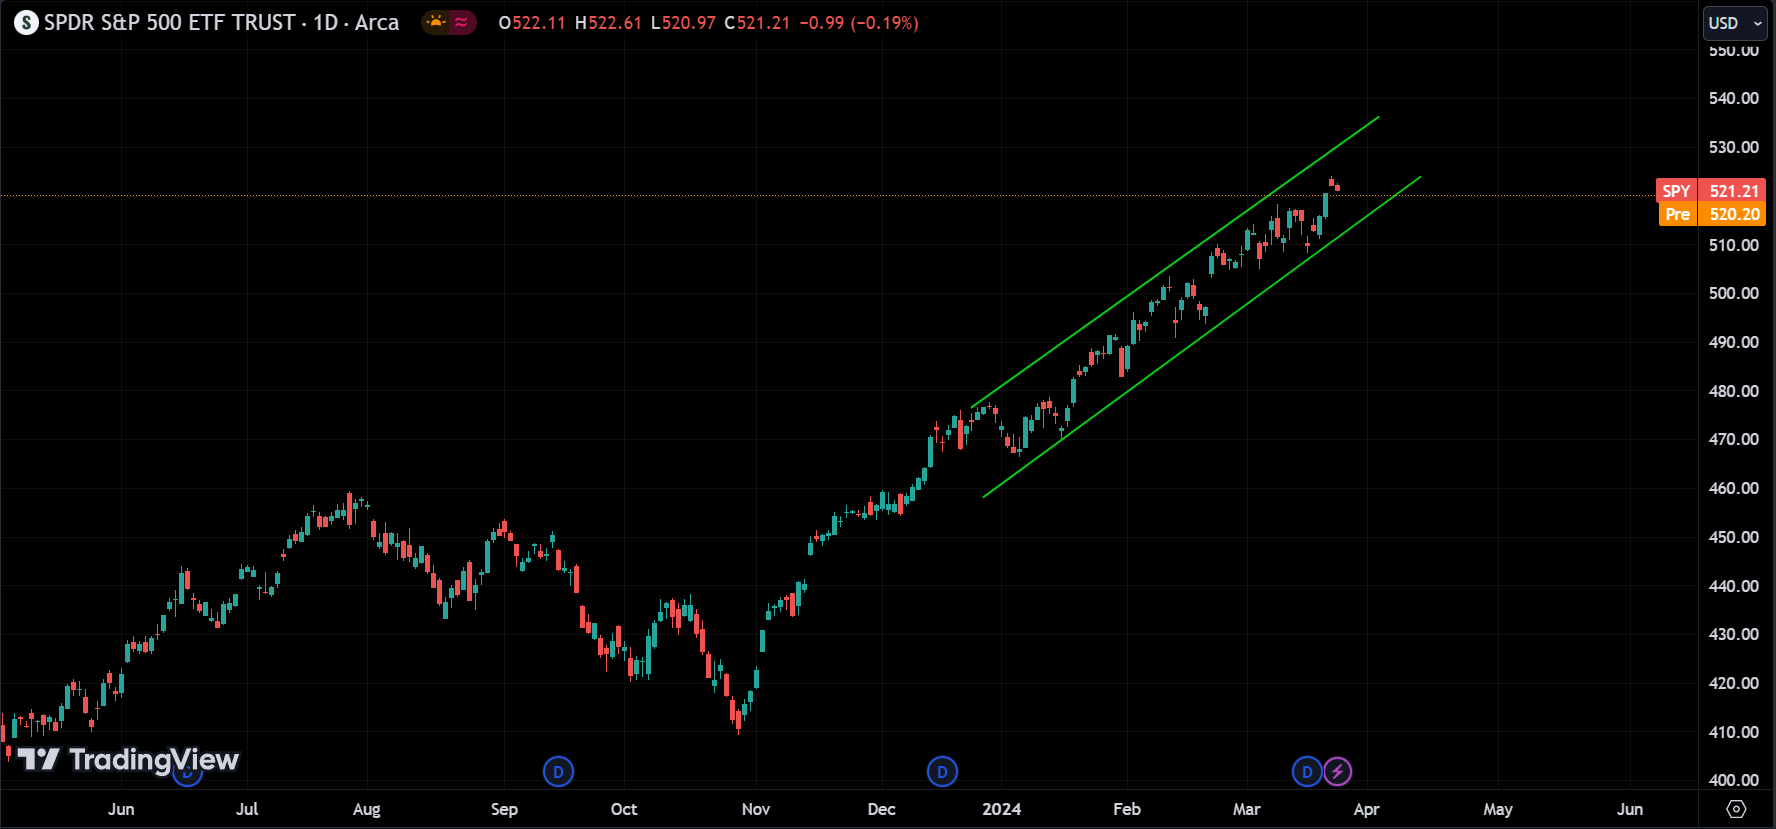
On this 1-hour chart, the downtrend is clearly visible. If the price breaks this trend line, it could indicate a strong bearish signal, suggesting a potential continuation of the downward trend. However, there’s also the possibility that the price might follow the trend without necessarily breaking the trend line. Additionally, with the US session approaching, there’s a chance for a new trend to emerge, potentially leading to a shift in market direction.
There are no major news events for today except, FOMC Member Bostic Speaks.
Stocks
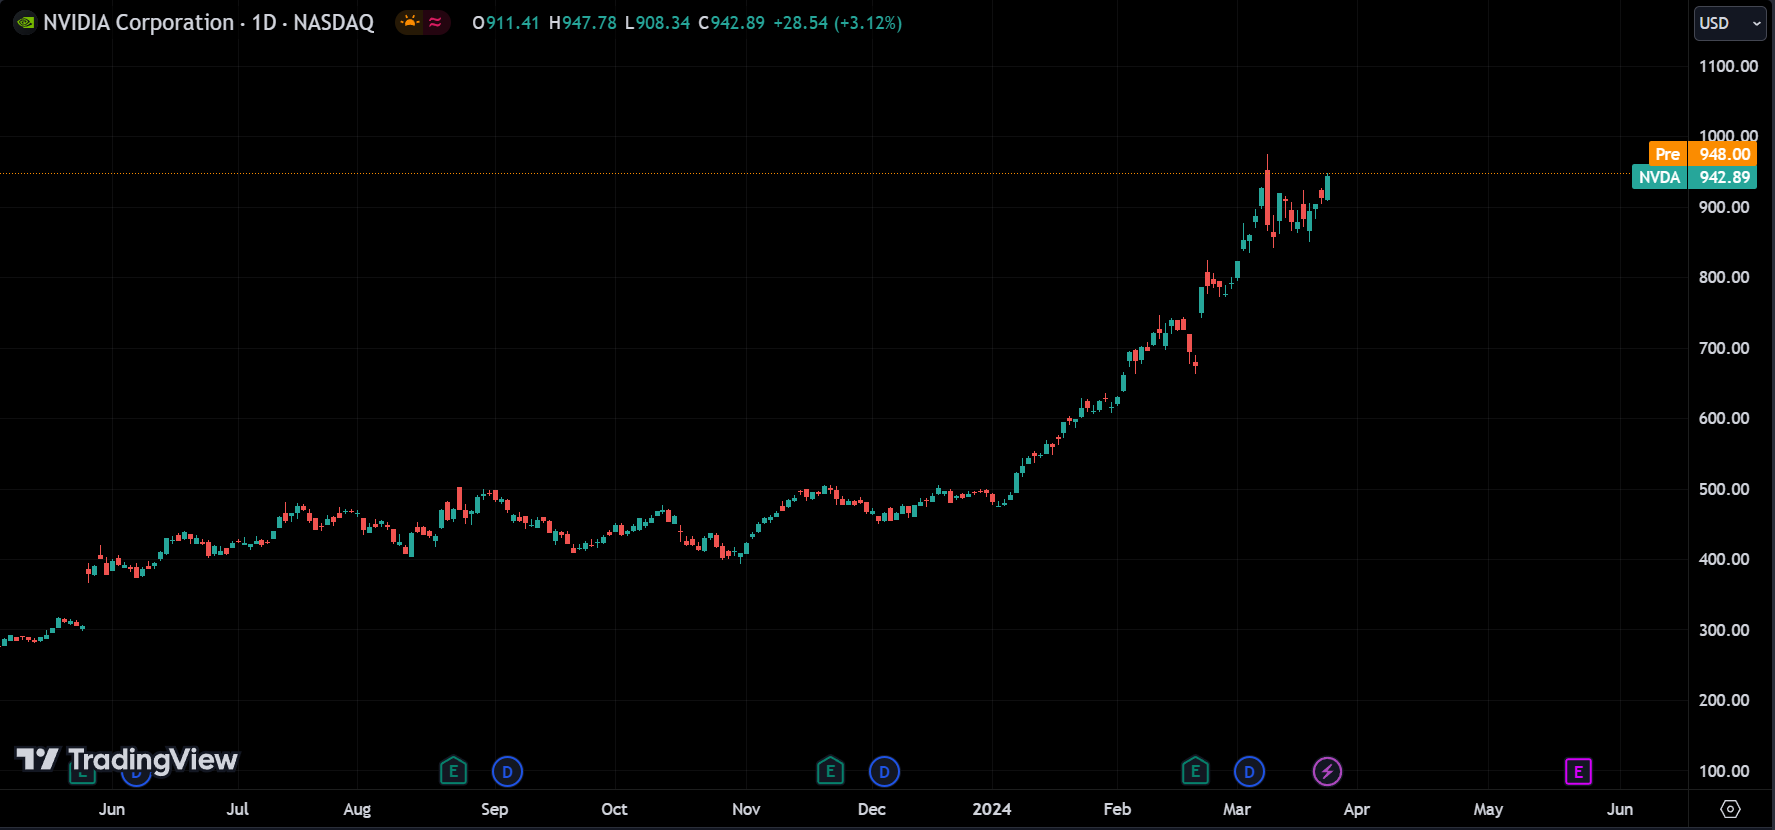
The S&P 500 is currently at its all-time high level. Despite the market being down for the past two days and experiencing a slight gap down in the pre-market, the uptrend seems to be holding strong.
EU to target Apple, Google, Meta in Digital Markets Act probes: BRUSSELS (Reuters) -Apple, Alphabet’s Google and Meta Platforms will be investigated for potential breaches of the Digital Markets Act, EU antitrust regulators said on Monday, a move that could lead to hefty fines for the companies. this is key news that could affect the price of these stocks.
As AI technology advances daily, people’s trust in Nvidia is also increasing. This trend seems to be staying strong. Nvidia is currently at its all-time high level, and the premarket also showed an upward gap. The rally will likely continue unless there’s any negative news, or developments or there is no one to push the price anymore. but we can expect a small correction, as prices don’t go in a straight line.
It’s true that historically, stocks have often rallied when the Federal Reserve lowers interest rates. However, in the current situation where interest rates are relatively high, yet the market is still performing well, it suggests that other factors may be influencing investor sentiment.
The Federal Reserve’s stance of not raising rates further in the near term, but also not committing to immediate rate cuts, reflects a cautious approach to monetary policy. This stance could be interpreted as an attempt to balance economic growth while also keeping inflation in check.
In terms of the market’s reaction, it’s possible that investors are focusing on other factors such as corporate earnings, economic indicators, and geopolitical developments rather than solely relying on interest rate movements. Additionally, market sentiment can be influenced by expectations and perceptions of future economic conditions.
Overall, the situation highlights the complexity of market dynamics and the multitude of factors that can impact investor behavior and market performance. what are your thoughts on this?
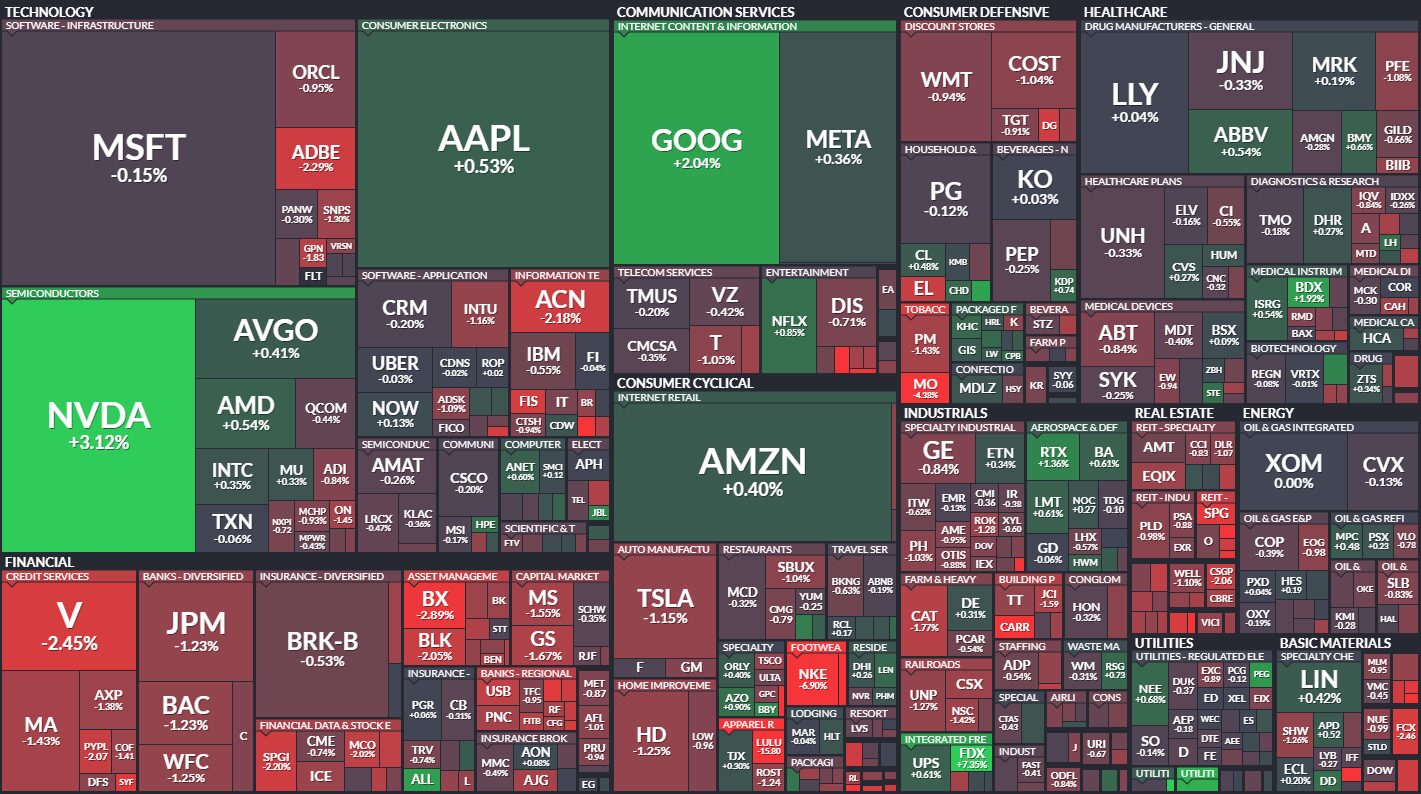
Last Friday’s market map showed a downturn overall, except for Google and Nvidia. The semiconductor industry seems to be performing well currently. Additionally, talks between Google and Apple about incorporating Google’s Gemini model into Apple’s products are boosting Google’s market position. As we head into the new week, it’ll be interesting to see how things unfold. While it’s true that predicting the overall market is challenging, we can make more informed predictions about the behavior of certain stocks.
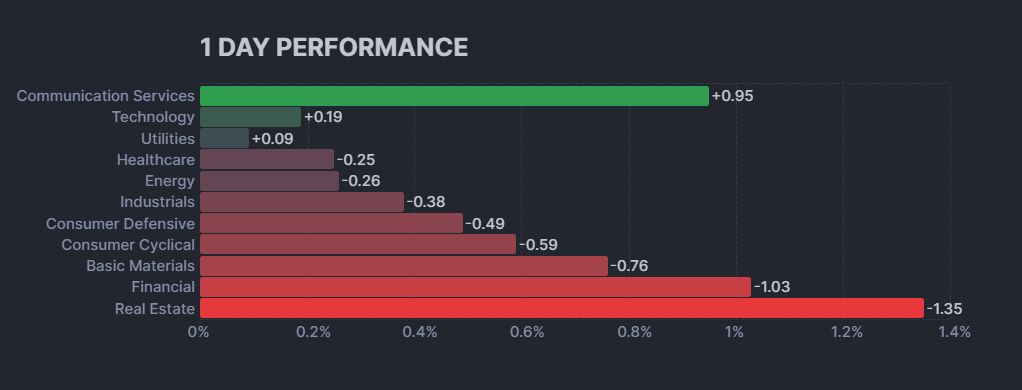
The stock market experienced a down day on March 22nd, 2024. Eight out of the eleven sectors tracked by the graph closed negative. The Financials & Real Estate sectors had the largest decline, dropping over 1%.
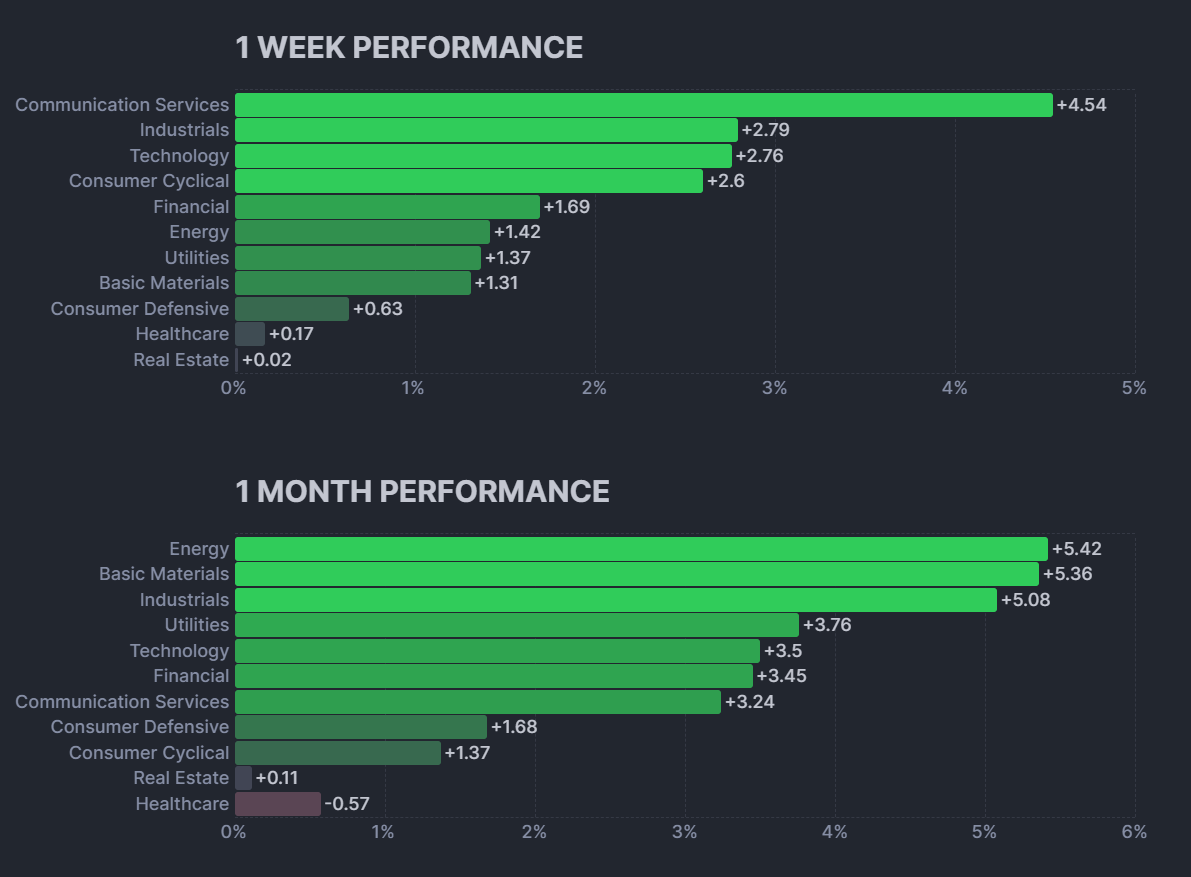
Based on the week-long performance data, the technology, communication services, and industrial sectors are leading the pack, with all three experiencing growth exceeding 2.5%. This could signal investor confidence in these sectors. Energy and basic materials follow closely behind, both exceeding 1% growth. The remaining sectors all exhibited modest growth of less than 1% over the week.
Looking at the month-long performance data, a similar trend emerges. Technology and communication services remain at the top, although their growth slows to around 3.5%. Notably, utilities climb into third place with a growth rate exceeding 3.75%. This could be due to investors seeking safe-haven assets in a cautious market environment. Energy remains strong, holding the fourth position with over 5% growth. Financials, consumer defensive, and real estate all show modest growth over the month. Healthcare is the only sector with a negative return over the month.
Overall, this analysis suggests that investors are favoring growth sectors.
HEPS, LITB, BTM, VIOT, TOVX, and SYRA are all set to release their earnings today, so if you’re trading these stocks, it’s important to be vigilant and pay close attention to their earnings reports.
Crypto
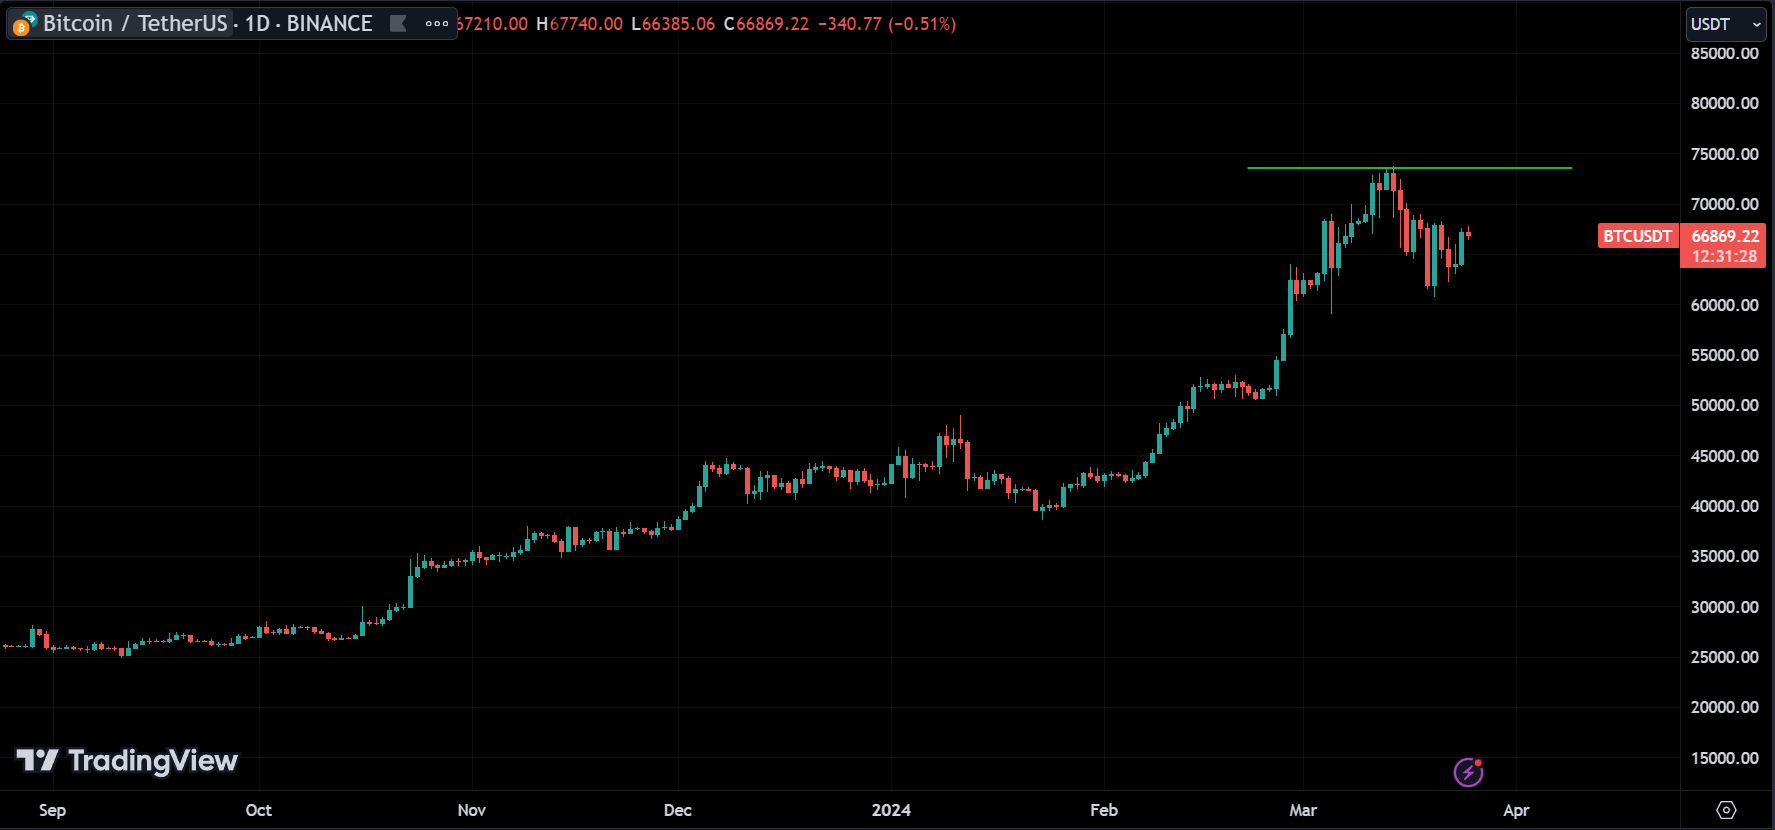
BTC reached a new all-time high on March 13th, and it’s currently trading around 66806. Typically, when a cryptocurrency reaches its all-time high, there’s a tendency for it to continue in that direction. So, we can anticipate BTC to potentially follow the same upward trajectory.
That’s a common observation in the cryptocurrency market: when BTC rallies, it often leads to a broader bullish sentiment across the entire crypto market. So, indeed, these are bullish times for crypto overall.
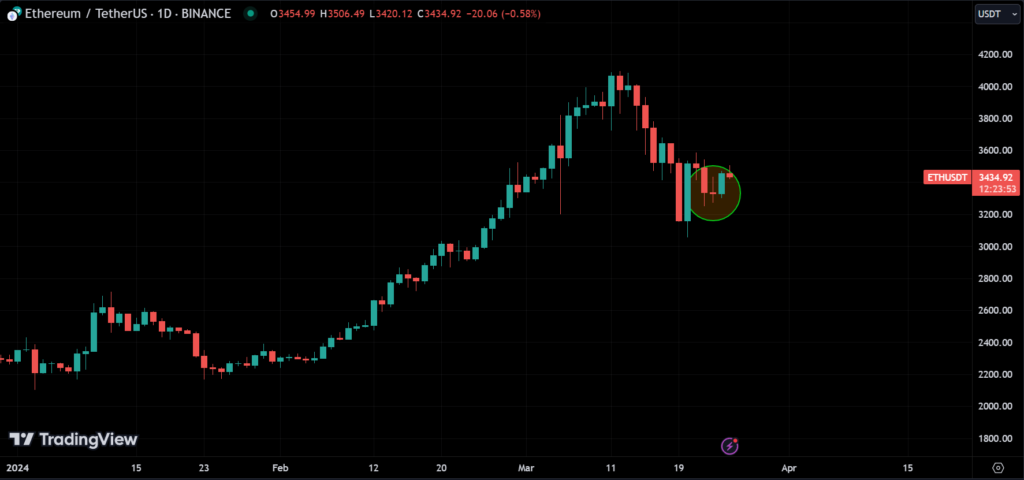
ETH’s price movements often align with those of BTC due to their high correlation, suggesting that if BTC is performing well, ETH is likely to follow suit. This correlation implies that there may be further upside potential for cryptocurrencies.
Additionally, you can see a potential trend reversal pattern, indicating that this week could mark the end of a correction phase and the resumption of a bullish trend. This interpretation suggests optimism for crypto markets in the near term.
Disclaimer
The information provided in this market analysis is for educational and informational purposes only. It should not be construed as financial advice or a recommendation to buy, sell, or hold any securities or investments.
All investments involve risk, and past performance is not indicative of future results. The analysis provided may not be suitable for all investors and should be used at their own discretion.
Readers are encouraged to conduct their own research.
Trading and investing in financial markets carries inherent risks, including the risk of losing invested capital. It is important to carefully consider your investment objectives, risk tolerance, and financial situation before making any investment decisions.
Conclusion
As we anticipate the next major event, the final GDP release, it’s crucial to stay informed and make well-informed trading decisions. While this analysis provides valuable insights, it’s essential to use it as a tool to develop your own analysis rather than blindly follow it. Remember to trade wisely and good luck with your investments.