
![Market Analysis Today[2024.04.02]
xlearnonline.com](https://xlearnonline.com/wp-content/uploads/2024/04/Market-Analysis.jpg)
It’s Tuesday, April 2nd, 2024, let’s take a look at the market analysis today.
Key Events Today
We have JOLTS this morning and a few talks from FED members around noon, but nothing serious.
and these stocks have earnings.
Forex
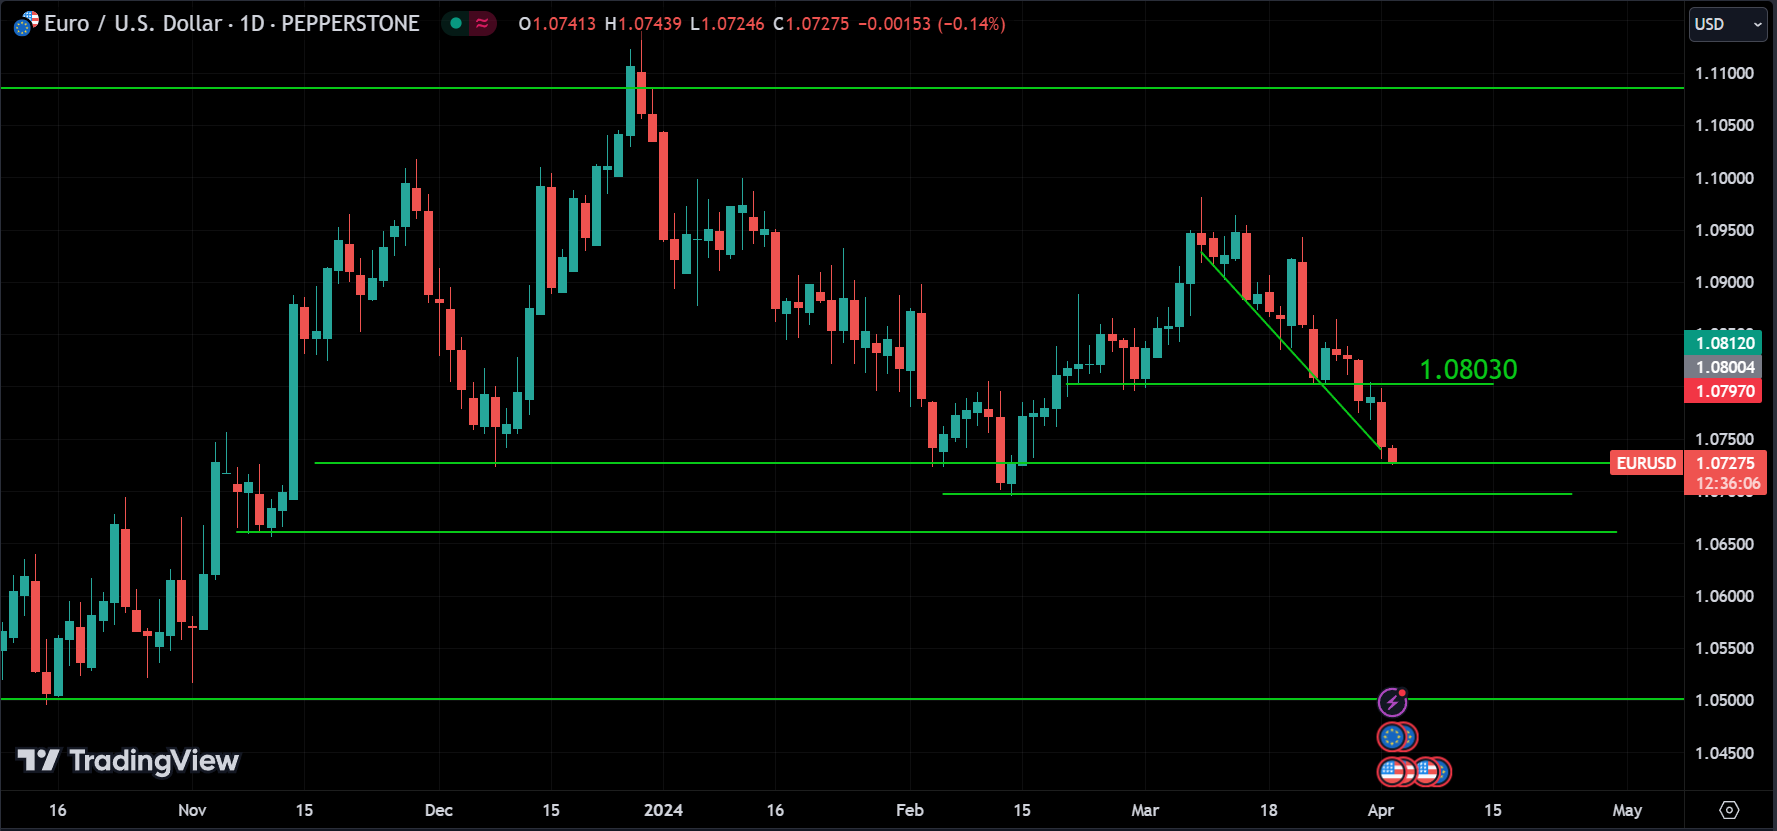
EURUSD is on a downward trend. Like we mentioned yesterday, it’s getting close to a strong support level at 1.07000, with the next support around 1.06610. But we can’t be sure what will happen next. If there’s a turnaround at these levels, it might signal a medium-term uptrend, or the price could drop to 1.05000. We’ll just have to wait and see.
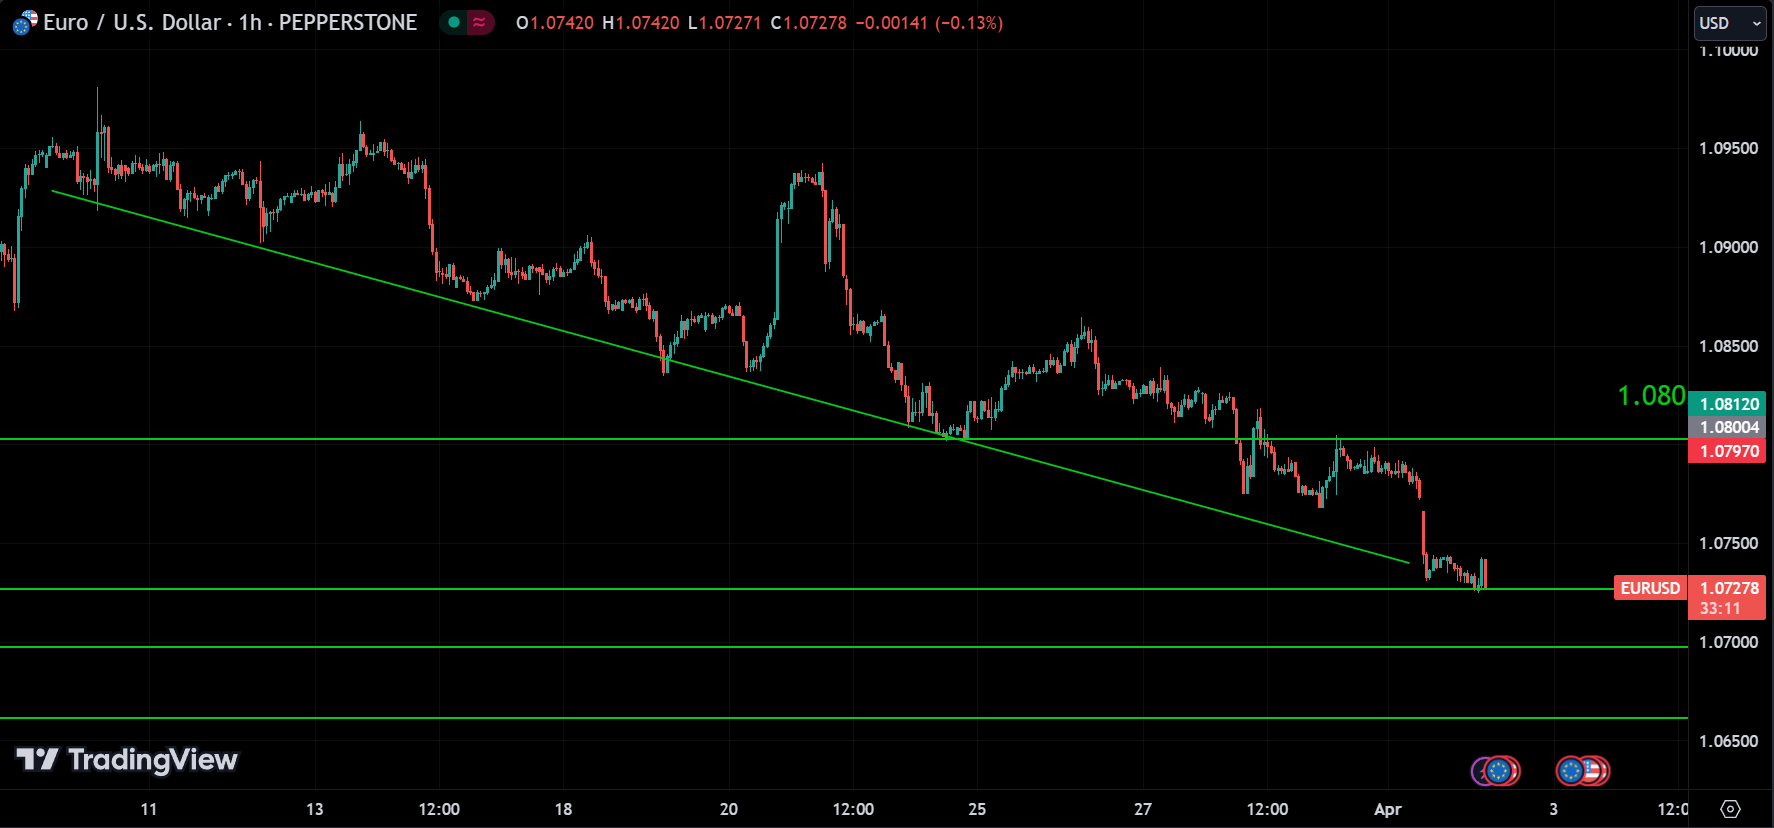
The downward trend remains strong, and it’s currently at a crucial level where we might observe a pullback. However, this doesn’t necessarily signify the end of the trend. Therefore, what we can anticipate at this point is a potential pullback. If it doesn’t occur, there’s a possibility that the price could decline sharply towards key support levels.
Stocks
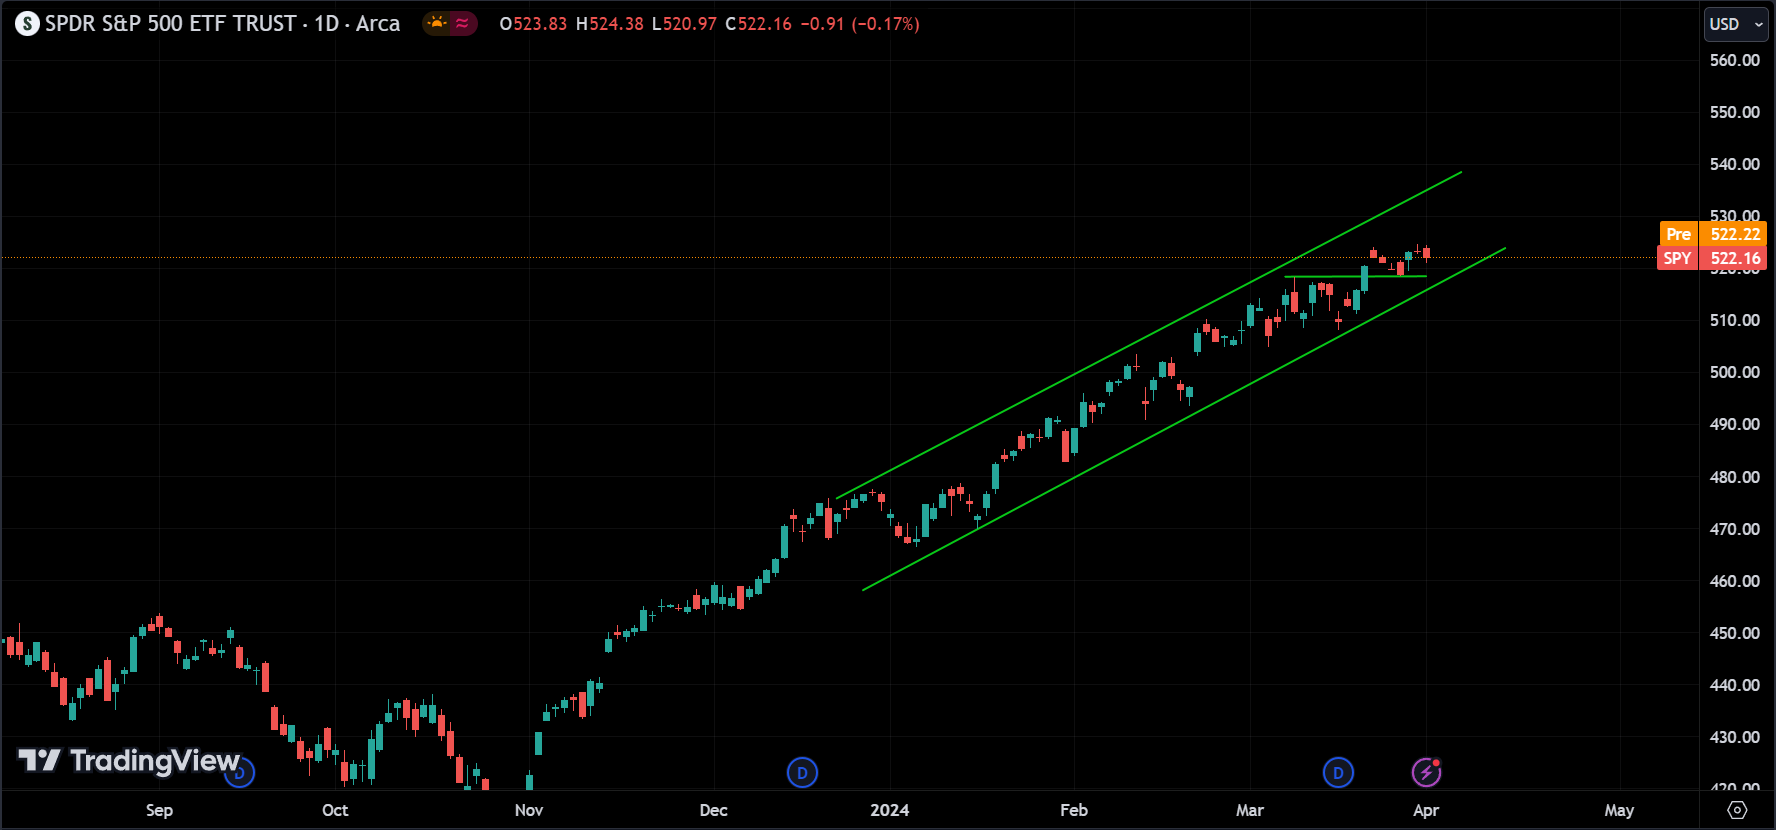
The upward trend remains robust with SPY, and once more, the price is still within the channel. As we mentioned before, there’s a support level around $518, and if it breaks that level and exits the channel, only then can we confirm a bearish trend. Until then, the trend remains bullish. These red days are simply market corrections due to supply and demand dynamics.
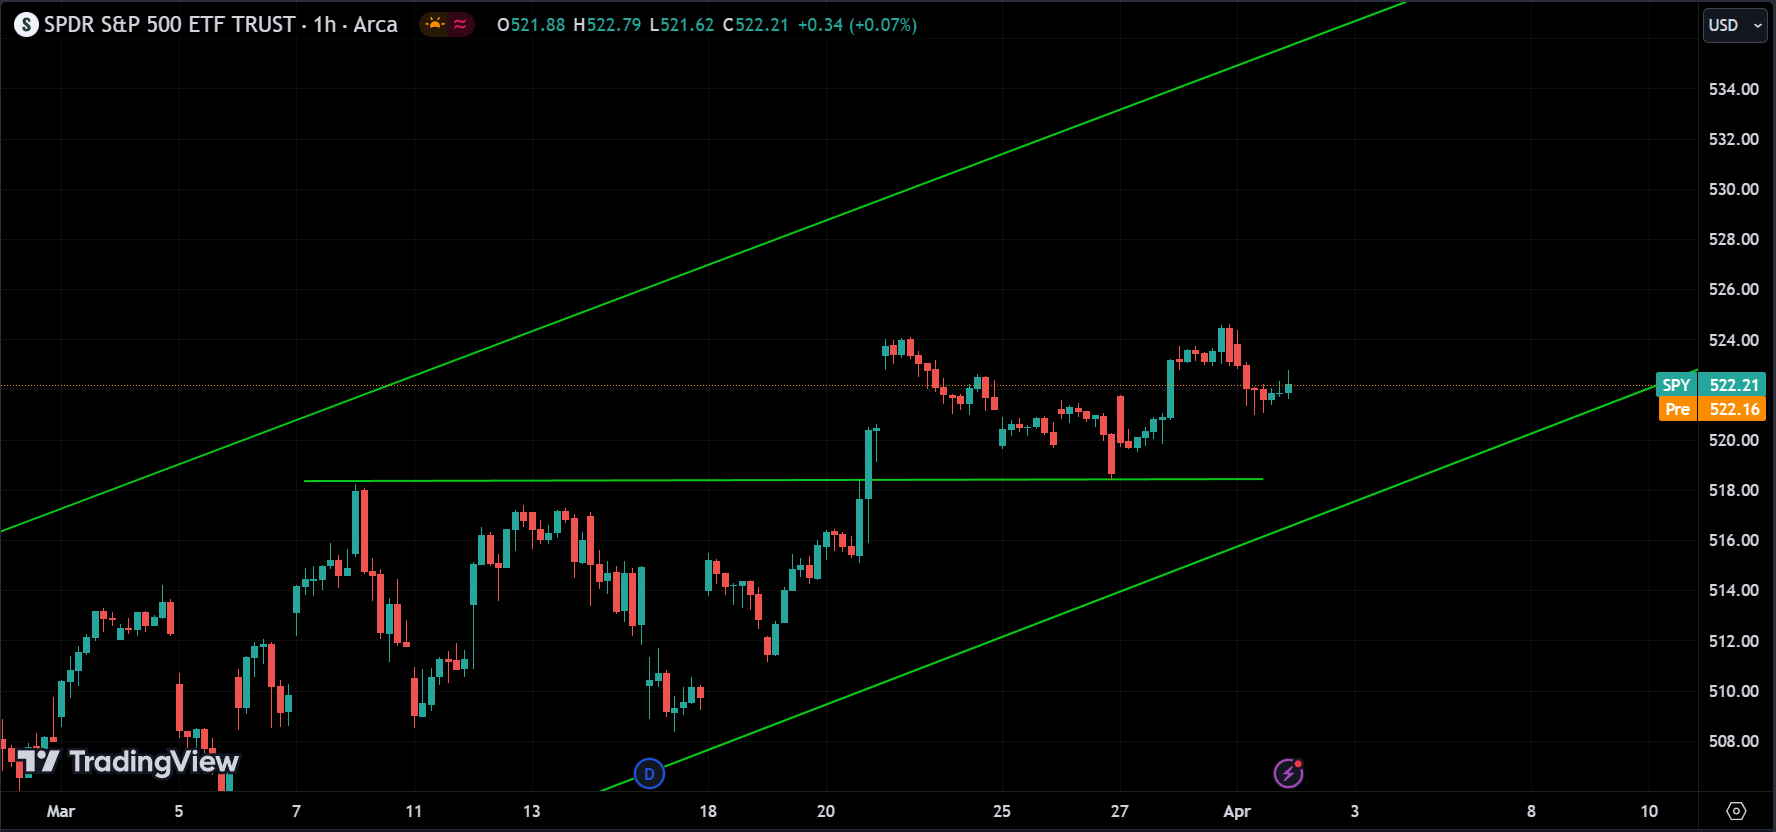
The mid-term trend is sideways, indicating it’s preparing for a breakout either upwards or downwards. The prevailing expectation is for it to break upwards, and perhaps that’s what will unfold. This anticipation stems from the fact that market direction is primarily influenced by the orders people send into the market, rather than news or events. If a large number of people believe the market will rise, it likely will. However, it’s important to note that we shouldn’t solely base our buying or selling decisions on this sentiment. We need to wait and observe what unfolds before taking action.
So, overall market sentiment still feels upward.
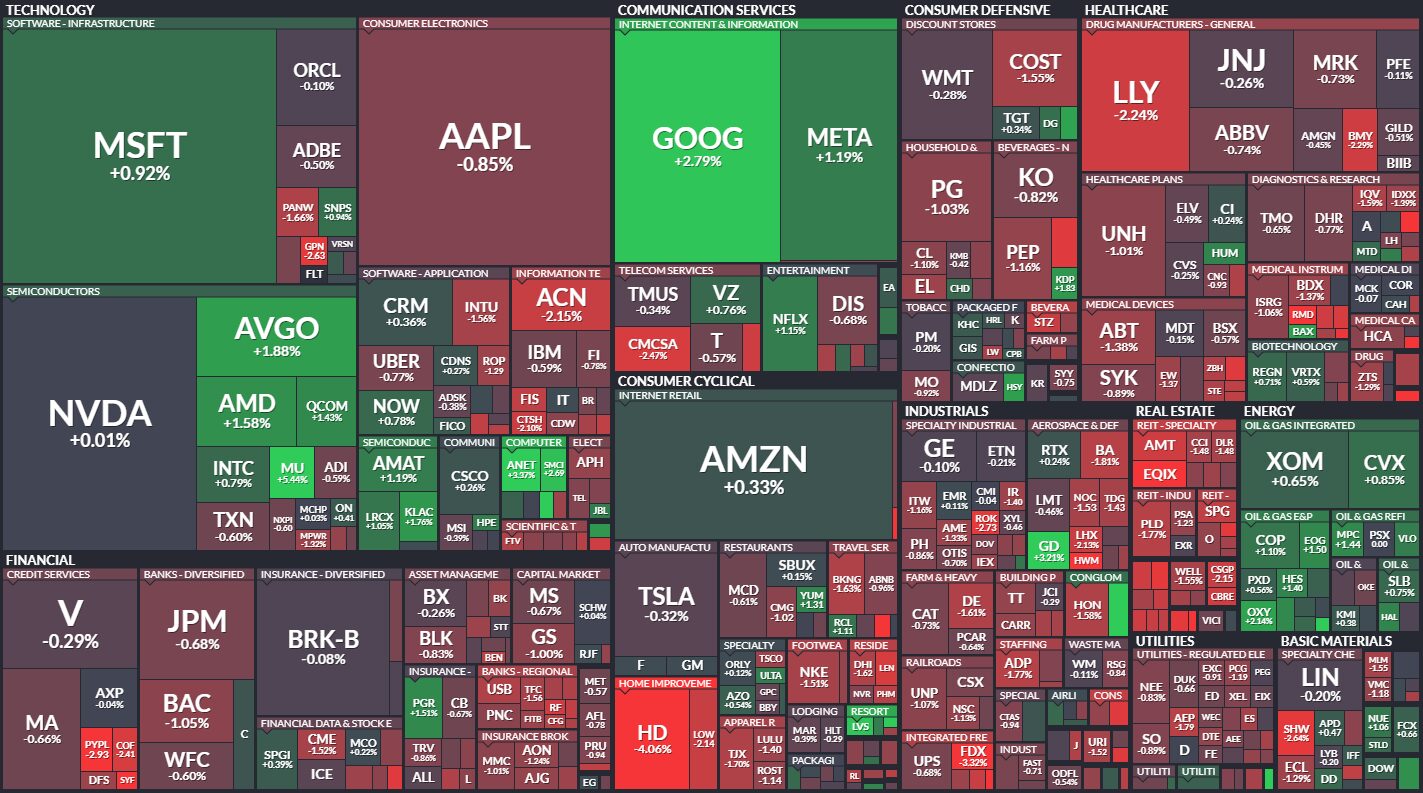
Google is up 2.79%, which is impressive. The energy sector continues to perform strongly, and both the technology and communication sectors are thriving. However, apart from these sectors, the market experienced some losses. On a positive note, chipmakers are also performing well, with Nvidia seeing a slight increase of just 0.01%. It seems like Nvidia might need some room to breathe before its next move lol.
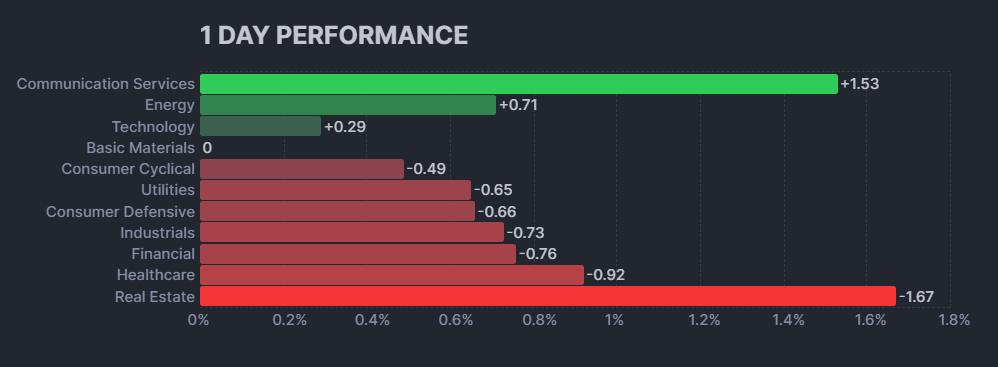
The communication services sector was the strongest performer on the day, rising 1.53%. The energy sector was the second-strongest performer, rising 0.71%. The technology sector rose 0.29%.
Eight of the eleven sectors declined. The real estate sector fell the most, by 1.67%. The healthcare sector fell by 0.92%. The financials sector fell by 0.76%.
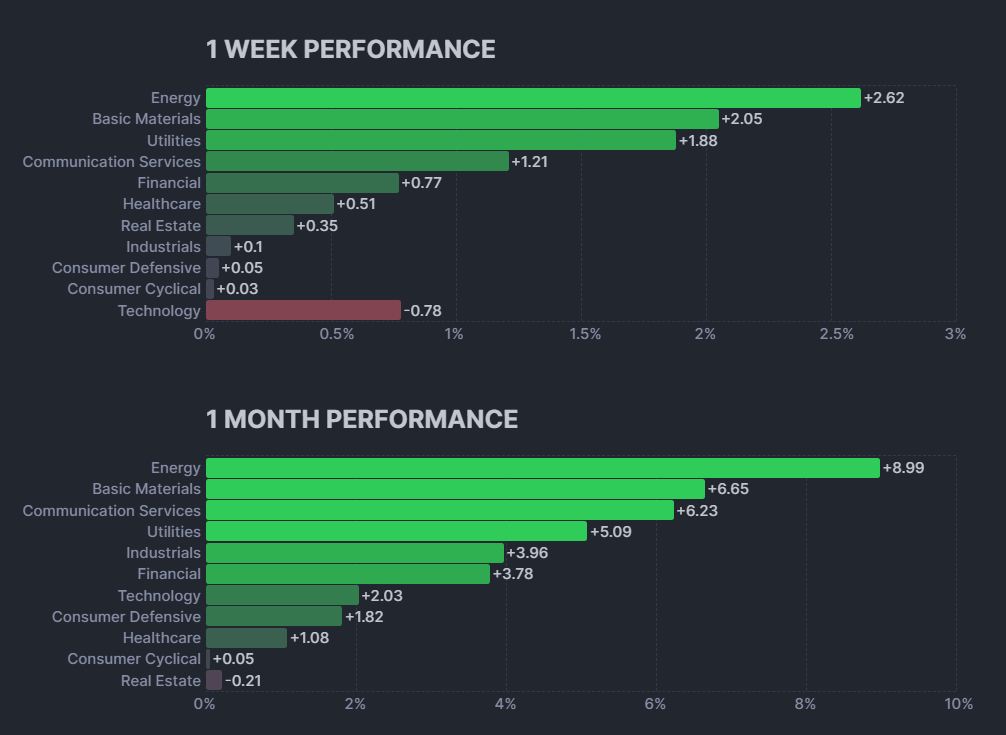
The overall performance of the stock market has been positive over the past month, with all but one sector experiencing gains. The energy sector has been the strongest performer, rising 8.99%. The communication services sector has also performed well, rising 6.23%. However, the technology sector has lagged behind the rest of the market, rising only 2.03%.
Looking at the one-week performance, The energy sector again came out on top, rising 2.62%. Basic materials and utilities also performed well, rising 2.05% and 1.88% respectively. Technology stocks continue to underperform, with the sector falling 0.78% over the week.
So, again keep an eye on energy, it was performing poorly for the last decade, and now it’s starting to shine, and when something is on a trend, the trend lasts.
Crypto
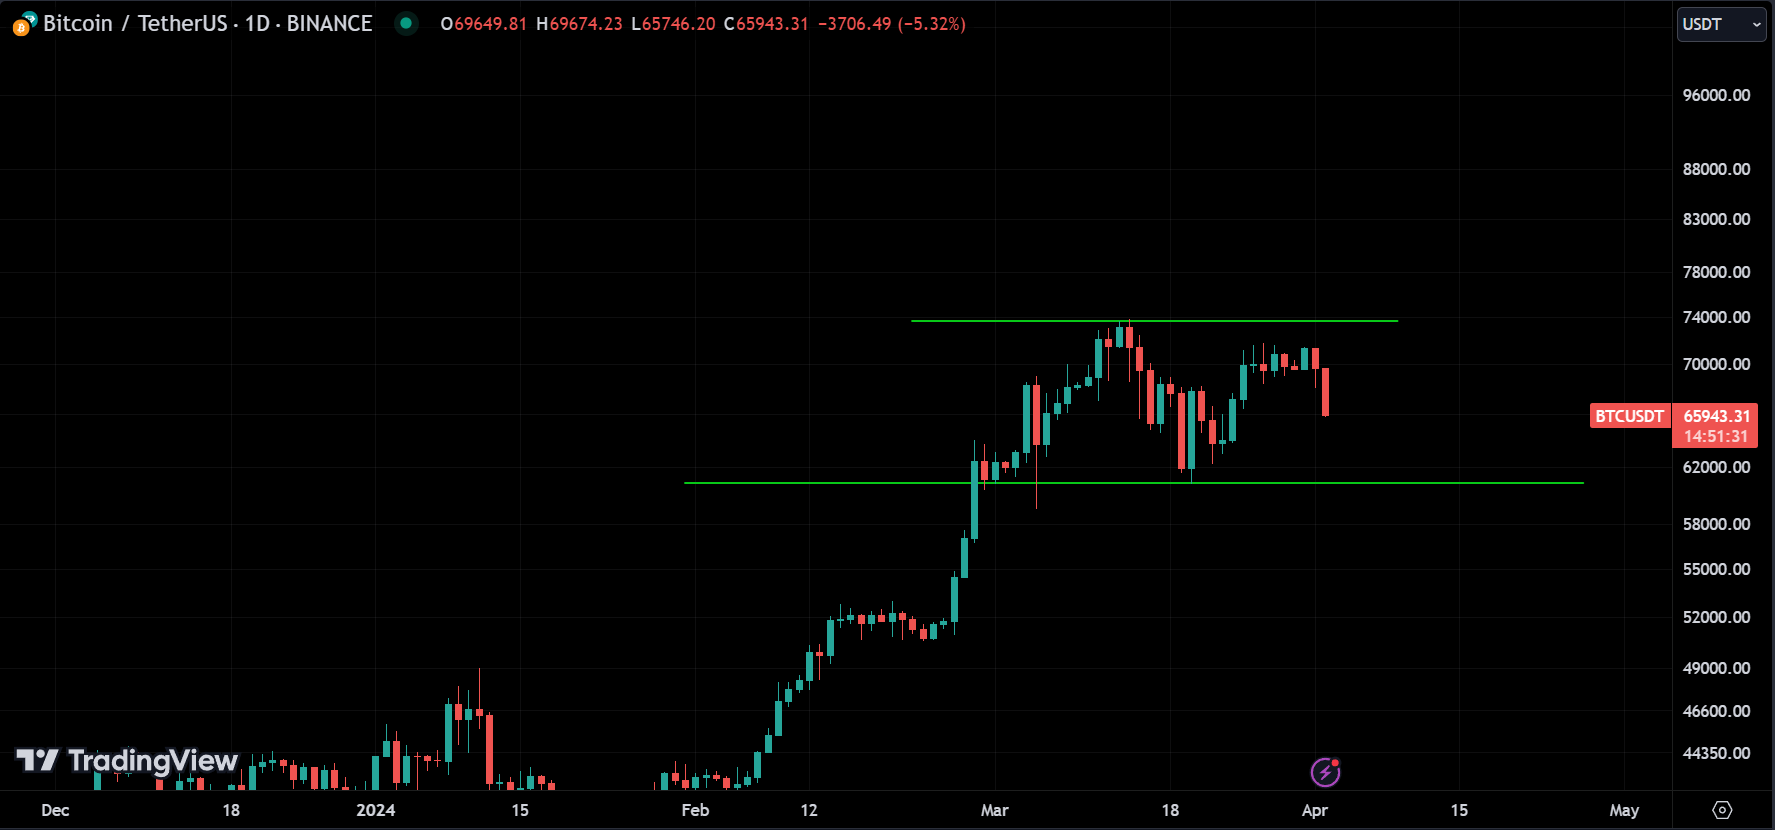
BTC has experienced a slight decline after hovering around 70k for some time, which is quite typical in the crypto realm. However, we can consider 60k as a strong support level. If the price drops below this level, it could indicate that BTC is entering a mid-term bearish trend. Nonetheless, the overall trend remains bullish. Therefore, buying at the 60k mark could be a good opportunity. If it falls below this level, the next support is around 52k, although it seems unlikely to reach that point at the moment. It’s advisable to wait until the 60k range to confirm any decisions regarding crypto investments.
Disclaimer
The information provided in this market analysis is for educational and informational purposes only. It should not be construed as financial advice or a recommendation to buy, sell, or hold any securities or investments.
All investments involve risk, and past performance is not indicative of future results. The analysis provided may not be suitable for all investors and should be used at their own discretion.
Readers are encouraged to conduct their own research.
Trading and investing in financial markets carries inherent risks, including the risk of losing invested capital. It is important to carefully consider your investment objectives, risk tolerance, and financial situation before making any investment decisions.