
![Market Analysis Today[2024.04.03]: Markets Going Bearish?
xlearnonline.com](https://xlearnonline.com/wp-content/uploads/2024/04/market-analysis-today-2024.04.03.jpg)
It’s Wednesday, 3rd of April. Let’s see about the market analysis today.
Key Events Today
We have ADP Non-Farm Employment Change and ISM Services PMI coming out this morning.
Other than that we have a major event that FED Chairman Powell speaks at Stanford’s Business, Government, and Society Forum. This is a volatile news event we have to watch out for.
And these stocks have earnings today.
Forex
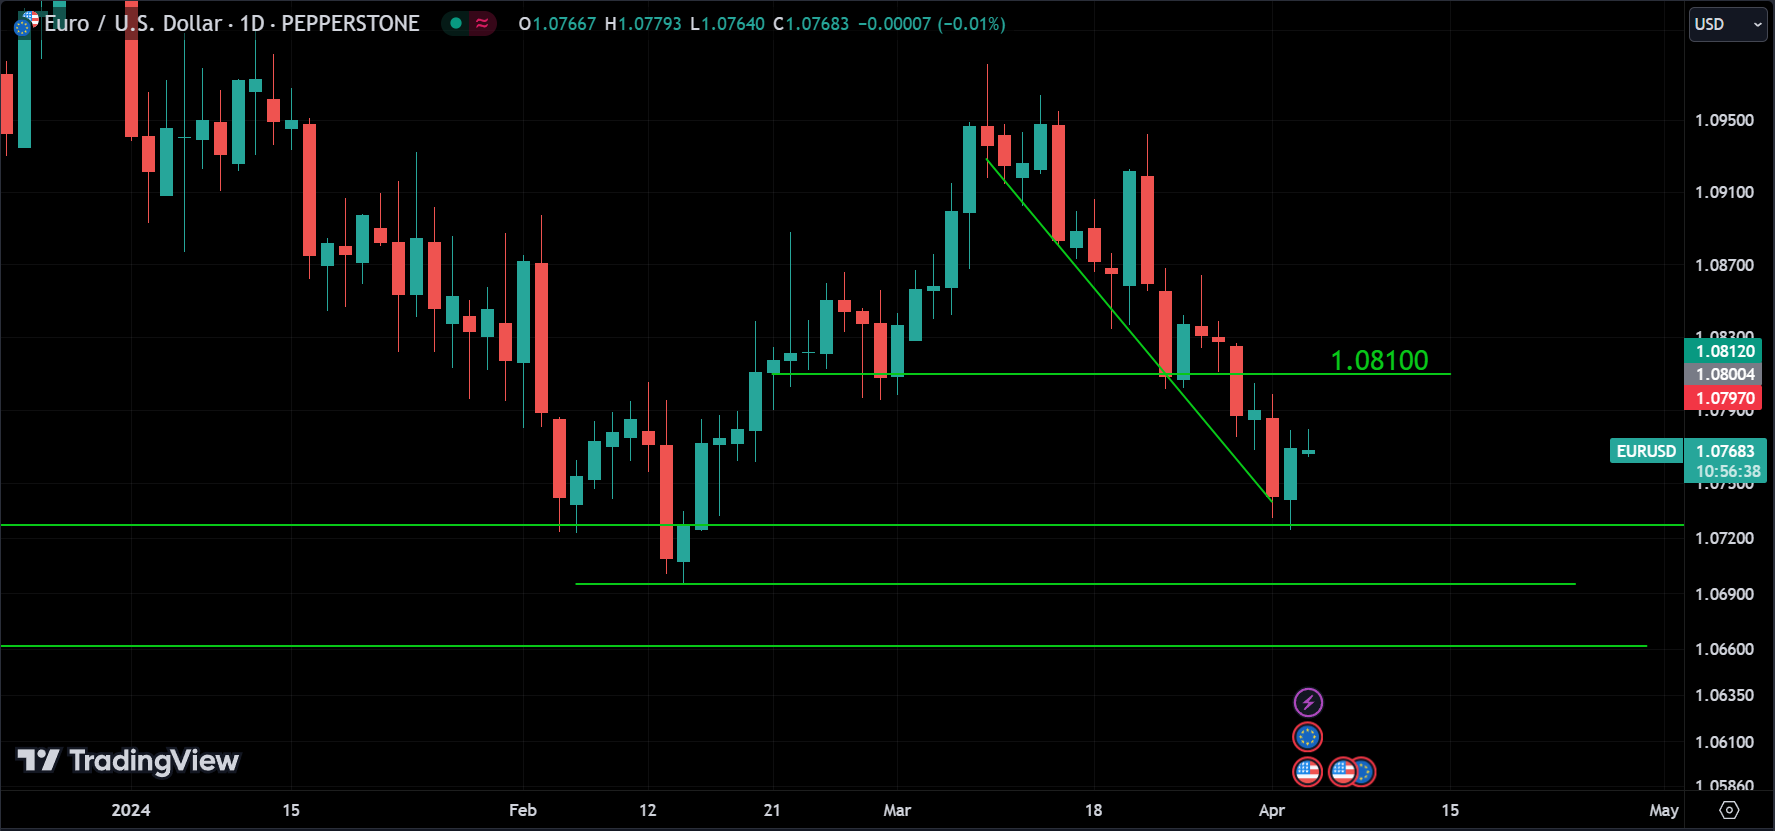
Regarding EURUSD, it didn’t reach the 1.07000 mark; it bounced back earlier. Currently, it’s trading near 1.07678. If it surpasses 1.08100, it could signal a change in trend to an upward direction. Conversely, if the bounce was merely a correction, we might see the price decline to 1.07000 or lower.
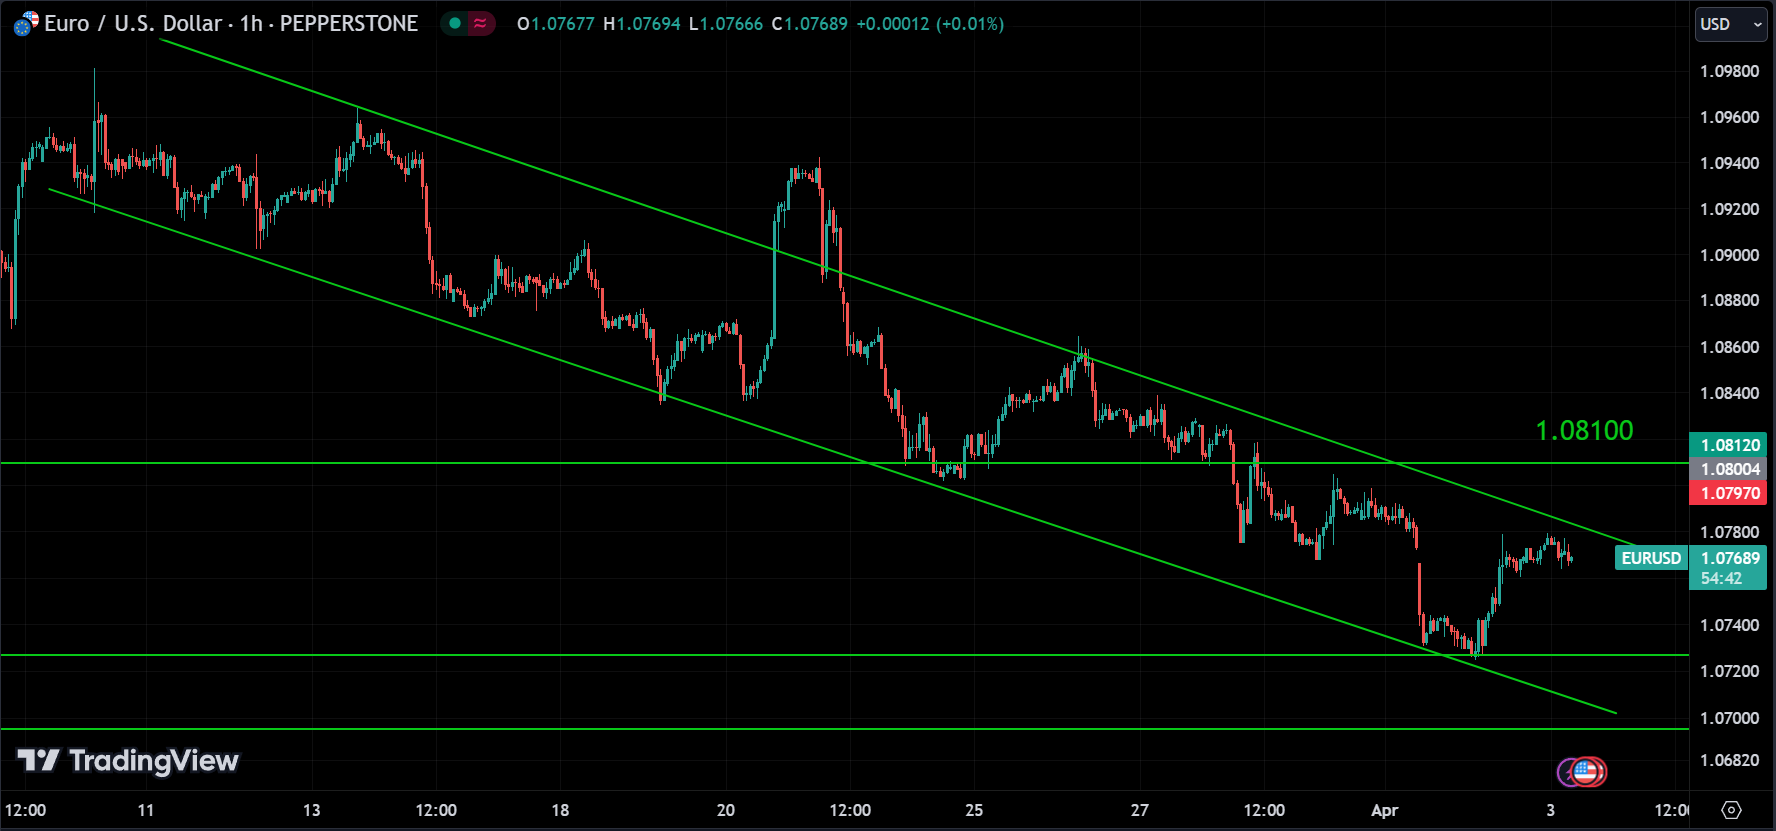
It appears that EURUSD is still within the downtrend channel, suggesting a short-term sideways movement. However, the overall trend remains bearish. We can anticipate either a return to the downtrend with a drop in price or, if it breaks above the upper trend line or the 1.08100 level, it could signify a new uptrend. Therefore, it’s prudent to wait for confirmation before considering a move against the trend. Nonetheless, the overarching sentiment remains bearish.
Stocks
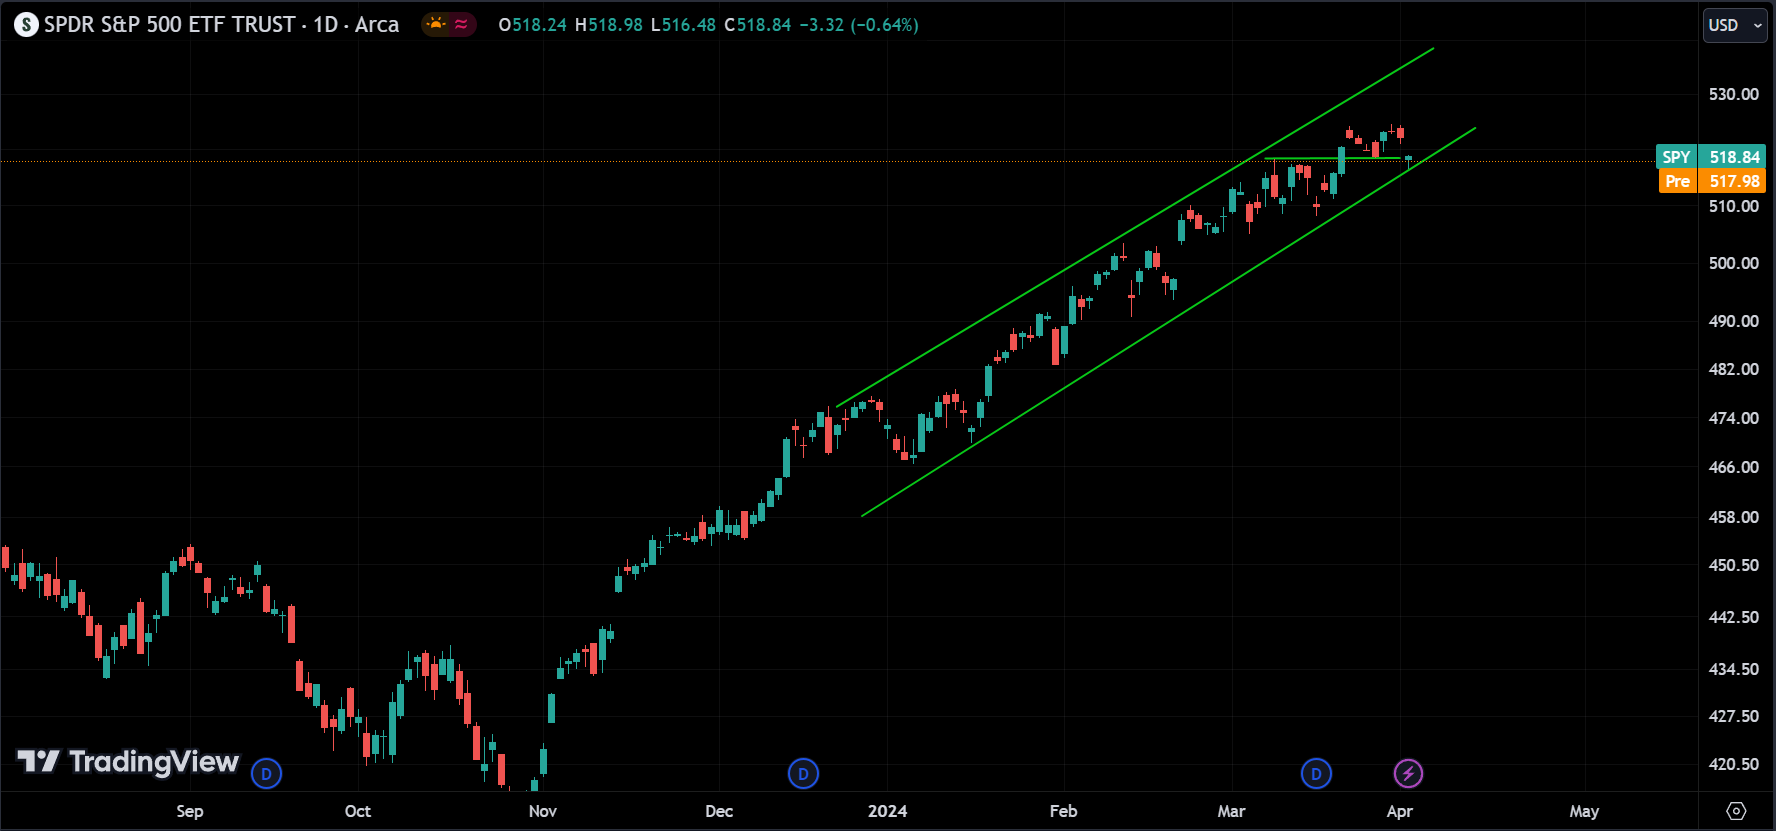
It appears that SPY is still within its channel, but yesterday the market saw a drop towards the downward trendline before retracing. If the price breaks below this channel, it could signal the end of the upward trend and the beginning of a new bearish trend. However, this break has not occurred yet, so we need to wait for confirmation before drawing any conclusions.
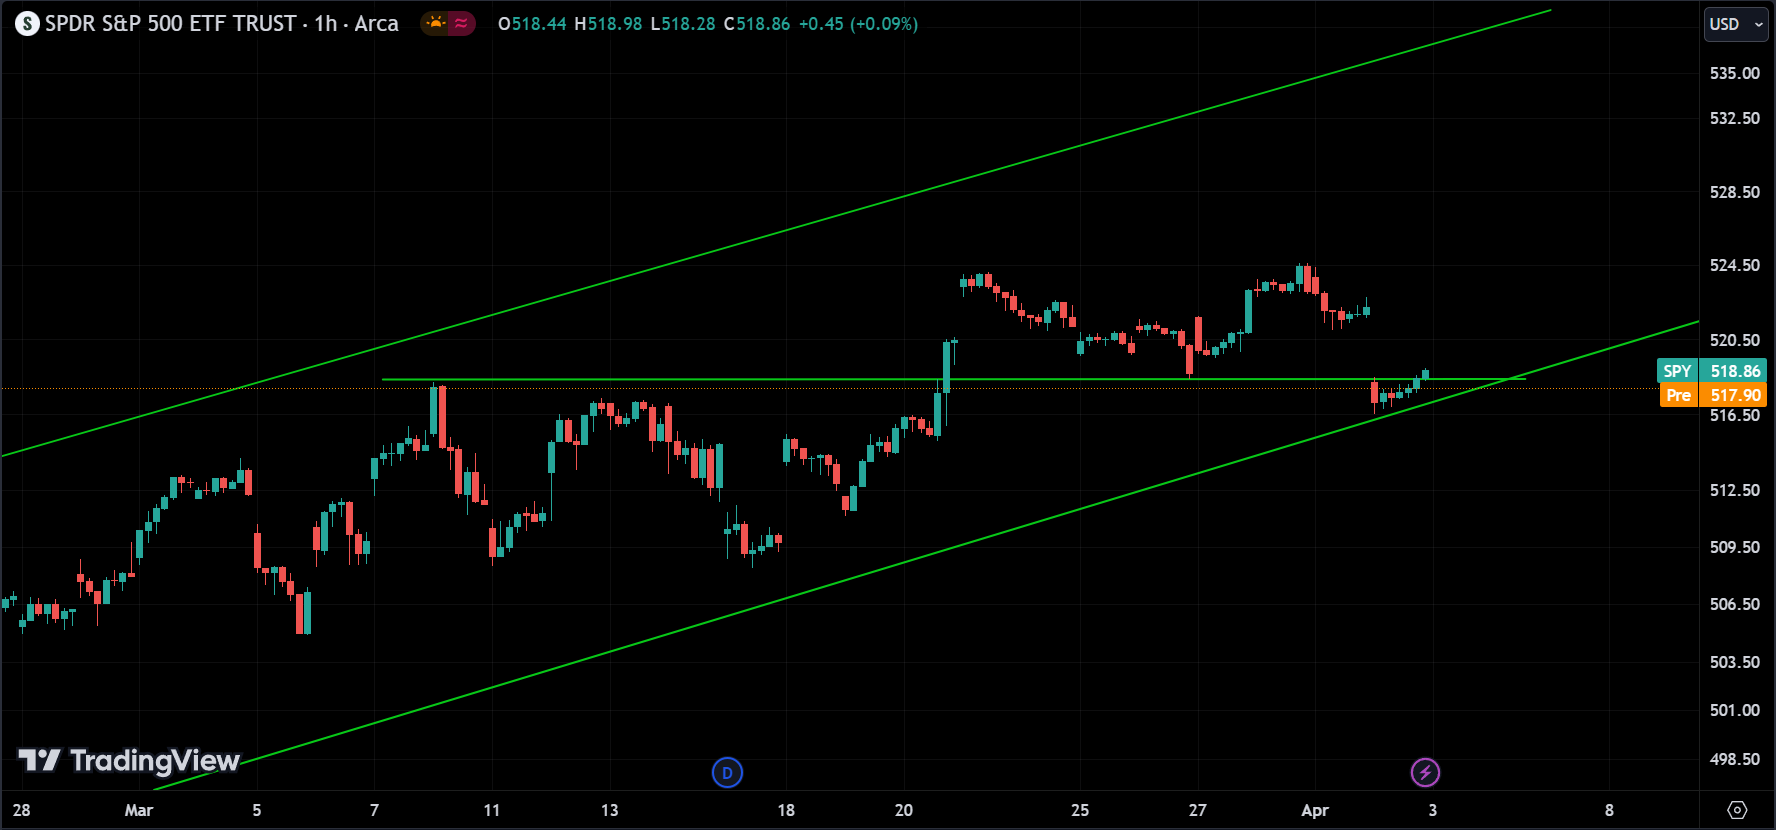
It seems the price broke below the support level but quickly rebounded, suggesting a potential fake breakout scenario. Now, we can anticipate two possibilities for today: either the price continues upwards, reaffirming the existing upward trend and potentially leading to new highs in the coming weeks or days, or it breaks below the lower trendline, indicating the beginning of a new bearish trend, as we discussed earlier. We’ll need to monitor the market closely to see which direction it takes.
Remember, Powell is speaking today, and it’s a significant event that influences the supply and demand in the market.
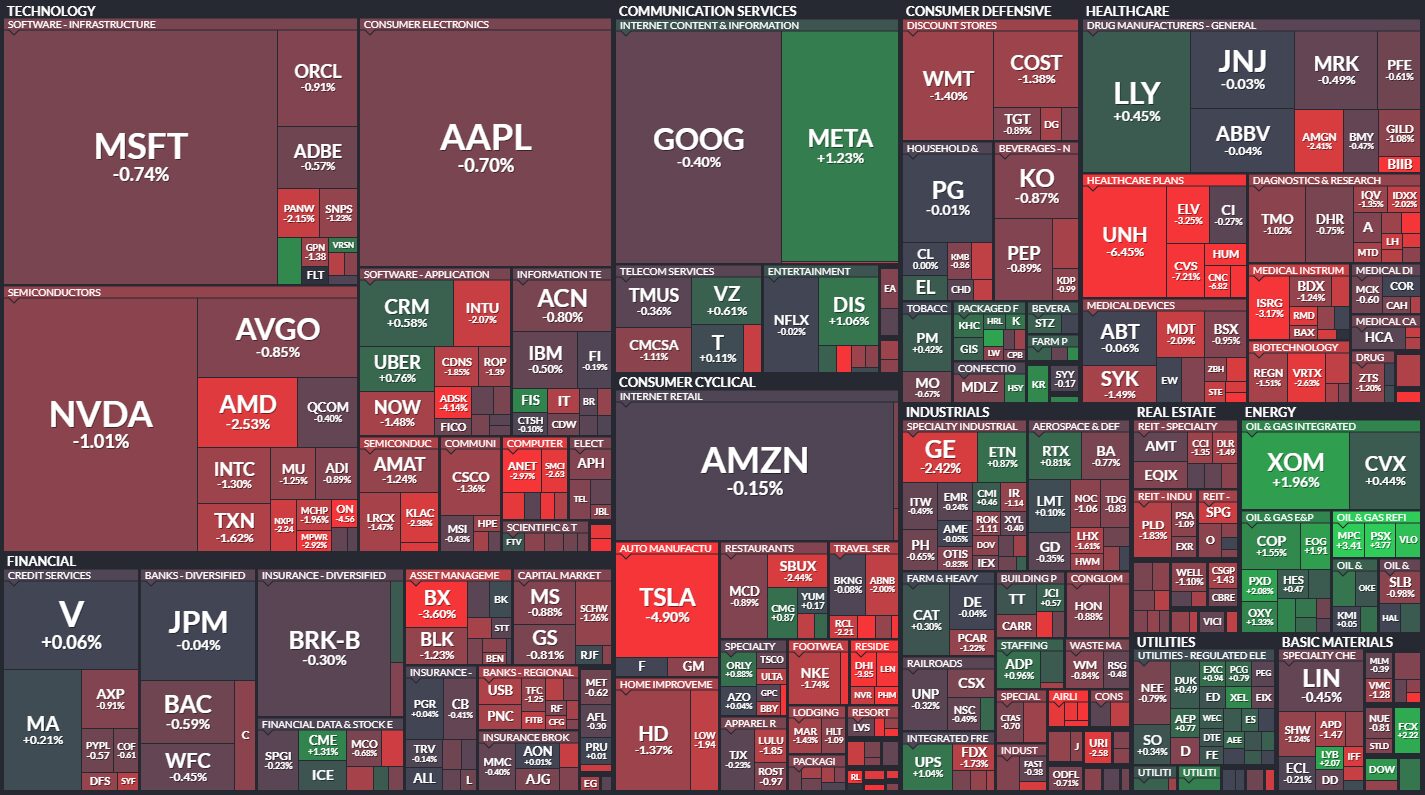
It looks like there was a downturn across the board yesterday, with even Nvidia experiencing a 1% drop. However, the energy sector continues to perform well, almost like it’s taking on a defensive role.
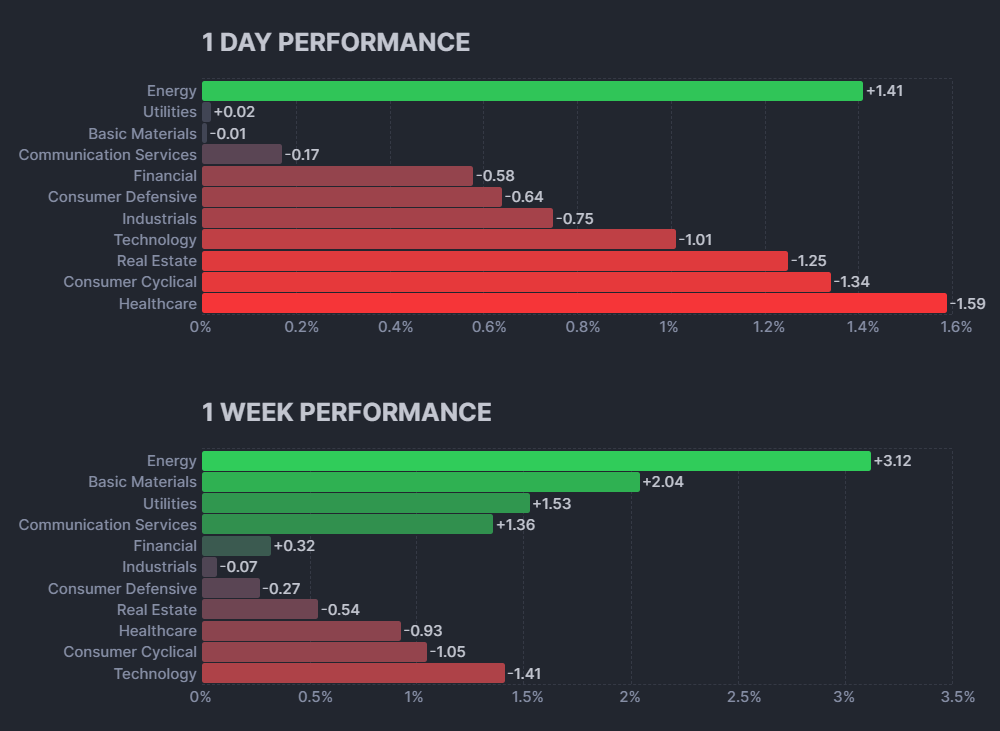
The overall market performance is down for the day with all sectors in the red. The technology sector has declined the most at -1.01%. However, the energy sector is up for the day at +1.41%.
Looking at the one week performance, the energy sector is again in the lead, up +3.12%. Most other sectors are still down for the week, but not by as much as they are for the day. Financials are down -0.32% for the week, and technology is down -1.41%.
Overall, the stock market appears to be down for the day, but has recovered somewhat from last week. The energy sector is the only sector that is up for both the day and the week.
Crypto
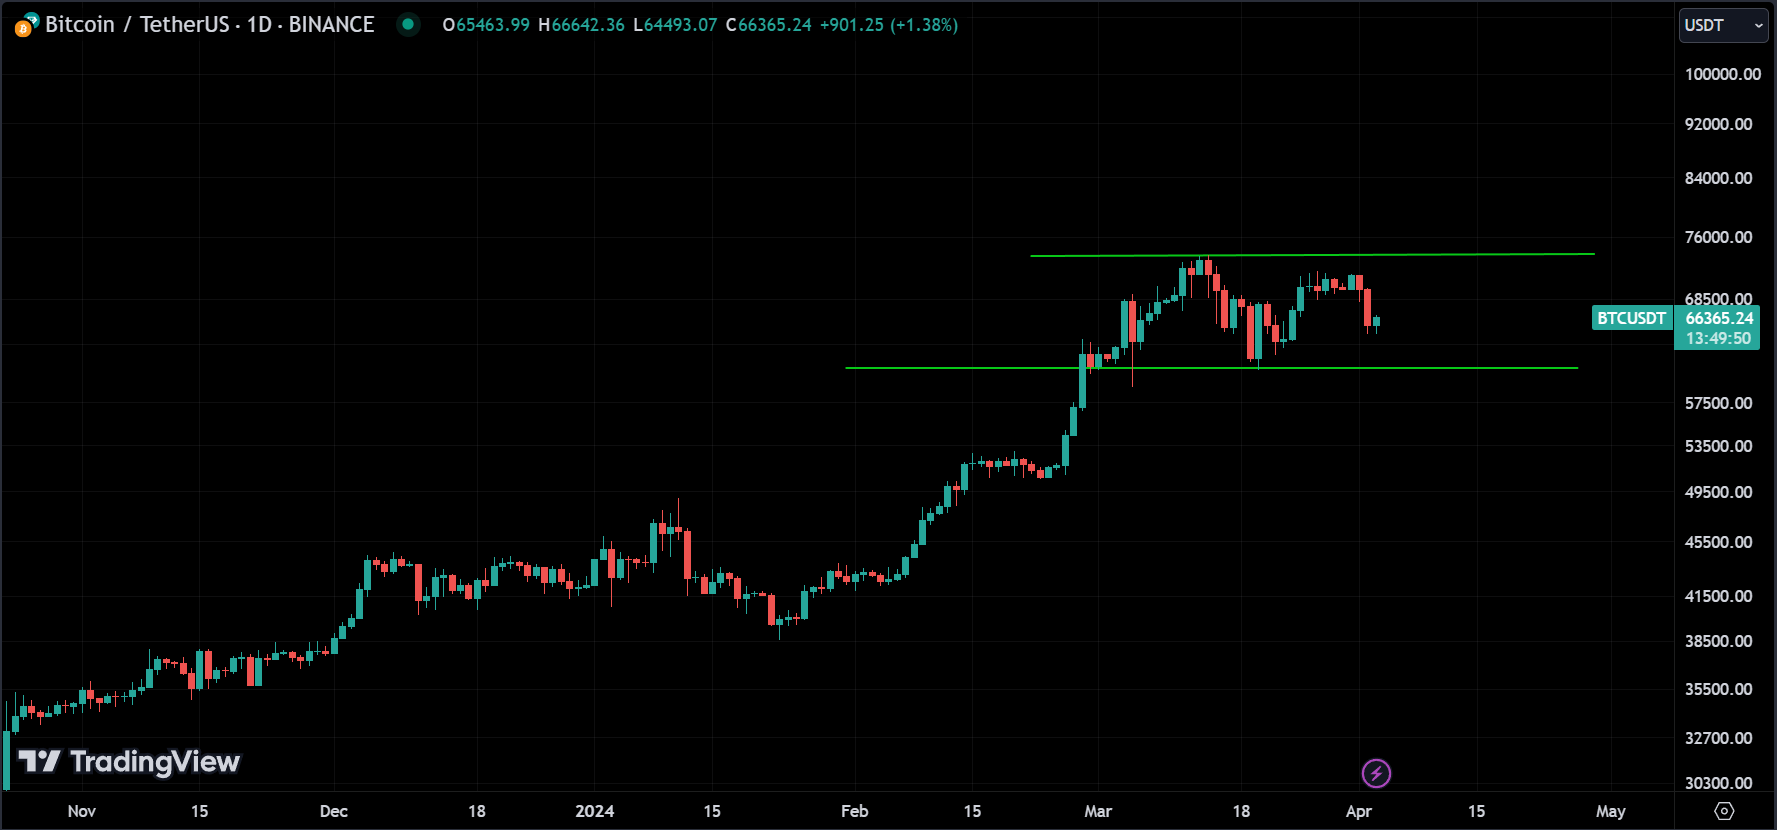
BTC appears to be in a sideways trend, poised for a breakout, which could occur in either direction. If the consolidation period continues, the subsequent breakout is likely to be significant, extending either upward or downward. Currently, the price remains within the sideways channel. Personally, I anticipate an upward breakout, but it may take some time before it materializes.
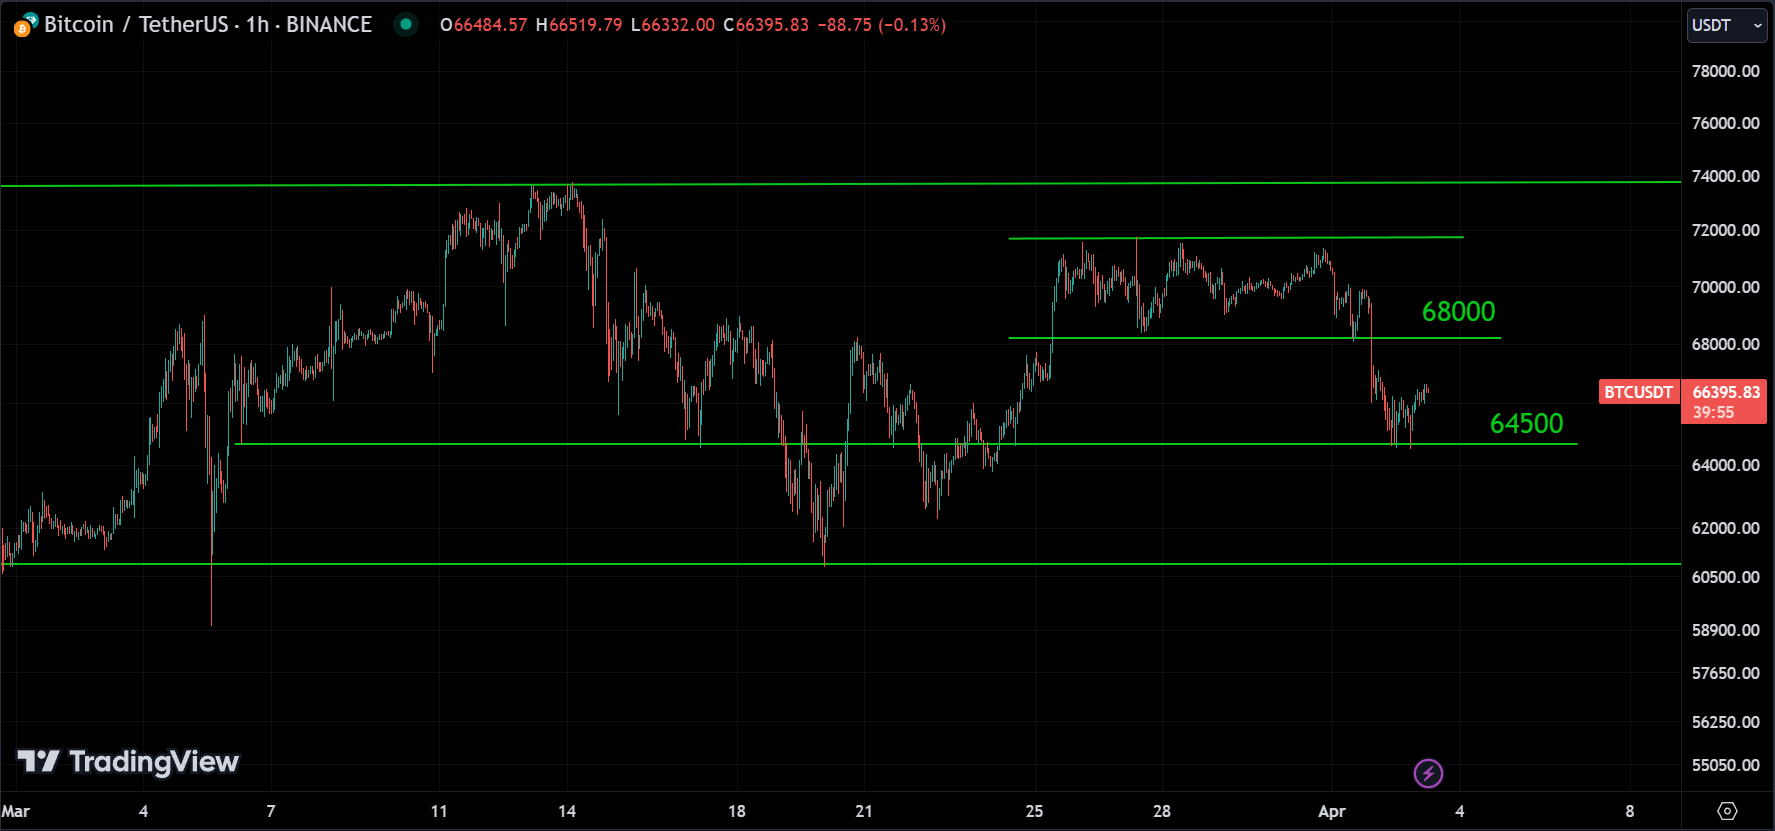
Looking at the 1-hour chart, before the price turned bearish, it underwent a period of consolidation, and the subsequent drop mirrored the consolidation range. This suggests that the drop may have concluded, but uncertainty remains. Currently, we can identify the resistance level around 68000 and the support level at 64500. If the price breaches either of these levels, it will likely determine the direction of its trend continuation.
Disclaimer
The information provided in this market analysis is for educational and informational purposes only. It should not be construed as financial advice or a recommendation to buy, sell, or hold any securities or investments.
All investments involve risk, and past performance is not indicative of future results. The analysis provided may not be suitable for all investors and should be used at their own discretion.
Readers are encouraged to conduct their own research.
Trading and investing in financial markets carries inherent risks, including the risk of losing invested capital. It is important to carefully consider your investment objectives, risk tolerance, and financial situation before making any investment decisions.