![Stock Market Analysis Today [2024.06.26]: S&P 500 Uptrend, Key Sector Movements and Breakouts
xlearnonline.com](https://xlearnonline.com/wp-content/uploads/2024/06/Stock-Market-Analysis-9.png)
Hello there, Welcome to Stock Market Analysis Today!
- S&P 500: The index is in an uptrend, with recent highs at 550 and support around 540. Watch for potential breakouts at these levels.
- Consumer Staples Sector: Uptrend with a sideways movement, support at 76, and resistance at 78.65.
- Energy Sector: In a downtrend, with support around 87. The price is trending down within a channel.
- Materials Sector: Broke its uptrend support, now with support at 88 and resistance at 94.
- Industrials Sector: Consolidating between 120 and 126.
- Consumer Discretionary Sector: Moving sideways, with major support around 168 and resistance at 184.
- Healthcare Sector: Consolidating, with major support around 138 and resistance at 148.
- Financial Sector: Trending up, but recently broke support. Watch for resistance at 41.70.
- Technology Sector: Continues its uptrend with corrections expected, support around 220.
- Communications Sector: Leading the pack and at an all-time high. Support around 85.50.
- Utilities Sector: Dropping, trading below the 70 support with the next support around 66.
- Real Estate Sector: Consolidating between 36 and 41
Key Trading Events Today
These events encompass important global news, macroeconomic reports, and economic indicators. For more details, you can check the Bloomberg Calendar.
- At around 10:30 AM ET, the Crude Oil Inventories report is expected. The forecast is -2.600M, compared to the previous -2.547M. This report may cause some volatility in energy and oil stocks.
Stocks with Earnings:
S&P 500
![SPY Stock Market Analysis Today [2024.06.26]
xlearnonline.com](https://xlearnonline.com/wp-content/uploads/2024/06/SPY-D-11.png)
The market is still moving upward. The last high was 550, and it recently pulled back from that level. We can expect the upward momentum to continue.
![SPY Stock Market Analysis Today [2024.06.26]
xlearnonline.com](https://xlearnonline.com/wp-content/uploads/2024/06/SPY-H-11.png)
On the 1-hour chart, you can see support around the 540 level, with the price currently trading just above it. We can expect the price to find support there and start going up. If the price breaks this level, we can look for the next support around 532.
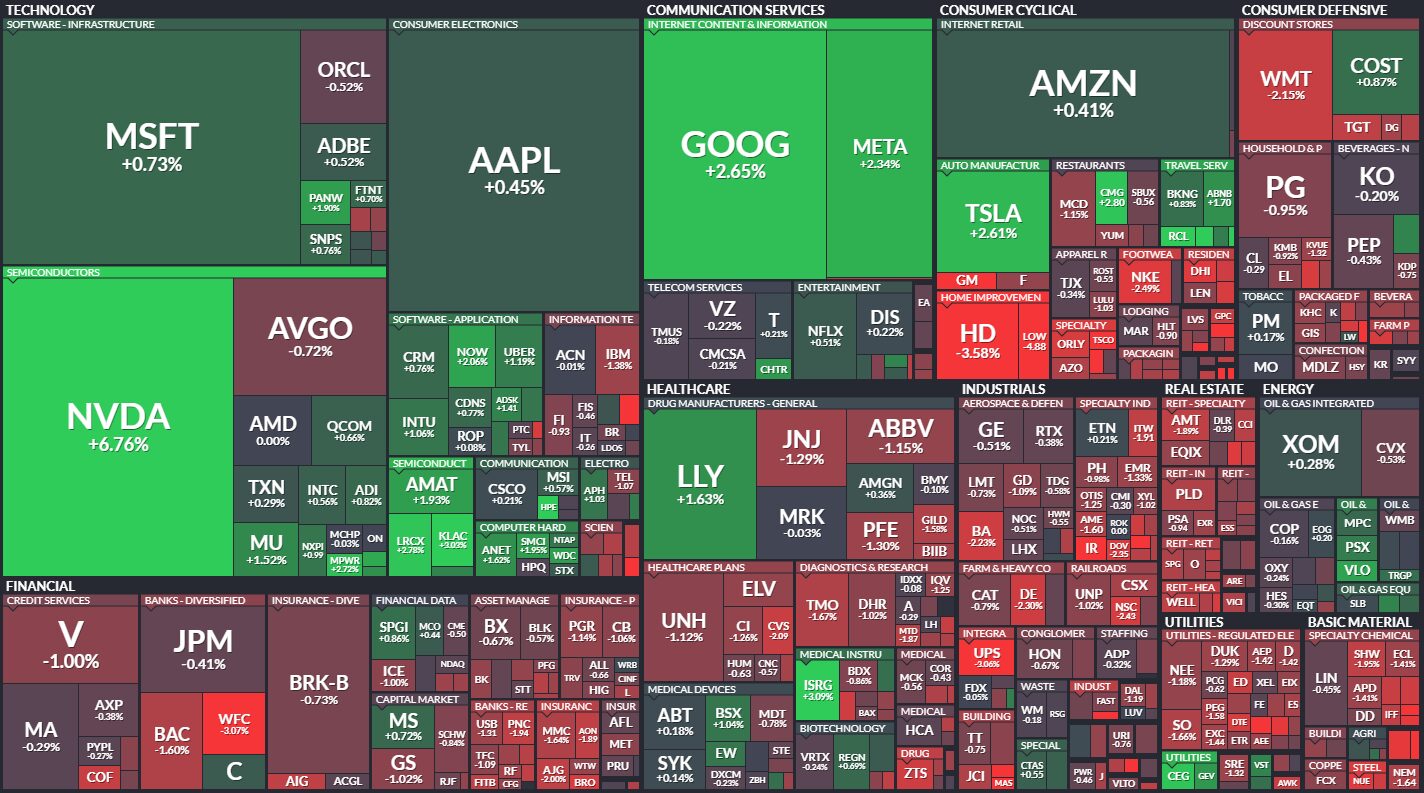
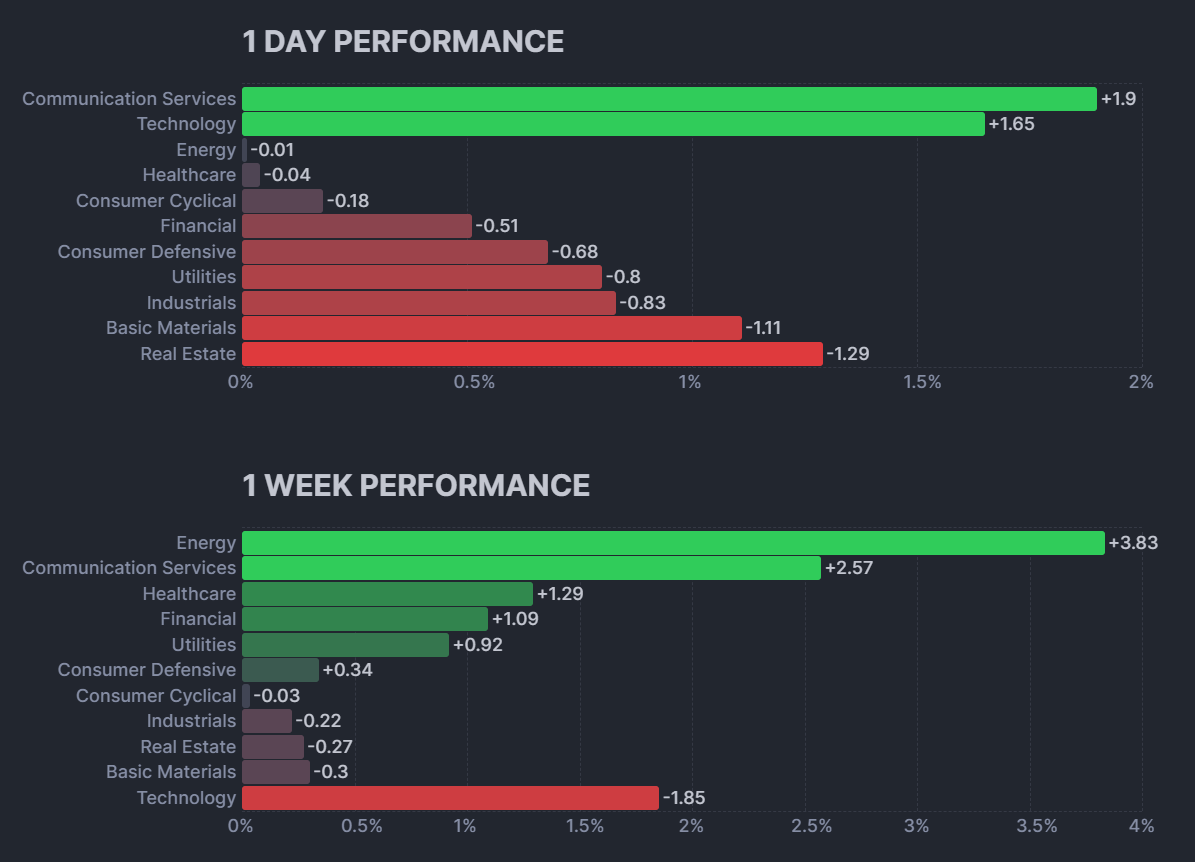
It looks like NVDA is back on track, and GOOG, META, and TSLA also gained in value. The tech and communications sectors did well, while the other sectors performed poorly. Now, let’s take a closer look at the sector performance.
Consumer Staples Sector(XLP):
![XLP Stock Market Analysis Today [2024.06.26]
xlearnonline.com](https://xlearnonline.com/wp-content/uploads/2024/06/XLP-D-10.png)
Looking at the Consumer Staples Sector, it is still in an uptrend, though there is a medium-term sideways trend happening.
![XLP Stock Market Analysis Today [2024.06.26]
xlearnonline.com](https://xlearnonline.com/wp-content/uploads/2024/06/XLP-H-11.png)
On the 1-hour chart, you can clearly see the sideways trend. The major support is at 76, and the resistance is at 78.65. If the price breaks above the resistance, we can expect it to continue rising before pulling back. If the price breaks below the support, the trend could change to a downtrend, and the price may drop. Watch for breakouts; if there are no breakouts, the price will stay within the sideways channel.
Energy Sector(XLE):
![XLE Stock Market Analysis Today [2024.06.26]
xlearnonline.com](https://xlearnonline.com/wp-content/uploads/2024/06/XLE-D-11.png)
Looking at the Energy sector, it’s crashing. The major support is around 87, and you can clearly see the price trending down within a channel.
![XLE Stock Market Analysis Today [2024.06.26]
xlearnonline.com](https://xlearnonline.com/wp-content/uploads/2024/06/XLE-H-11.png)
Now, looking at the 1-hour chart, the price is at the resistance level. We can expect the price to either pull back from this level and drop to the support or break the resistance and continue going up. If the price breaks the resistance, the downtrend is over, and the market will turn bullish.
Materials Sector(XLB):
![XLB Stock Market Analysis Today [2024.06.26]
xlearnonline.com](https://xlearnonline.com/wp-content/uploads/2024/06/XLB-D-11.png)
Looking at the Materials sector, it broke the major support line. This means it is now either in a sideways trend or a downtrend.
![XLB Stock Market Analysis Today [2024.06.26]
xlearnonline.com](https://xlearnonline.com/wp-content/uploads/2024/06/XLB-H-11.png)
Looking at the 1-hour chart, the price is near the support. We can expect the price to either pull back and go up or break the support and fall further. Watch out for breakouts.
Industrial Sector(XLI):
![XLI Stock Market Analysis Today [2024.06.26]
xlearnonline.com](https://xlearnonline.com/wp-content/uploads/2024/06/XLI-D-11.png)
Looking at the Industrials sector, it’s consolidating. The major support is around 120, and the major resistance is around 126.
![XLI Stock Market Analysis Today [2024.06.26]
xlearnonline.com](https://xlearnonline.com/wp-content/uploads/2024/06/XLI-H-11.png)
Looking at the 1-hour chart, the price is pulling back from the resistance level around 124. We can expect it to find support around 120 and then start going back up, as the overall trend is sideways. If the price breaks this support level, it means the trend is going down. So, watch out for breakouts.
Consumer Discretionary Sector(XLY):
![XLY Stock Market Analysis Today [2024.06.26]
xlearnonline.com](https://xlearnonline.com/wp-content/uploads/2024/06/XLY-D-10.png)
Looking at the Consumer Discretionary sector, it is also moving sideways. The major resistance is around 184, and the major support is around 168.
![XLY Stock Market Analysis Today [2024.06.26]
xlearnonline.com](https://xlearnonline.com/wp-content/uploads/2024/06/XLY-H-9.png)
Now, looking at the 1-hour chart, you can see that after breaking the resistance, the price went up and then pulled back to the resistance level. We can expect the price to either start going up from this resistance to the next resistance around 185, or it could break below this resistance and continue to fall. Watch out for breakouts.
Healthcare Sector(XLV):
![XLV Stock Market Analysis Today [2024.06.26]
xlearnonline.com](https://xlearnonline.com/wp-content/uploads/2024/06/XLV-D-9.png)
Looking at the Healthcare sector, it’s also in a sideways trend and is near the resistance level of 148.
![XLV Stock Market Analysis Today [2024.06.26]
xlearnonline.com](https://xlearnonline.com/wp-content/uploads/2024/06/XLV-H-10.png)
Now, looking at the 1-hour chart, you can see the price is very close to the resistance. We can expect the price to either pull back from this resistance and fall to the support, or it could break this level and continue going up.
Financials Sector(XLF):
![XLF Stock Market Analysis Today [2024.06.26]
xlearnonline.com](https://xlearnonline.com/wp-content/uploads/2024/06/XLF-D-9.png)
Looking at the Financial sector, it’s trending up, but it looks like it broke the support level and then got back above it.
![XLF Stock Market Analysis Today [2024.06.26]
xlearnonline.com](https://xlearnonline.com/wp-content/uploads/2024/06/XLF-H-10.png)
Looking at the 1-hour chart, you can see a resistance level where the price is pulling back and going down. It seems like the breakout is real, so we can expect the price to keep dropping from this level.
Technology Sector(XLK):
![XLK Stock Market Analysis Today [2024.06.26]
xlearnonline.com](https://xlearnonline.com/wp-content/uploads/2024/06/XLK-D-9.png)
Looking at the Technology sector, it’s going up. It pulled back from a high, and there’s support around 220. We can expect the price to continue rising from its current level or from the support.
![XLK Stock Market Analysis Today [2024.06.26]
xlearnonline.com](https://xlearnonline.com/wp-content/uploads/2024/06/XLK-H-10.png)
Looking at the 1-hour chart, you can see the price is pulling back from the support level. We can expect it to continue up to the resistance before pulling back again. A breakout is likely in this situation. If the price breaks above the resistance, it should keep going up. If it breaks below the support, the price could crash. So, watch out for breakouts.
Communications Sector(XLC):
![XLC Stock Market Analysis Today [2024.06.26]
xlearnonline.com](https://xlearnonline.com/wp-content/uploads/2024/06/XLC-D-9.png)
Looking at the Communication sector, it’s leading the pack and is at its all-time high. We can expect the momentum to continue.
![XLC Stock Market Analysis Today [2024.06.26]
xlearnonline.com](https://xlearnonline.com/wp-content/uploads/2024/06/XLC-H-10.png)
Looking at the 1-hour chart, there’s support around the 85.50 level. If the price pulls back, it should find support here and continue going up. If it breaks below this level, the momentum isn’t strong, and the trend could change.
Utility Sector(XLU):
![XLU Stock Market Analysis Today [2024.06.26]
xlearnonline.com](https://xlearnonline.com/wp-content/uploads/2024/06/XLU-D-9.png)
Looking at the Utilities sector, it’s going down and has broken the support around 70. The next support is around the 66 level.
![XLU Stock Market Analysis Today [2024.06.26]
xlearnonline.com](https://xlearnonline.com/wp-content/uploads/2024/06/XLU-H-9.png)
Looking at the 1-hour chart, you can see the price broke the support, went down, pulled back to the support, went down again, pulled back to the support, and is now going down. The resistance is strong, so we can expect the price to continue to the next support around 66.
Real Estate Sector(XLRE):
![XLRE Stock Market Analysis Today [2024.06.26]
xlearnonline.com](https://xlearnonline.com/wp-content/uploads/2024/06/XLRE-D-10.png)
Looking at the Real Estate sector, it’s in a downtrend. The major resistance is around 40.50, and the major support is around 36.
![XLRE Stock Market Analysis Today [2024.06.26]
xlearnonline.com](https://xlearnonline.com/wp-content/uploads/2024/06/XLRE-H-10.png)
Looking at the 1-hour chart, you can see the price is pulling back from the resistance level. We can expect it to go down to the support level before pulling back up again. Watch out for breakouts.
Conclusion & Disclaimer
Please provide your feedback on how we can improve this article. Thank you!
These analyses are here to help you understand how to analyze the market. They’re not about giving buy or sell signals. It’s simply about observing market behavior. I don’t recommend when to buy or sell because trading doesn’t work that way. You need a strategy to guide your decisions about when to enter or exit positions. That’s the key to making consistent profits in the financial markets over time.
We discussed these sectors and markets because when the entire market or sector goes through certain movements, most of the stocks within that market will also experience similar movements. So, by understanding what the market is doing, you can conduct your own analysis on specific coins or stocks.
The information provided in this market analysis is for educational and informational purposes only. It should not be construed as financial advice or a recommendation to buy, sell, or hold any securities or investments.
All investments involve risk, and past performance is not indicative of future results. The analysis provided may not be suitable for all investors and should be used at their own discretion.
Readers are encouraged to conduct their own research.
Trading and investing in financial markets carry inherent risks, including the risk of losing invested capital. It is important to carefully consider your investment objectives, risk tolerance, and financial situation before making any investment decisions.
GOOD LUCK!!!