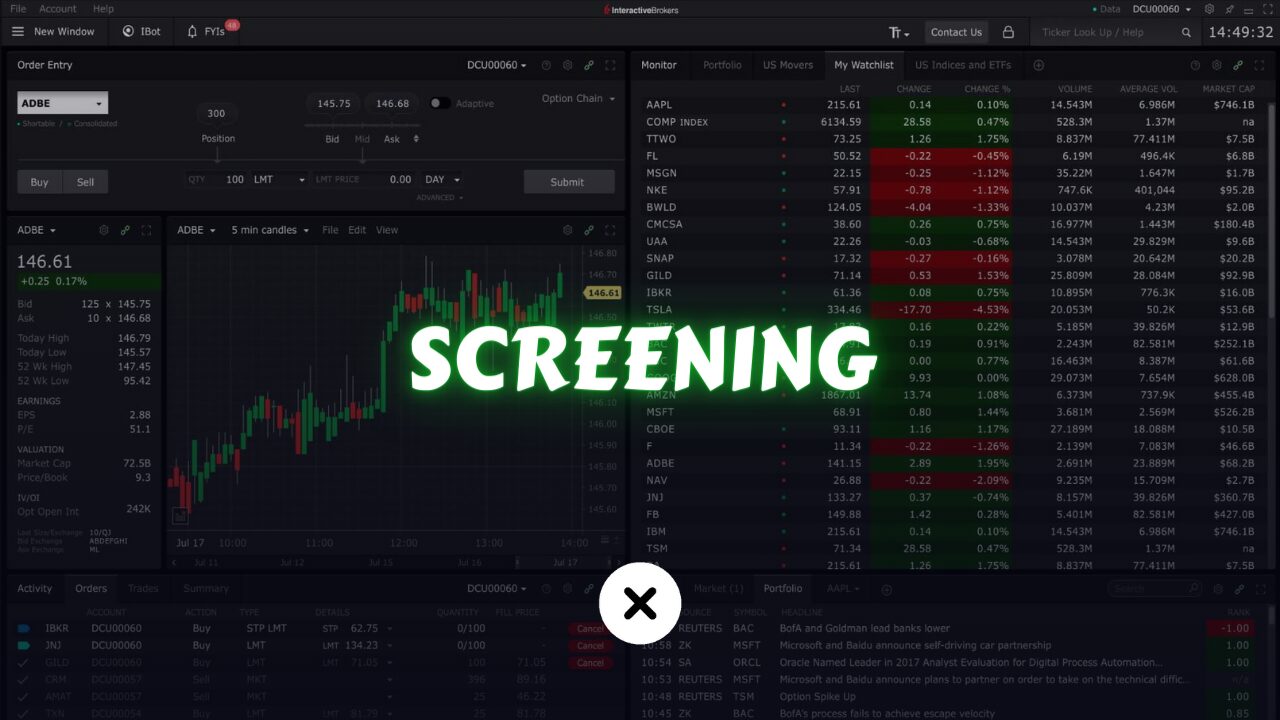
Not every stock works for all strategies. The tricky part is that some strategies do well with certain stocks but not with others. So, picking stocks that match our trading plan is crucial. This selection process is called screening. In our last discussion, we talked about two main types of trading strategies. Now, in this article, let’s see how to screen stocks for these strategies and screening in general.
What is Stock Screening?
Stock screening is a systematic process of filtering and selecting stocks based on specific criteria or parameters. These criteria can vary widely depending on the trader’s preferences, trading strategy, risk tolerance, and market conditions.
By employing screening techniques, investors can narrow down their choices from a broad universe of stocks to a more manageable selection that meets their desired characteristics.
The primary purpose of stock screening is to identify opportunities that align with the investor’s objectives and criteria.
Whether seeking growth stocks, value stocks, dividend-paying companies, or stocks with specific fundamental or technical characteristics, screening allows traders to focus their attention on stocks that have the potential to meet their financial goals.
Methods of Stock Screening
Online Screeners: Many brokerage platforms and financial websites offer stock screening tools that allow investors to filter stocks based on predefined or custom criteria. These screeners typically provide access to a wide range of fundamental, technical, and performance metrics. TradingView and finviz have the best screeners.
Spreadsheet Analysis: Advanced investors may opt to conduct stock screening using spreadsheet software like Microsoft Excel or Google Sheets. By importing data from financial databases or APIs, investors can create custom screening models and perform in-depth analysis.
Algorithmic Screening: Some investors utilize algorithmic trading strategies that automatically screen stocks based on predefined rules and algorithms. These algorithms can be programmed to consider a wide range of factors, including price movements, volume, news sentiment, and more.
Key Factors to Consider When Screening
The choice of parameters when screening stocks depends on the specific trading strategy you’re employing. It becomes clearer once you delve into working with different strategies. But here are some examples.
Fundamental Analysis: Evaluating a company’s financial health and performance through metrics such as earnings growth, revenue growth, profit margins, debt levels, and valuation ratios like price-to-earnings (P/E) ratio and price-to-book (P/B) ratio.
Technical Analysis: Analyzing historical price and volume data to identify trends, support and resistance levels, High and Low levels, and potential entry and exit points based on technical indicators like moving averages, relative strength index (RSI), and MACD.
Sector and Industry Trends: Considering broader market trends, sector performance, and industry dynamics can help investors identify opportunities in sectors poised for growth or undervalued industries with potential for a rebound.
Once more, don’t stress about learning all the parameters out there. Just focus on the ones your strategy needs. The best way to understand them all is by working on multiple strategies.
How to Screen Stocks for Momentum and Mean Reversion Strategies?
There are 2 main factors to consider when selecting stocks for momentum and mean reversion strategies. Stock Float and Institutional Ownership. Of course, there are many others but these are the most important ones.
What is Stock Float?
The term “float” means the number of shares of a company’s stock available for public trading.
It’s the total shares outstanding minus any restricted shares held by insiders, like company executives or institutional investors.
In simple terms, float is the shares ready for trading on the market.
Float is crucial because it affects a stock’s liquidity and volatility.
A stock with a smaller float tends to have less liquidity, meaning fewer shares available for trading. So, even a small buy or sell order can greatly impact the stock’s price.
This can lead to higher price volatility since supply and demand imbalances are more noticeable in stocks with a smaller float.
On the other hand, a stock with a larger float tends to have more liquidity because there are more shares available for trading. This can lead to smoother price movements and less volatility because large buy or sell orders are less likely to cause sudden price swings.
Example:
As an example, consider two companies: ABC and XYZ.
Furthermore, Company ABC has a float of 1 million shares, indicating that there are 1 million shares available for trading on the market that individuals can buy and sell.
Company XYZ boasts a float of 1 billion shares, and both companies are currently trading for $10 per share.
If someone intends to purchase all the shares available for trading on the market for ABC, they would need to spend $10 million. This calculation is derived by multiplying the number of shares, which is 1 million, by the price per share, which is $10.
If someone intends to replicate the same approach with Company XYZ and purchase all the shares available for trading on the market, which amounts to one billion shares, it would cost them a staggering $10 billion.
Given the considerable contrast between $10 million and $10 billion, it is indeed a significant difference. Now, let’s consider which company, out of the two mentioned, is more likely to experience a sharp movement or significant price increase if news emerges or if a few buyers enter the market.
Based on their respective floats, Company ABC, with a float of 1 million shares, is more likely to undergo a sharp movement compared to Company XYZ, which has a float of 1 billion shares.
Since Company ABC has a smaller float, it is relatively less liquid, and needs less money to move, making it more susceptible to significant price swings in response to news or a surge in buying activity.
Conversely, Company XYZ, with its larger float, may experience less drastic price fluctuations due to a higher liquidity level and it needs $10 Billion or a huge amount of money to make it move.
Now, let’s have another example.
Suppose there are rumors circulating about Stock ABC, suggesting that they may have a promising development on the horizon. Consequently, the price of the stock begins to rise. Why does this happen?
When a stock has a high float, it typically requires a large number of participants to believe in the legitimacy of the rumor and actively buy the stock to drive its price up. Consequently, a large float may hinder the stock from experiencing a significant surge.
Conversely, when a stock has a low float, it doesn’t require as many buyers to generate a notable impact and propel the stock’s price higher. Therefore, a stock with a low float is more likely to undergo a surge. This explains why Stock ABC, with its smaller float, was able to rise in response to the rumors.
If you are implementing a momentum strategy, it would be preferable to focus on stocks with a low float. This is because you are seeking stocks that can move in a particular direction more readily. With a low float, it takes fewer participants to generate significant price movement, increasing the likelihood of capturing momentum and achieving desired trading outcomes.
People who engage in frequent pump-and-dump schemes actively seek out low-float stocks. This is because low float stocks allow them to rapidly drive up the price and swiftly exit their positions.
You can find metrics such as float and others by visiting finviz or yahoo finance.
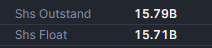
Shares outstanding refer to the total quantity of shares available in a company, while shares float represents the number of shares actively traded on the market.
Low float is for momentum strategies and high float is for mean reverting strategies.
Normally, high float stocks tend to revert to their average value while low float stocks often keep gaining momentum. However, there are times when high-float stocks also gain momentum, and low-float stocks revert to their average. Yet, it’s usually low-float stocks that keep gaining momentum and high-float stocks that revert to their average. In trading, it’s crucial to tilt the probability in your favor.
If you recognize that low-float stocks have a higher probability of success with momentum strategies, why opt for a high-float stock with a lower probability?
What is Institutional Ownership?
Institutional ownership means the portion of a company’s shares owned by big investors like mutual funds, banks, and pension funds.
Some stocks are really favored by these big investors, who put a lot of money into them and buy a lot of shares. On the flip side, there are stocks that these big investors decide not to buy.
This matters a lot because we’ve seen how different players use different tactics in the market. So, it’s important to have different strategies for dealing with specific stocks based on who’s involved.
Example:
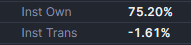
Suppose you check a stock like Meta and review its institutional ownership, which stands at 75%. This indicates that institutions hold ownership of 75% of the stock’s float.
You are aware of how institutions engage in trading. When a stock’s value increases, they tend to sell off some of their shares and allocate the funds to undervalued stocks. Conversely, when a stock’s value decreases, they take the opportunity to buy more shares since this allows them to acquire larger quantities without significantly impacting the price.
Having this understanding, it becomes challenging to implement momentum strategies for stocks with significant institutional ownership.
As the stock price rises, institutions tend to sell off their shares, and when the price declines, they buy more. Institutions prefer to purchase a large number of shares, so they refrain from buying as the price is increasing because their actions would drive the price up and limit the quantity of shares they can acquire.
Institutions typically take positions against market trends, as this enables them to accumulate a substantial number of shares gradually.
Hence, institutions are present to provide support for the stock’s price during declines and act as resistance when it is rising. As a result, the stock consistently undergoes upward and downward movements, displaying a mean reversion behavior in response to changes in price.
Therefore, stocks with higher institutional ownership are more suitable for mean reverting strategies.
Now, with low institutional ownership indicating higher participation from retail traders like us, what does this reveal about their trading behavior?
As retail traders, we tend to differ from institutions in terms of our trading behavior. Unlike institutions, we typically do not purchase large quantities of shares, and we are more inclined towards momentum trading.
We enjoy chasing price movements, and following upward trends. our trading behavior can sometimes contribute to the formation of bubbles or engage in pump-and-dump schemes.
Therefore, when you observe low institutional ownership in a stock, it becomes favorable for implementing any type of momentum strategy. Hence, if you are engaging in a momentum strategy, you would prefer low institutional ownership in the stock.
As mentioned earlier, stocks with institutional ownership are more inclined to exhibit mean reverting behavior, although there are instances where they can also display momentum characteristics.
Conclusion
To implement a momentum strategy, it is preferable to select stocks with low institutional ownership and a low float. On the other hand, for a mean reverting strategy, it is advantageous to choose stocks with high institutional ownership and a high float.
Regardless of having a cutting-edge strategy, it is essential to carefully consider the stock you choose to trade with that strategy. Failure to do so can significantly impact the effectiveness and success of the strategy. Because some strategies only work with some stocks.
To identify the optimal stock for your trading strategy, it is essential to conduct a screening process. This practice involves systematically narrowing down the vast array of available symbols to pinpoint the most suitable one that aligns with and complements your strategy effectively.
Among the screeners I have tested, finviz and TradingView stand out as providers of some of the most impressive screening tools available.