![Weekly Crypto Analysis [2024.09.01]: BTC, ETH, BNB, SOL, XRP, DOGE, TRX, ADA, AVAX, SHIB Trends and Key Levels to Watch
xlearnonline.com](https://xlearnonline.com/wp-content/uploads/2024/09/CRYPTO-ANALYSIS.jpg)
Hello, and welcome to xlearn’s weekly crypto analysis article series. If this is your first time here, I recommend reading our guide on how to use our market analysis article before diving into this one.
By following these articles, you can learn how to read prices and perform price action trading. These articles cover major coins and tokens such as BTC, ETH, and BNB, and also incorporate other best cryptocurrencies to watch now.
Before we start trading, we need to understand what’s happening in the market and around the world. So, let’s start with an overview of upcoming week’s economic events.
Economic Events this Week
These events encompass important global news that could affect cryptocurrency market, macroeconomic reports, and economic indicators.
For more details, you can check coinmarketcal & crypto craft.
2024.09.06
- 8:30 ET: The US Unemployment Rate is being released. This shows the percentage of people in the workforce who were unemployed and actively looking for jobs last month. The previous rate was 4.3%, and the forecast is 4.2%. If the actual rate is higher than the forecast, it could be positive for crypto. This data comes out monthly, usually on the first Friday after the month ends. Even though it’s a lagging indicator, the number of unemployed people is a key sign of the economy’s health because consumer spending is closely linked to job market conditions. Unemployment is also a big factor in shaping the country’s monetary policy.
Cryptos to Watch
Bitcoin(BTC):
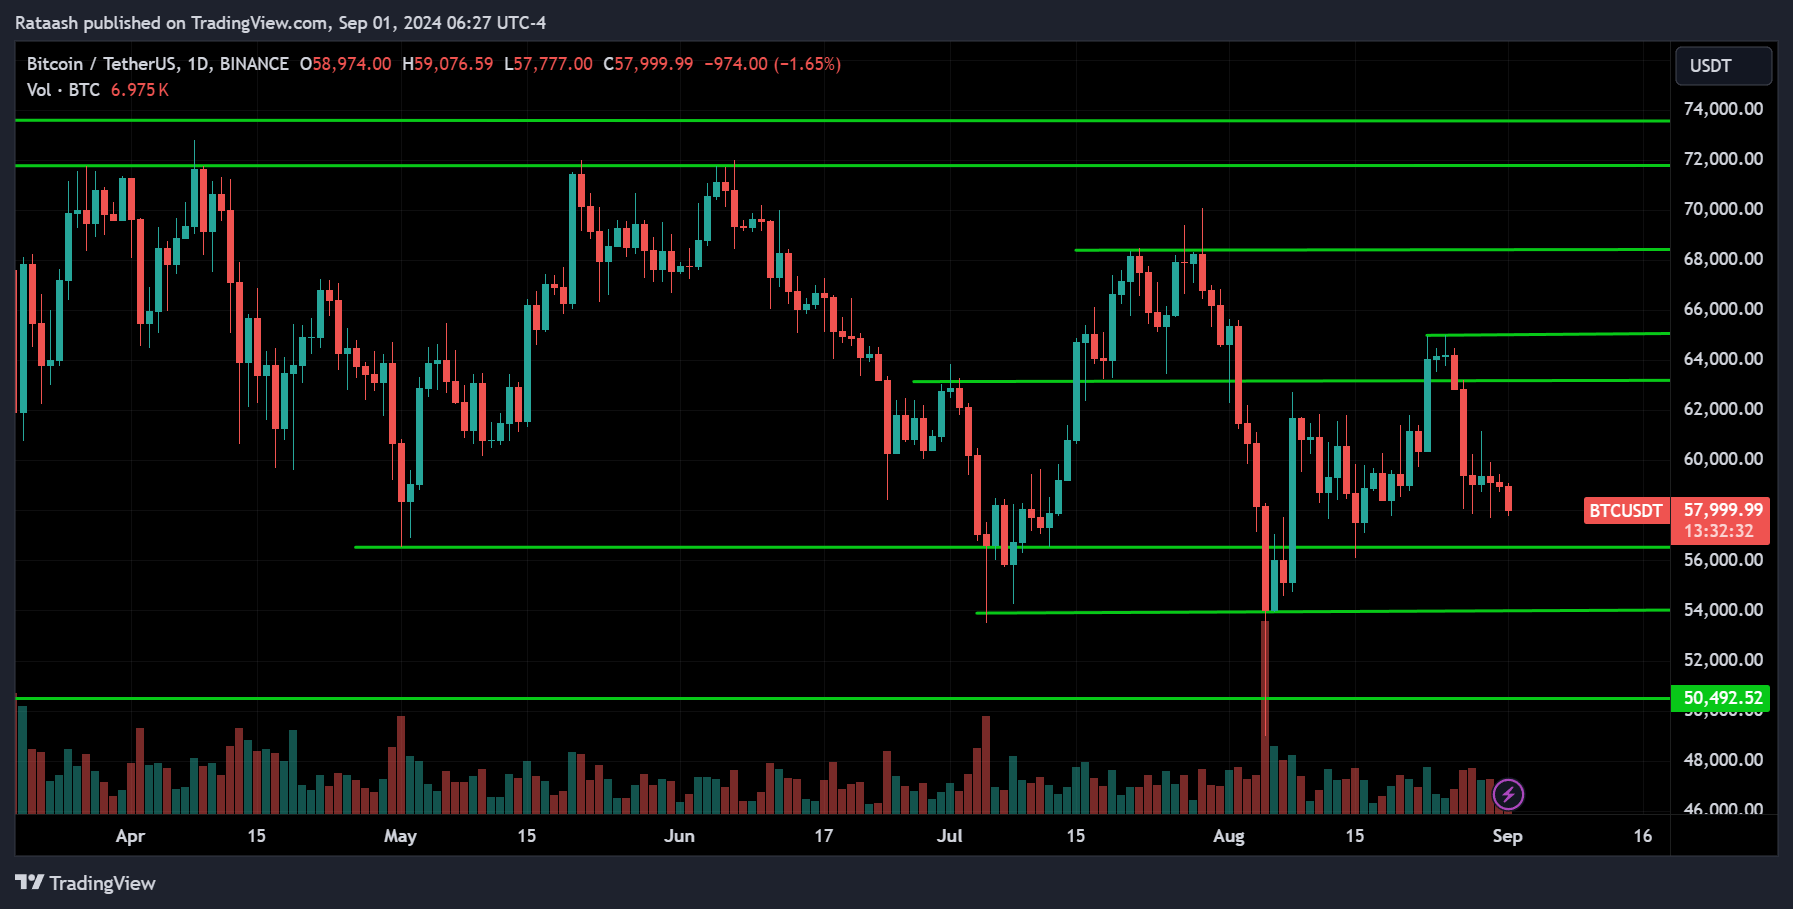
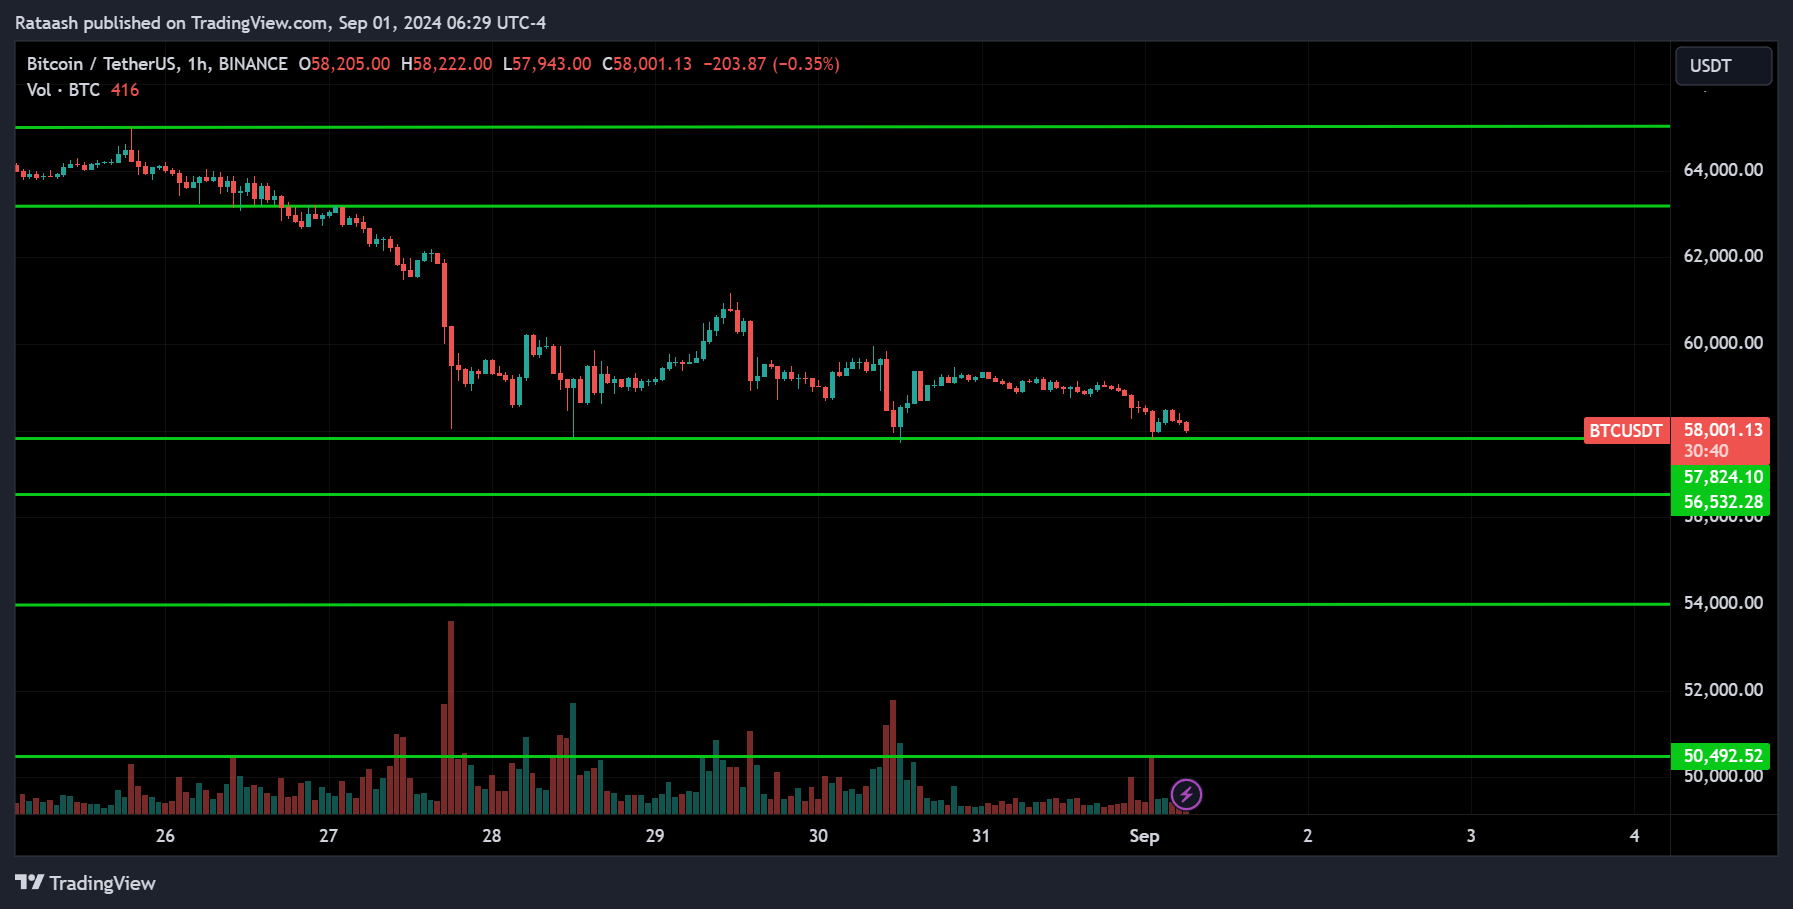
BTC is overall consolidating, but if you check the daily chart, you’ll notice it’s making lower highs, which is a sign of a potential downtrend. Currently, the price is at the major support level of 58,000. If it breaks below this support, we could see it drop to the 56,500 range, and if that level is also broken, then down to 54,000. However, if the price reverses from the 58,000 support, it could rise toward the 60,000 range. If it breaks above the 61,000 level, we might see it move up to 65,000.
Ethereum(ETH):
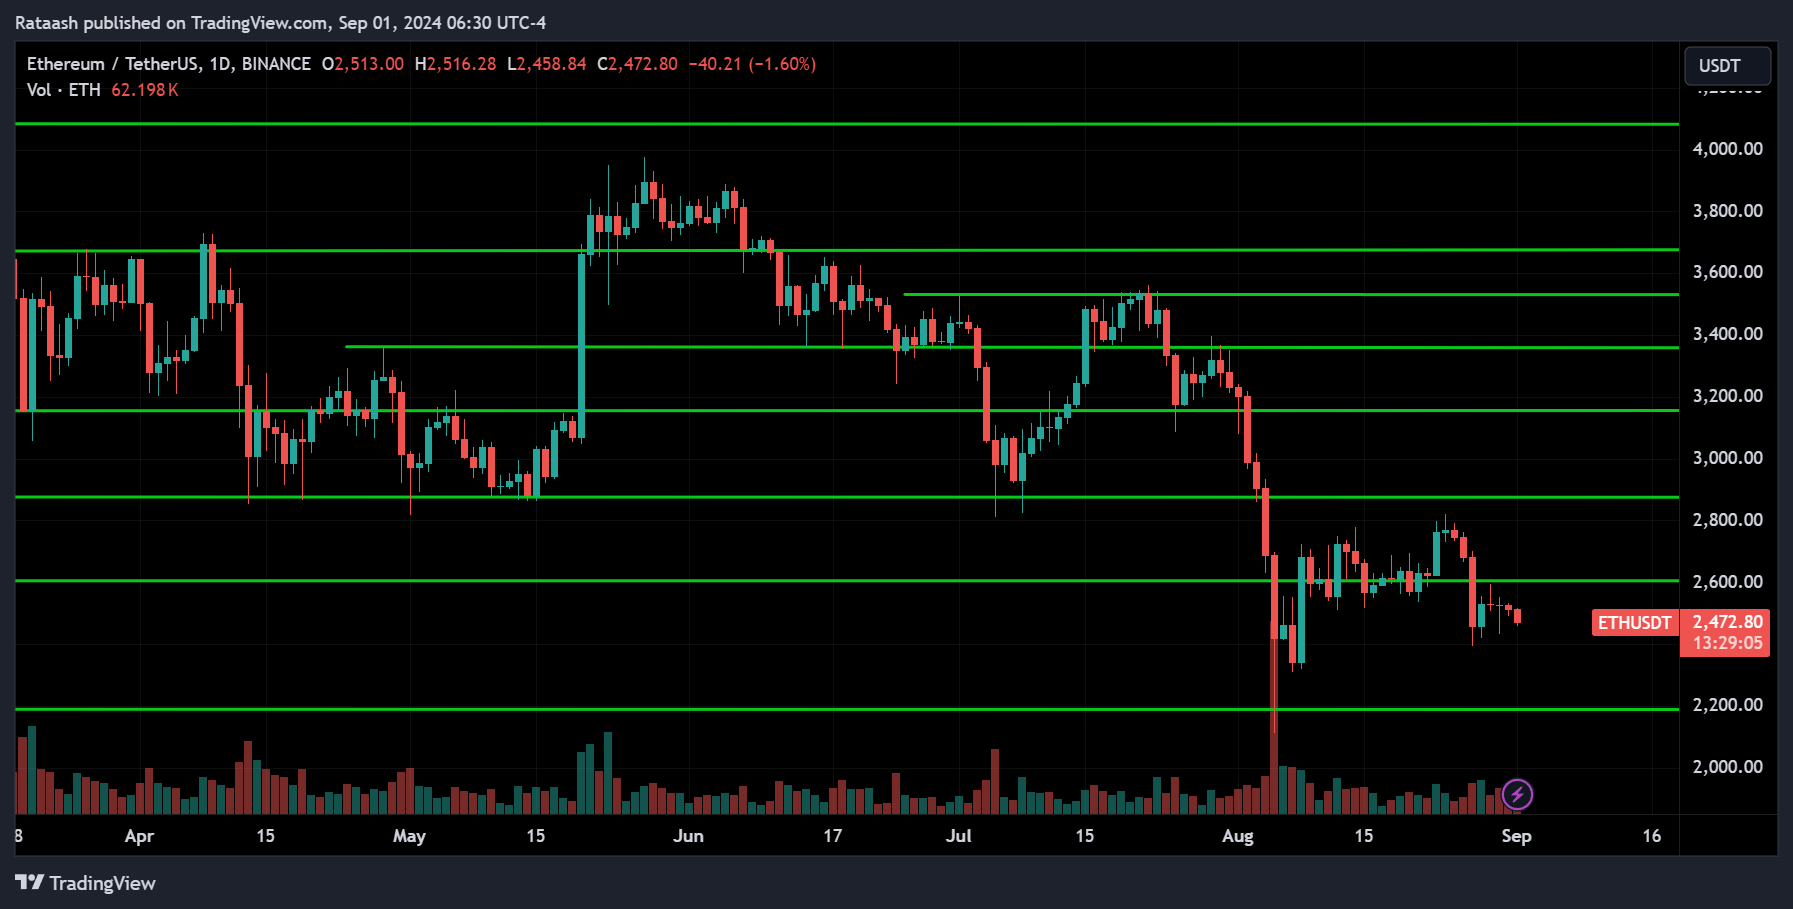
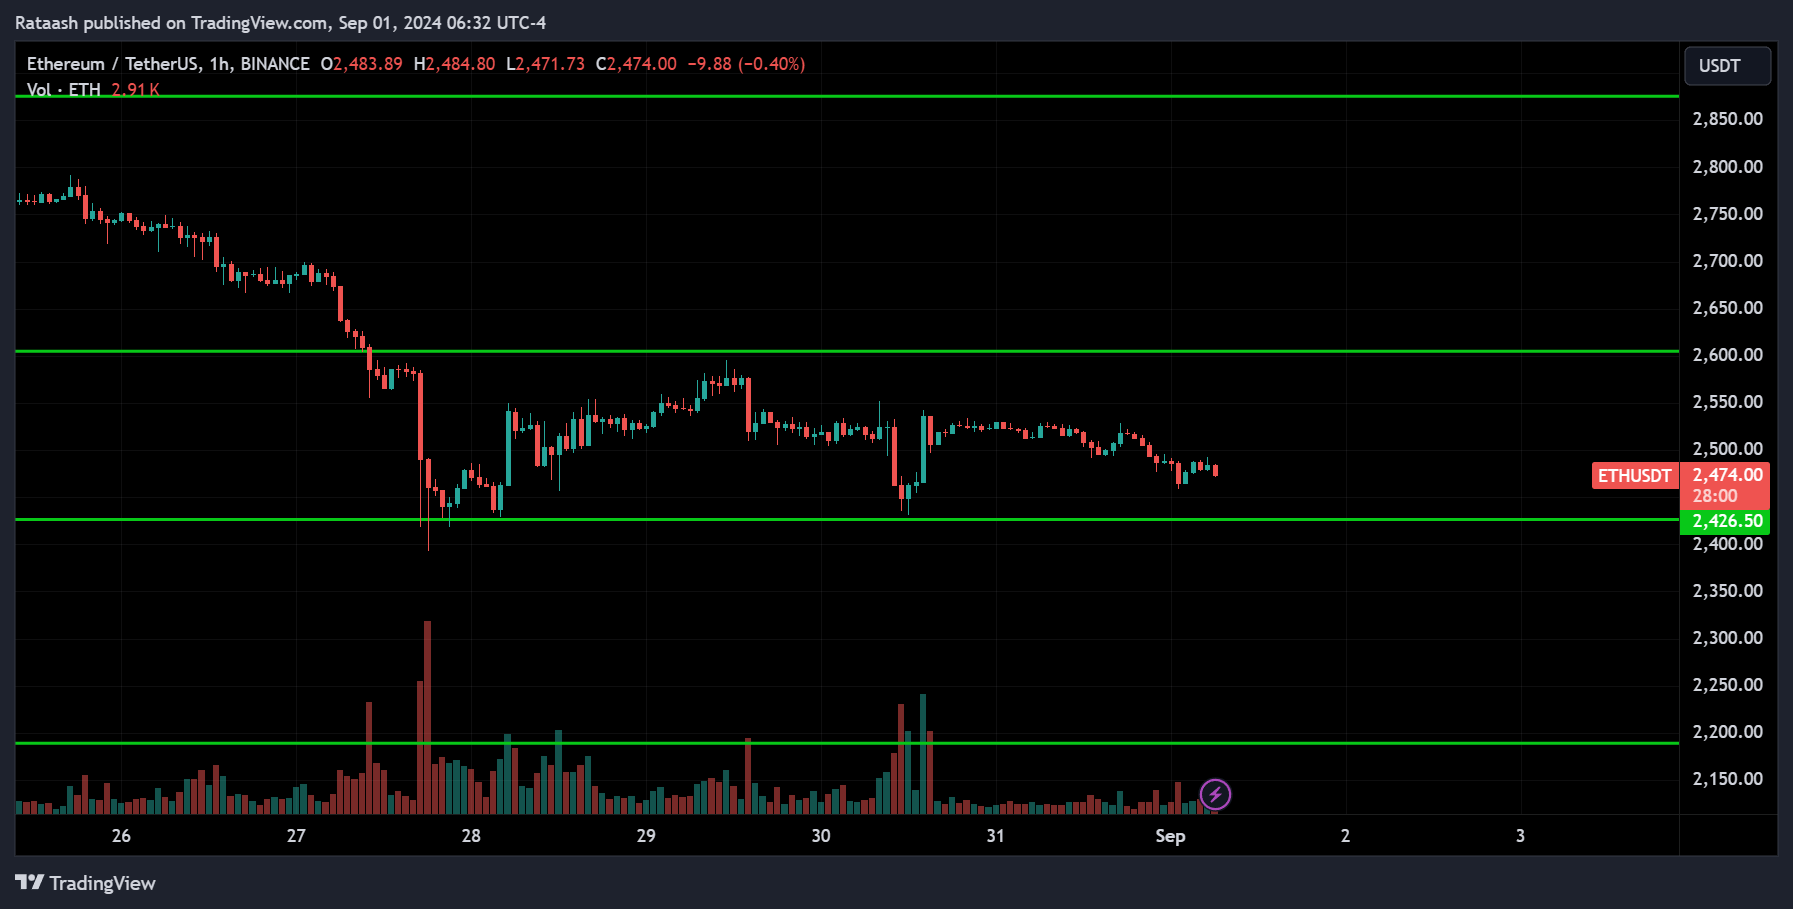
ETH is clearly trending down, with the price below the resistance level of 2,600 and above the support of 2,400. Since it’s downtrending, we can expect the price to break below this support level and continue toward 2,200. On the other hand, a reversal around the support level of 2,400 is possible. If the price breaks above the resistance at 2,600, we can expect it to move toward the 2,900 level.
Binance Coin(BNB):
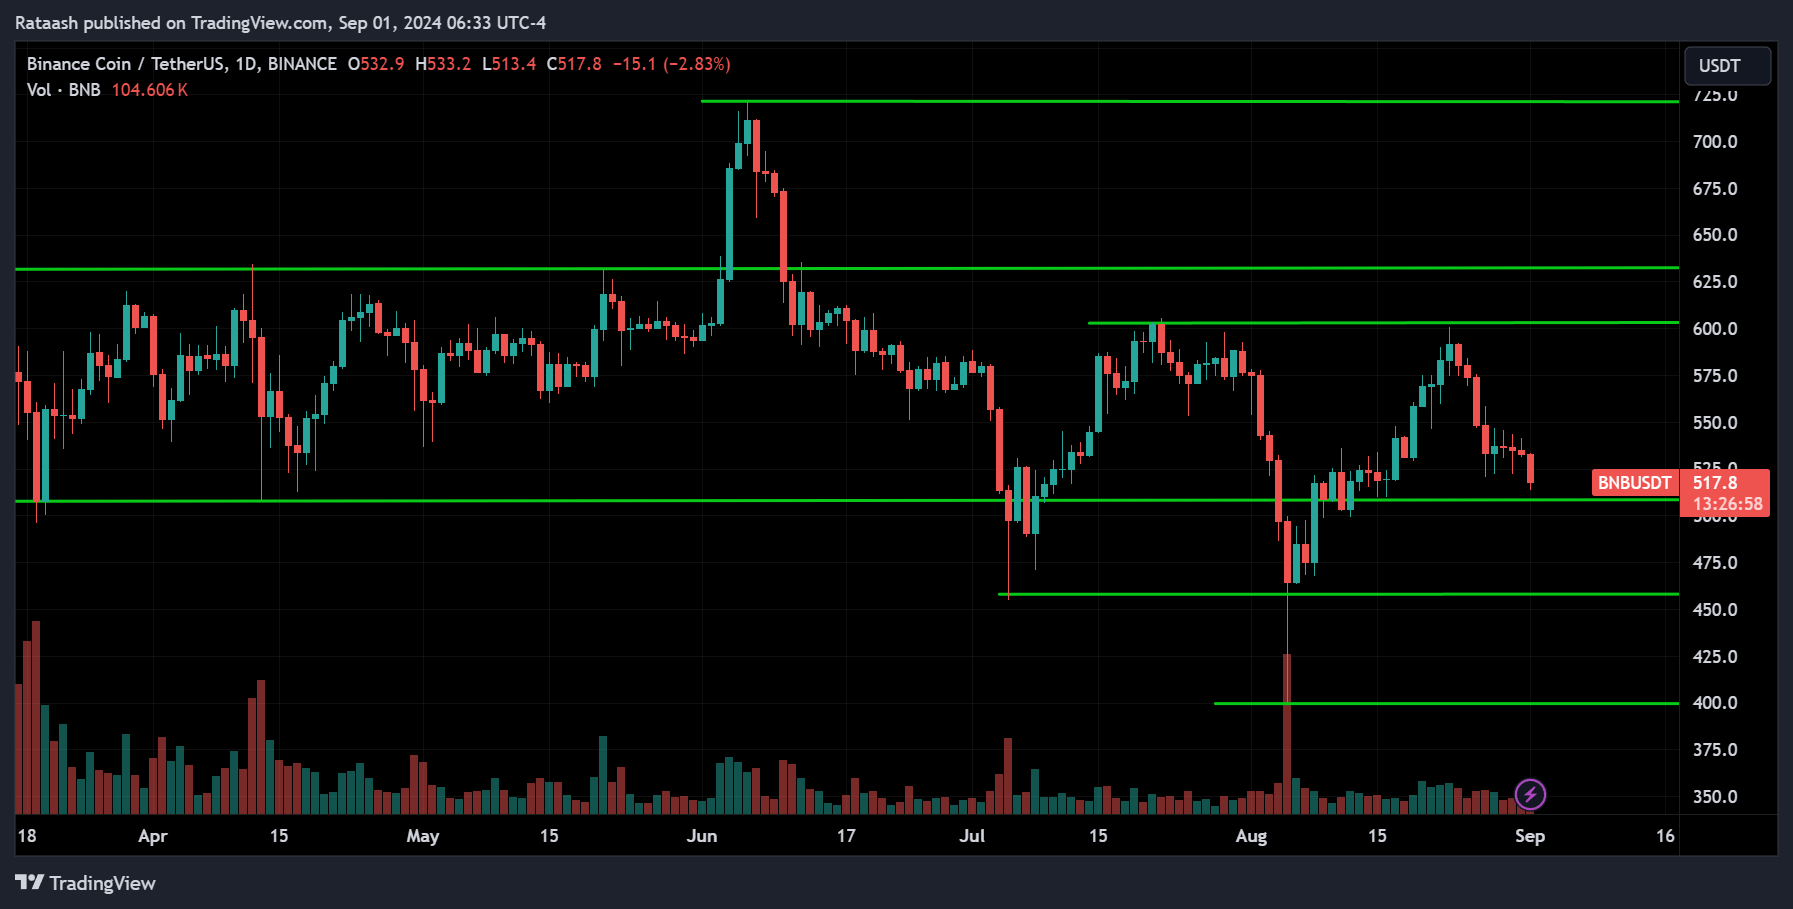
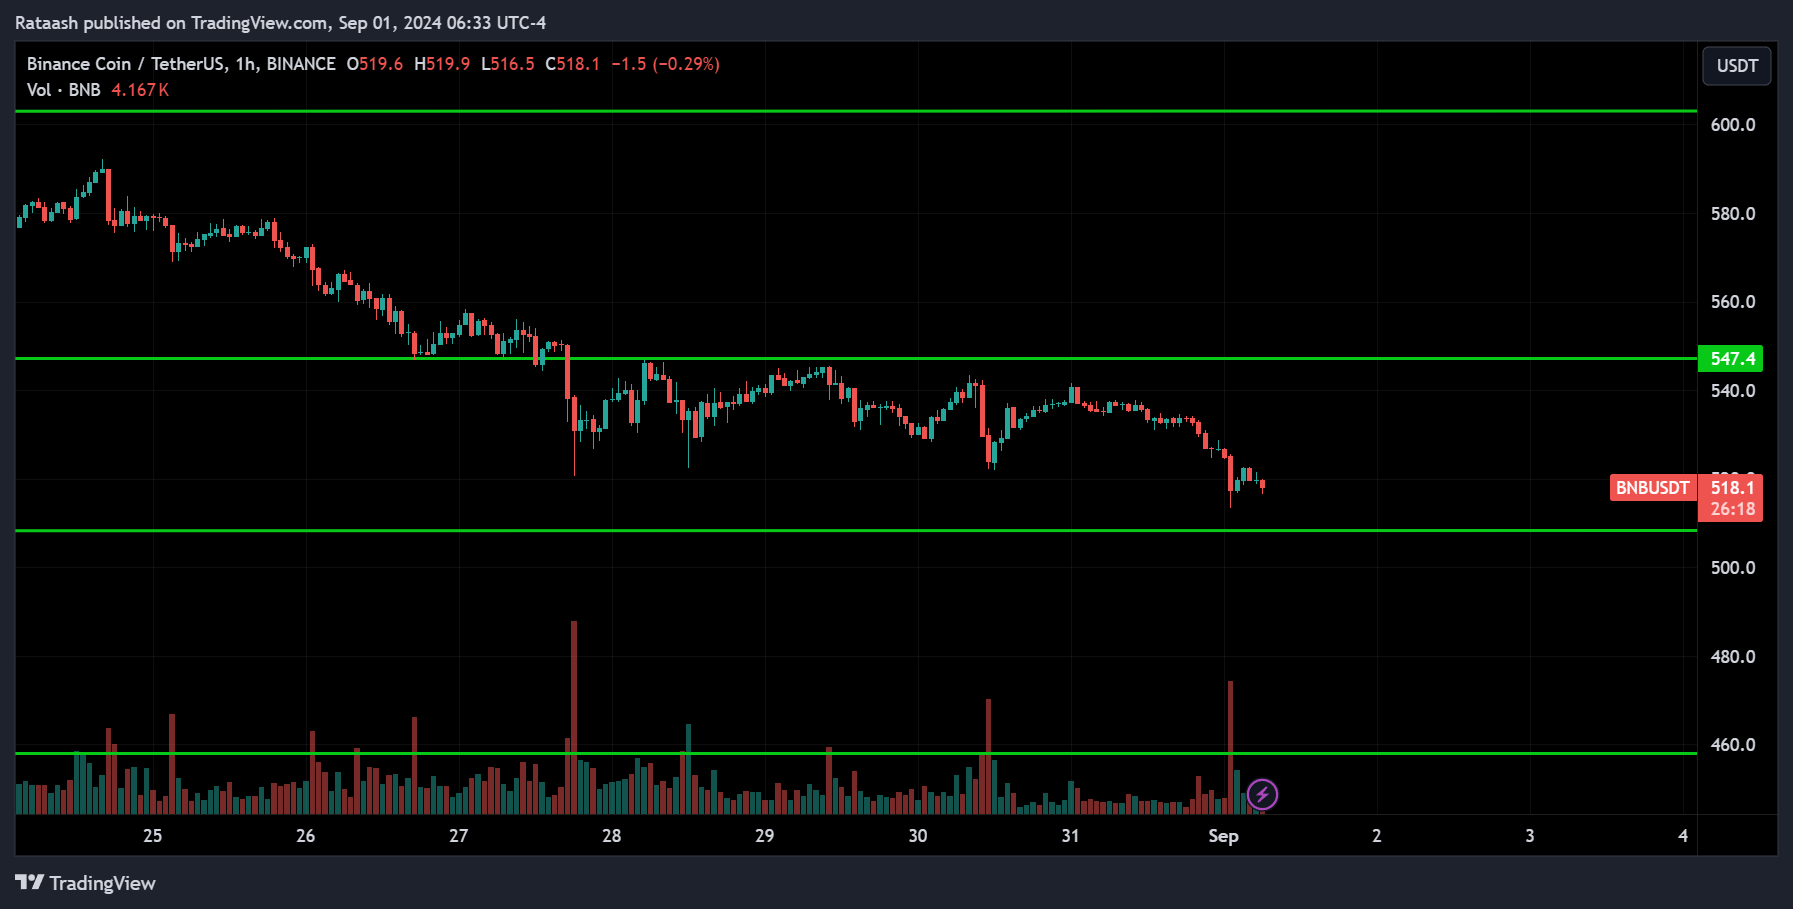
BNB is consolidating. Looking at the 1-hour chart, the price is near the support level around 500. If the price breaks below this level, we can expect it to drop toward 460. On the other hand, the price might also pull back from the support. If it breaks above the 550 range, we can expect the price to continue up to 600.
Solana(SOL):
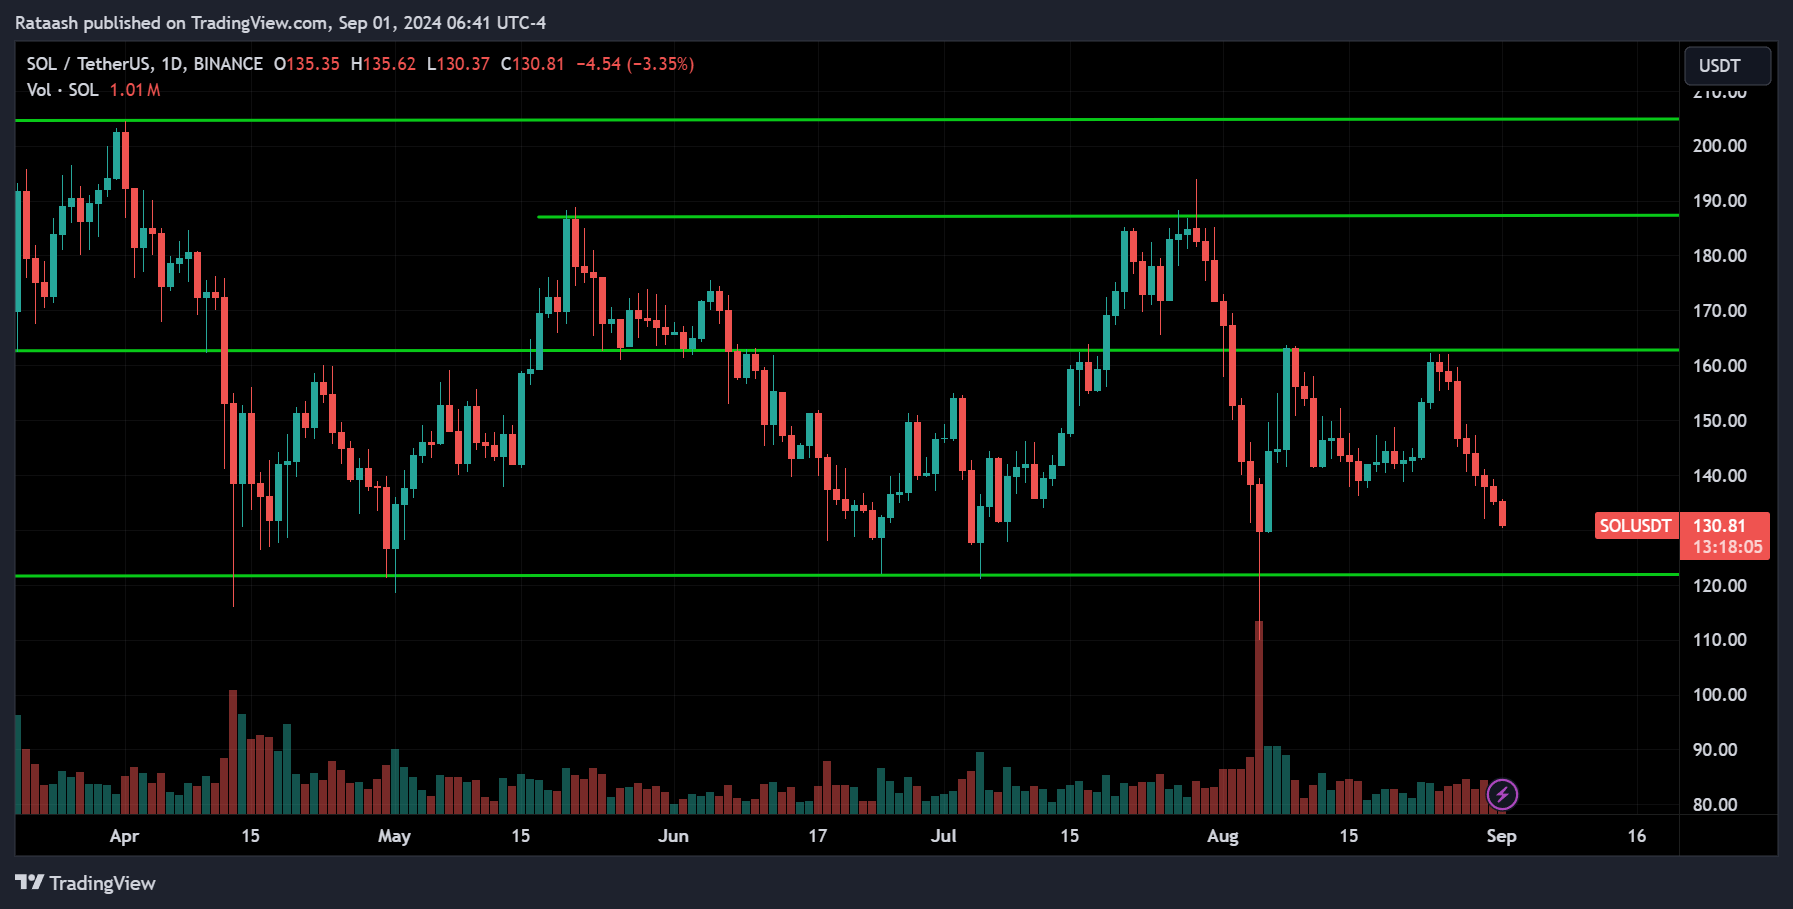
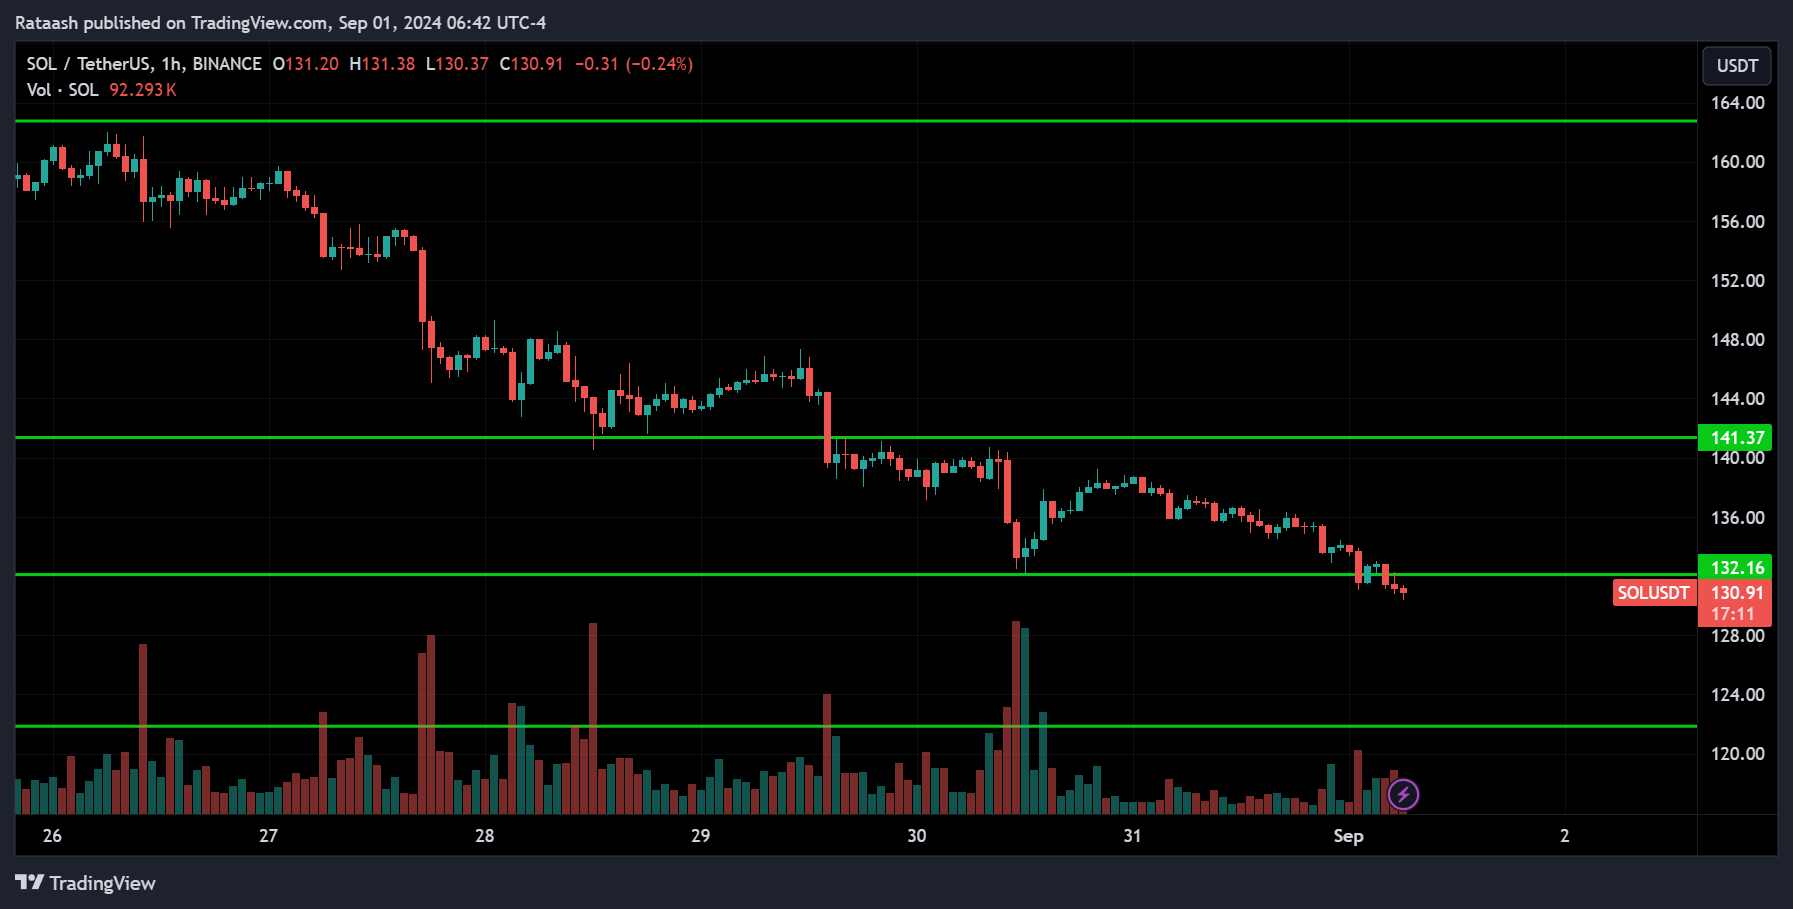
SOL is overall consolidating, with the price near the support level of 120. Looking at the 1-hour chart, the price is downtrending and has already broken below the 130 support. It’s now heading toward 120, where we can expect either a pullback or a break below that level to continue the drop. However, a pullback is more likely. If the price breaks above the 140 resistance range, the trend will change, so keep an eye on that, whether the price drops to 120 or not.
XRP(XRP):
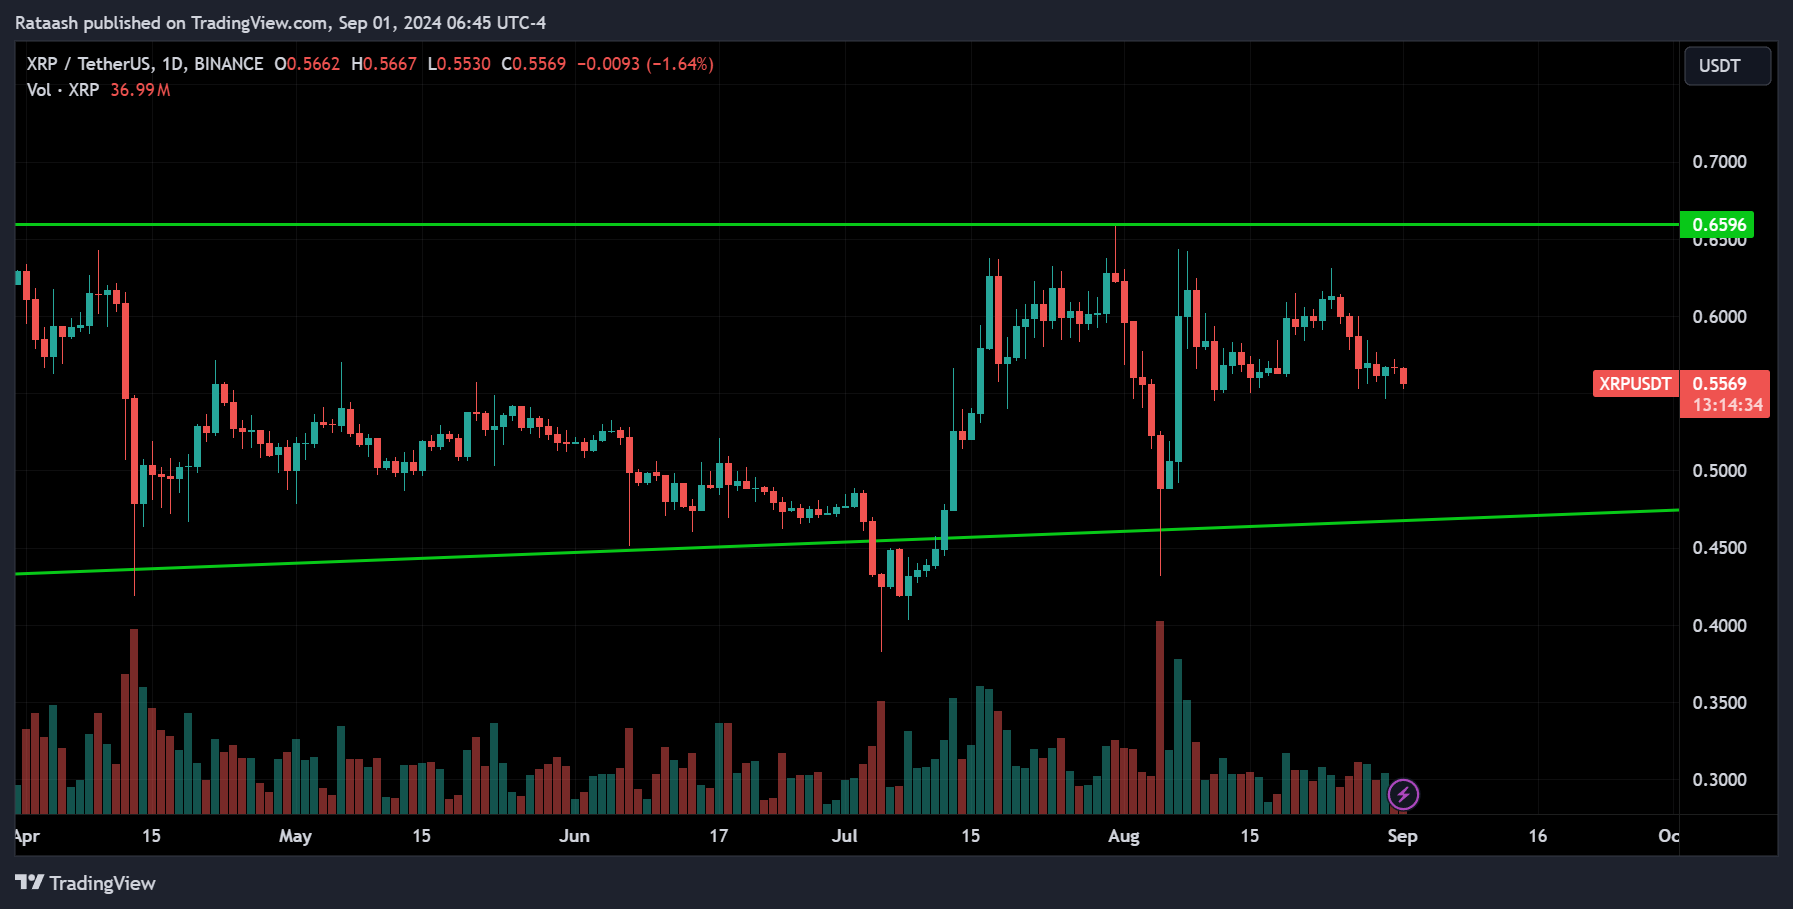
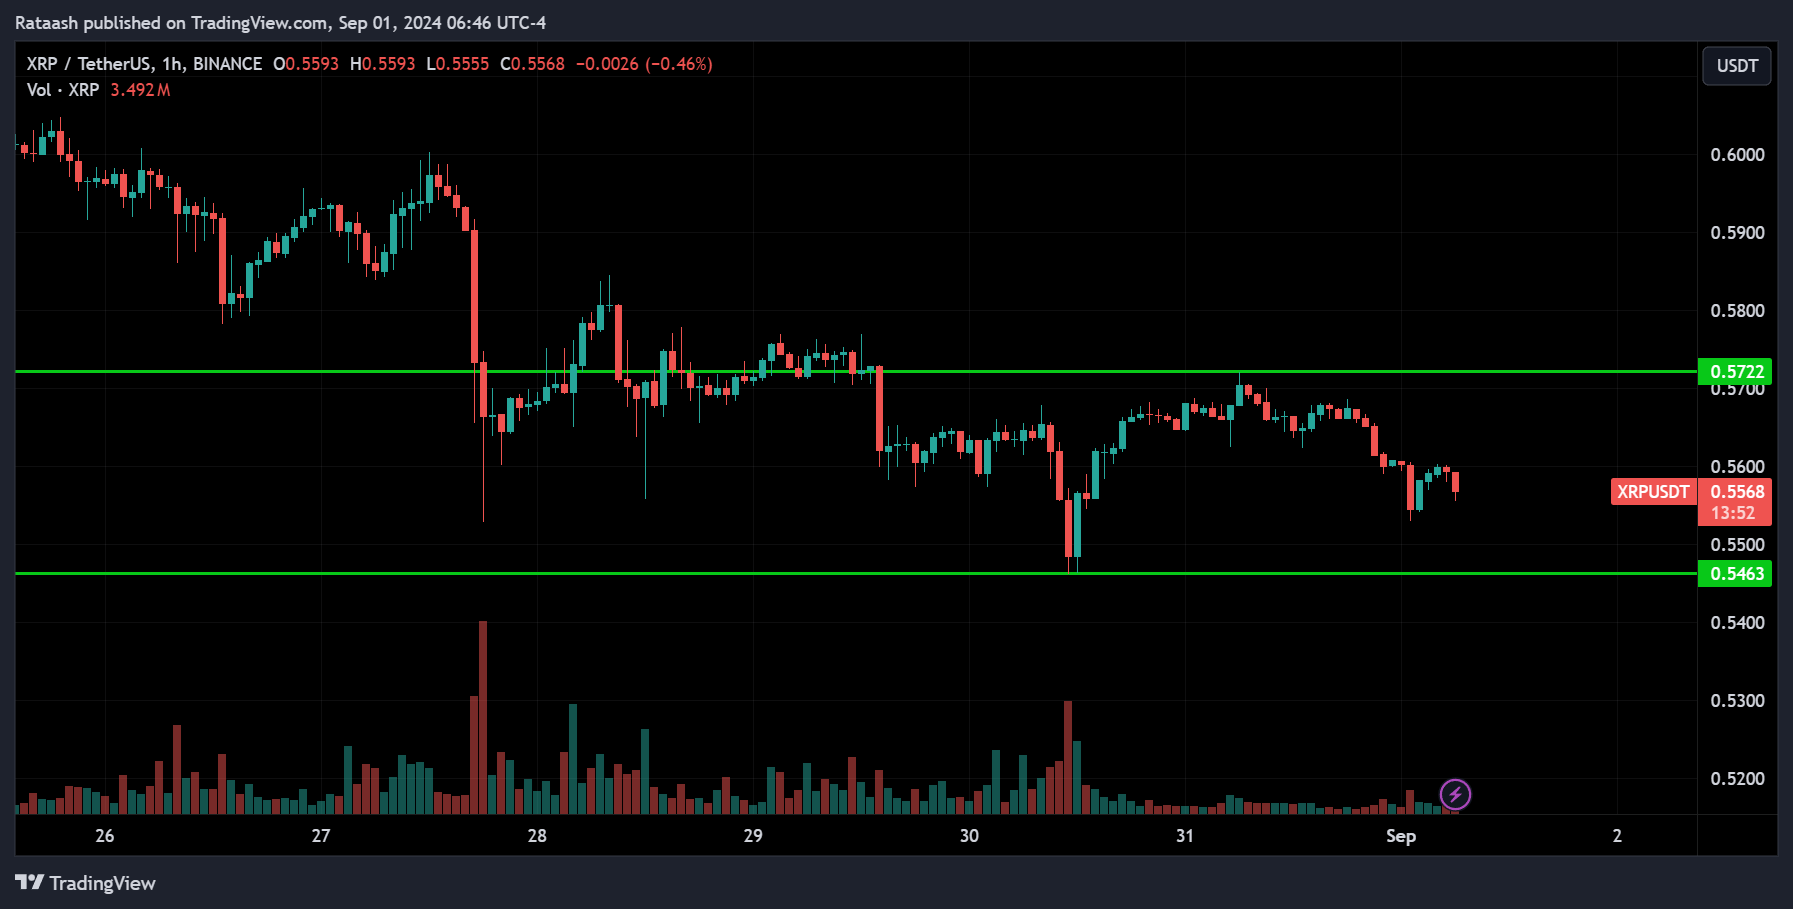
XRP has been consolidating for a long time and continues to do so on the 1-hour chart. The price is pulling back from the resistance range of 0.5700 and heading toward the 0.5400 support. We can expect a pullback around 0.5400 with the price possibly heading back to 0.5700, or it might break below this support and continue toward the 0.5000 range.
Dogecoin(DOGE):
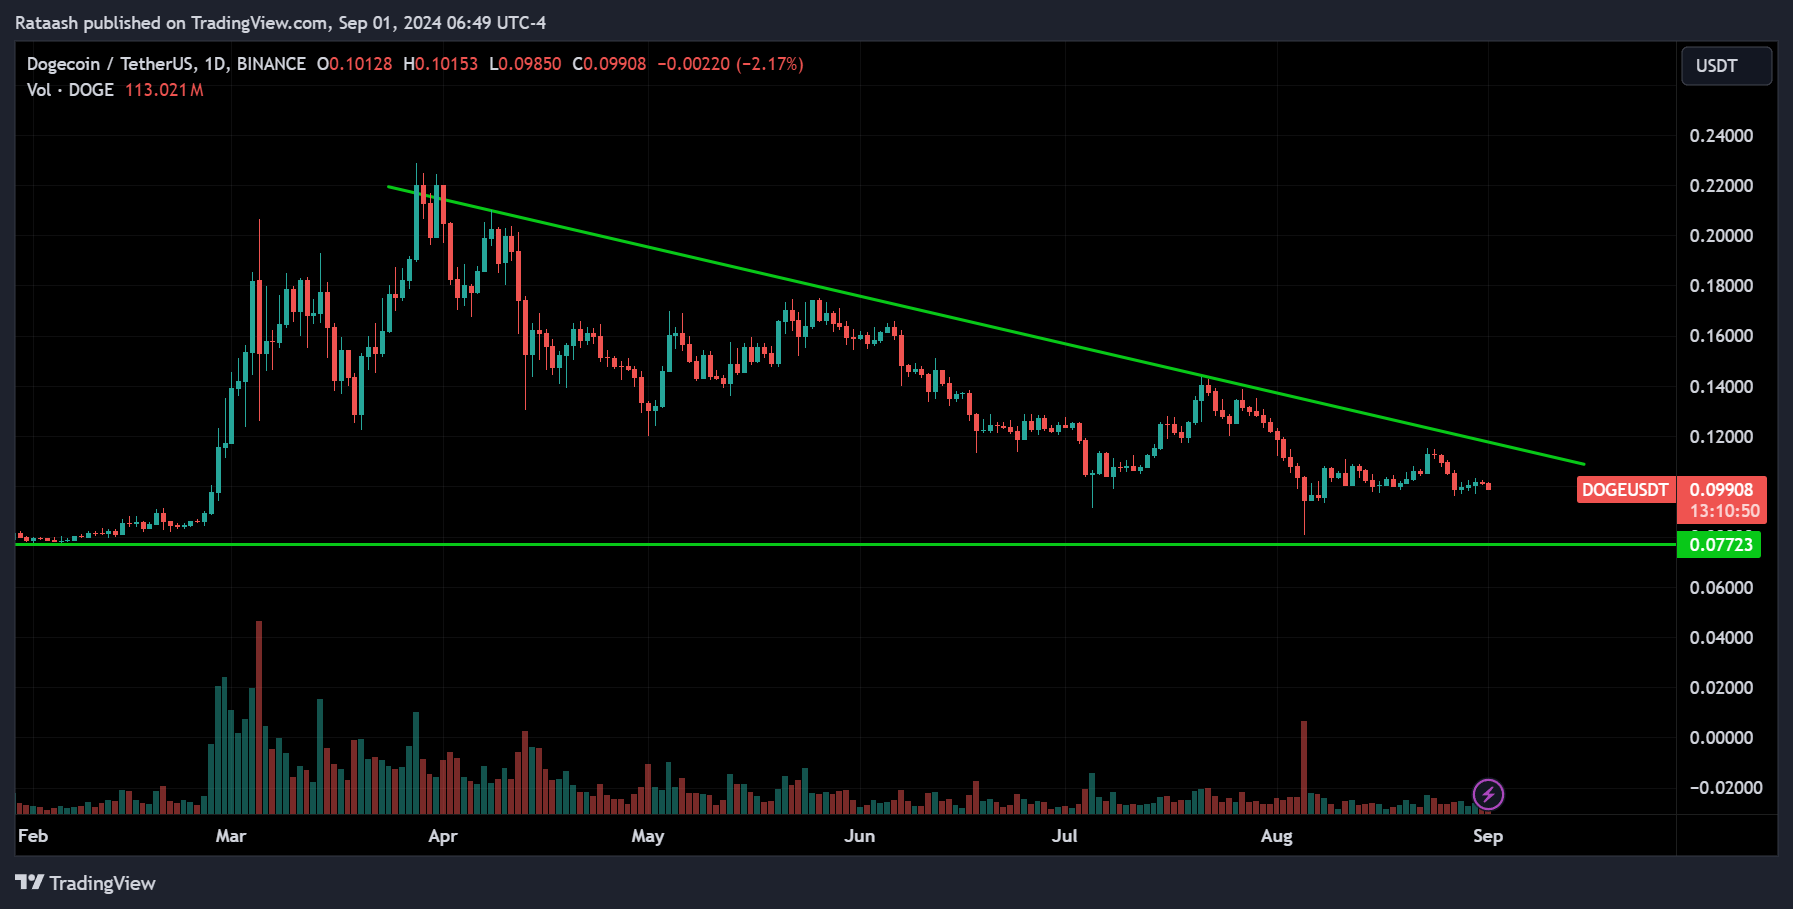
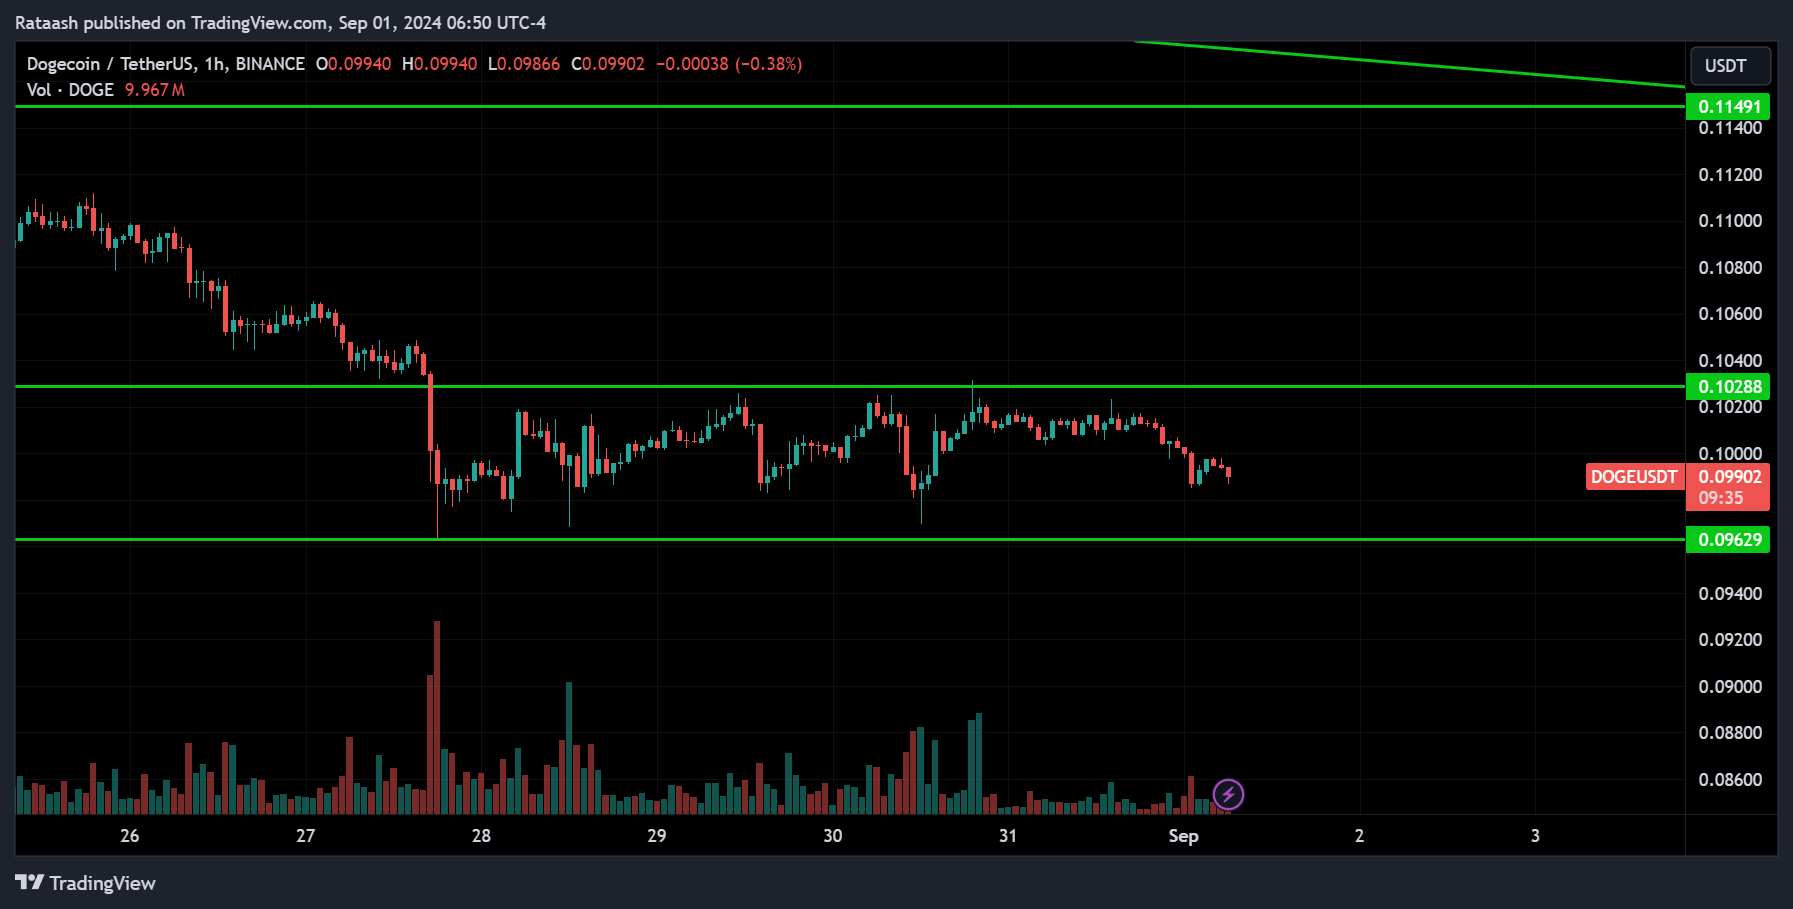
DOGE is trending down, with major support around the 0.07700 level. Looking at the 1-hour chart, the price is consolidating between the support at 0.09600 and the resistance at 0.10300. Since the overall trend is down, we can expect the price to break below the support and continue dropping toward 0.07700. However, if the price breaks above the resistance, we could see it continue upward toward 0.11400.
TRON(TRX):
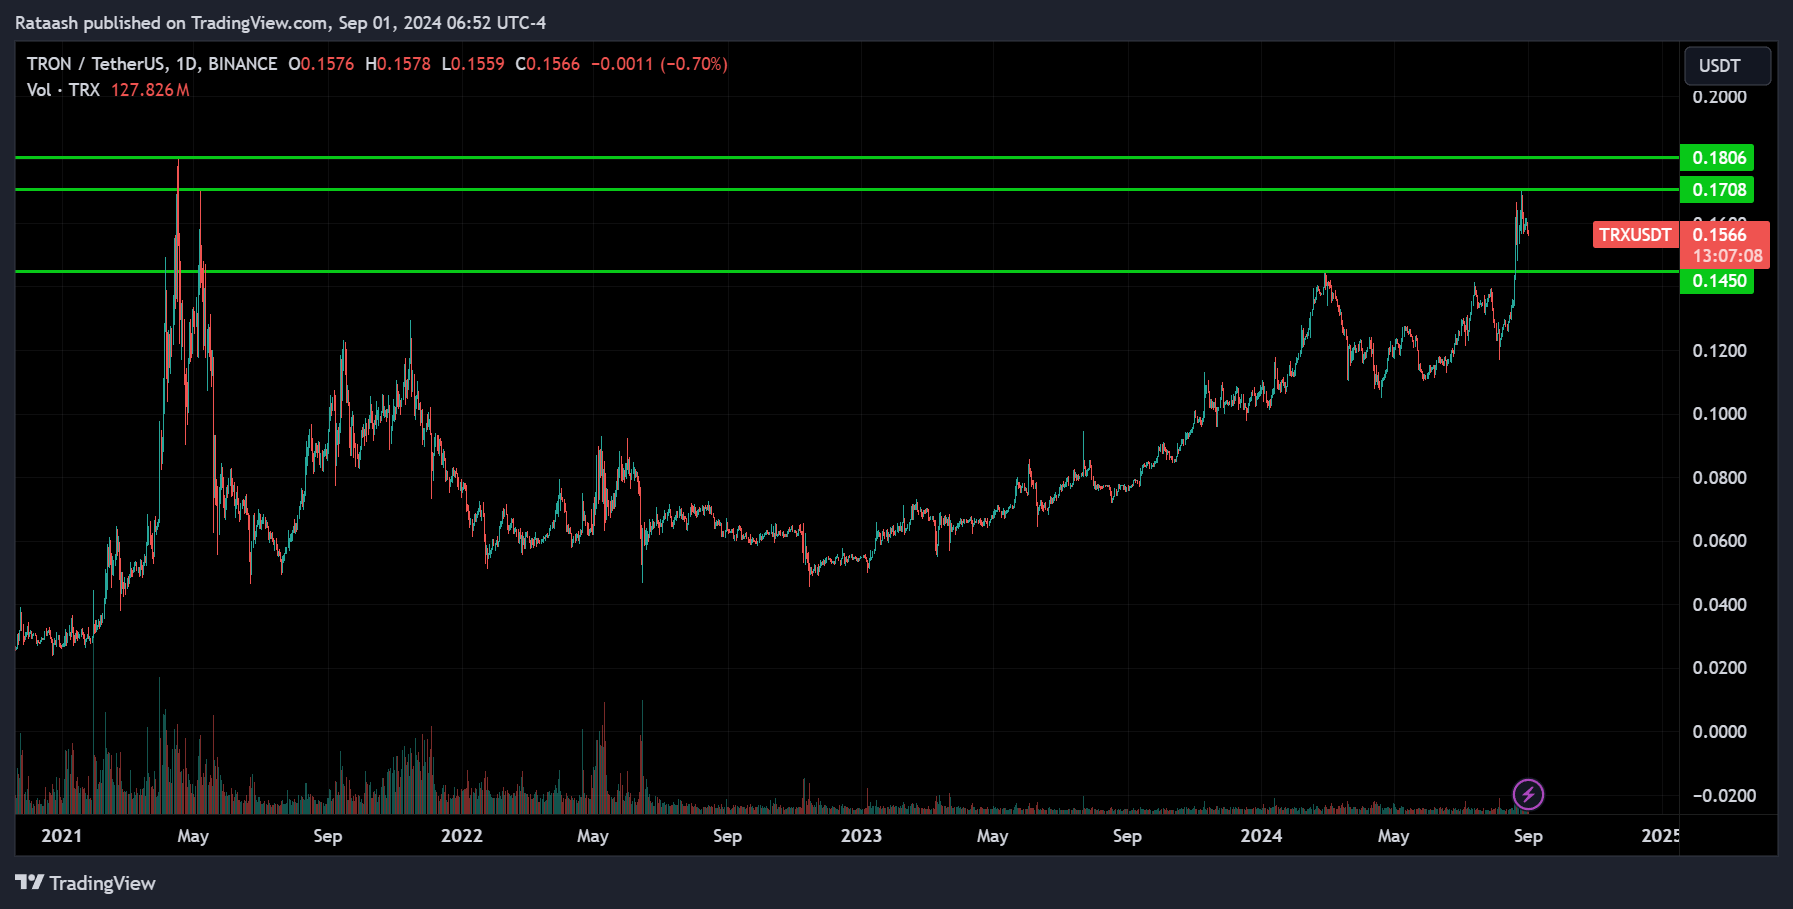
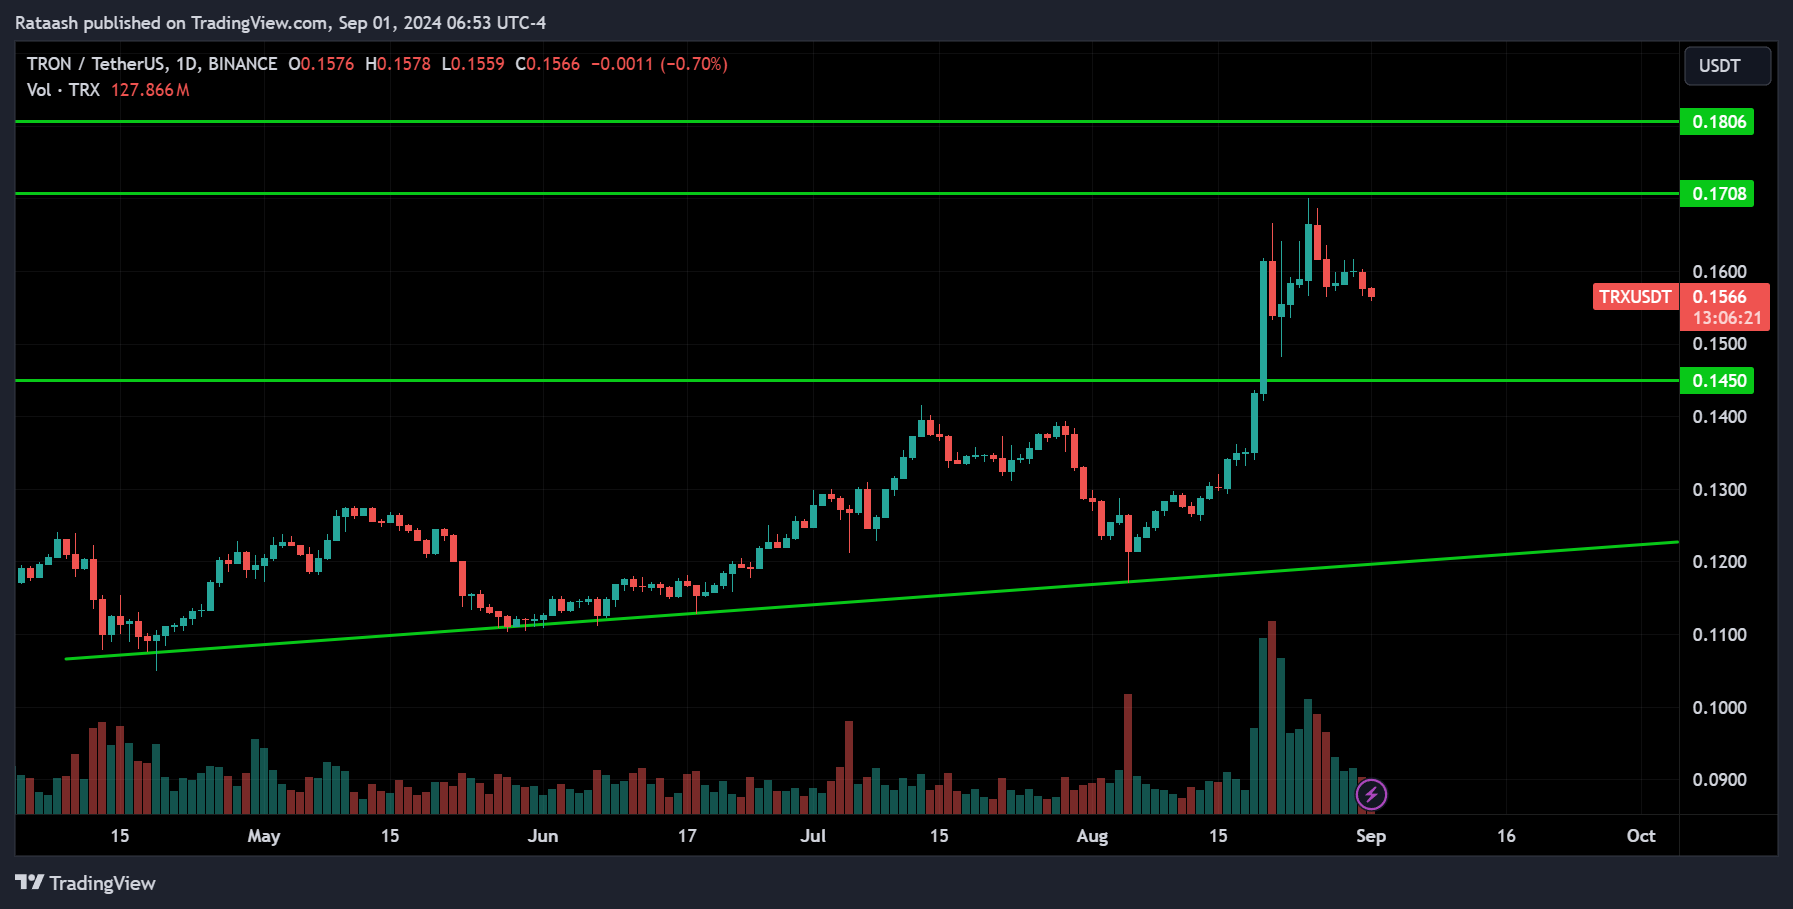
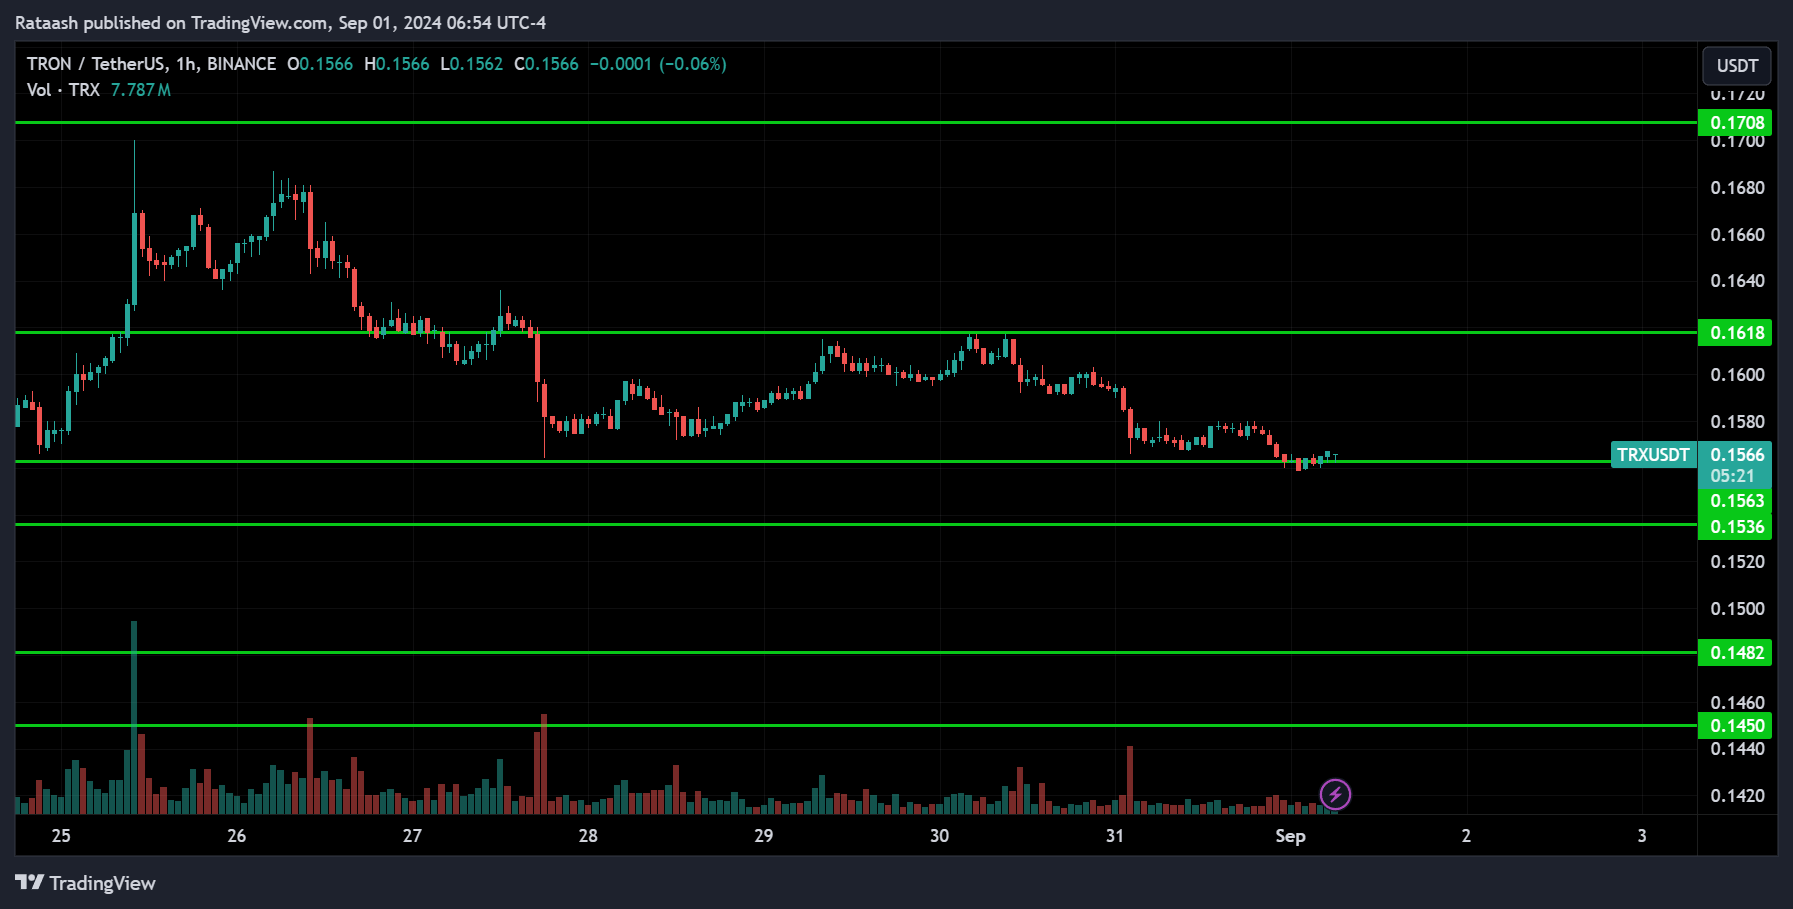
TRX is clearly uptrending, with the price pulling back from the resistance at 0.1700 and now sitting at the support level of 0.1560. If the price breaks below this support, we can expect it to drop to 0.1530, and if that level is broken, then down to 0.1480. On the other hand, we might also see the price pull back from the support and rise toward the 0.1600 resistance. If the price breaks above this resistance, we can assume the correction is over, and the uptrend will resume.
Toncoin(TON):
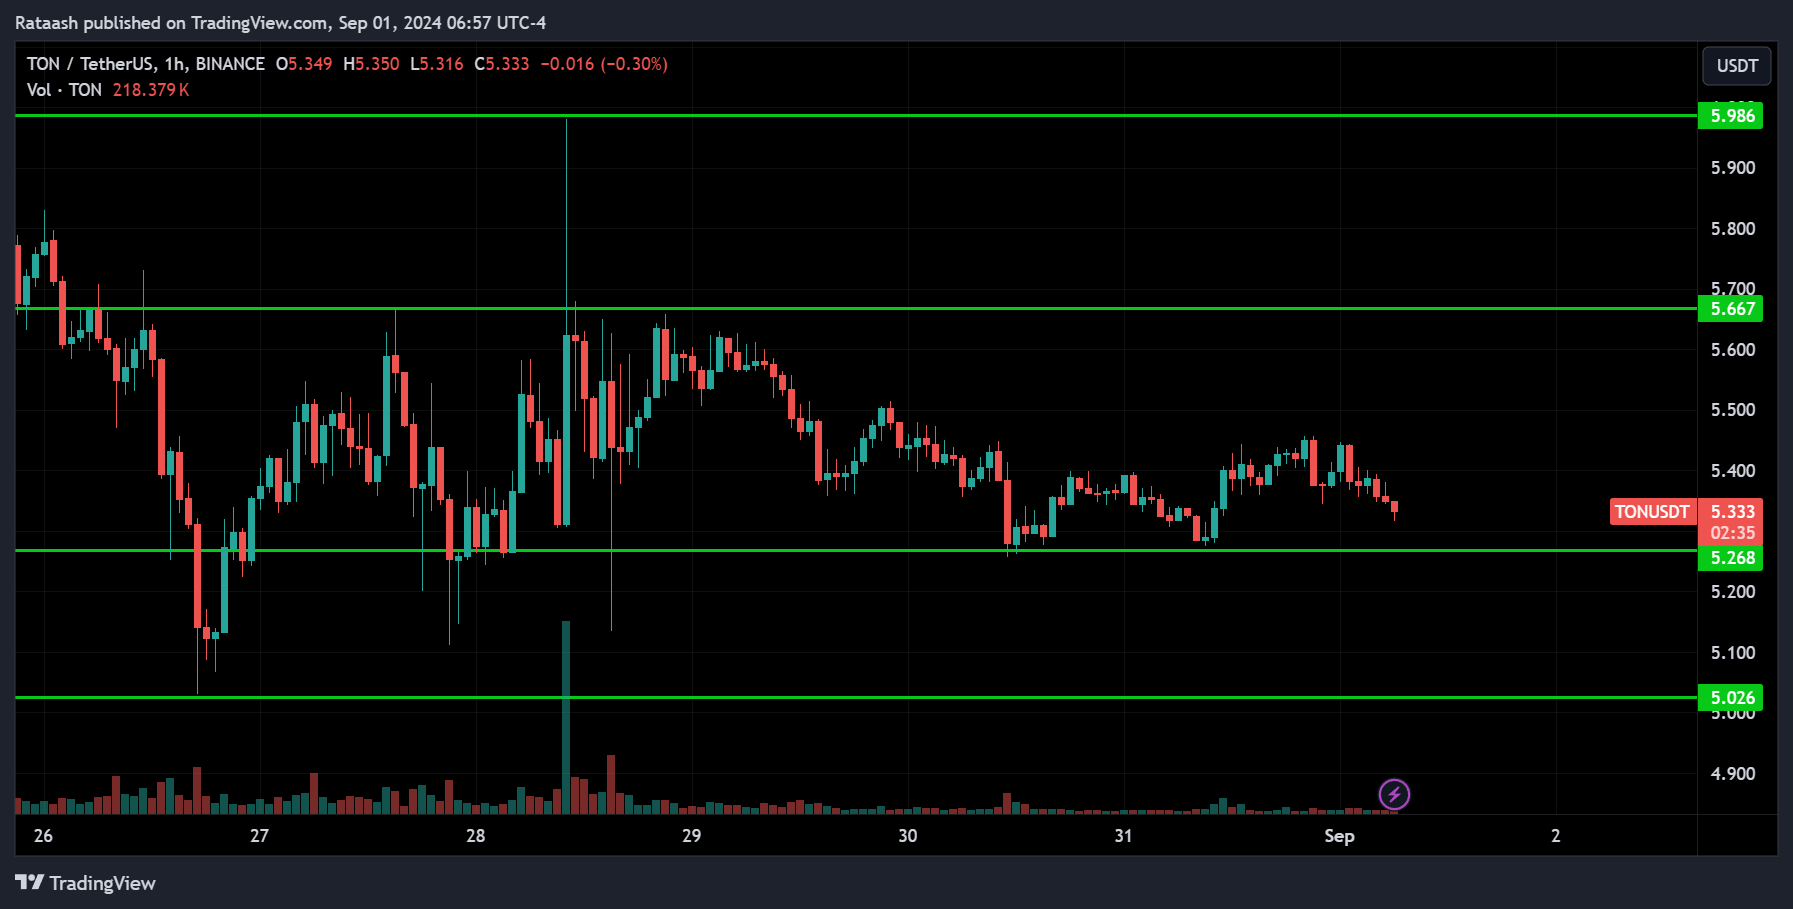
TON Coin (The Open Network) is an innovative blockchain platform originally developed by Telegram. It’s designed to be highly scalable, secure, and user-friendly. What sets TON apart is its unique architecture, which allows it to handle millions of transactions per second, making it one of the fastest blockchains in the market.
TON Coin benefits from low transaction fees, which is attractive for both developers and users who want to build and interact with decentralized applications (dApps) or transfer assets efficiently. The platform uses a proof-of-stake consensus mechanism, ensuring high security and energy efficiency.
Additionally, TON has a rich ecosystem with features like decentralized storage, proxy services, and domain names, making it a versatile platform for various blockchain-based projects.
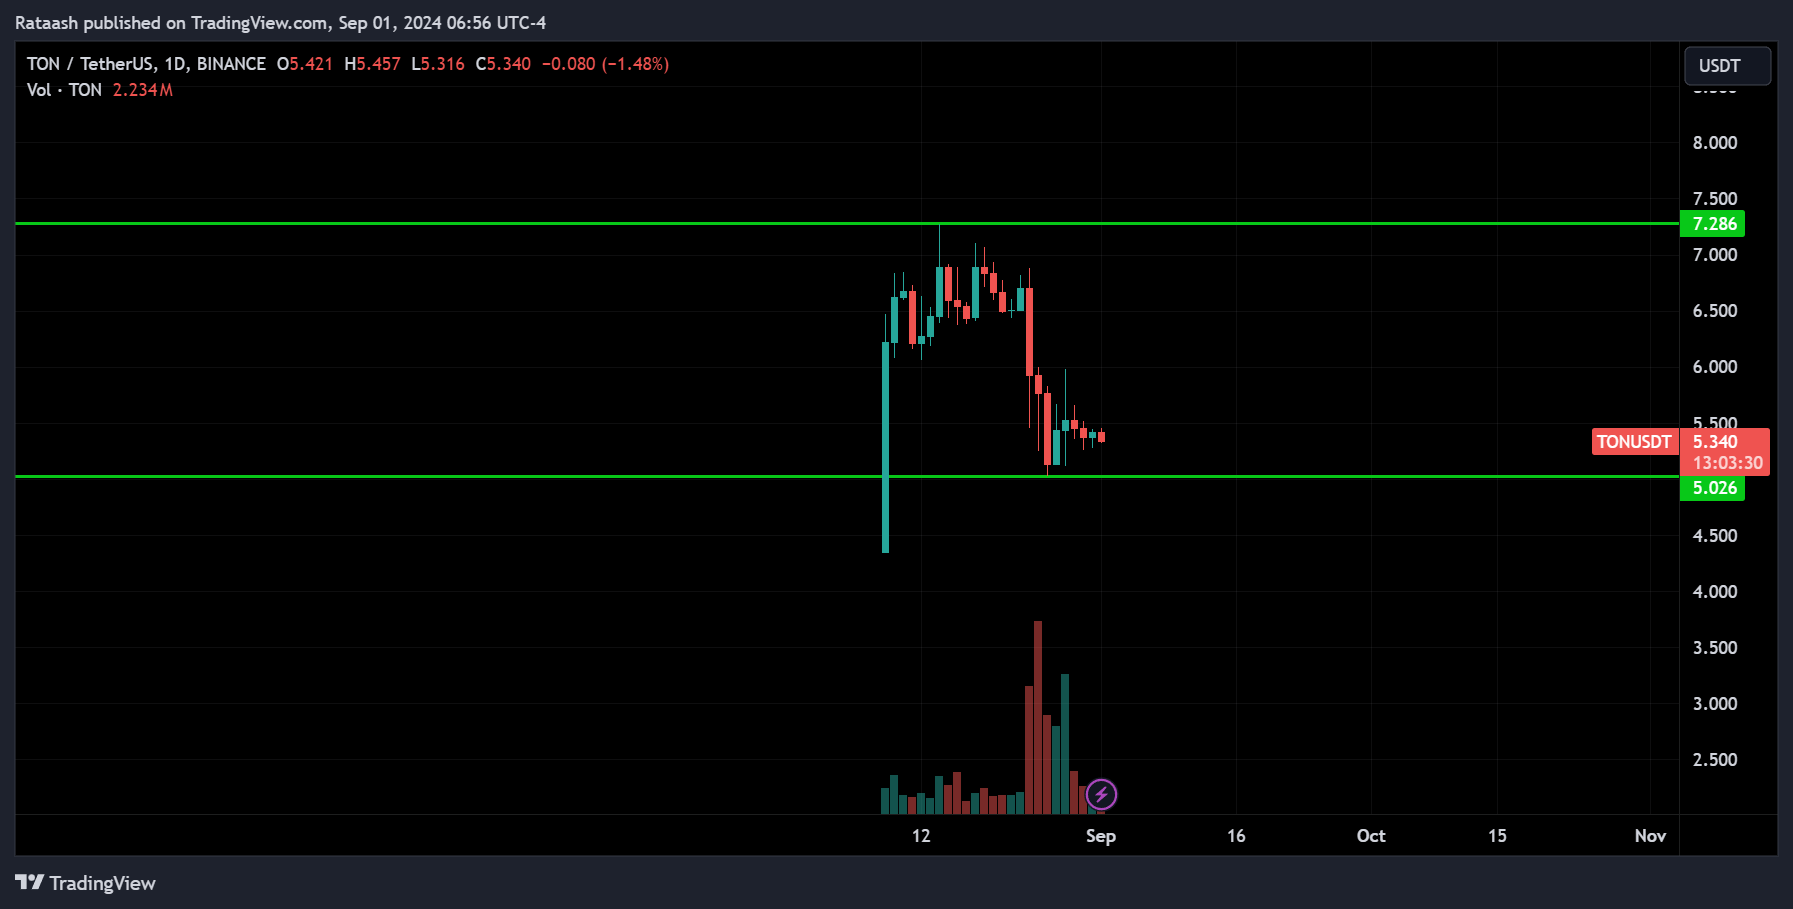
Looking at the price action, after starting trading last month, the price went up and then dropped down to the support level of 5.0. If the price breaks below this level, we can expect it to continue dropping to the 4.5 range. However, the price is more likely to go up since this coin is heavily influenced by fundamentals related to what’s happening with Telegram. If the price breaks above 5.7, we can expect it to enter an uptrend.
Cardano(ADA):
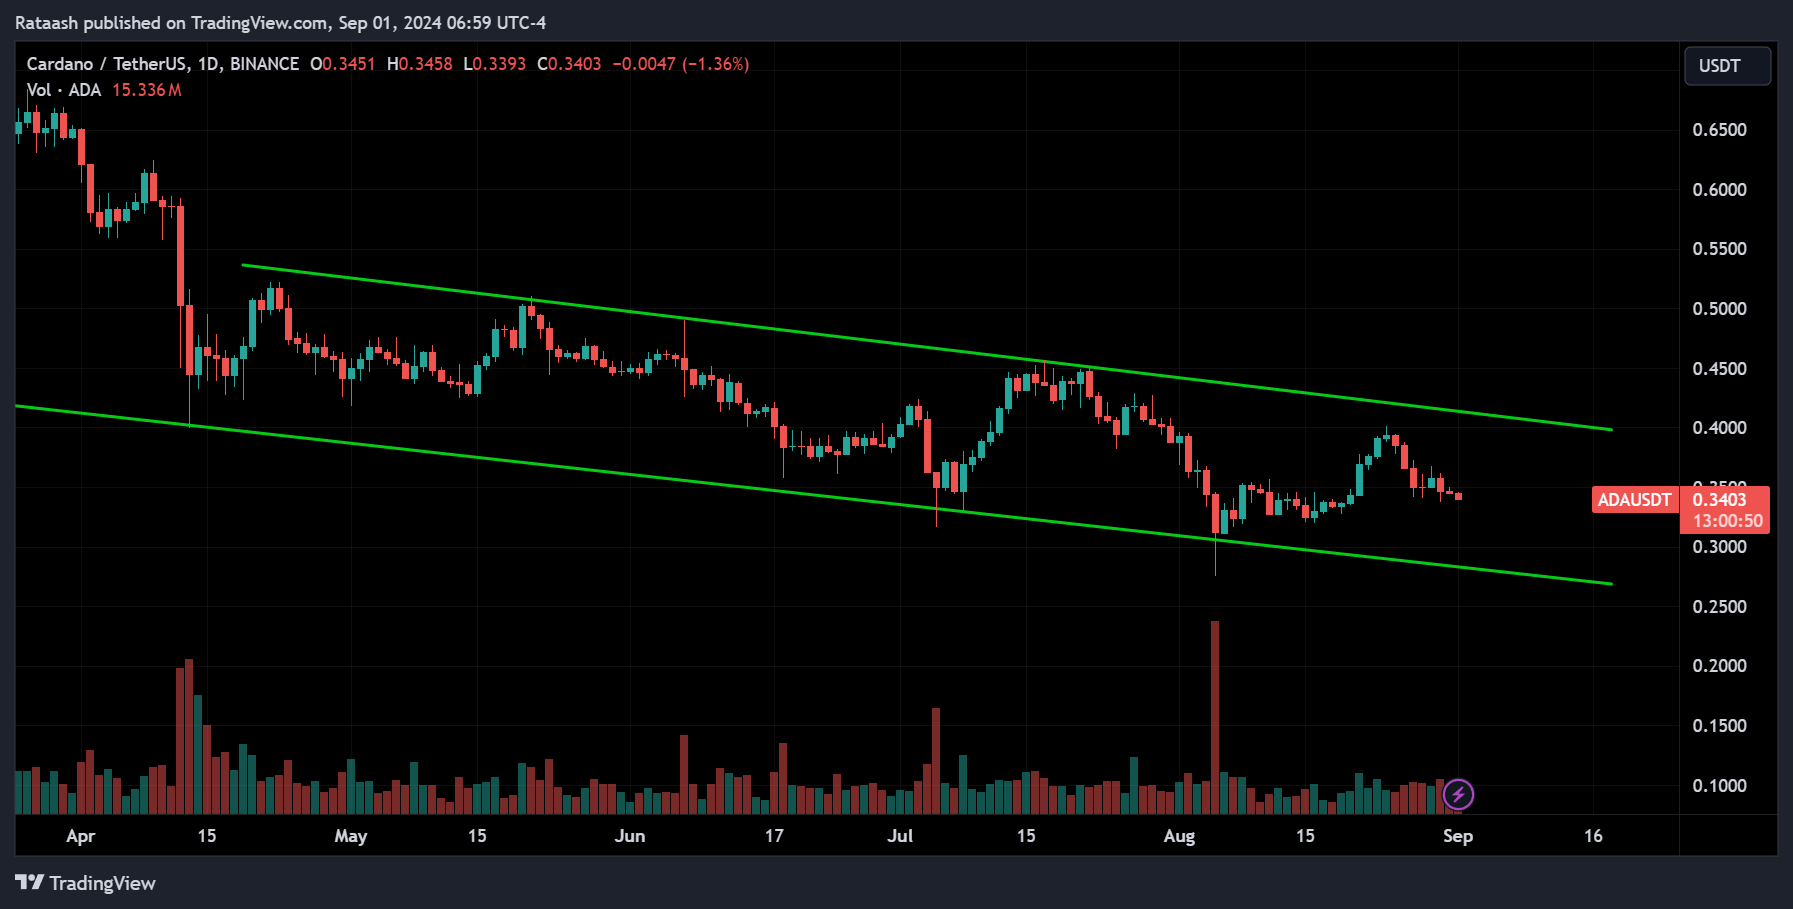
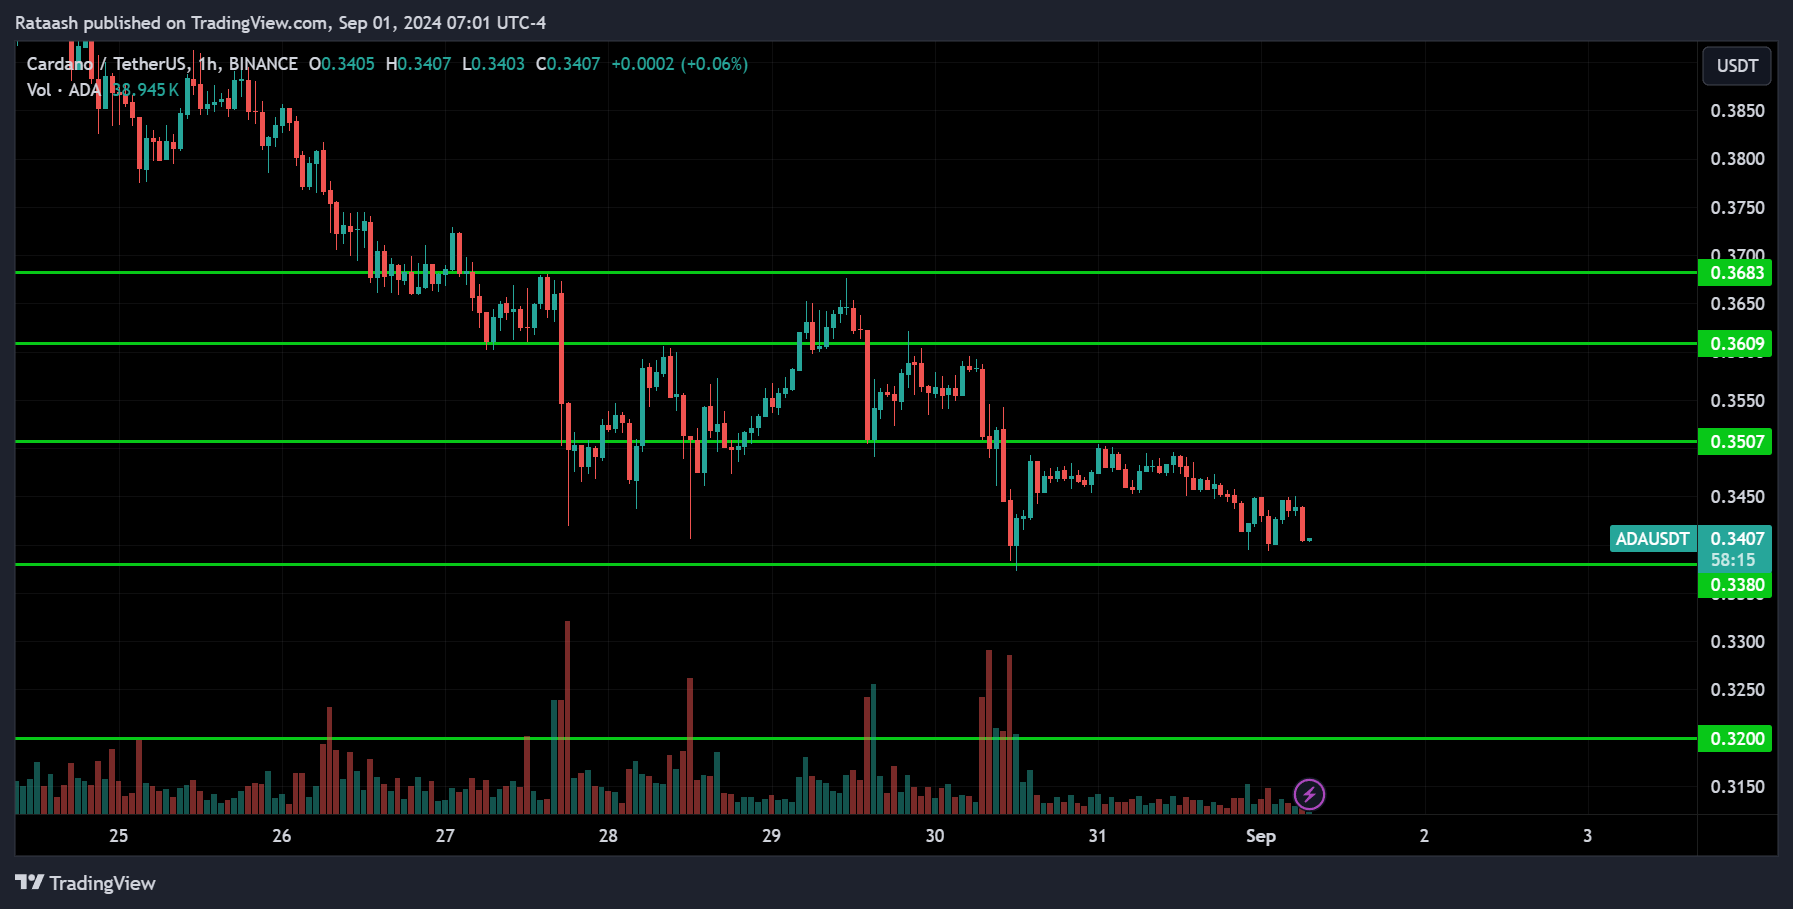
ADA is trending down, with the price currently at the support level of 0.3380. Given the downtrend, we can expect the price to break below this support and continue toward 0.3200. However, if the price breaks above the resistance at 0.3500, we could see it rise to 0.3600, and if that level is also broken, then up to 0.3700.
Avalanche(AVAX):
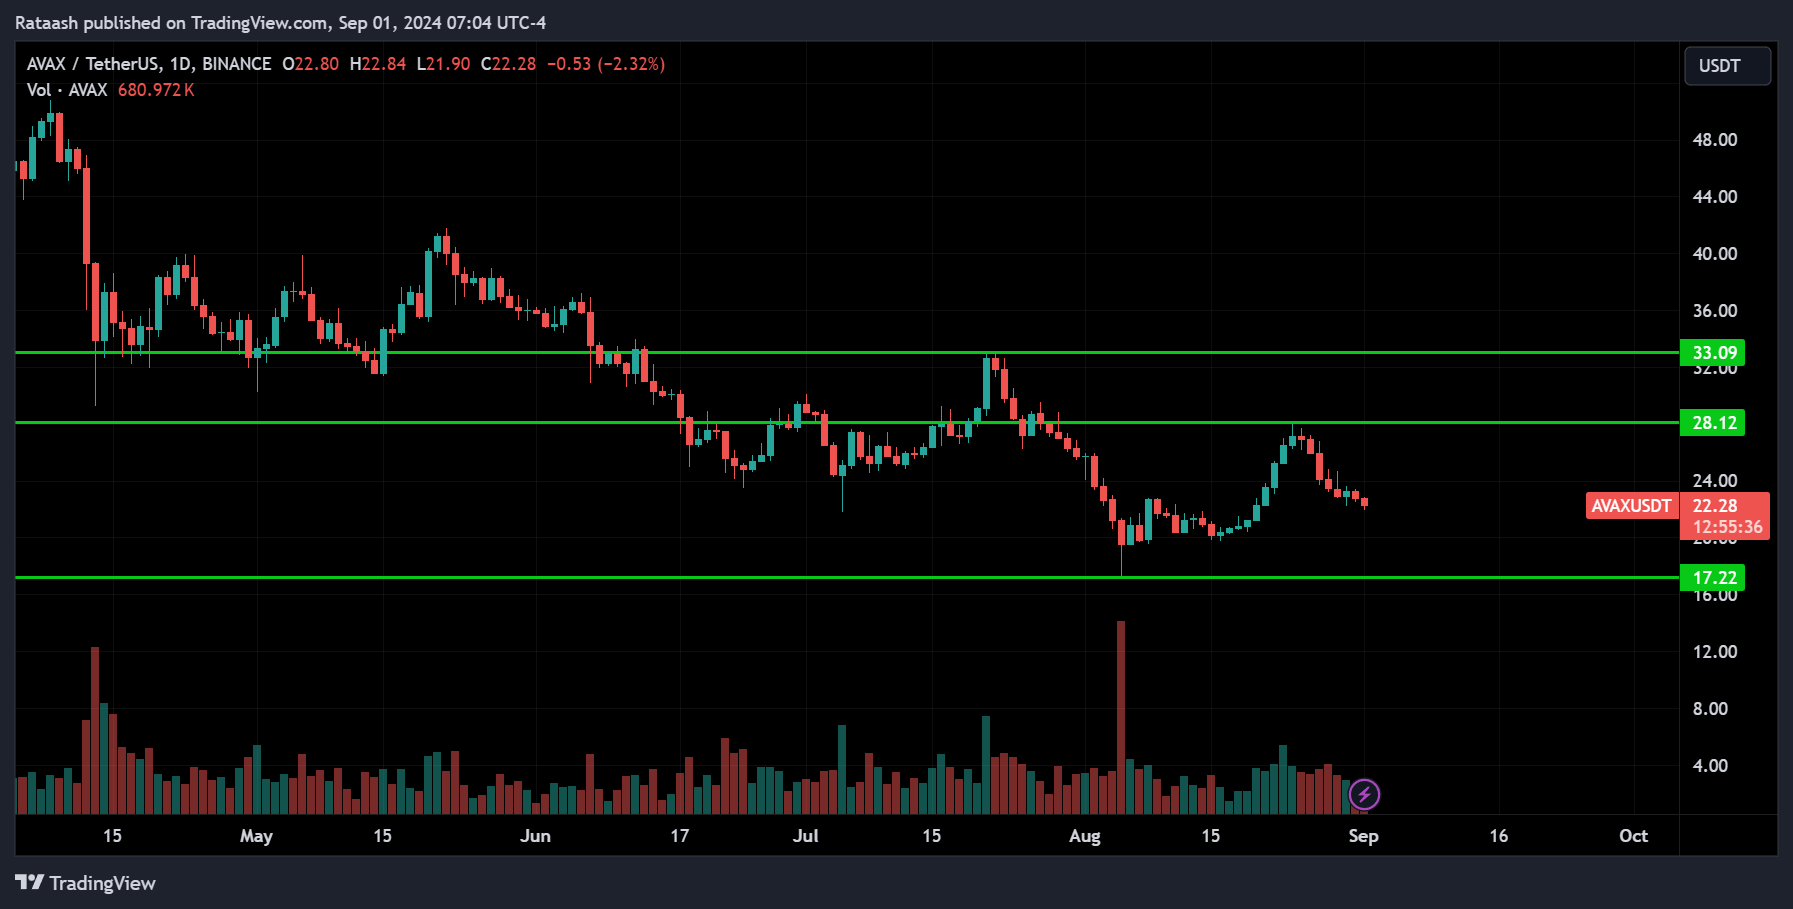
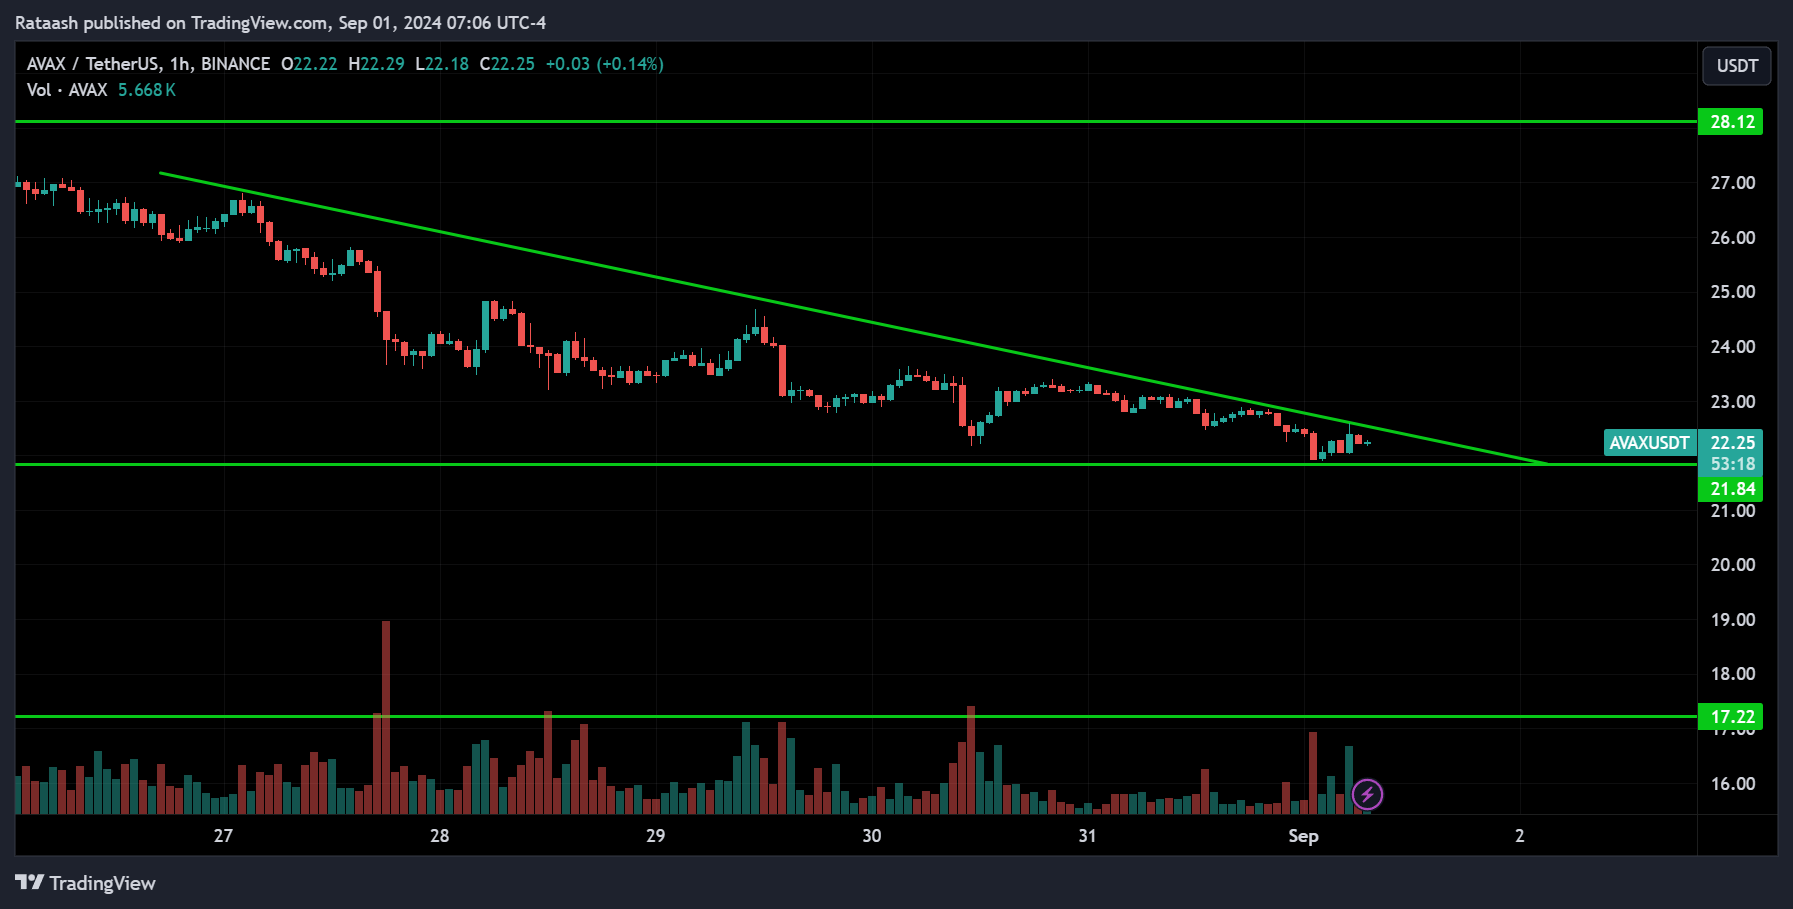
AVAX is also trending down, with the price currently at the support level of 21.80. If the price breaks below this support, we can expect it to drop toward 17.20. On the other hand, if the price breaks above the trend line, we could see it move up toward 28.10.
Shiba Inu(SHIB):
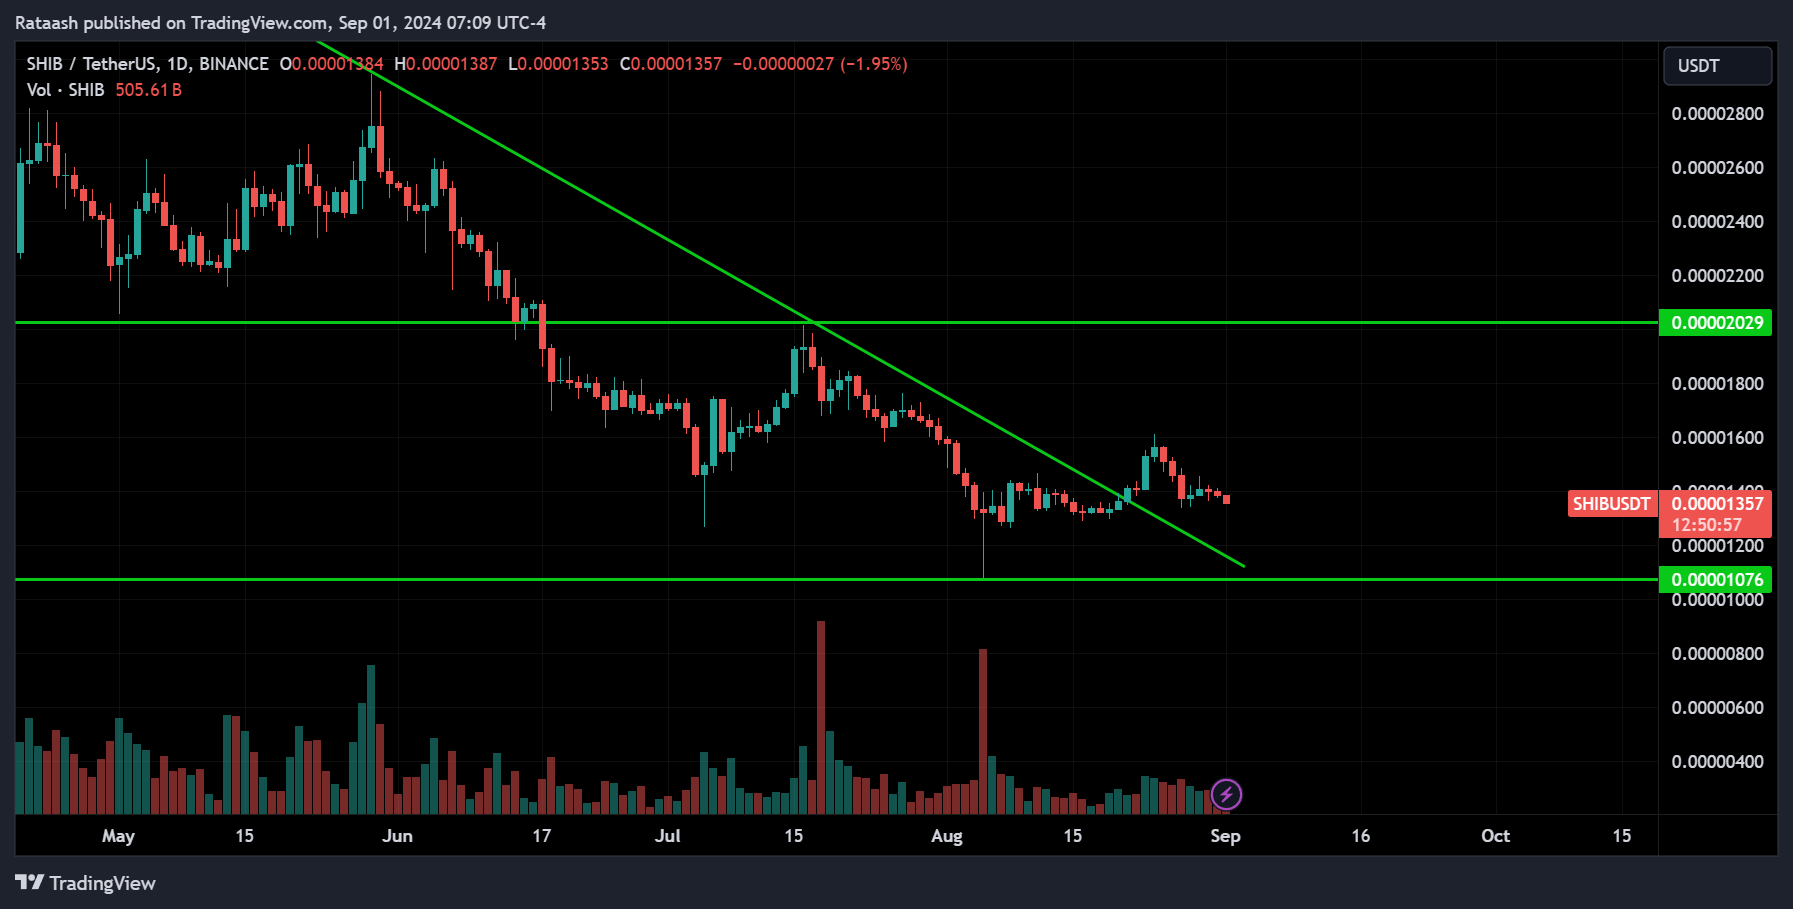
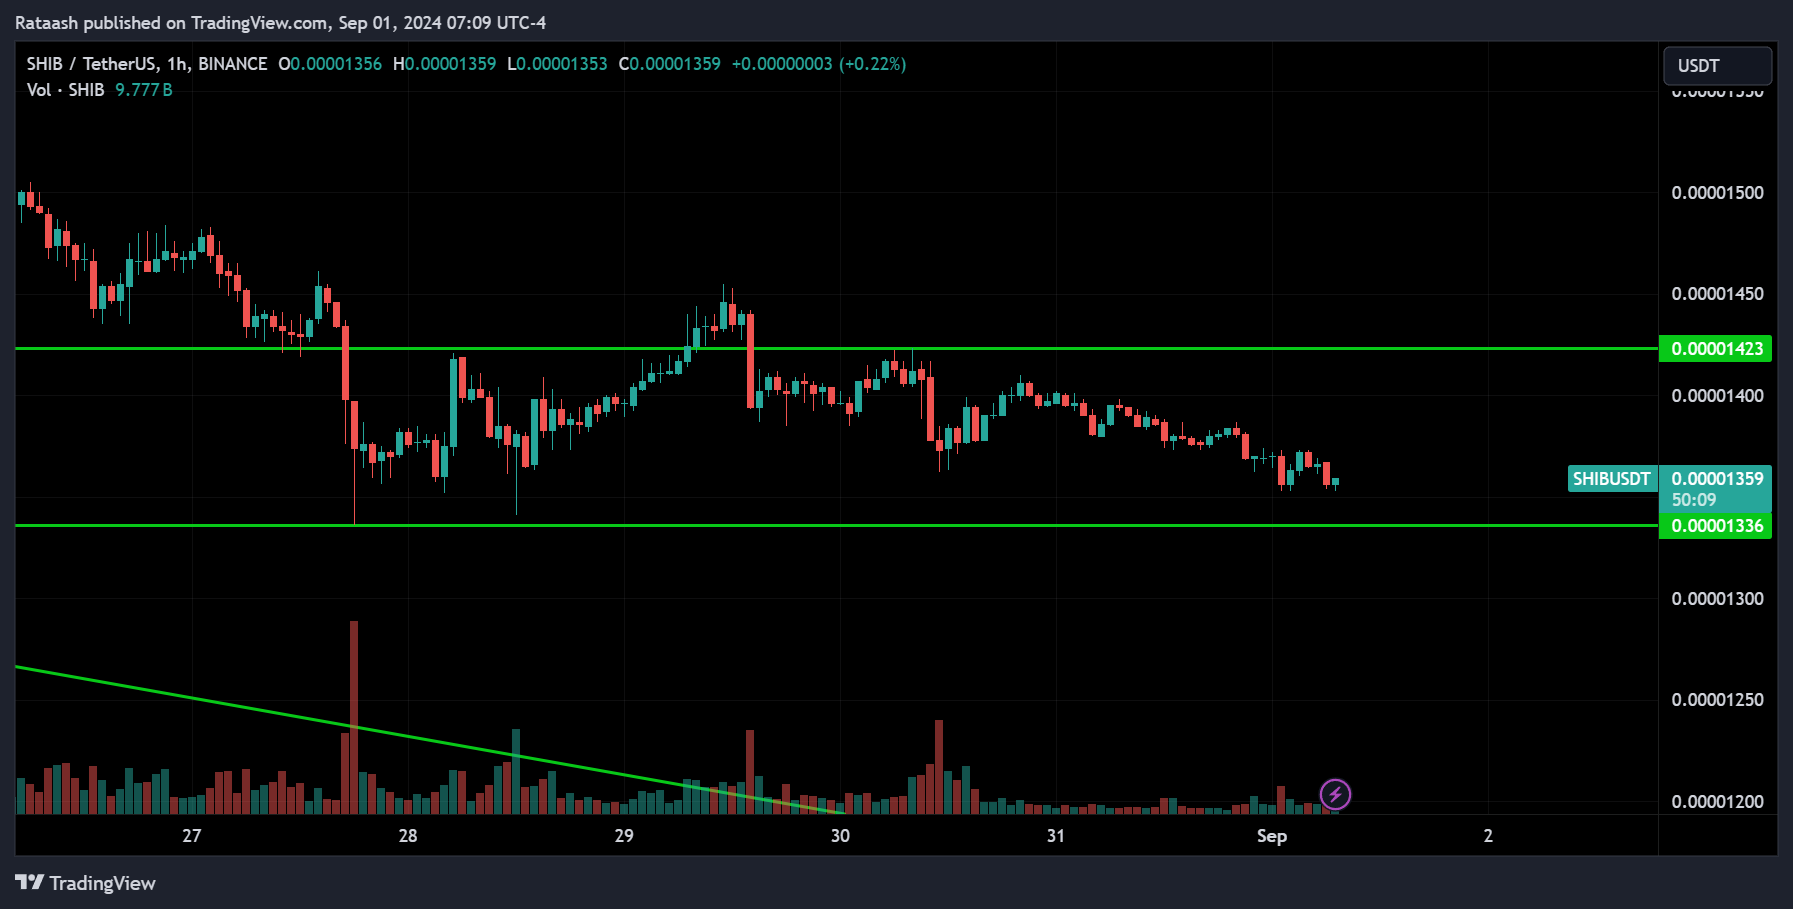
SHIB is still trending down, but the price is currently above the downtrend line, which could be a sign that an uptrend might start. To confirm this, wait for the price to break above the 0.00002000 resistance range, which would signal a confirmed uptrend. On the 1-hour chart, the price is consolidating, with support around 0.00001300. If the price breaks below this level, we can expect it to continue dropping toward 0.00001000. On the other hand, if the price breaks above the 0.00001400 resistance level, we could see it move toward 0.00002000.
Conclusion & Disclaimer
Subscribe to our Telegram channel to get instant updates on new articles.
Please provide your feedback on how we can improve this article. Thank you!
These analyses are here to help you understand how to analyze the market. They’re not about giving buy or sell signals. It’s simply about observing price action market behavior. I don’t recommend when to buy or sell because trading doesn’t work that way. You need a strategy to guide your decisions about when to enter or exit positions. That’s the key to making consistent profits in the financial markets over time.
The information provided in this market analysis is for educational and informational purposes only. It should not be construed as financial advice or a recommendation to buy, sell, or hold any securities or investments.
All investments involve risk, and past performance is not indicative of future results. The analysis provided may not be suitable for all investors and should be used at their own discretion.
Readers are encouraged to conduct their own research.
Trading and investing in financial markets carry inherent risks, including the risk of losing invested capital. It is important to carefully consider your investment objectives, risk tolerance, and financial situation before making any investment decisions.
GOOD LUCK✌!!!