![Price Action Forex Forecast [2024.08.23]: Key Price Levels, and Trends for Major Forex Pairs - Jackson Hole Symposium and Jerome Powell
xlearnonline.com](https://xlearnonline.com/wp-content/uploads/2024/08/Forex-Analysis-1-2.jpg)
Hi, welcome to xlearn’s daily price action forex forecast for day traders.
Before we jump into the actual analysis, let’s take a look at the major economic events that could affect the market.
Key Economic Events Today
These events encompass important global news, macroeconomic reports, and economic indicators. For more details, you can check the forex factory.
- 8:30 ET: Canada will release its monthly Retail Sales data, showing the change in total sales at the retail level. The previous value was -0.8%, and the forecast is -0.3%. If the actual number is higher than the forecast, it’s good for the Canadian dollar (CAD). This report, released about 50 days after the month ends, is a key indicator of consumer spending, which makes up most of the economy, so it has a strong impact on CAD currency pairs.
- Jackson Hole Symposium: The Economic Policy Symposium, held in Jackson Hole, Wyoming, brings together central bankers, finance ministers, academics, and financial market participants from around the world. While the meetings are closed to the press, officials often speak with reporters during the day. Comments and speeches from these central bankers and key officials can cause major market volatility.
- 10:00 ET: Federal Reserve Chair Jerome Powell will speak about the economic outlook at the Jackson Hole Economic Policy Symposium in Wyoming. As the head of the central bank that controls short-term interest rates, Powell has more influence on the nation’s currency value than anyone else. Traders pay close attention to his speeches because he often gives hints about future monetary policy. If his remarks are more hawkish than expected, it’s good for the currency.
- 11:00 ET: BOE Governor Andrew Bailey will speak at the Jackson Hole Economic Policy Symposium in Wyoming. As the head of the central bank that controls short-term interest rates, Bailey has more influence on the nation’s currency value than anyone else. Traders closely watch his speeches because he often gives hints about future monetary policy. If his comments are more hawkish than expected, it’s good for the currency.
Price Action Forex Market Analysis
EURUSD:
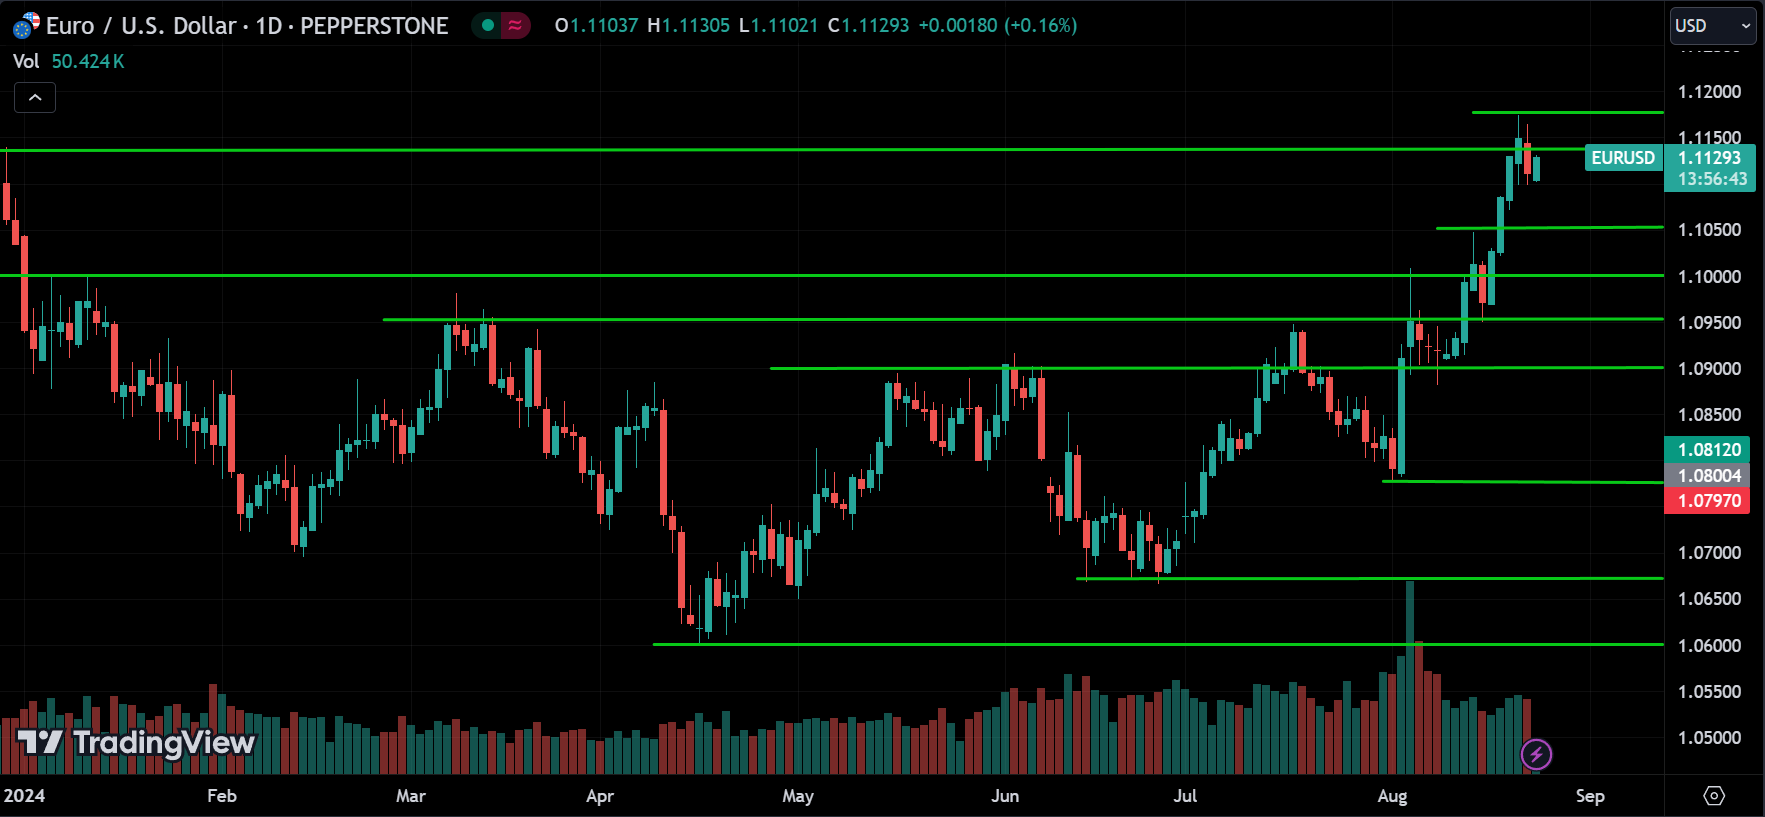
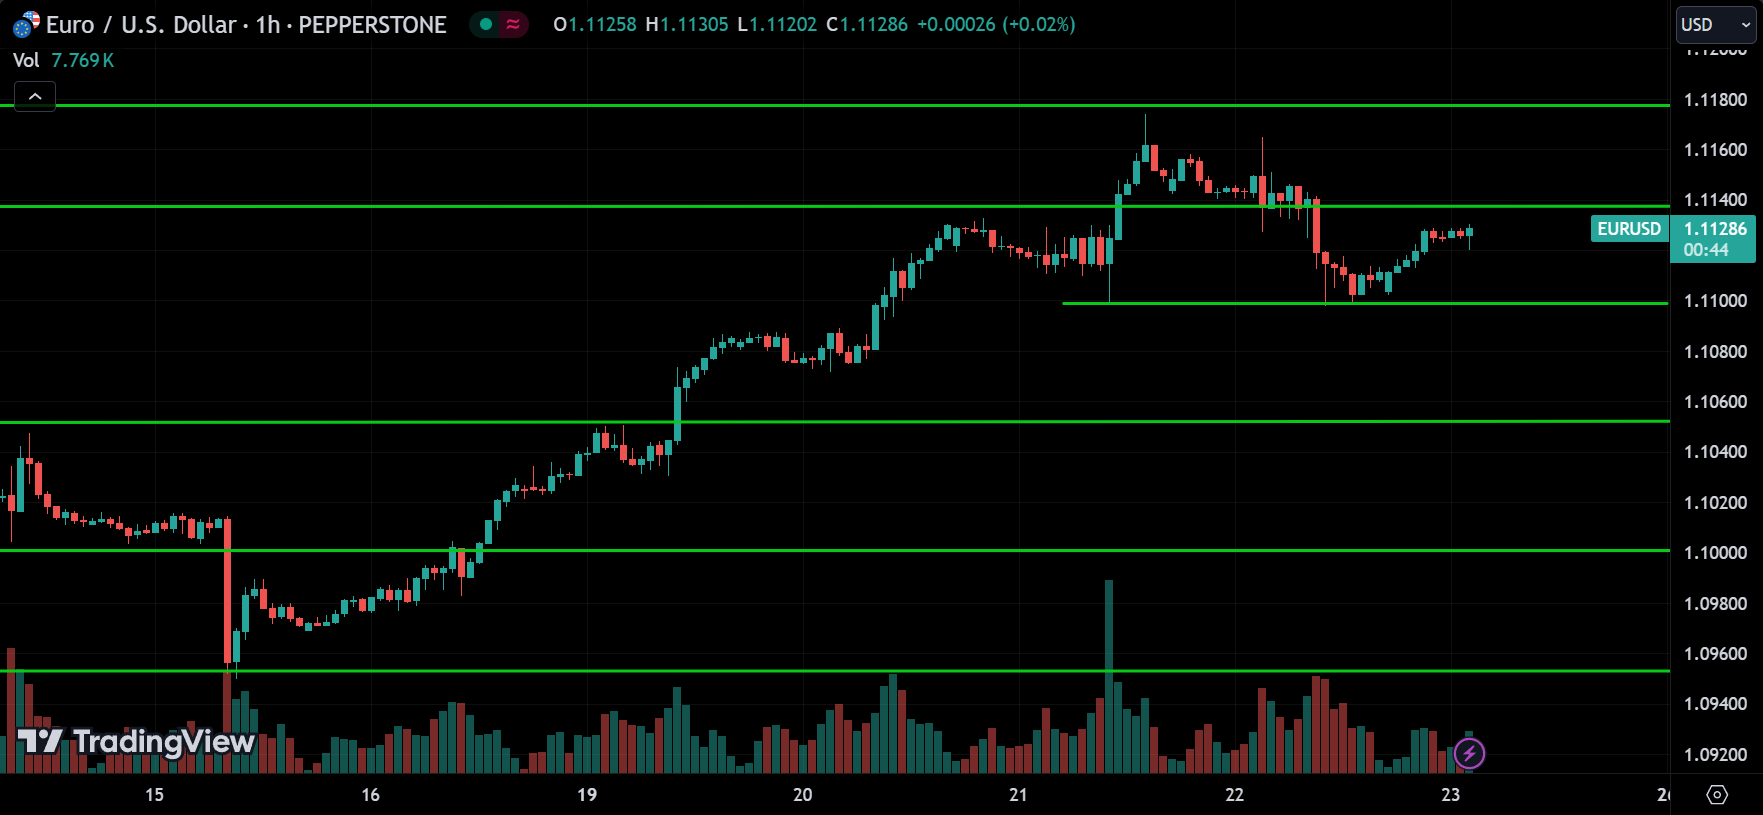
EURUSD is trending up. After hitting a resistance level at 1.11800, the price pulled back for a correction and found support around 1.11000. Now, it’s starting to rise again. There’s a resistance around 1.11400; if the price breaks above it, we could see it move back to the previous major resistance at 1.11800. If that level is also broken, the price may continue to rise. However, be cautious if the price falls below 1.11000, as this could signal the start of a downtrend, potentially moving to the next support levels.
USDCAD:
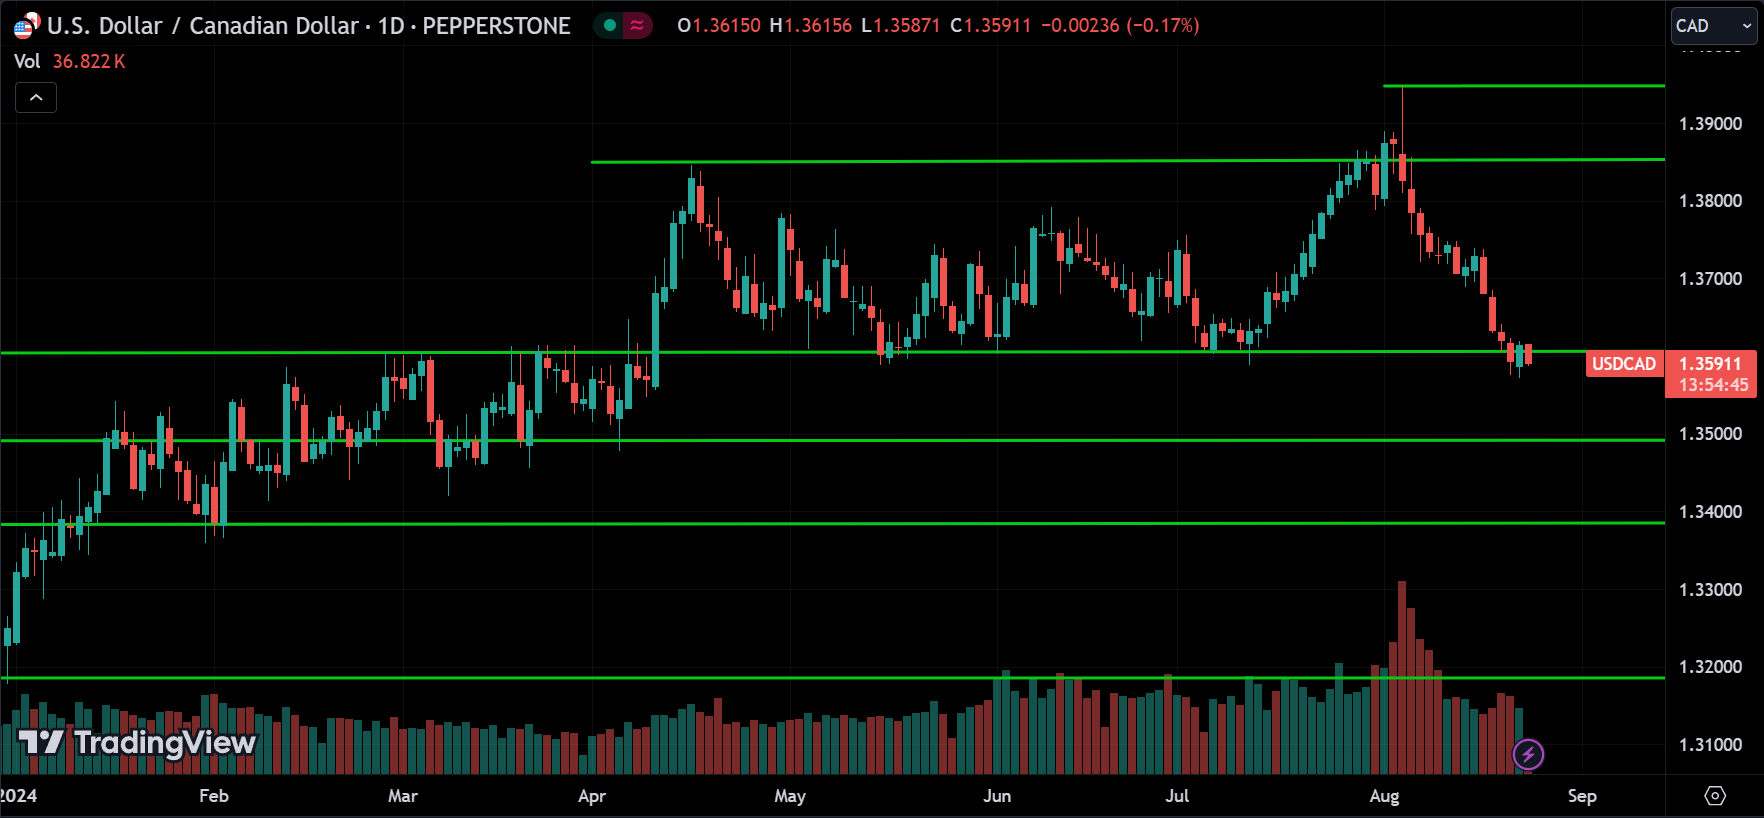
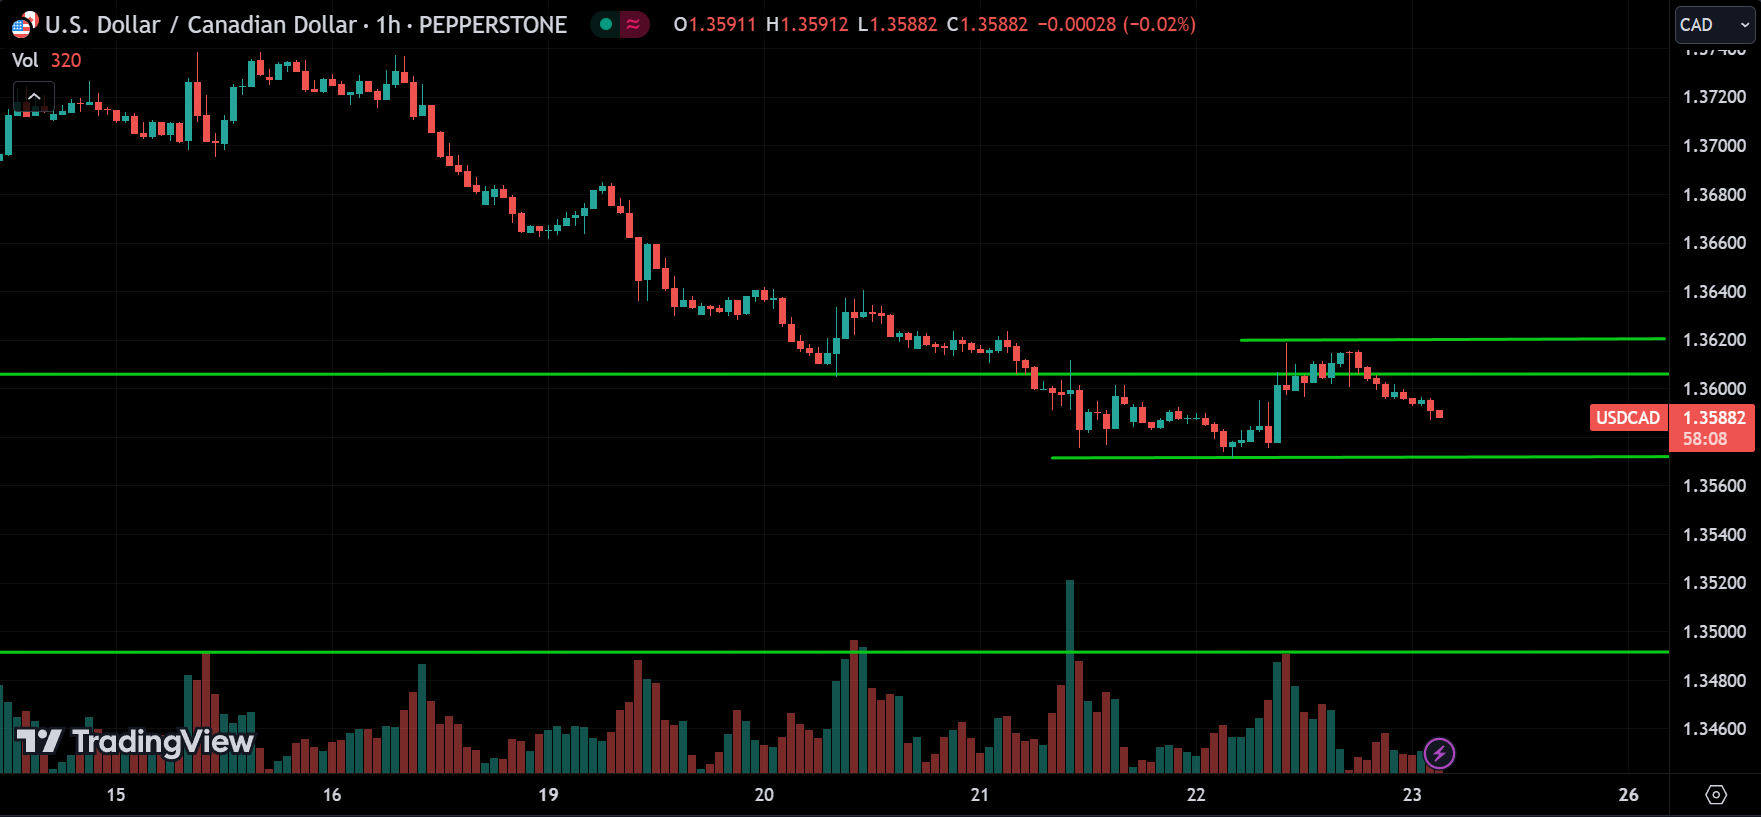
USDCAD is trending down and has broken below the major support level at 1.36000. It found some support around the 1.35700 range, corrected to 1.36200, and is now starting to drop again. If the price breaks below 1.35700, we can expect it to continue dropping toward 1.35000. On the other hand, if the price breaks above 1.36200, it might start going up. However, a downward breakout is more likely.
USDJPY:

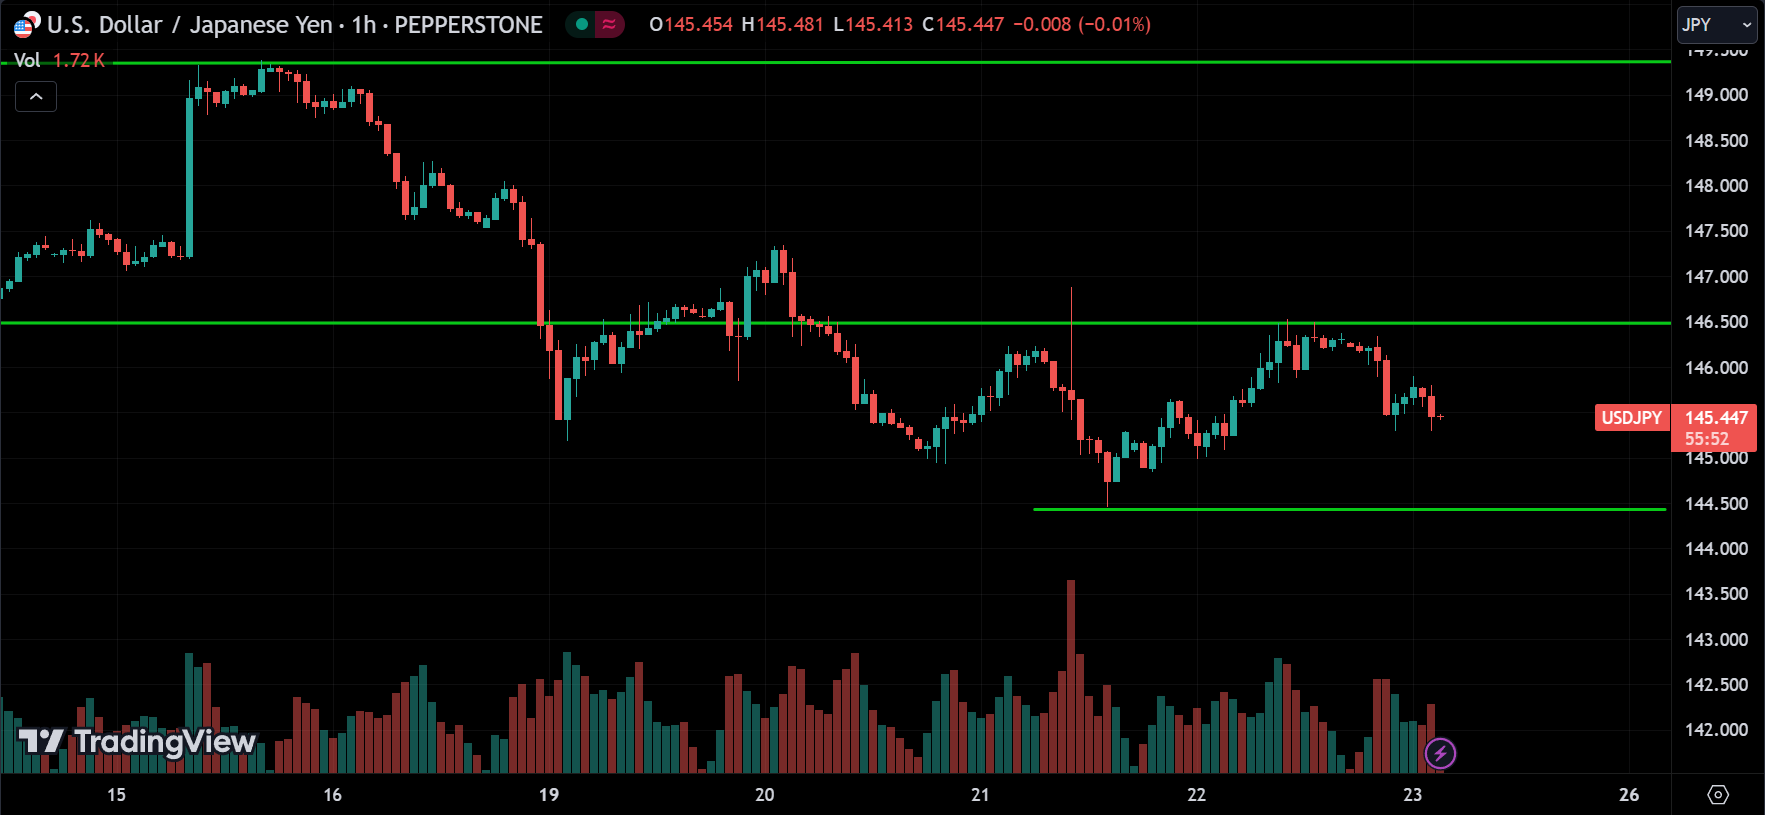
USDJPY is also trending down. As we discussed earlier, it found support around 142, made a correction, and is now dropping from the resistance at 146.500. If the price breaks below the 144.500 range, we can expect it to continue dropping toward 140. On the other hand, if the price breaks above 146.500, it could start moving up to 149.500. It’s important to wait for a breakout to confirm the trend.
USDCHF:
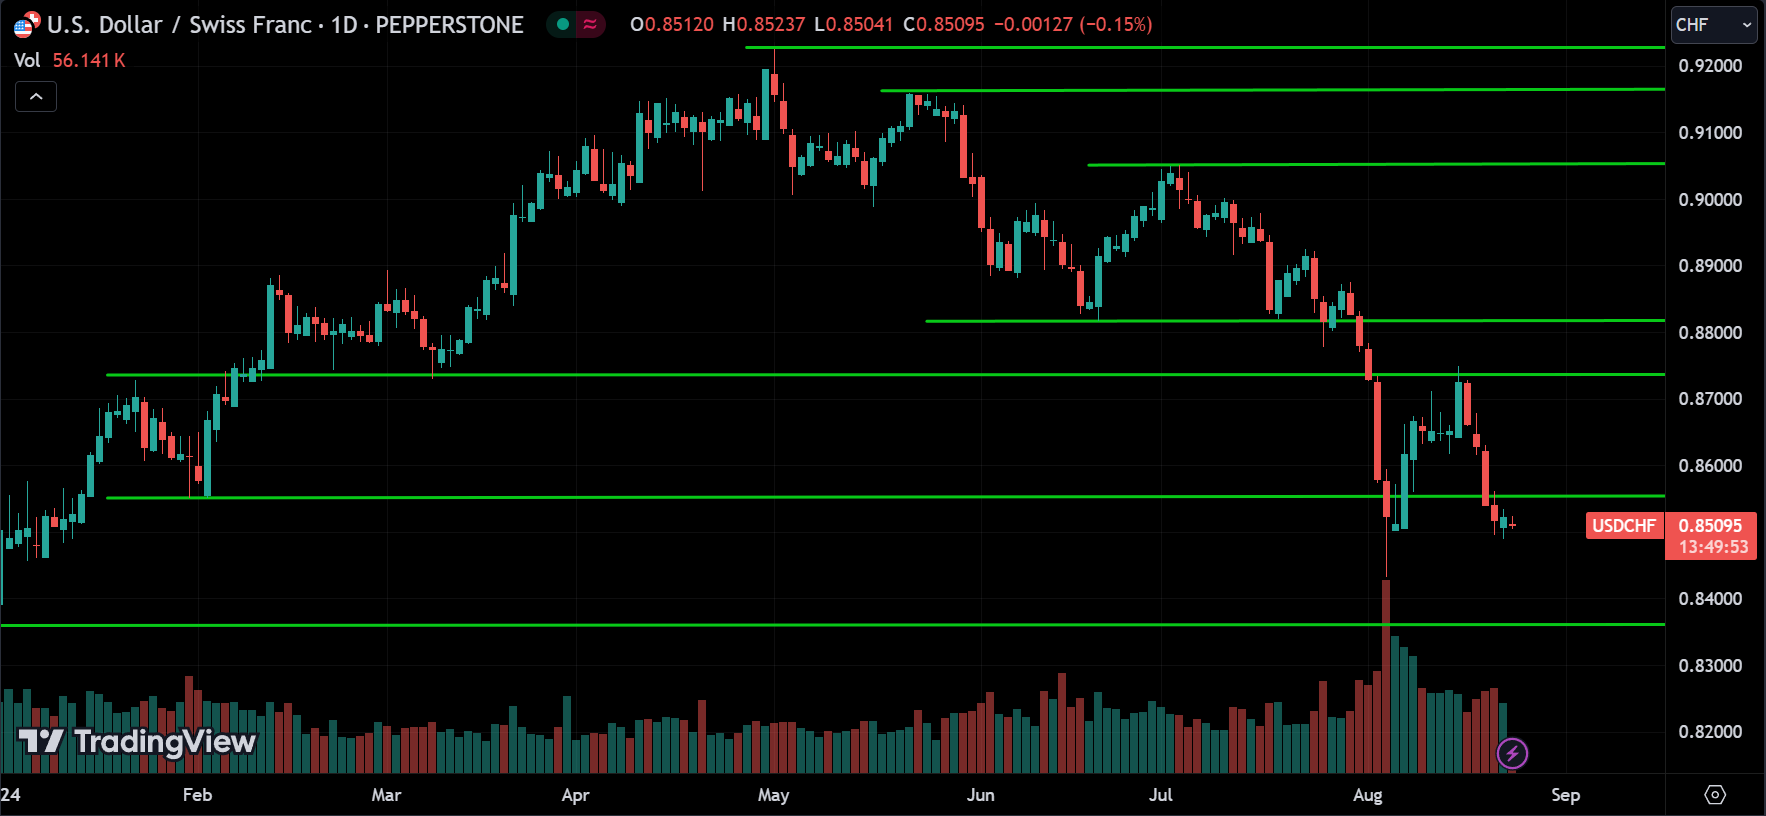
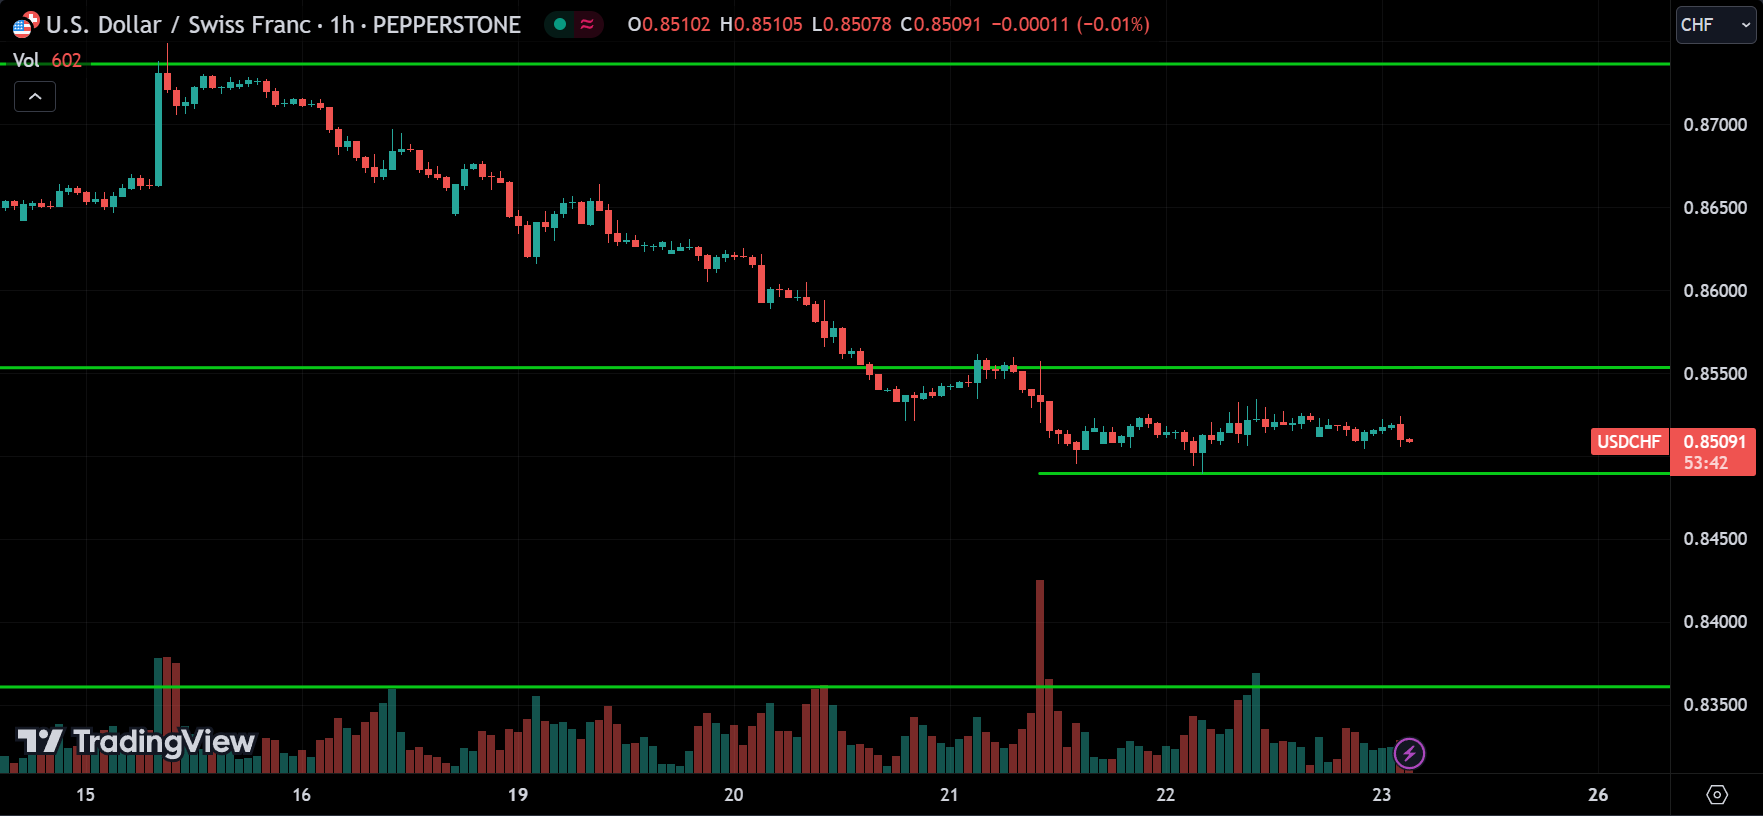
USDCHF is following a similar pattern. It was trending down, found support around 0.84000, pulled back for a correction, and has now started dropping again. Currently, it’s consolidating between support at 0.85000 and resistance at 0.85500. Since it’s in a downtrend, the price is more likely to break below the support and continue dropping toward 0.83500. However, anything can happen in the markets, so if it breaks above the resistance, we could see a bullish trend for a while, with the price possibly heading toward 0.87400.
GBPUSD:
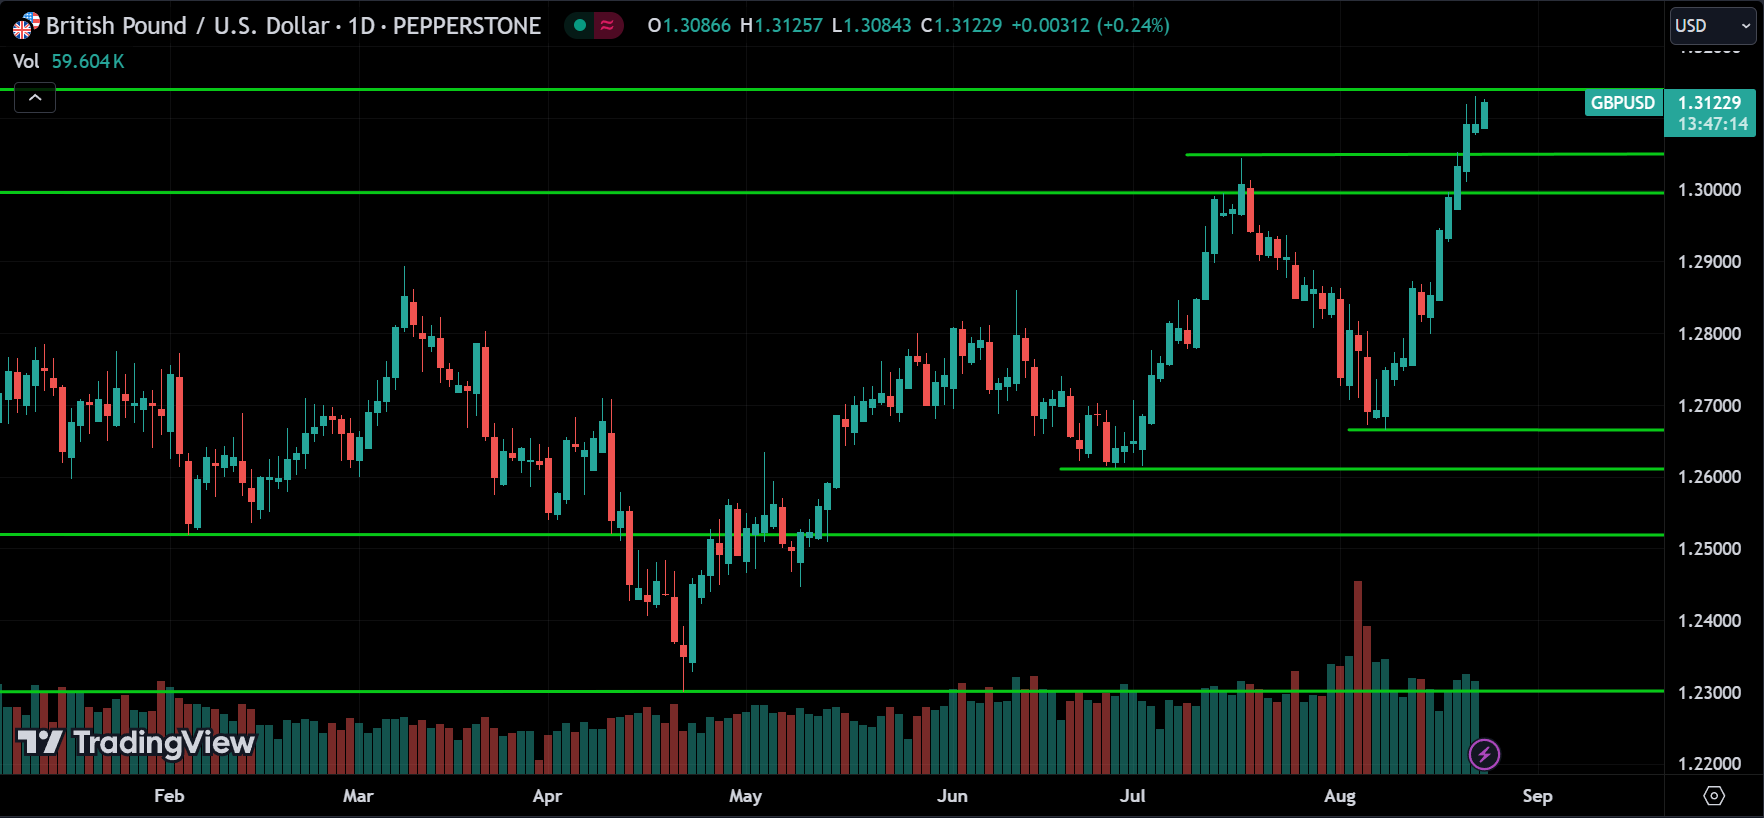
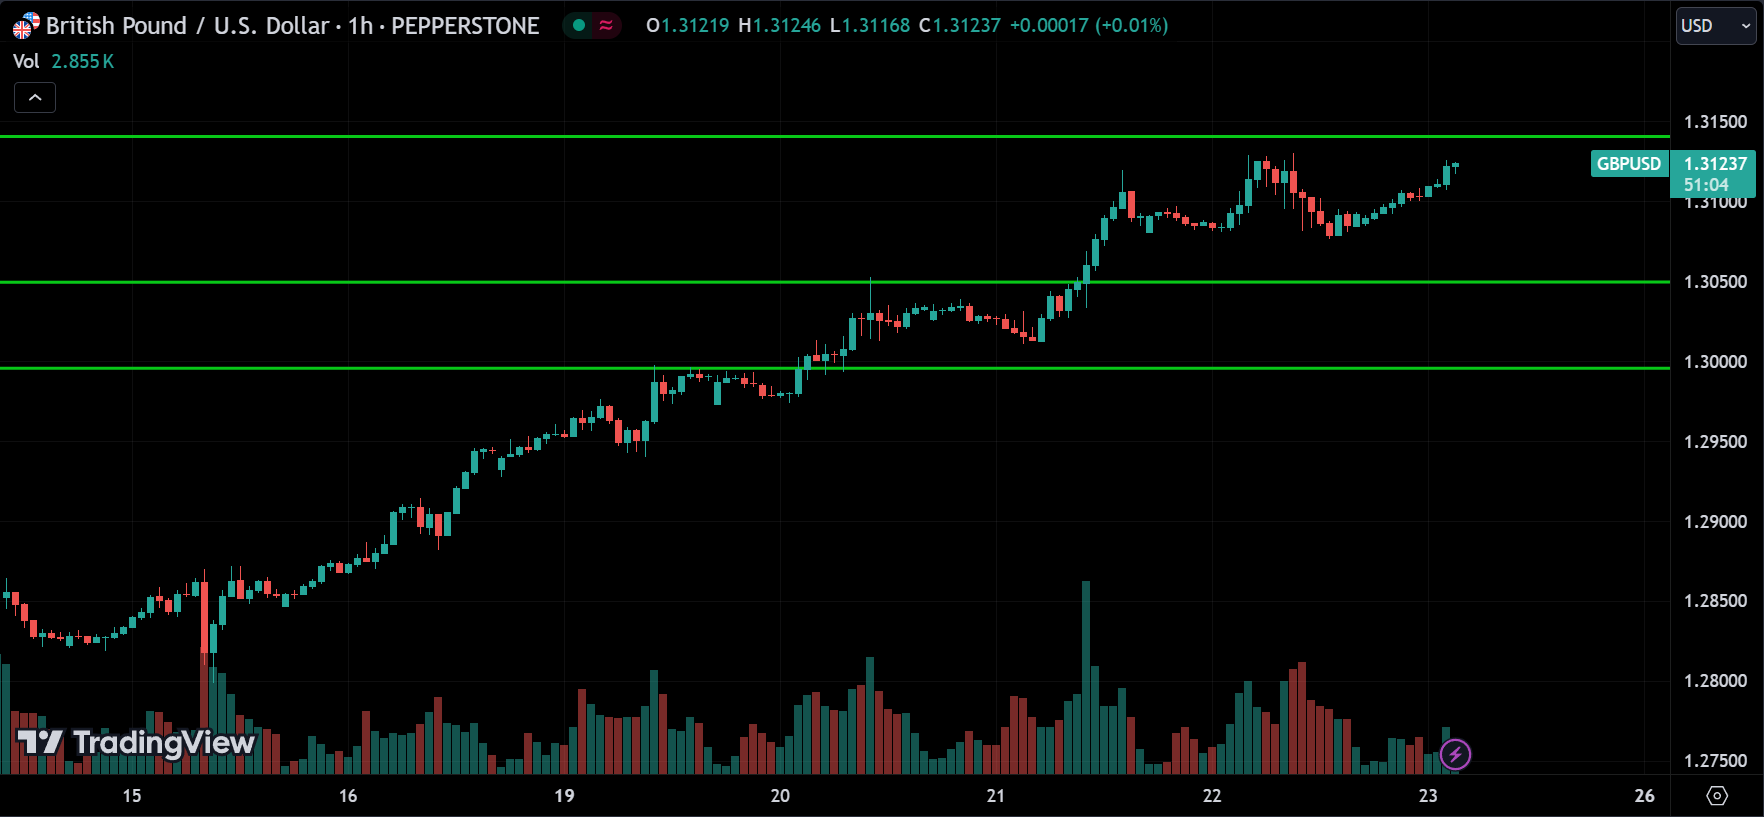
GBPUSD is trending up, and the 1-hour chart clearly shows a strong uptrend. The price is now approaching the resistance at 1.31500 again. If the price breaks above this resistance, we can expect it to keep going up. However, since this is a major resistance level, a correction or reversal could also happen. So, keep an eye out for breakout or reversal signals.
AUDUSD:
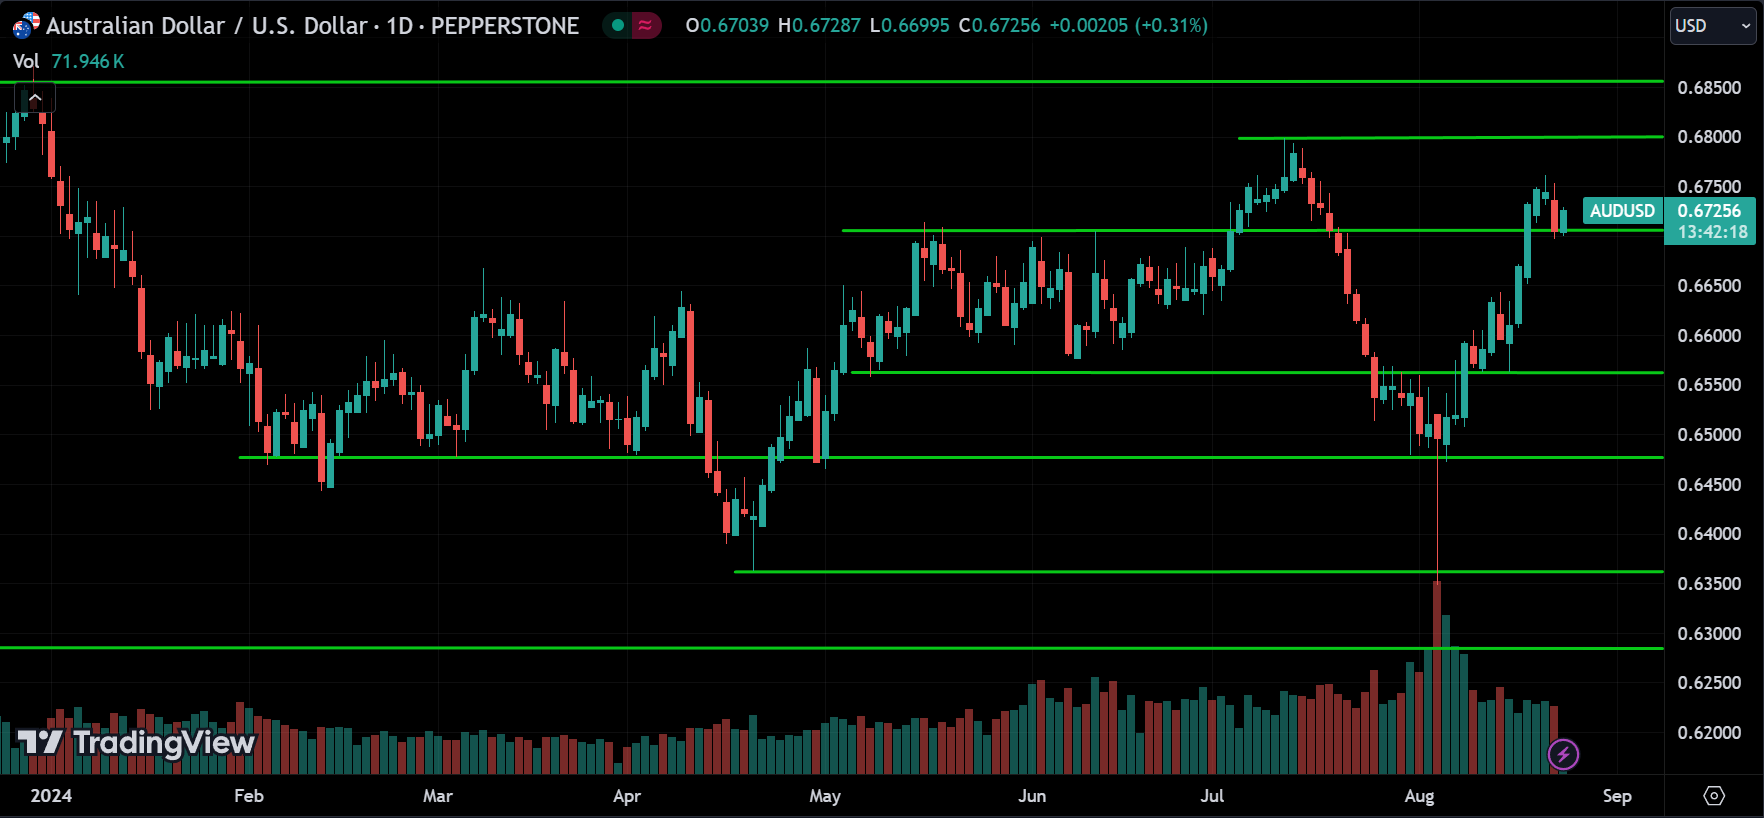
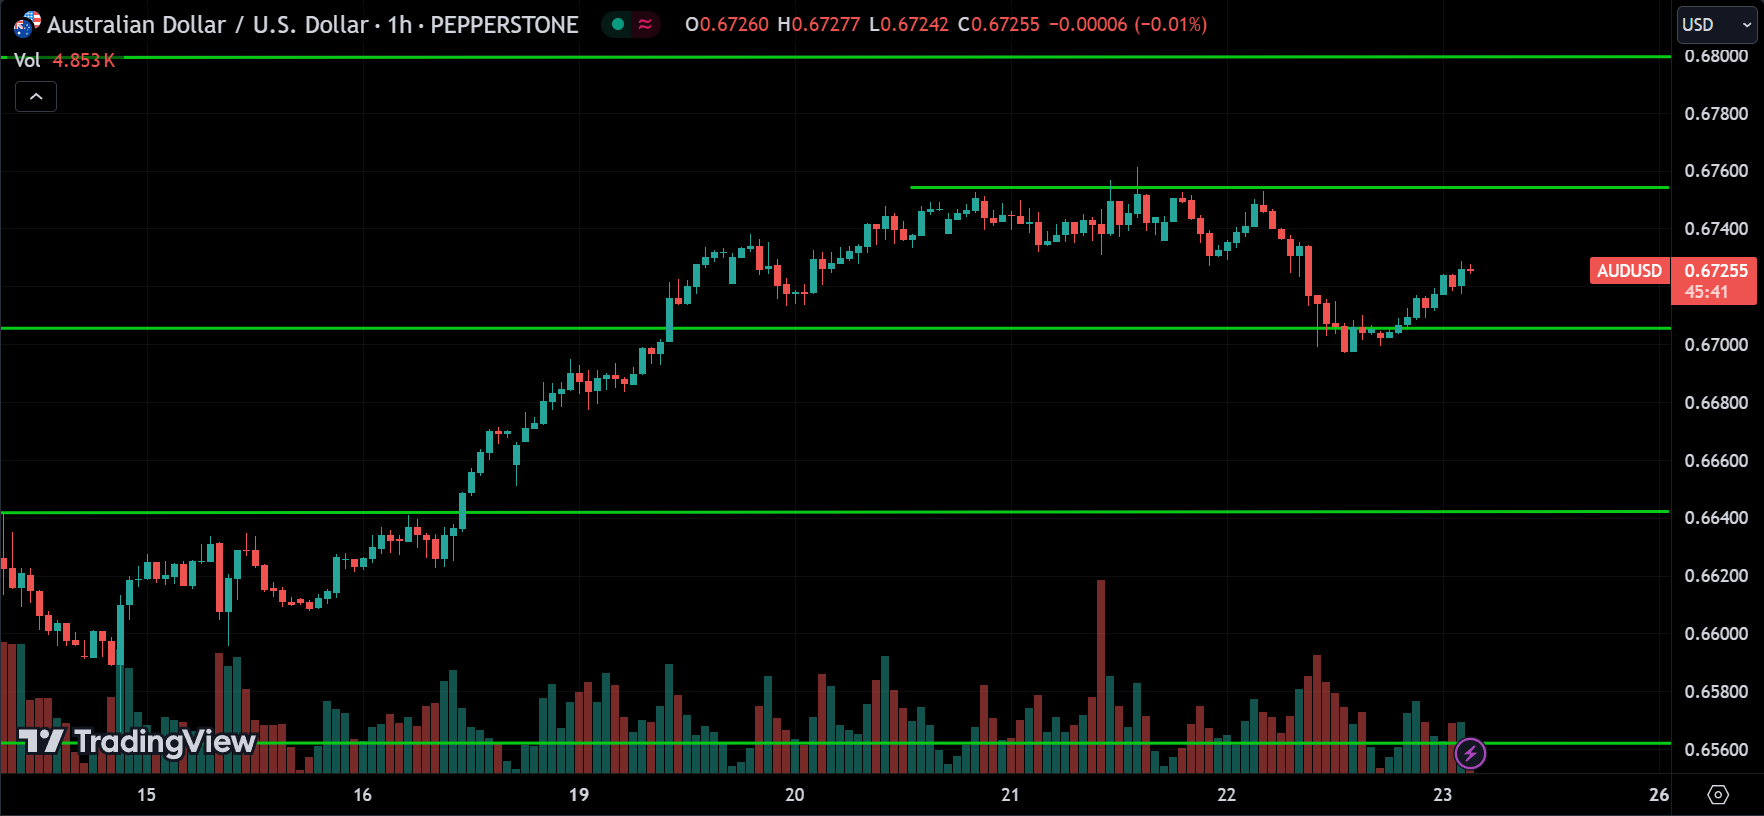
AUDUSD is trending up. After reaching the resistance level at 0.67600, the price corrected down to the support at 0.67000 and is now starting to rise again. If the price breaks above the 0.67600 range, we can expect it to continue up toward 0.68000. However, be aware that reversals could also happen around the 0.67600 range.
NZDUSD:
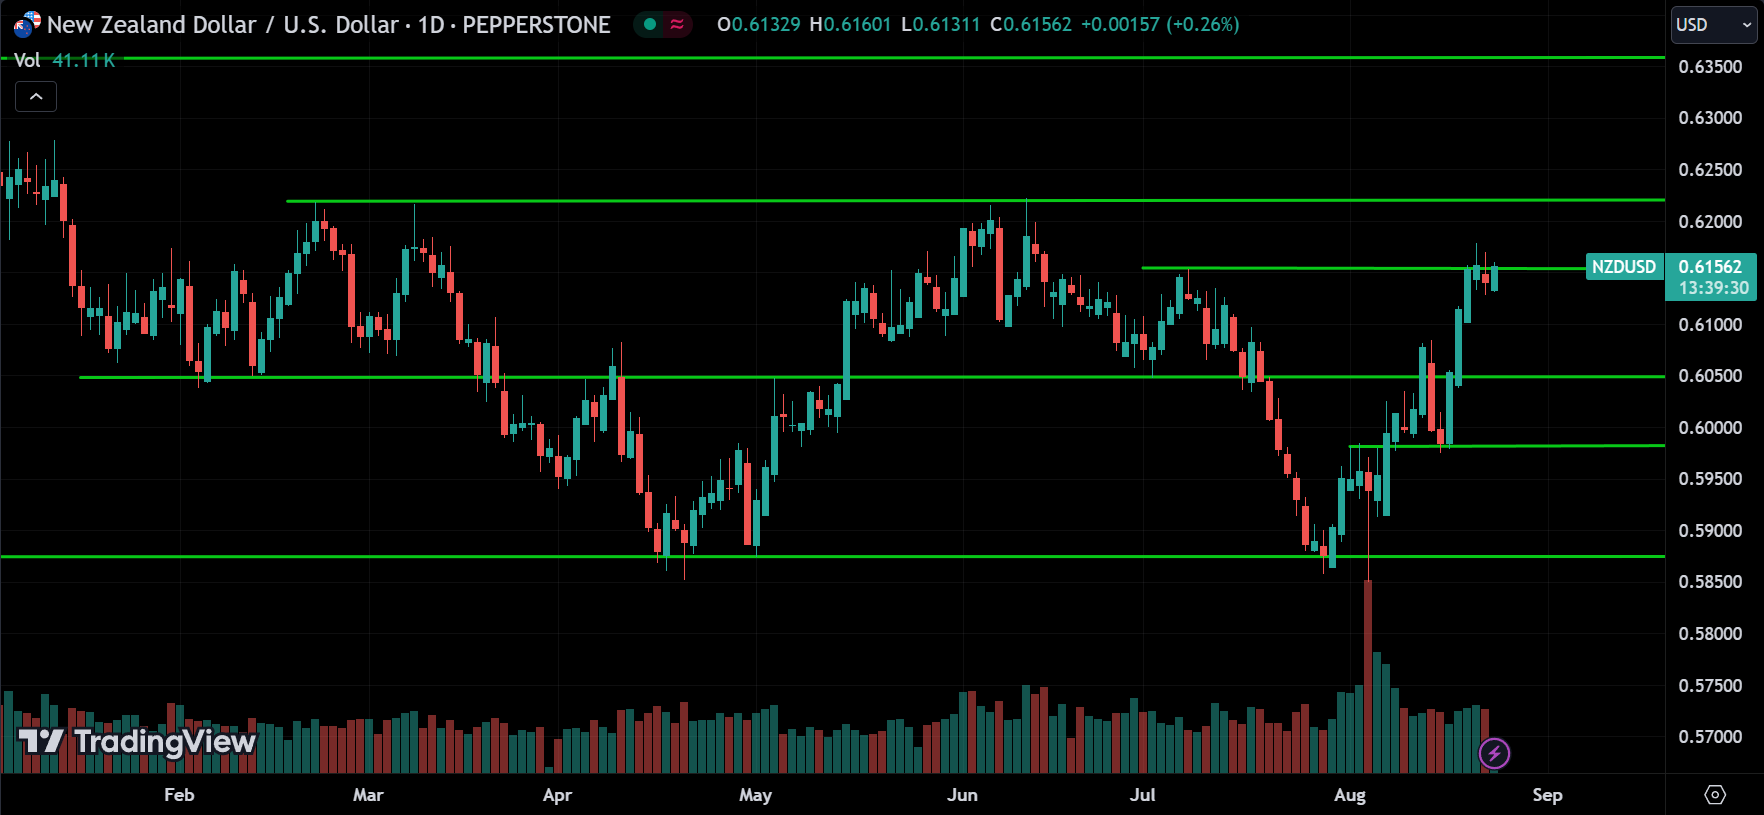
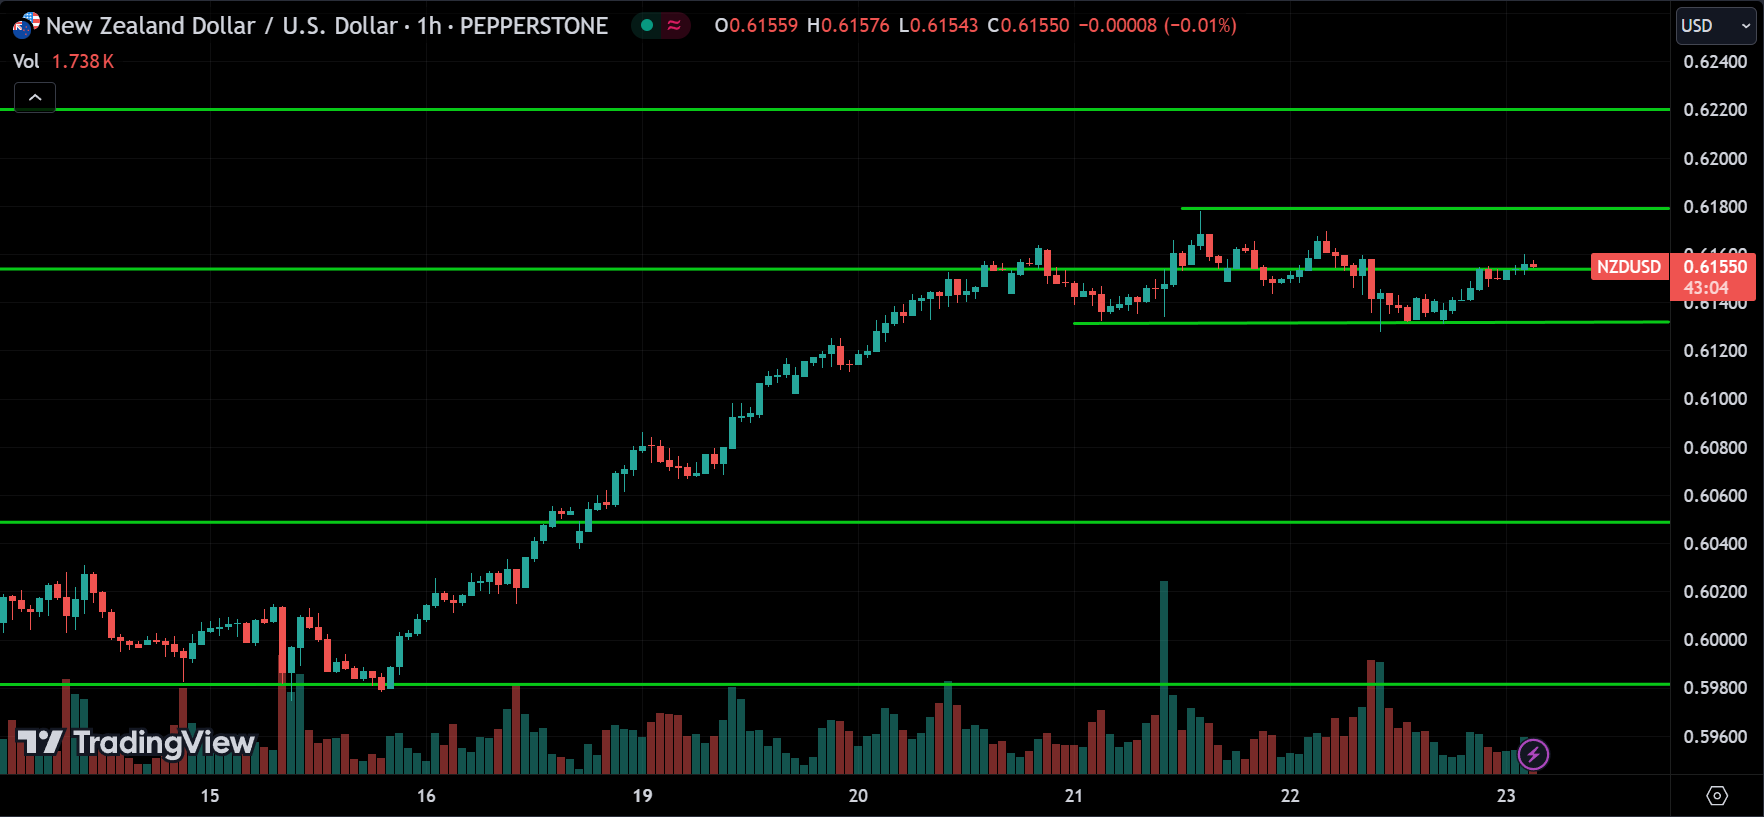
The same story applies to NZDUSD. It was trending up, but now the price is consolidating between support at 0.61300 and resistance at 0.61800. The breakout will determine the future direction. If the price breaks above the resistance, it could move up to 0.62200. On the other hand, if it breaks below the support, we might see the price drop toward 0.60600. However, an upward breakout is more likely.
Conclusion & Disclaimer
Subscribe to our Telegram channel to get instant updates on new articles.
Please provide your feedback on how we can improve this forex article. Thank you!
These analyses are here to help you understand how to analyze the market. They’re not about giving buy or sell signals. It’s simply about observing price action market behavior. I don’t recommend when to buy or sell because trading doesn’t work that way. You need a strategy to guide your decisions about when to enter or exit positions. That’s the key to making consistent profits in the financial markets over time.
The information provided in this market analysis is for educational and informational purposes only. It should not be construed as financial advice or a recommendation to buy, sell, or hold any securities or investments.
All investments involve risk, and past performance is not indicative of future results. The analysis provided may not be suitable for all investors and should be used at their own discretion.
Readers are encouraged to conduct their own research.
Trading and investing in financial markets carry inherent risks, including the risk of losing invested capital. It is important to carefully consider your investment objectives, risk tolerance, and financial situation before making any investment decisions.
GOOD LUCK✌!!!