![US Stock Market Today [2024-08-23]: Key Levels and Trends for S&P 500 & Sectors - Stocks to Watch: NVDA, TSLA, BAC
xlearnonline.com](https://xlearnonline.com/wp-content/uploads/2024/08/Stock-Market-Analysis-1-1.png)
Hi, welcome to our US stock market today article series.
We will use a top-down approach in our analysis. First, we will analyze the overall market, focusing on the S&P 500. Then, we will analyze each sector one by one for their price action performance so we can trade stocks in those sectors with confidence. Finally, we will look at some stocks to watch today.
Economic Events Today
These events include important news that could impact the stock market, macroeconomic reports, and economic indicators. For more details, you can check the bloomberg calendar & yahoo finance.
- Jackson Hole Symposium: The Economic Symposium, held in Jackson Hole, Wyoming, is attended by central bankers, finance ministers, academics, and financial market participants from around the world. Comments and speeches from central bankers and other influential officials can create significant market volatility.
- 10:00 ET: Federal Reserve Chair Jerome Powell will speak about the economic outlook at the Jackson Hole Economic Policy Symposium in Wyoming. As the head of the central bank that controls short-term interest rates, Powell has more influence on the nation’s currency value than anyone else. Traders closely watch his public speeches because he often gives subtle hints about future monetary policy.
Stocks with Earnings:
| BEFORE MARKET OPEN | AFTER MARKET CLOSE |
|---|---|
| BKE |
S&P 500
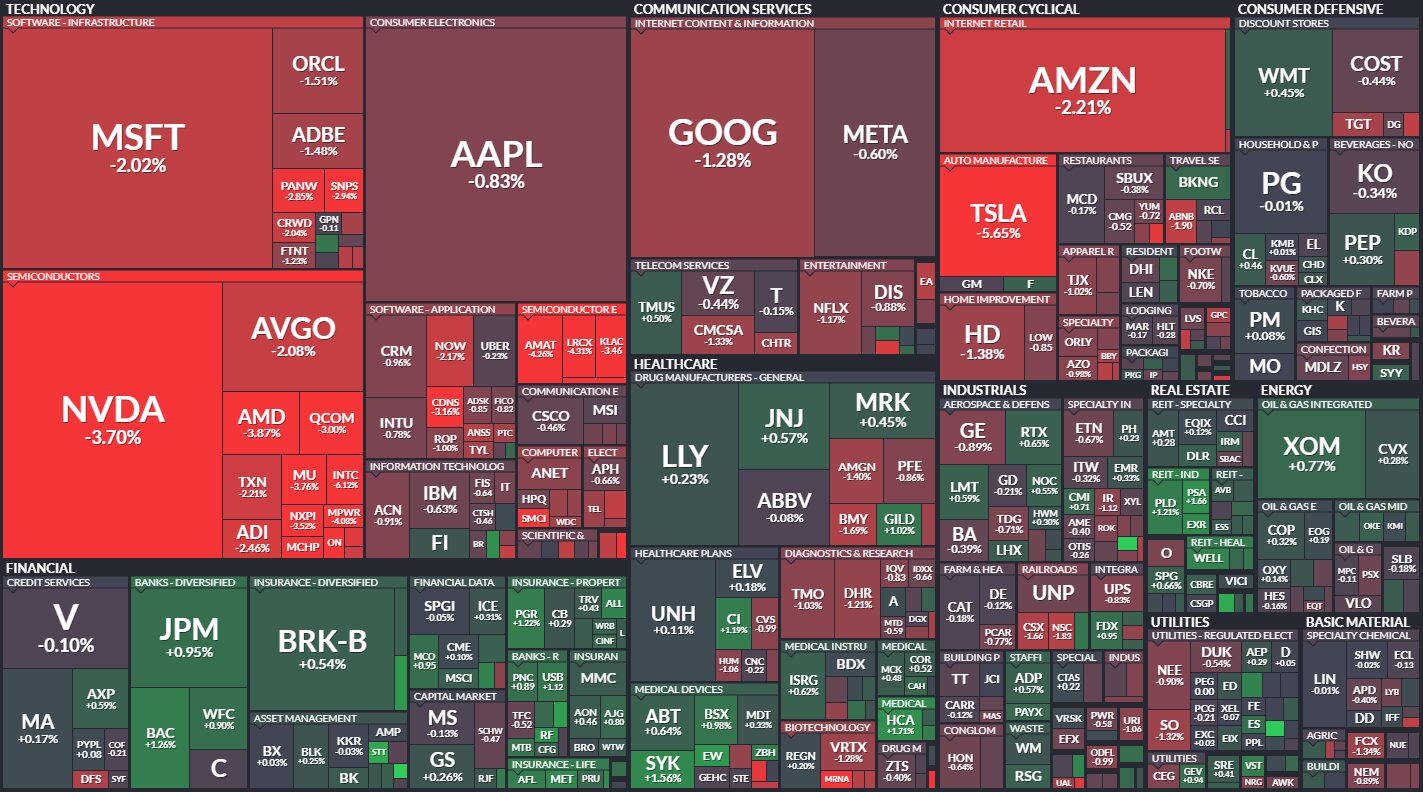
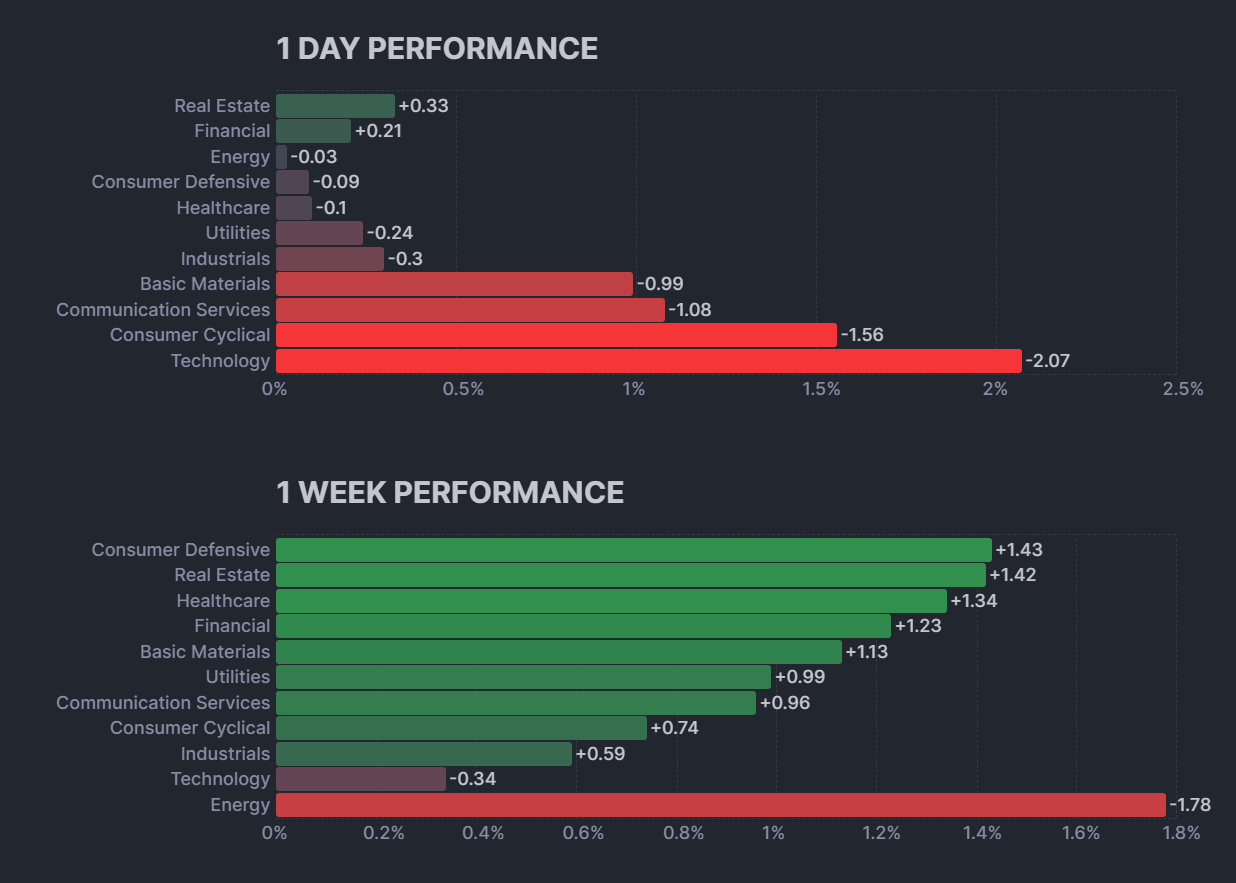
Even though the market can be a rollercoaster at times, it eventually shows its true direction. This time, after the dip, the market has almost recovered, except for the energy and technology sectors. Everything else looks promising, and we might see the market reach new highs. Looking at the heatmap, we can see that most of the major blue-chip stocks were in the red the previous day.
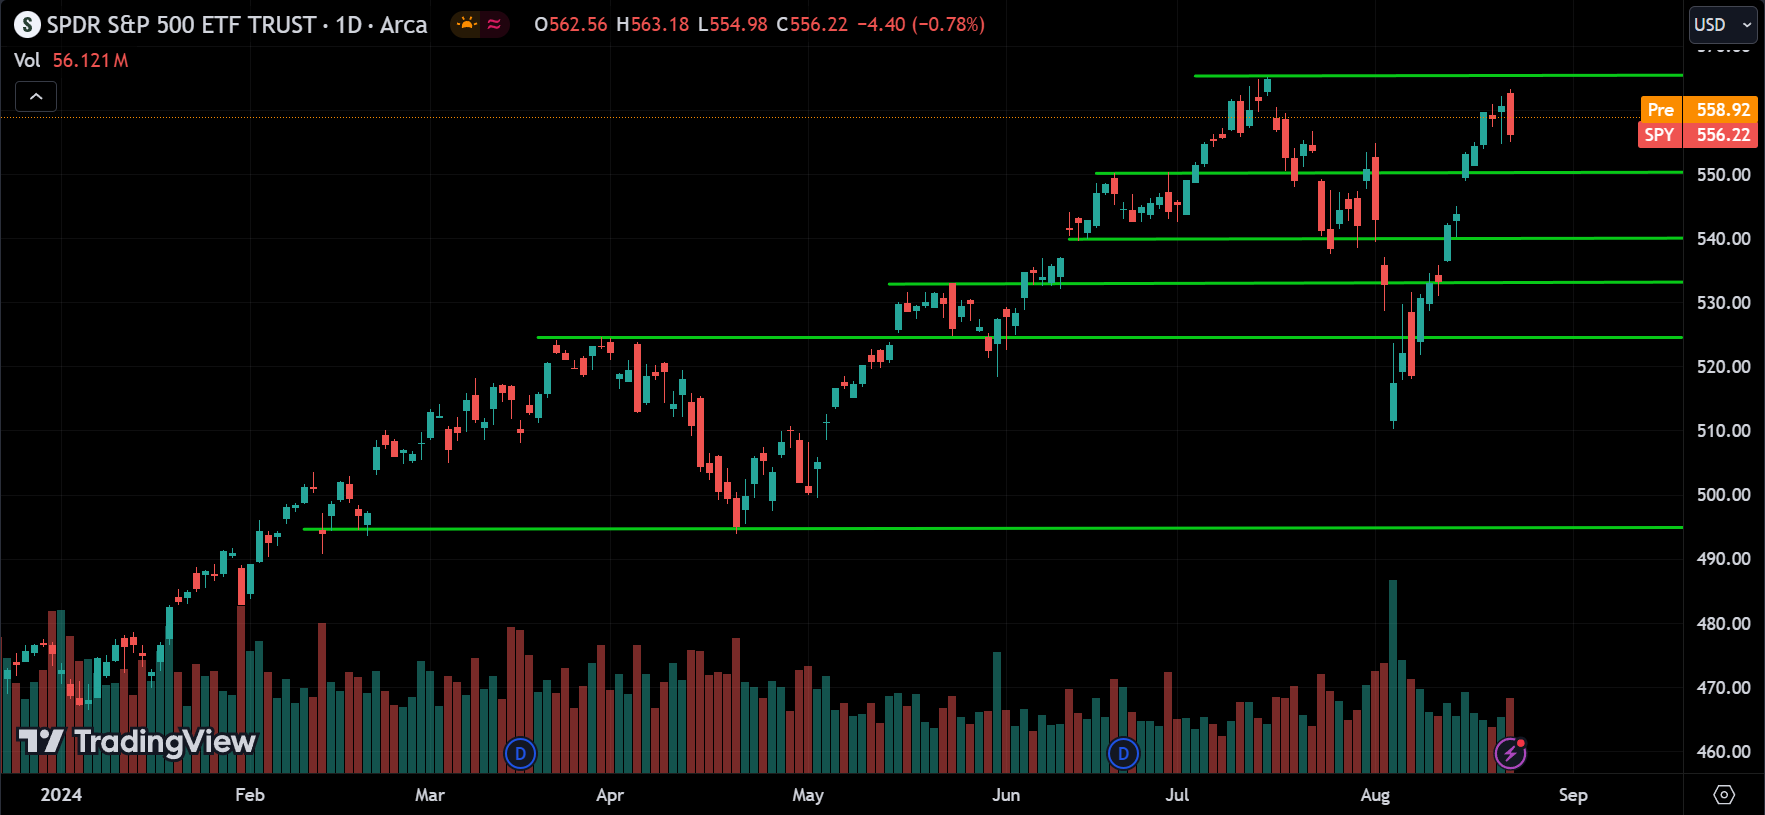
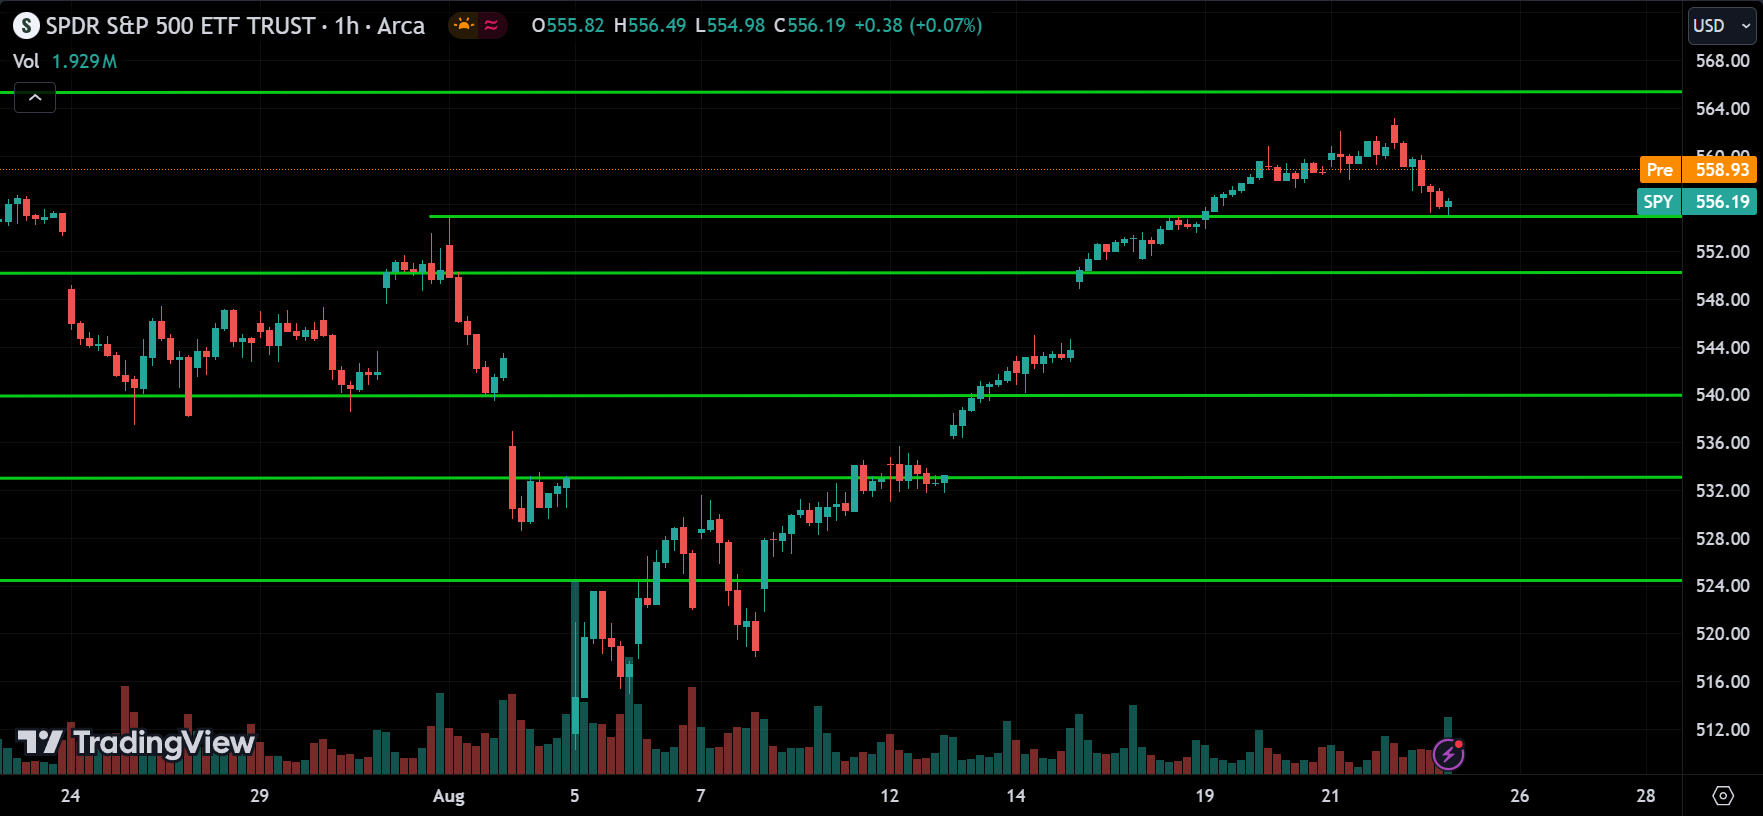
As you can see, SPY is close to breaking above the major resistance or previous high level. It looks like the price is going through a correction phase and is currently at a support level. We should see the price start to rise from this support and break above the resistance, continuing upward. However, if this is a reversal, the price could break below the support and start dropping. Keep an eye out for these confirmations before deciding on the trend.
Consumer Staples Sector(XLP):
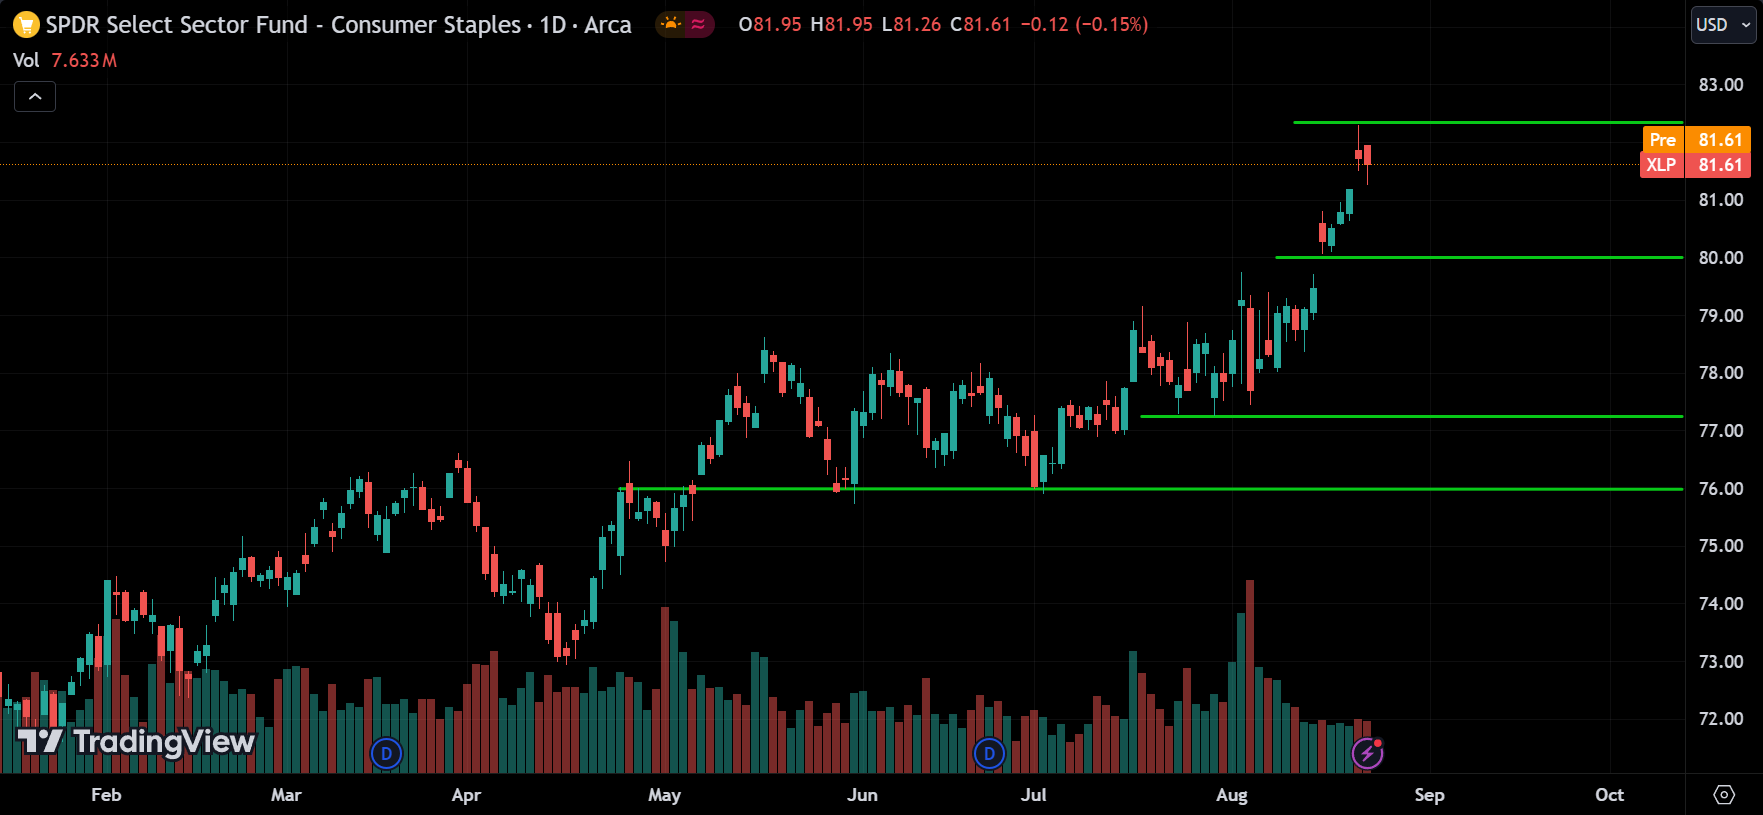
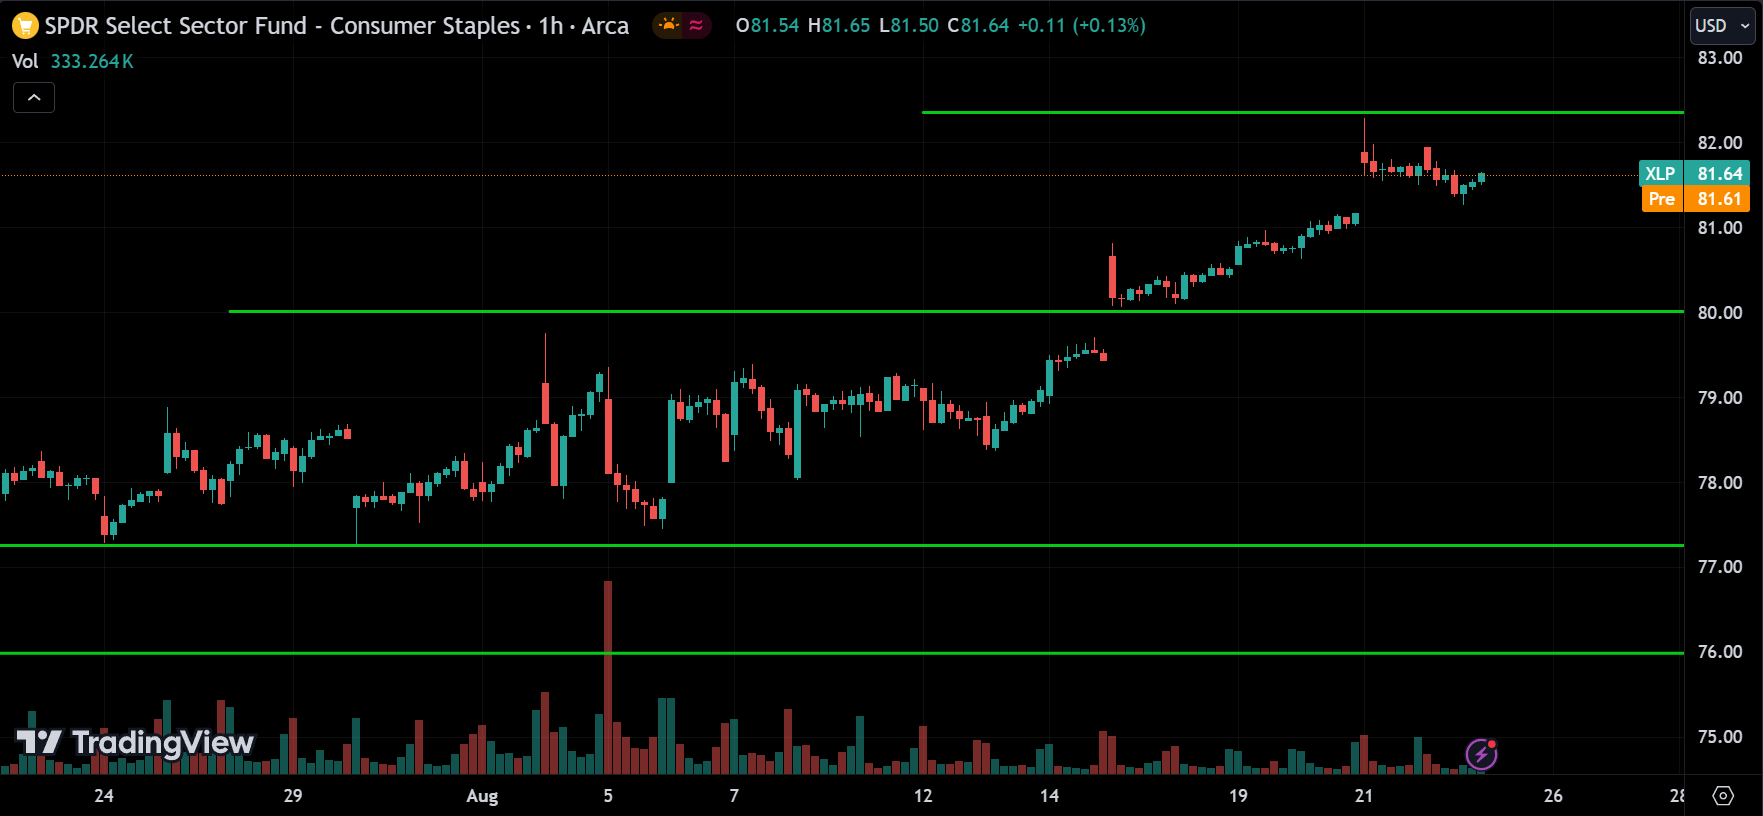
The Consumer Staples sector is at all-time high levels. After reaching resistance, the price pulled back and is now in a small consolidation phase, with support just below it. Wait for the price to break above the resistance or drop below the support to confirm the trend. It’s likely the price will break above the resistance and continue going up, but it could also drop to the support and break below it. So, watch for the breakout to confirm the trend.
Energy Sector(XLE):
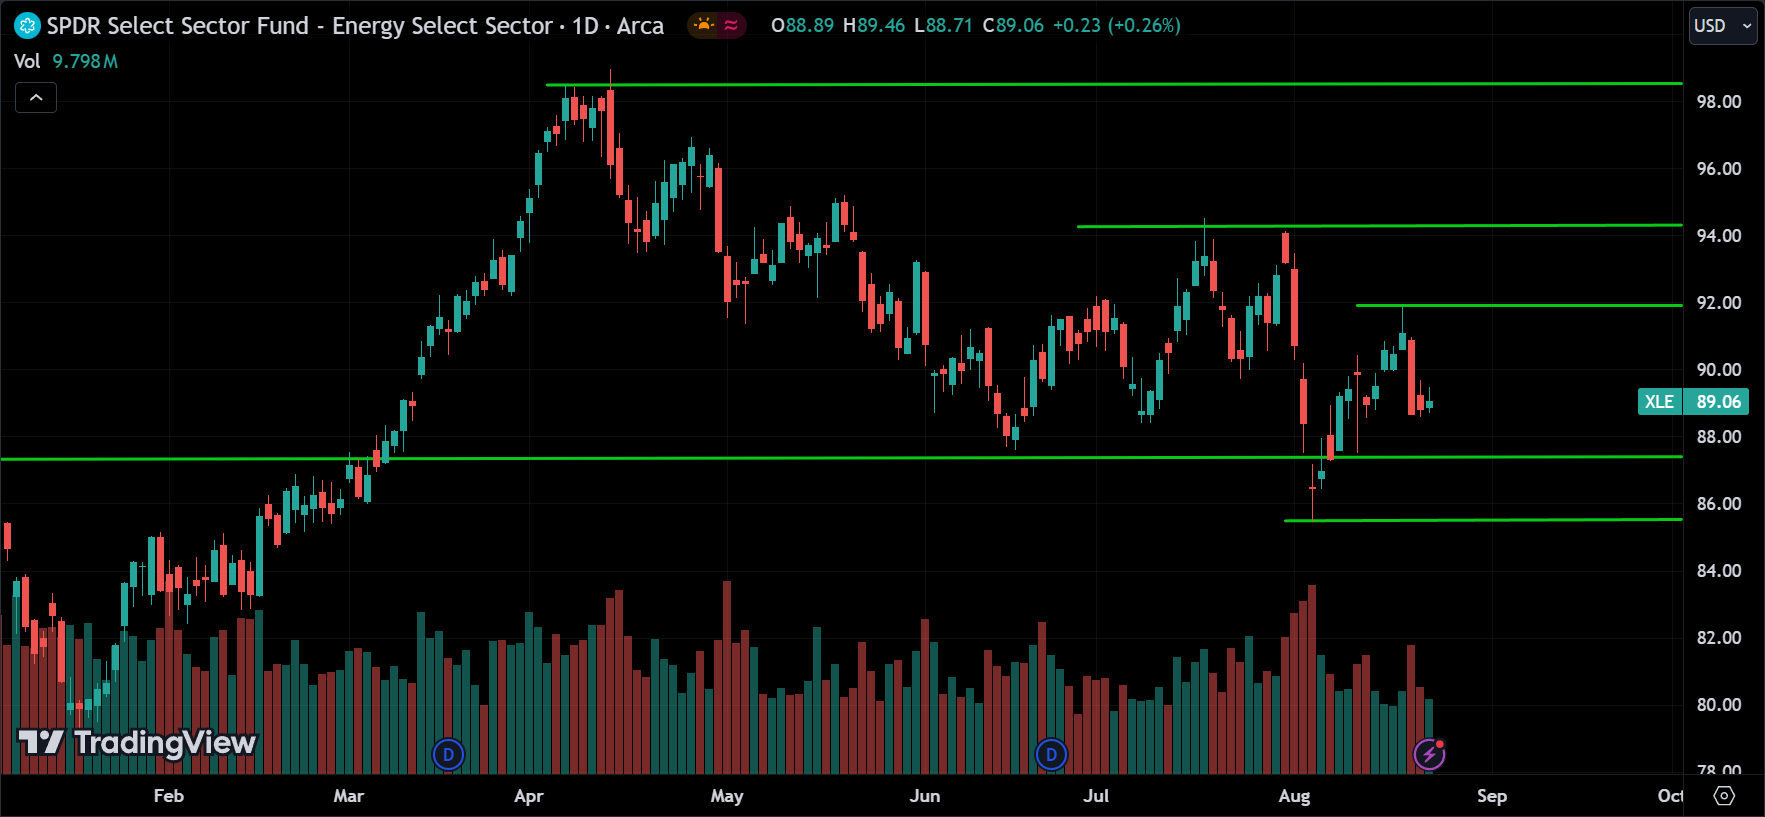
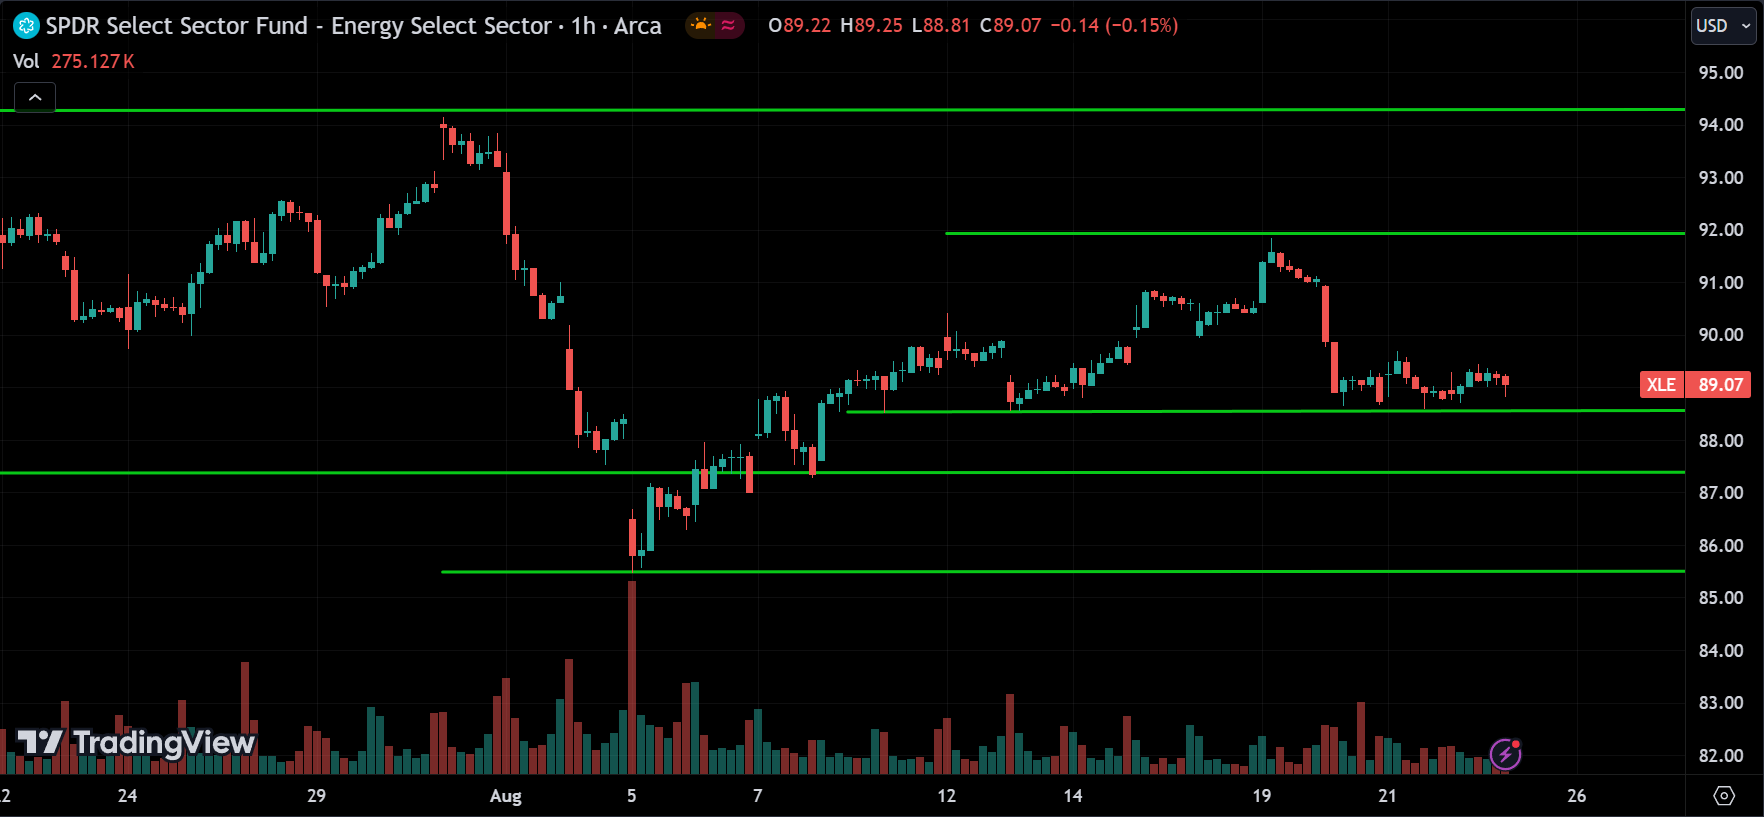
The energy sector is trending down. After reaching a low of 85, the price pulled back and is now consolidating around the support level of 89. If the price breaks below this support, the downtrend may continue. However, if the price starts moving up, it could head toward the resistance around 92. Watch for any potential breakouts, as they will determine the future direction.
Materials Sector(XLB):
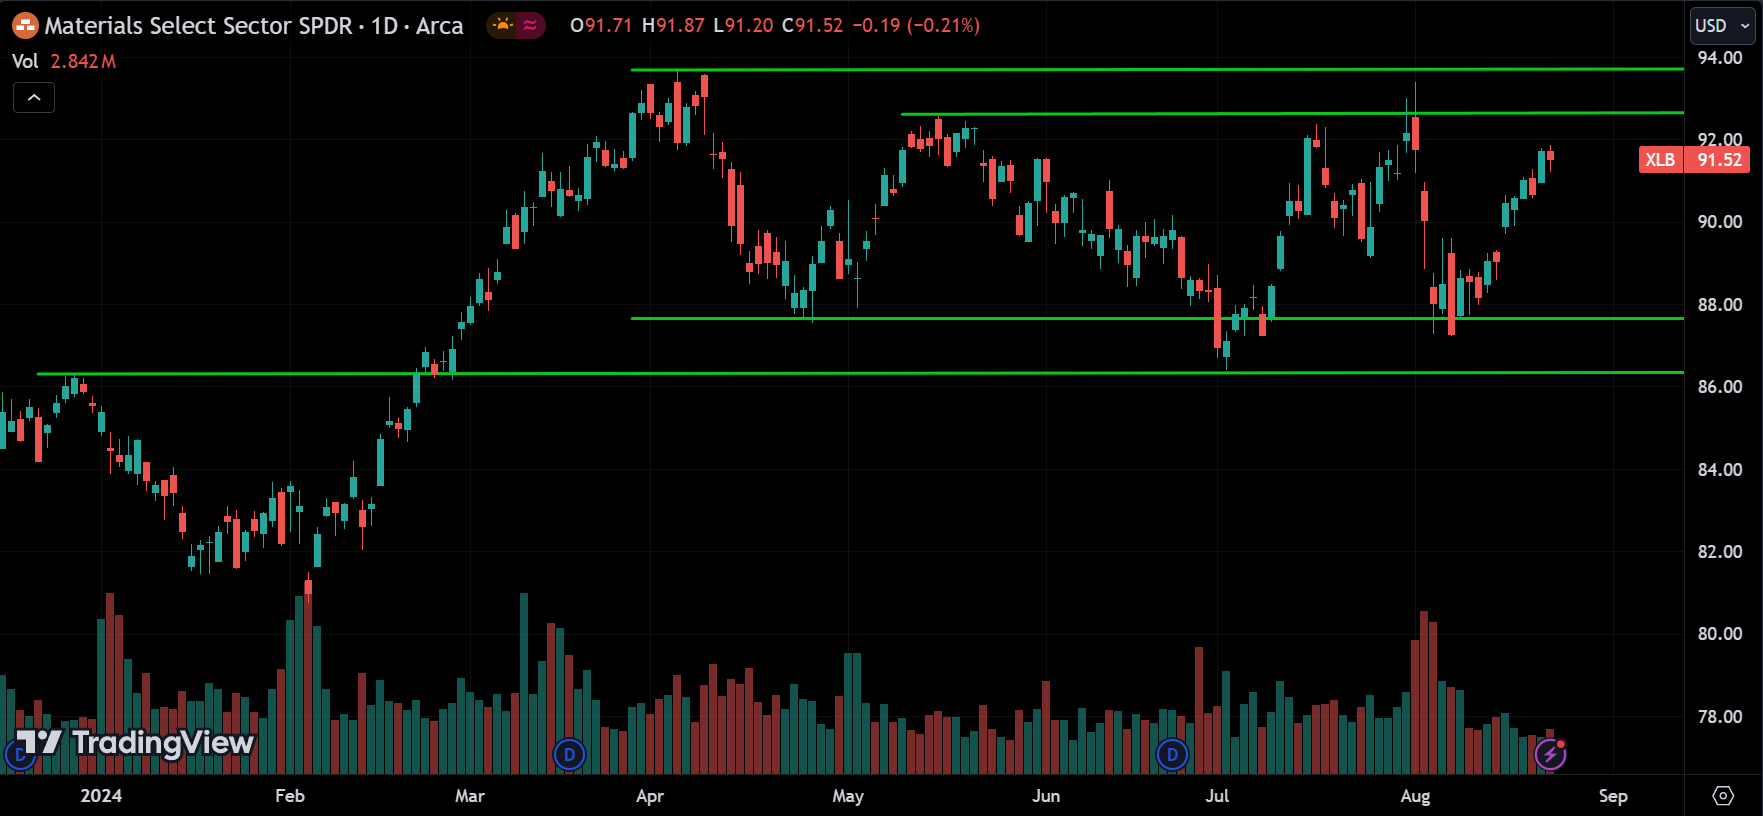
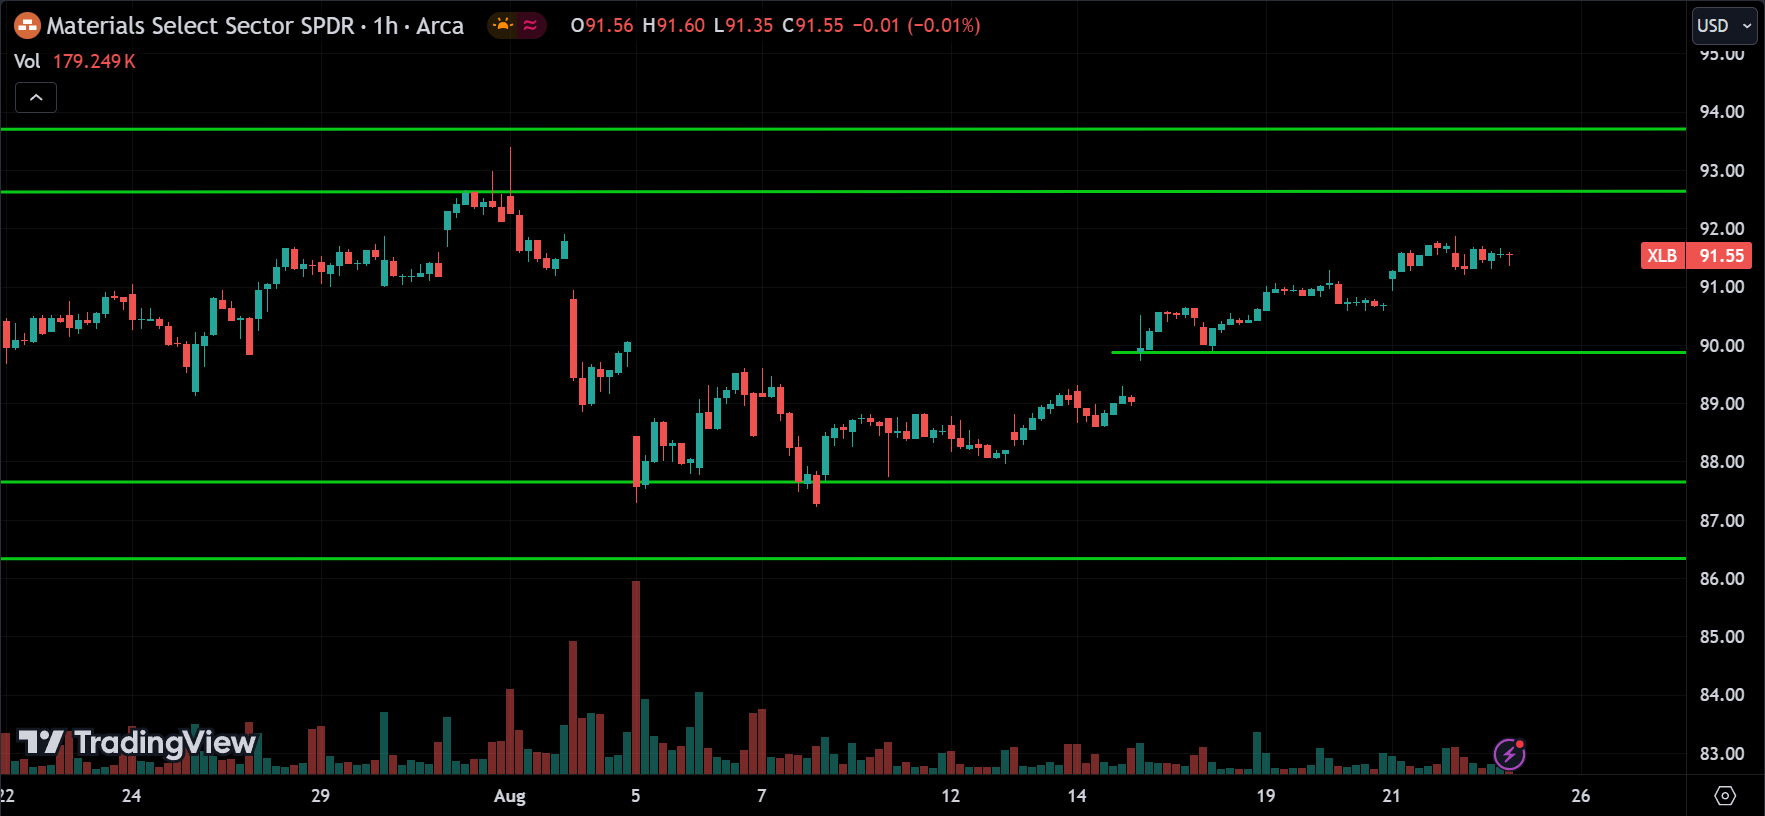
The Materials sector is currently consolidating. In the medium-term trend, it’s in a bullish phase. Right now, the price is nearing resistance around the 93-94 range. We might see a correction at these levels, with the price starting to drop, or it could break above this resistance and continue going up.
Industrial Sector(XLI):
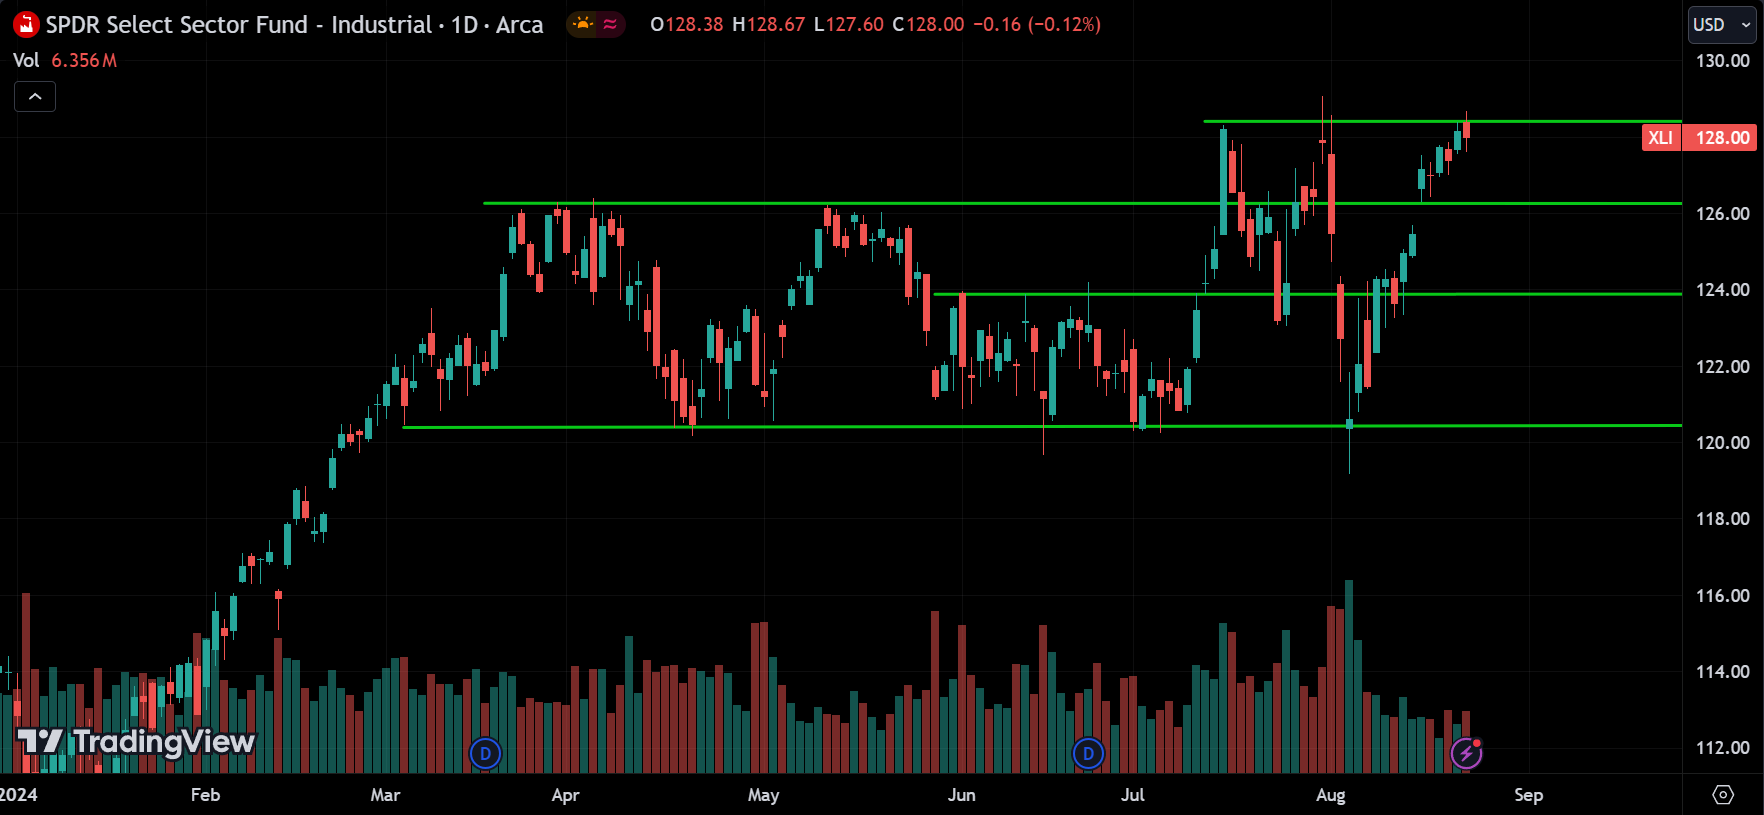
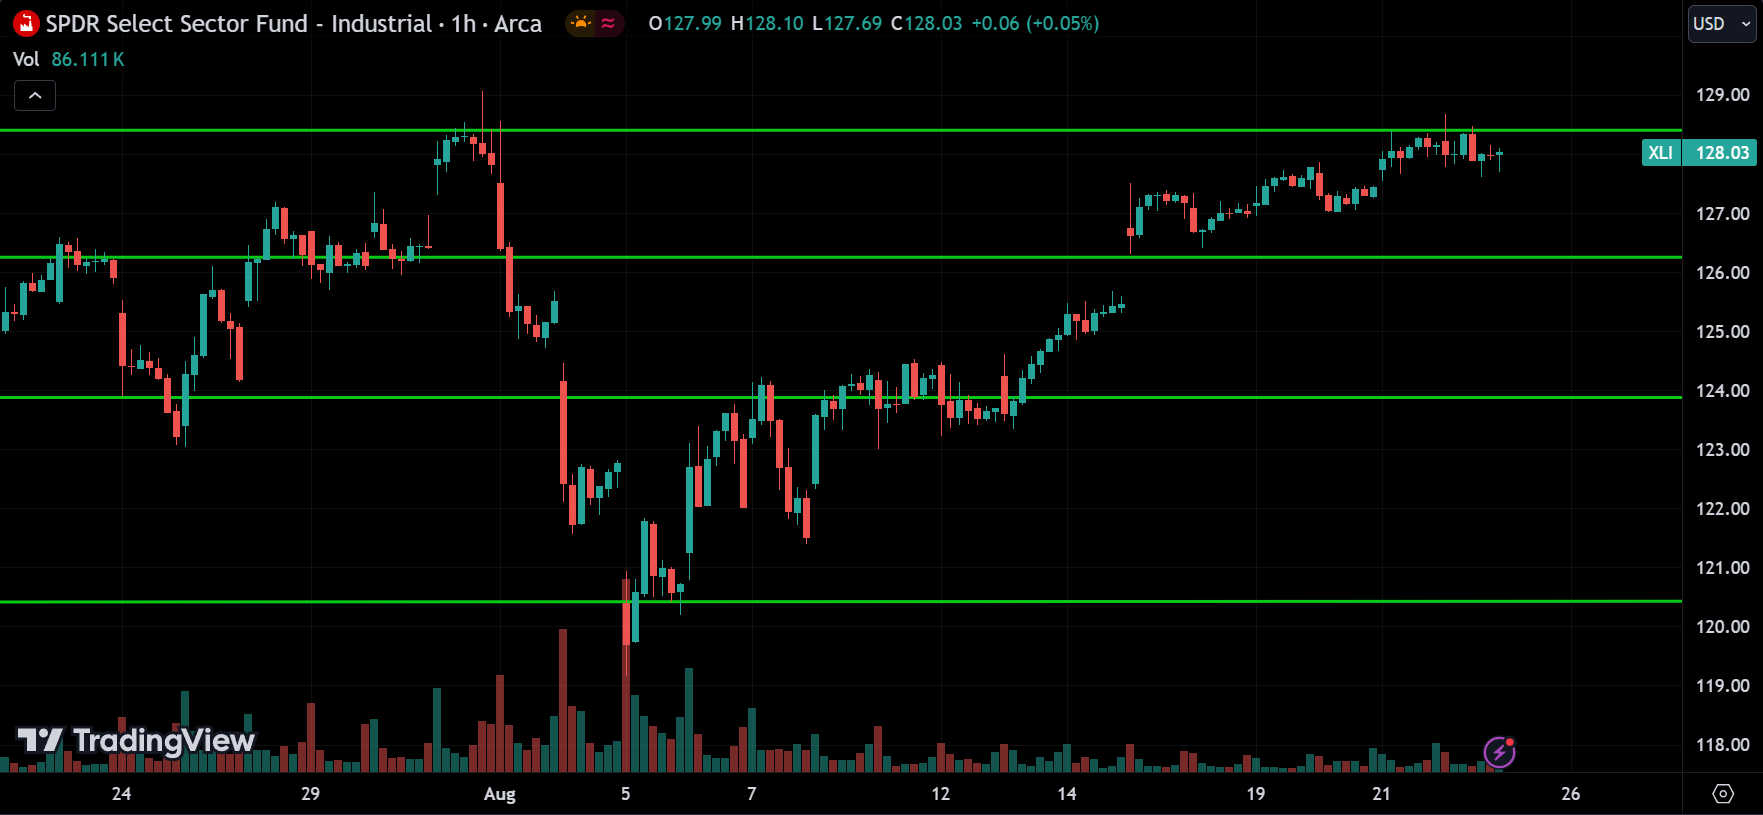
The Industrial sector is trending up and has reached its major resistance level at 129. We might see a correction at this level, with the price starting to drop, or the price could break above this resistance and continue going up. Watch for both reversal and breakout signals, and confirm the trend after seeing these signals.
Consumer Discretionary Sector(XLY):
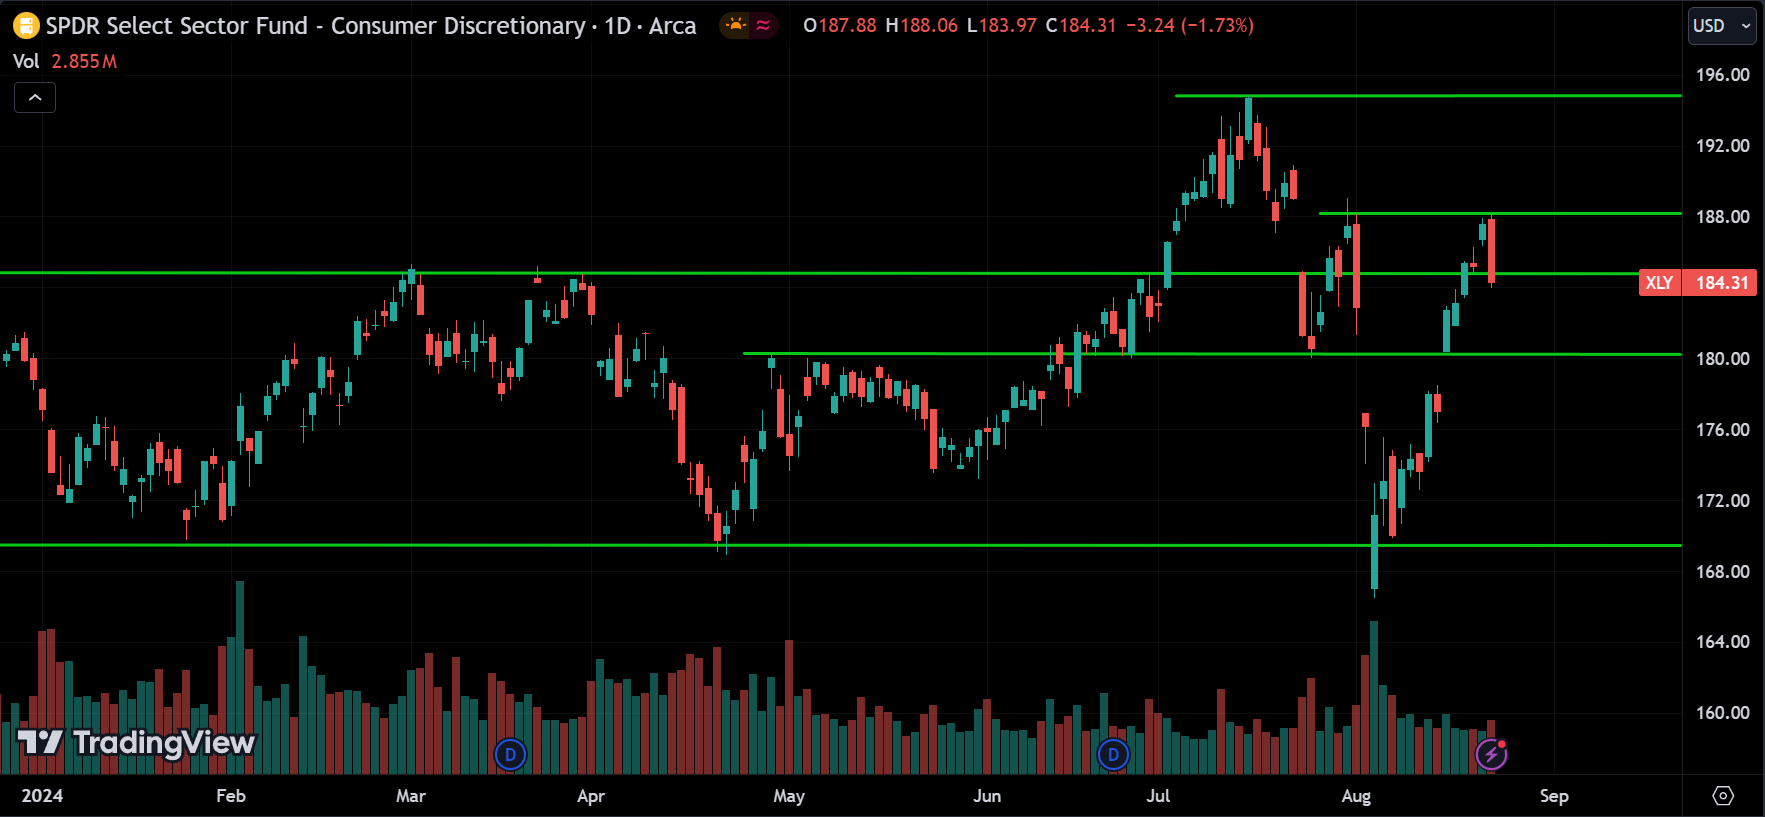
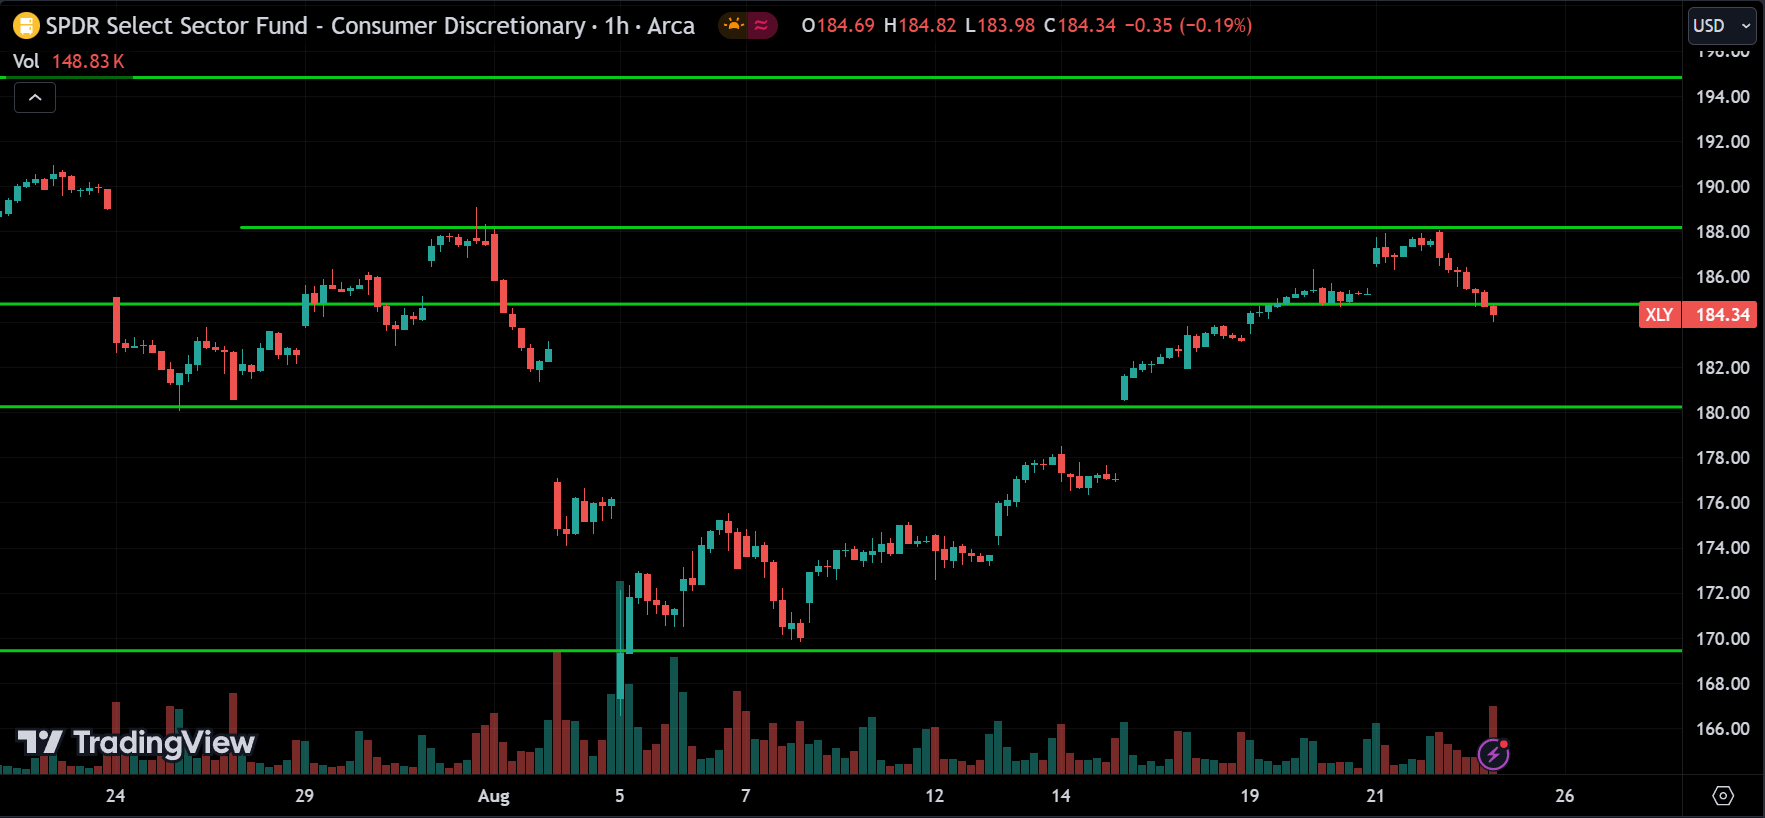
The Consumer Discretionary sector is trending up. After reaching resistance around 188, the price is pulling back. There’s support around 180; if the price breaks below this, it could continue to drop. However, a reversal might happen either around this support level or where it’s currently trading. If the price breaks above 188, the bullish trend will likely resume.
Healthcare Sector(XLV):
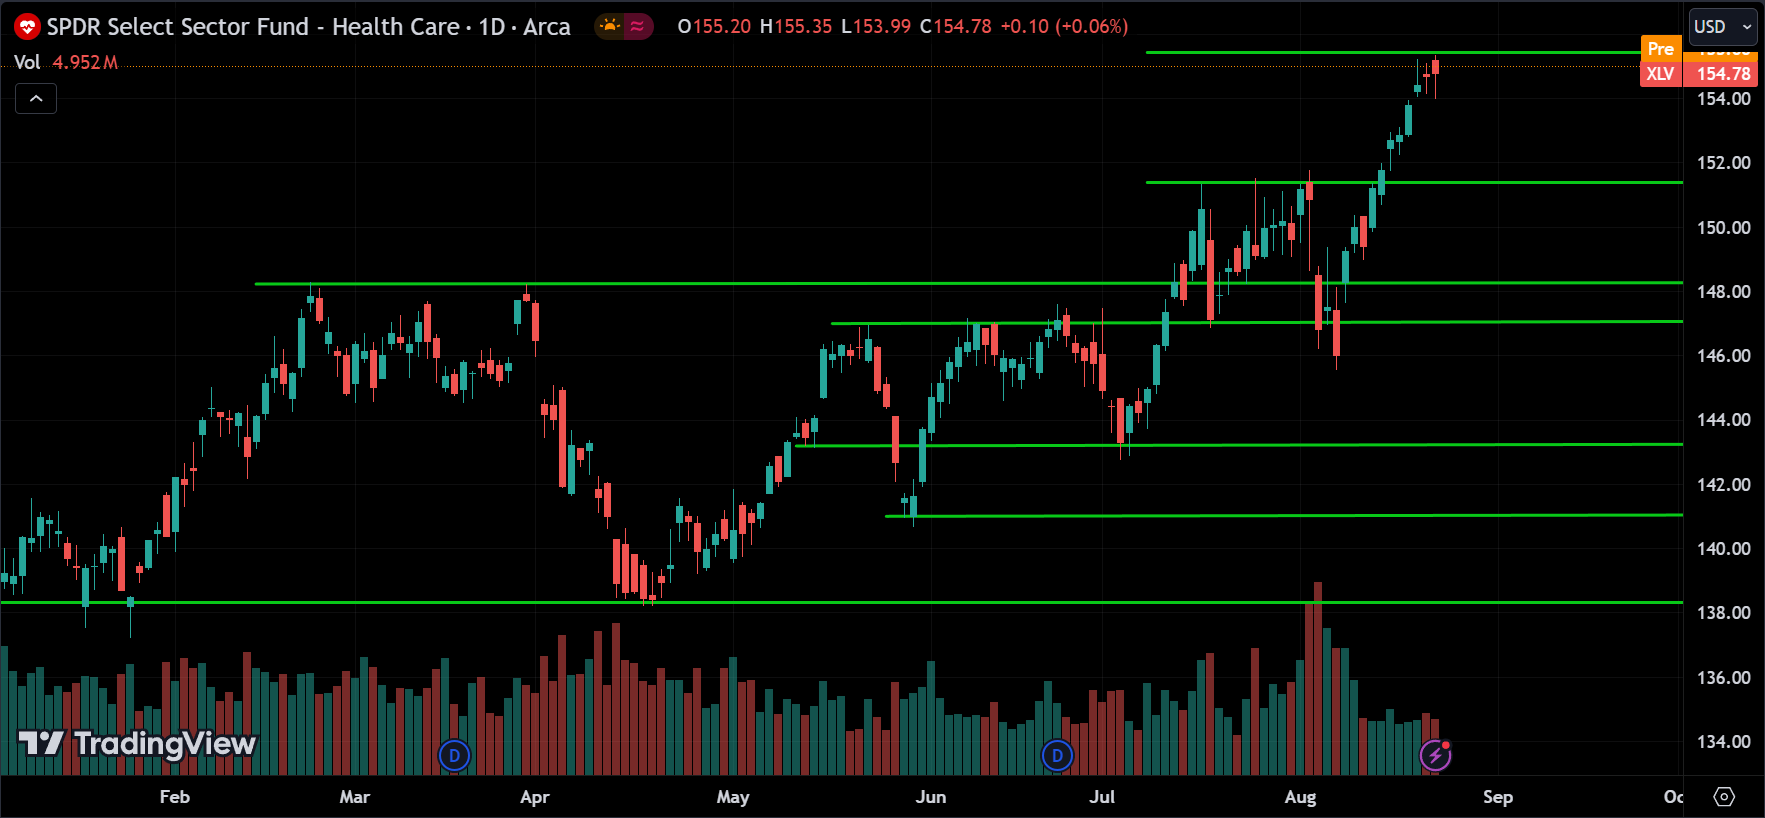
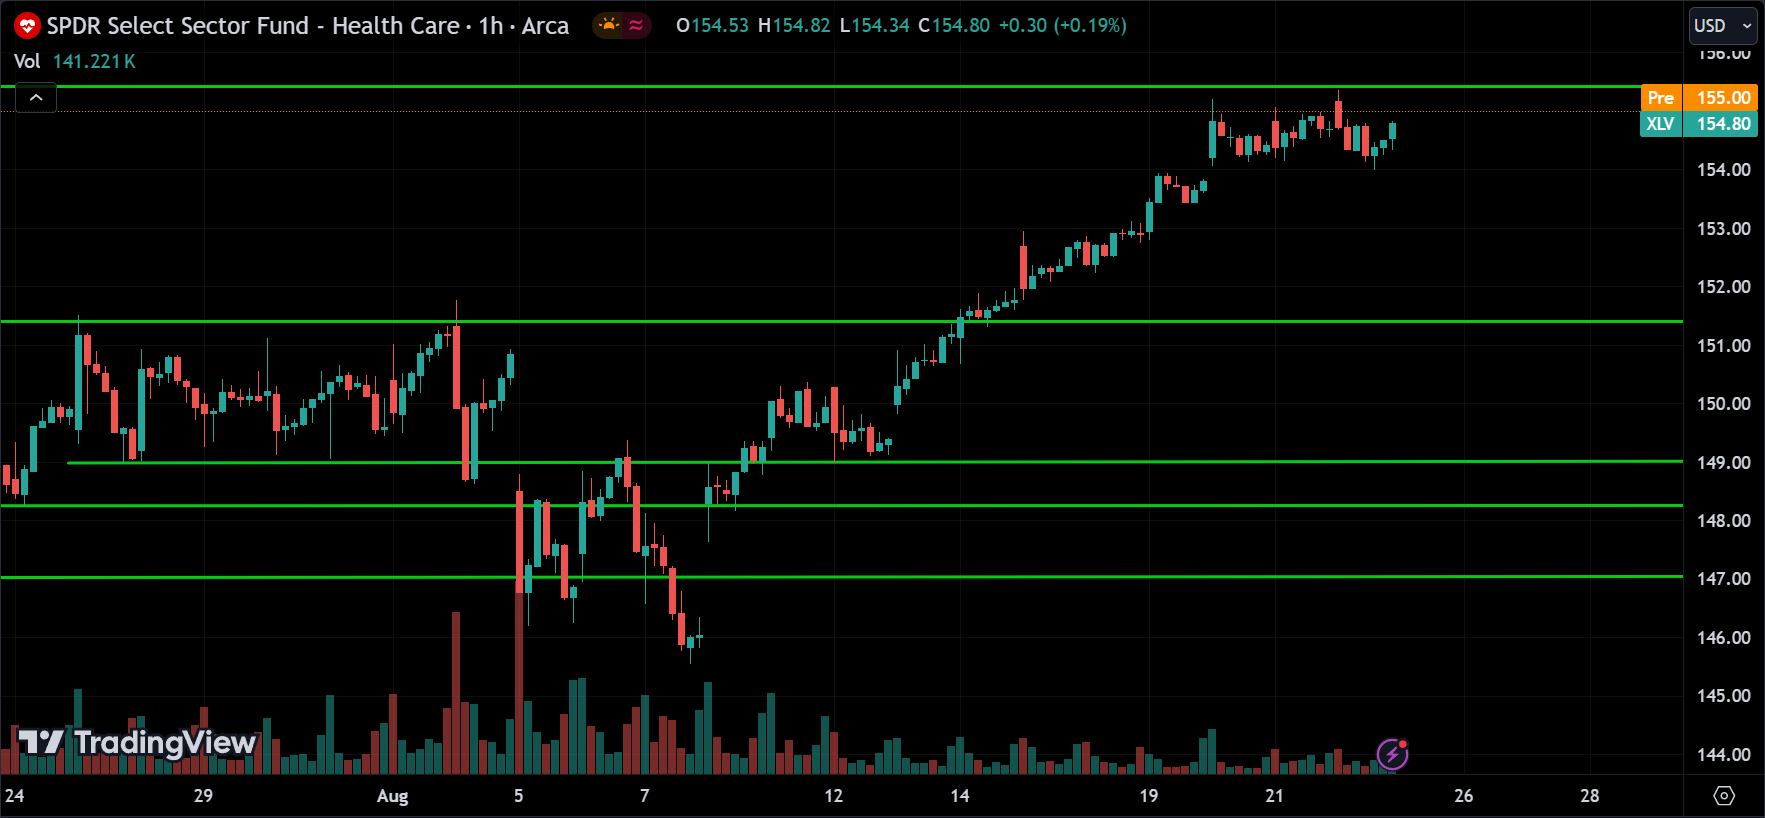
The Healthcare sector is leading and trending up, currently consolidating around the major resistance level at 155. We might see a reversal here, with the price dropping to the 150 range, or the price could break above this resistance and continue rising. Wait for confirmation before making a decision.
Financials Sector(XLF):
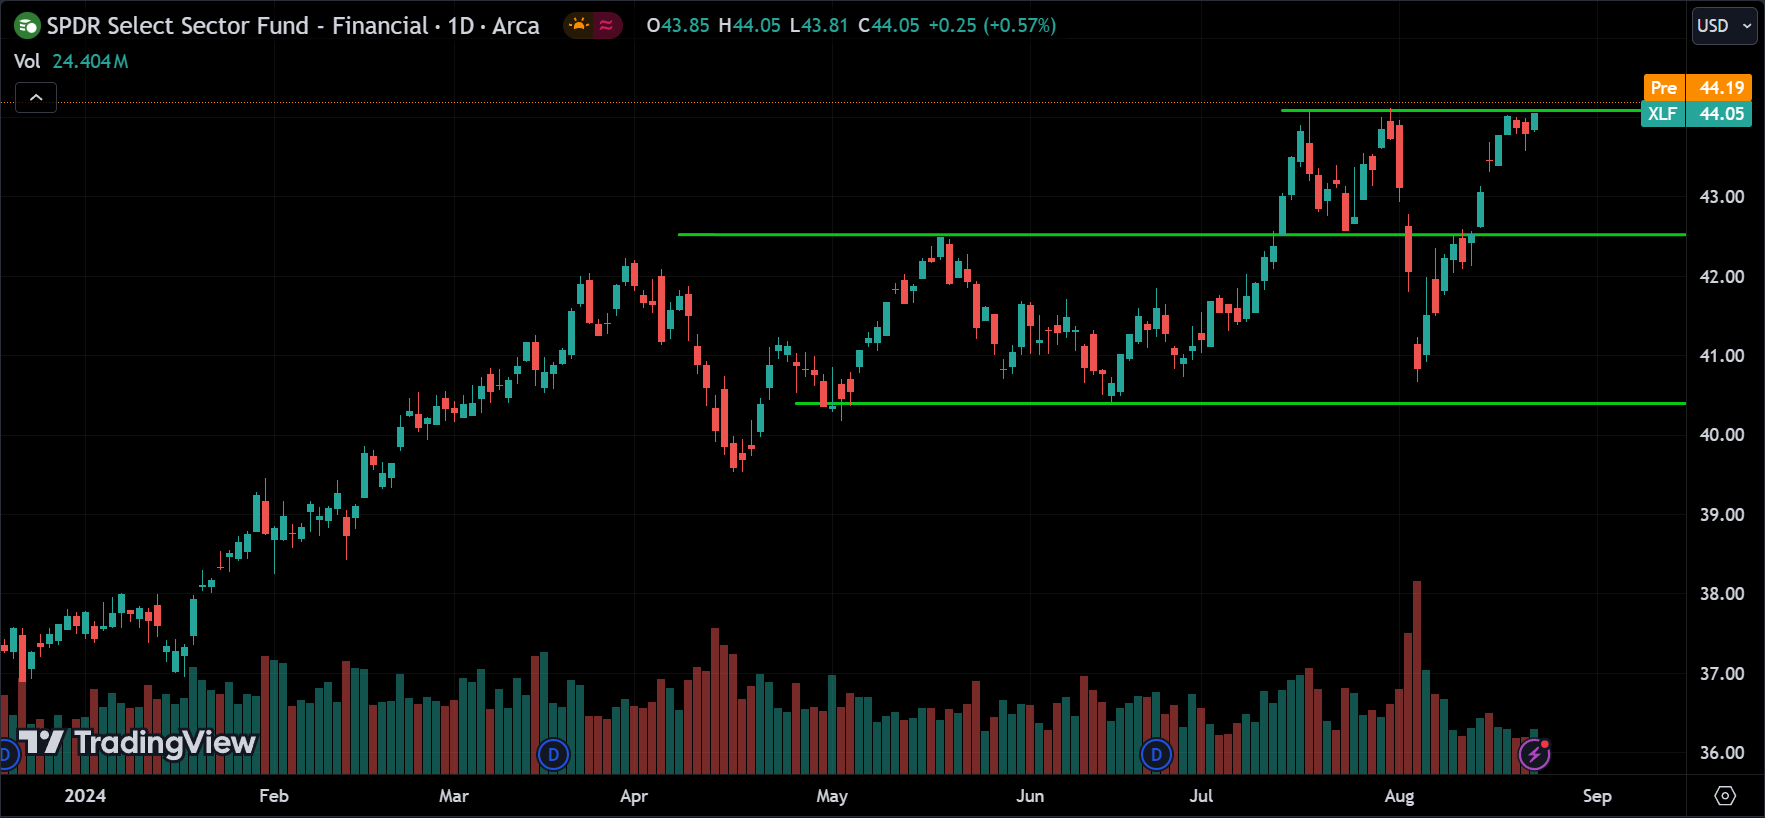
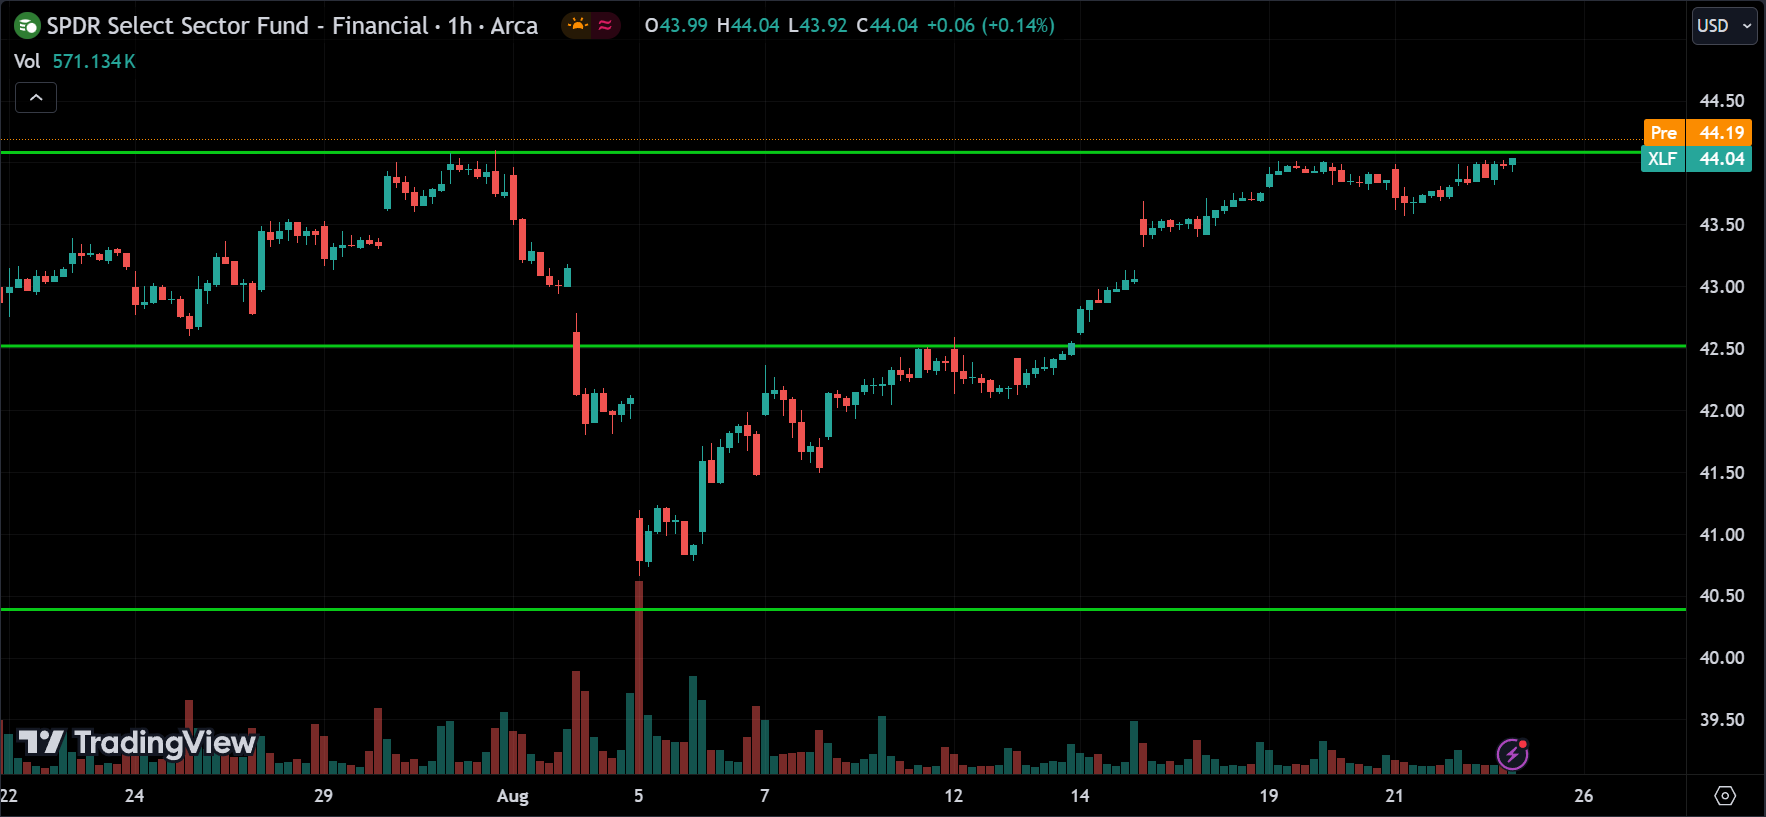
The Financial sector is also trending up and consolidating around a major resistance level. Like the Healthcare sector, we might see a reversal at this resistance, or the price could break above it and continue its uptrend. Wait for confirmation before taking action.
Technology Sector(XLK):
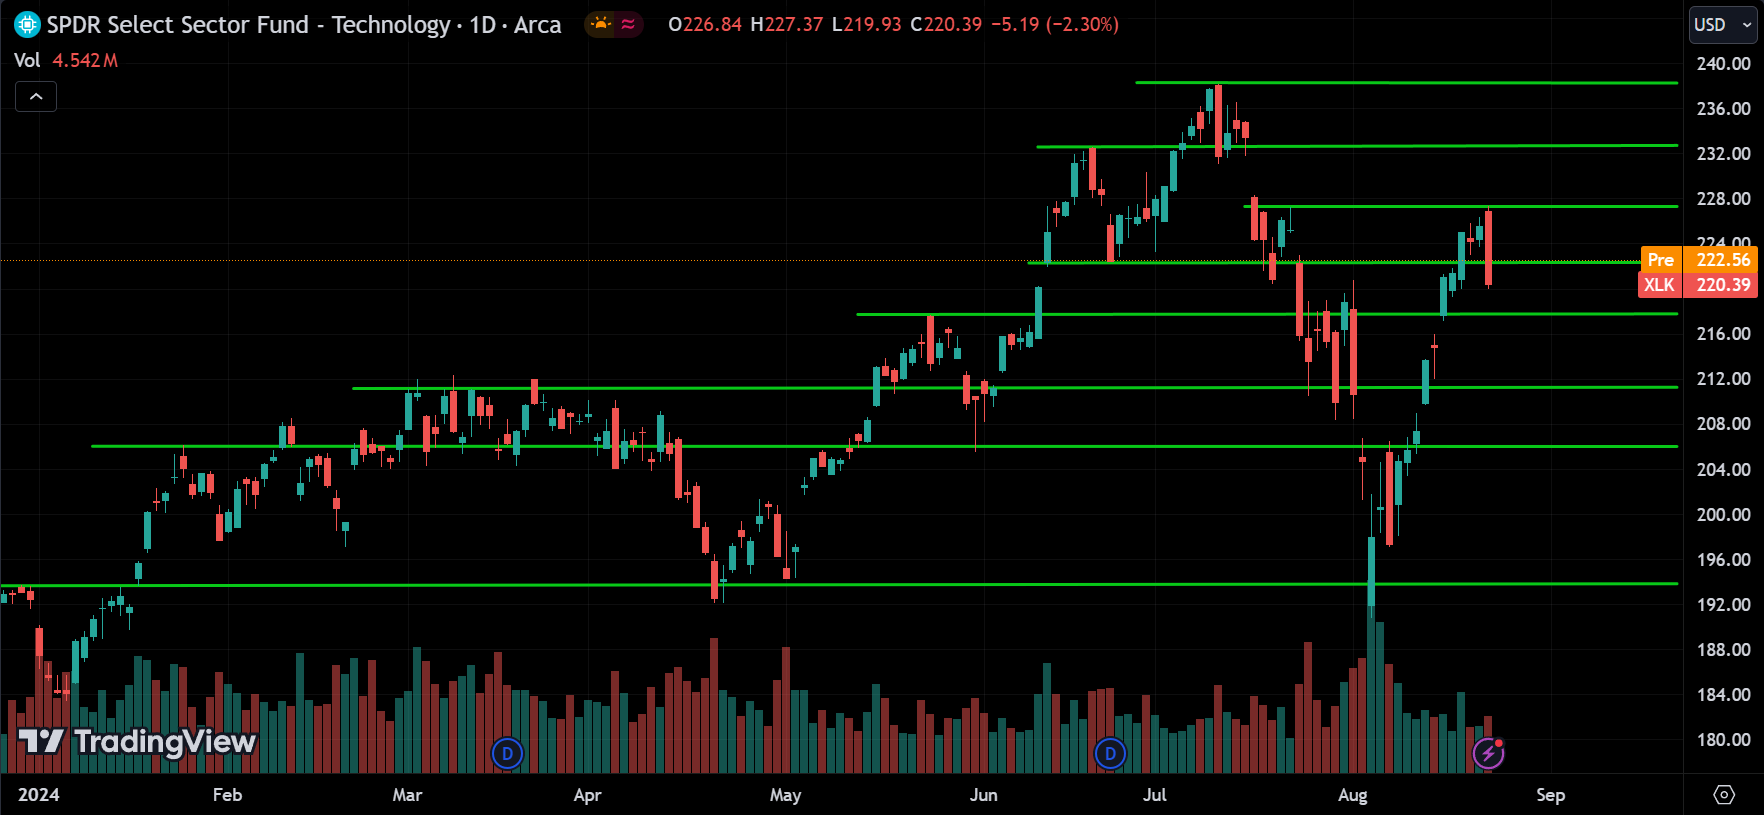
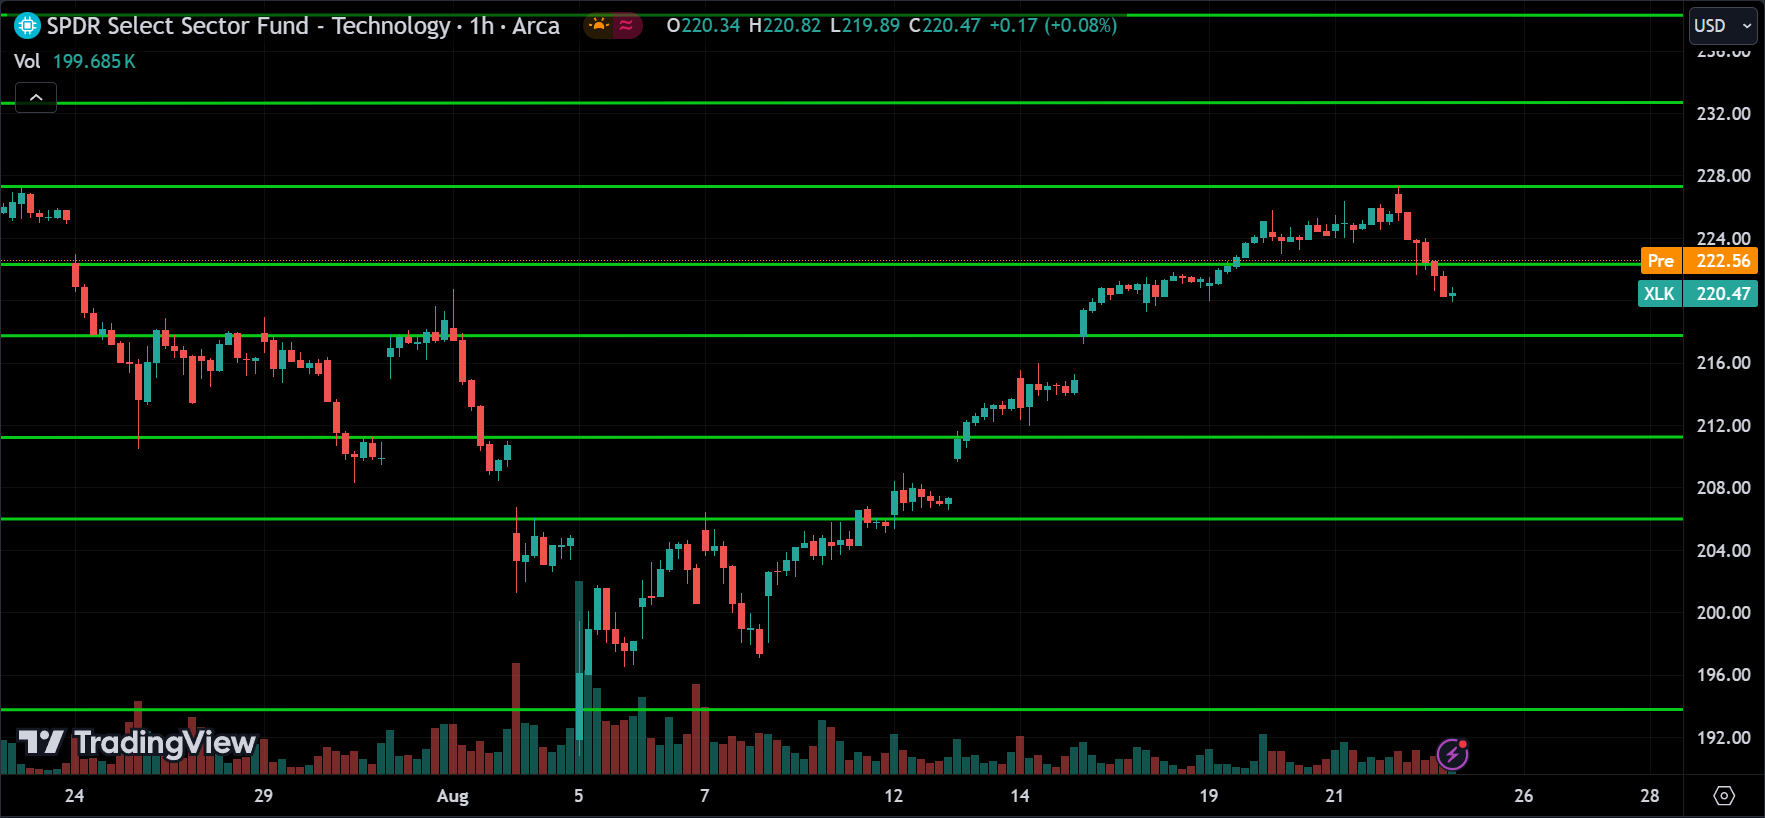
After the dip, the technology sector is regaining its strength and trending up. After reaching resistance around 228, the price went into a correction. There are support levels along the way where the price might reverse, but anything could happen. So, wait for a reversal signal at those support levels to confirm the trend. Right now, the price is correcting.
Communications Sector(XLC):
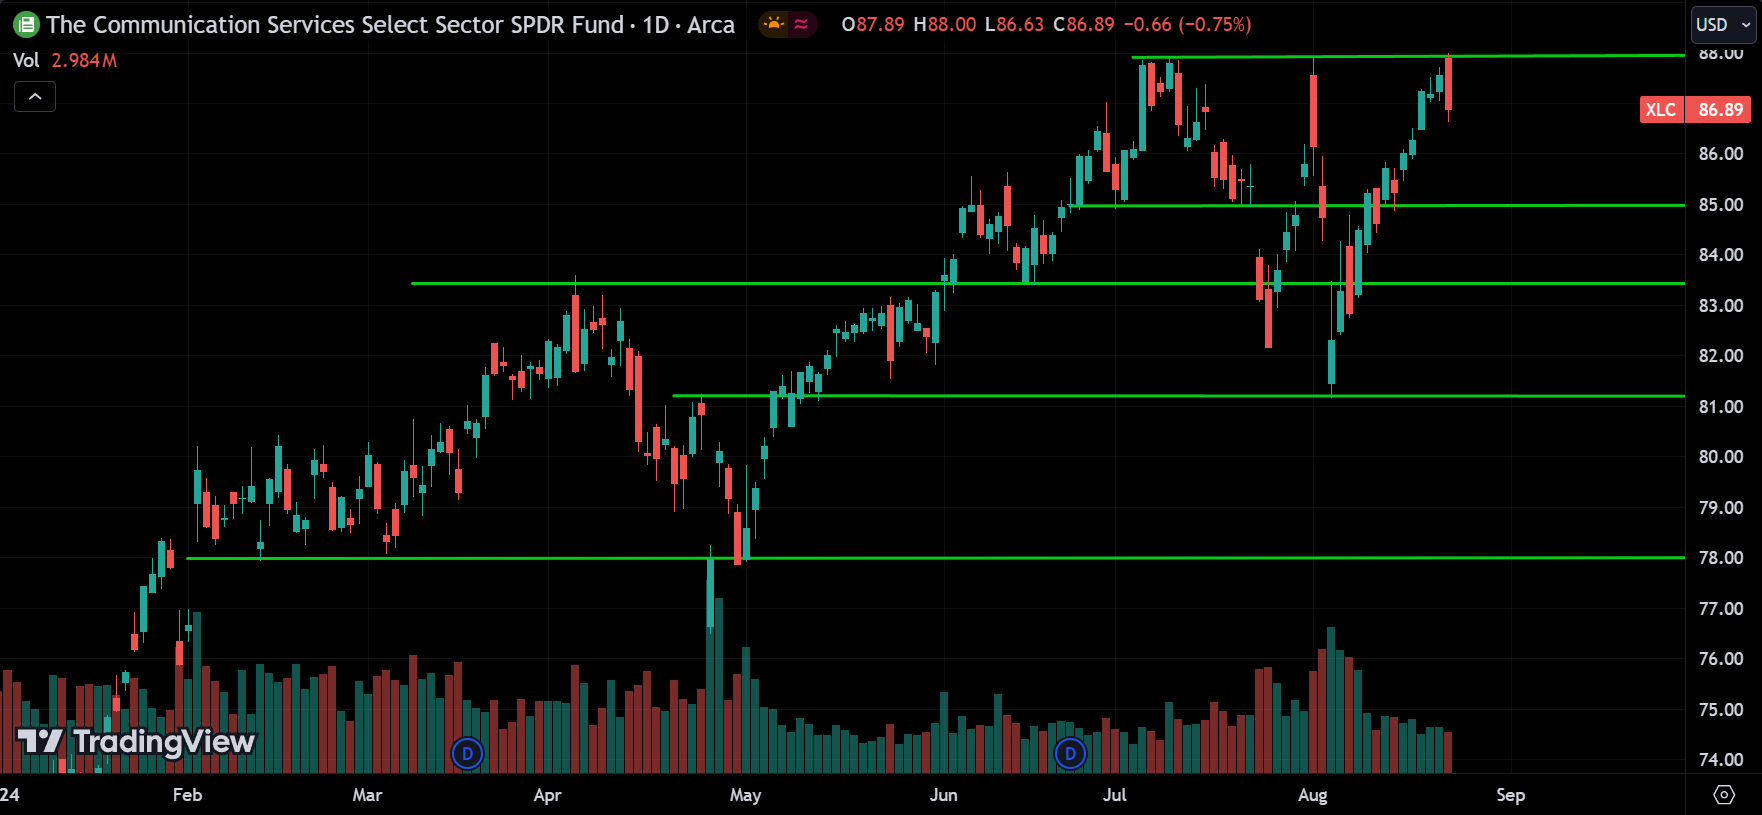
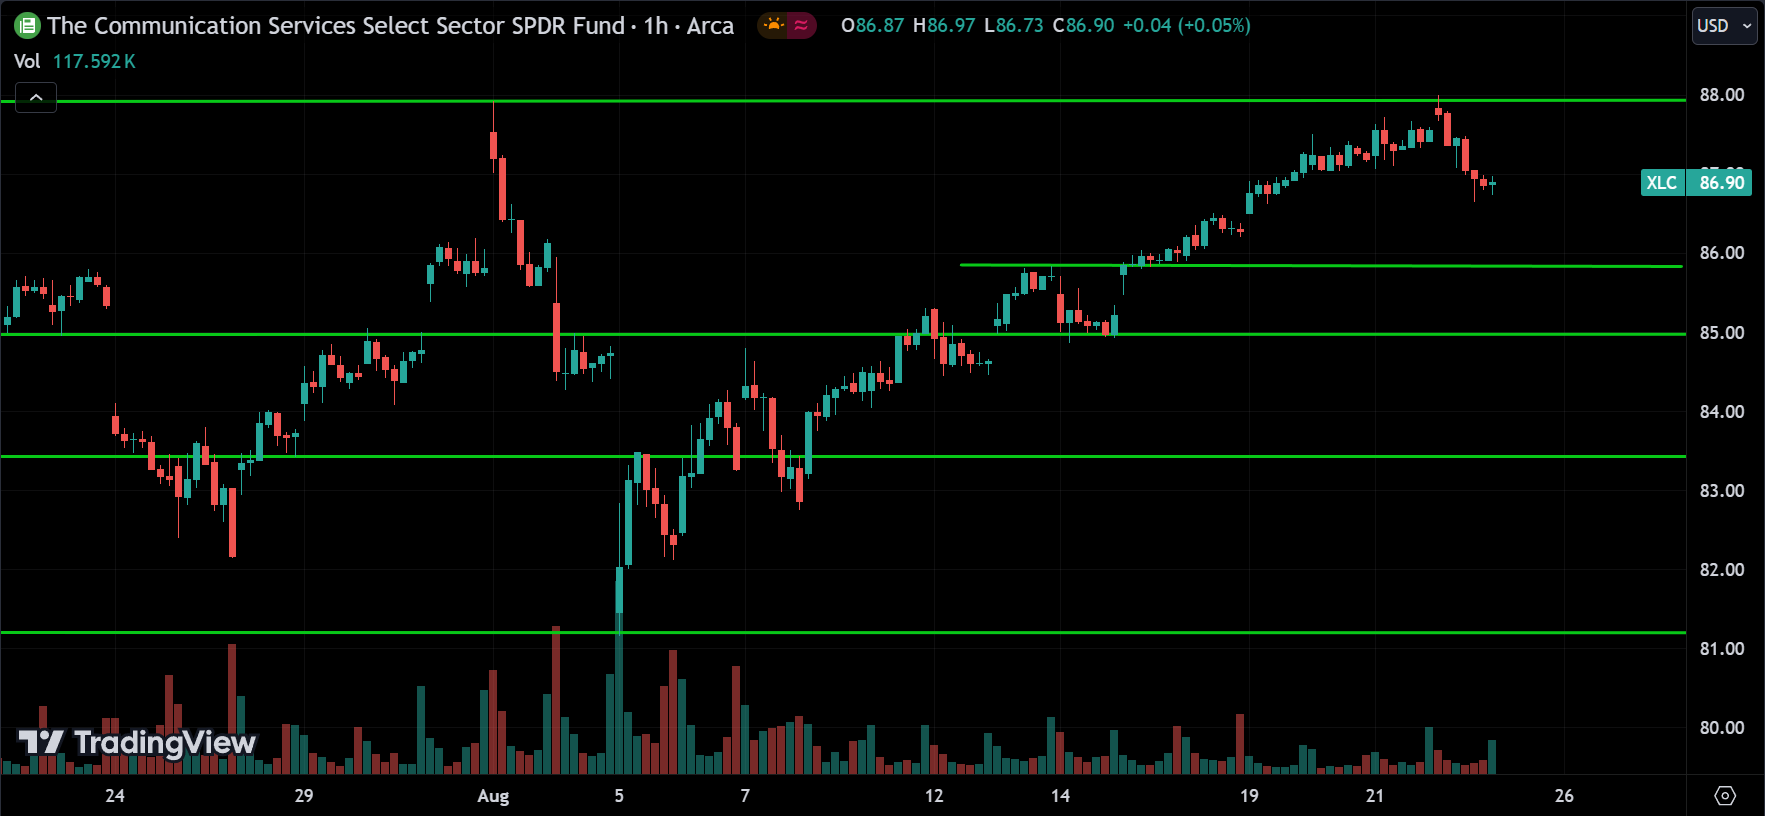
The Communication sector is also trending up, but like the other sectors, it’s going through a correction after reaching resistance around 88. Now, support is around 86; if the price breaks below it, we might see the price continue to drop. However, the price should eventually reverse and continue upward from one of these support levels. So, wait for that signal.
Utility Sector(XLU):
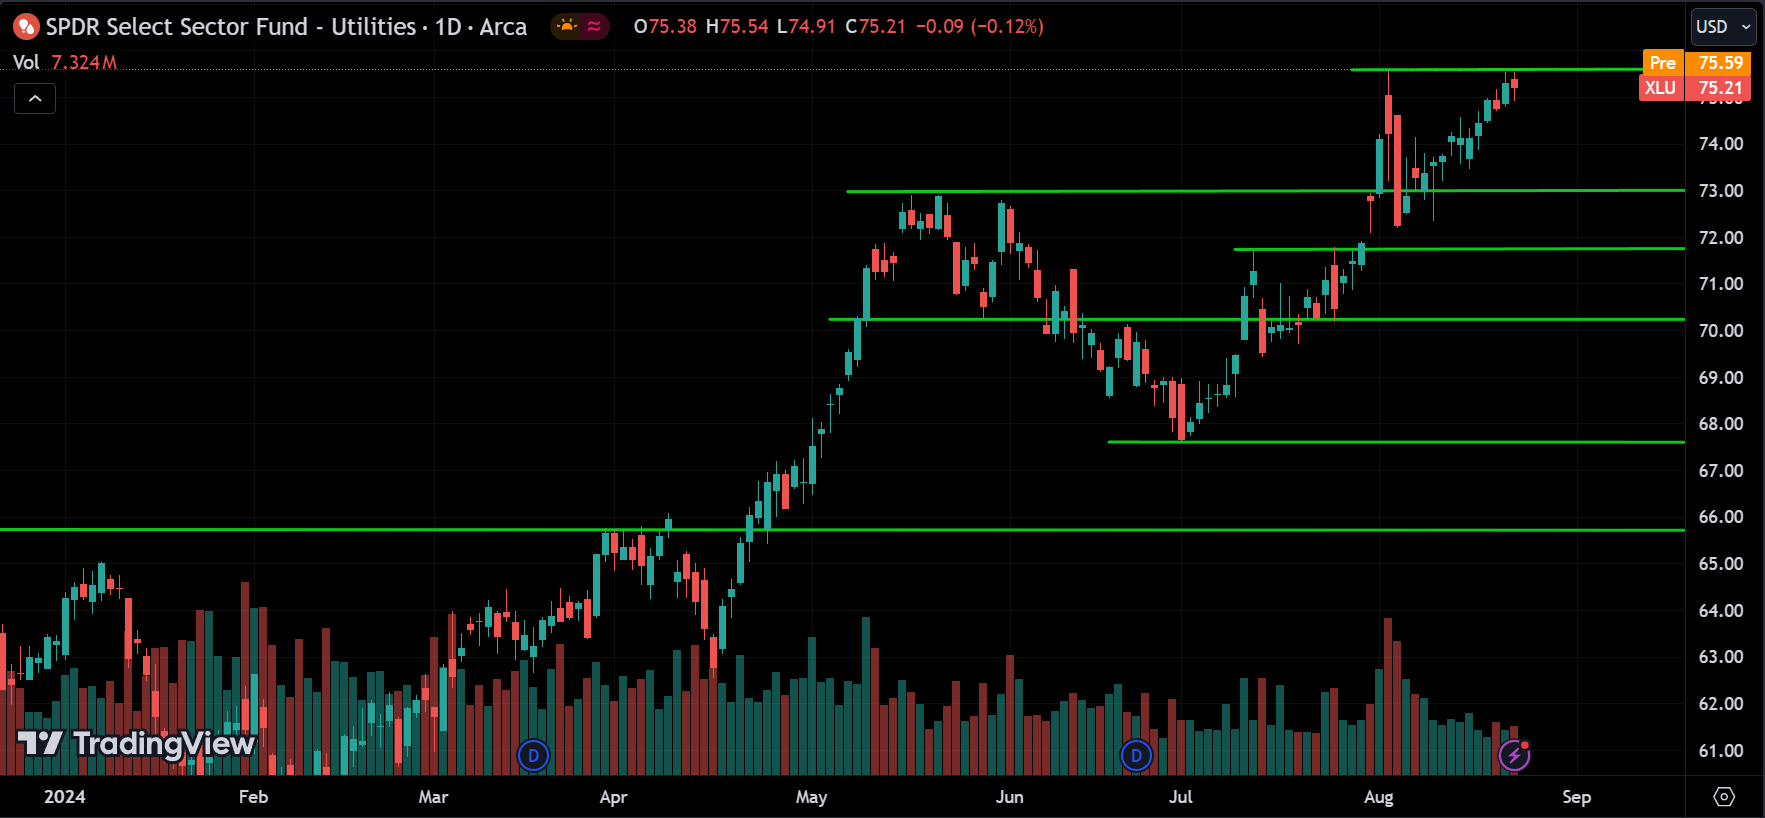
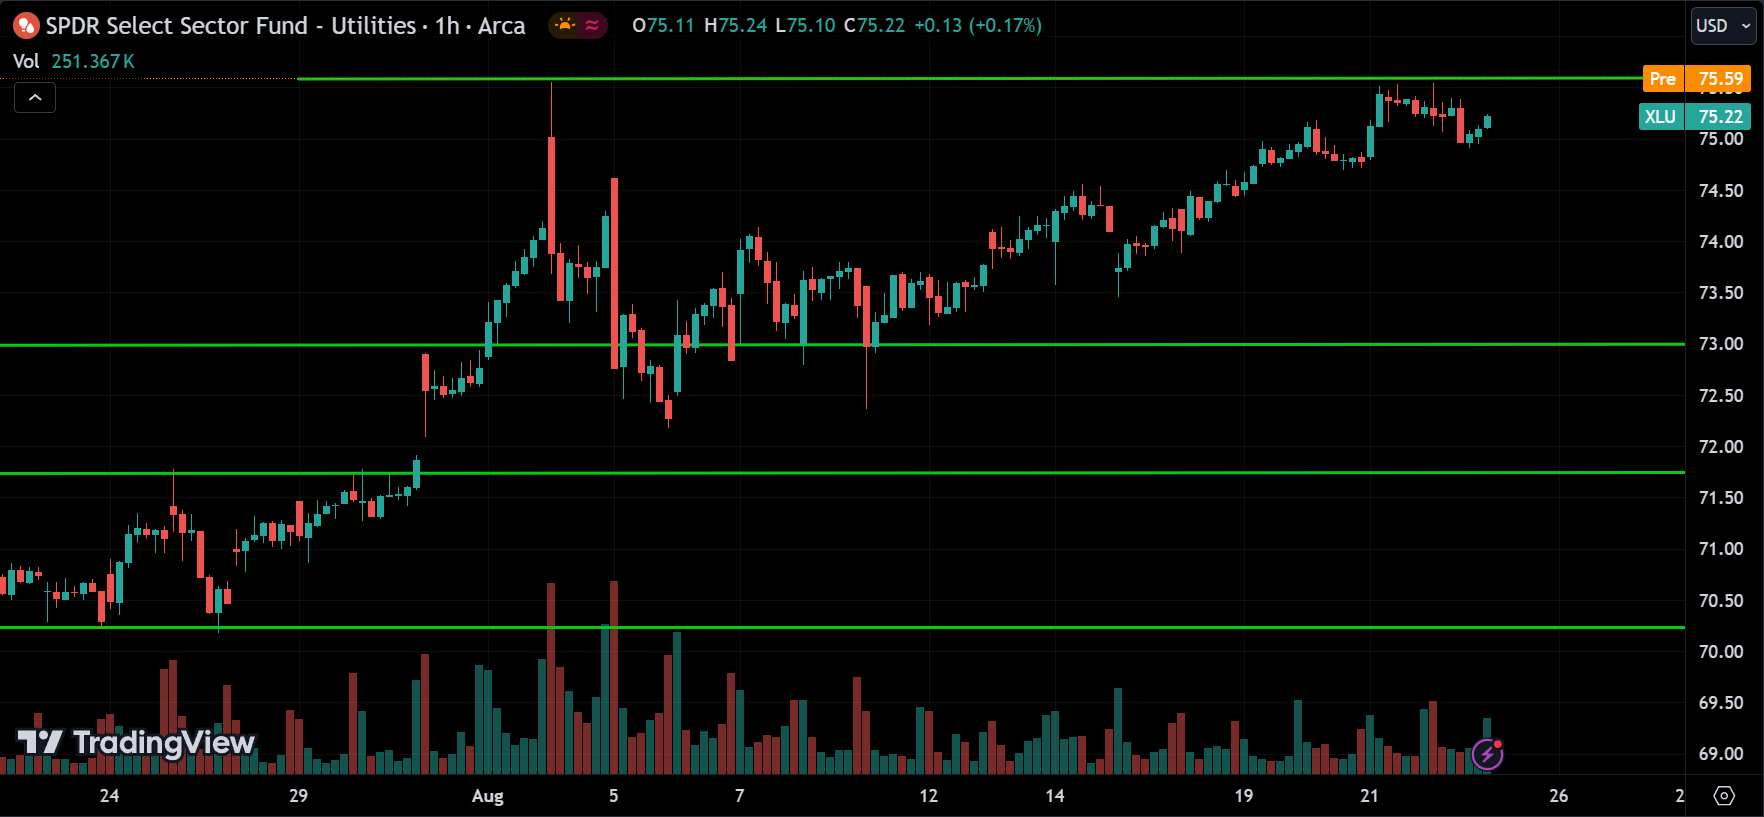
The Utilities sector is also trending up, with the price at a major resistance level around 76. We might see a reversal or correction at this level, causing the price to drop toward 73, or the price could break above the resistance and continue rising.
Real Estate Sector(XLRE):
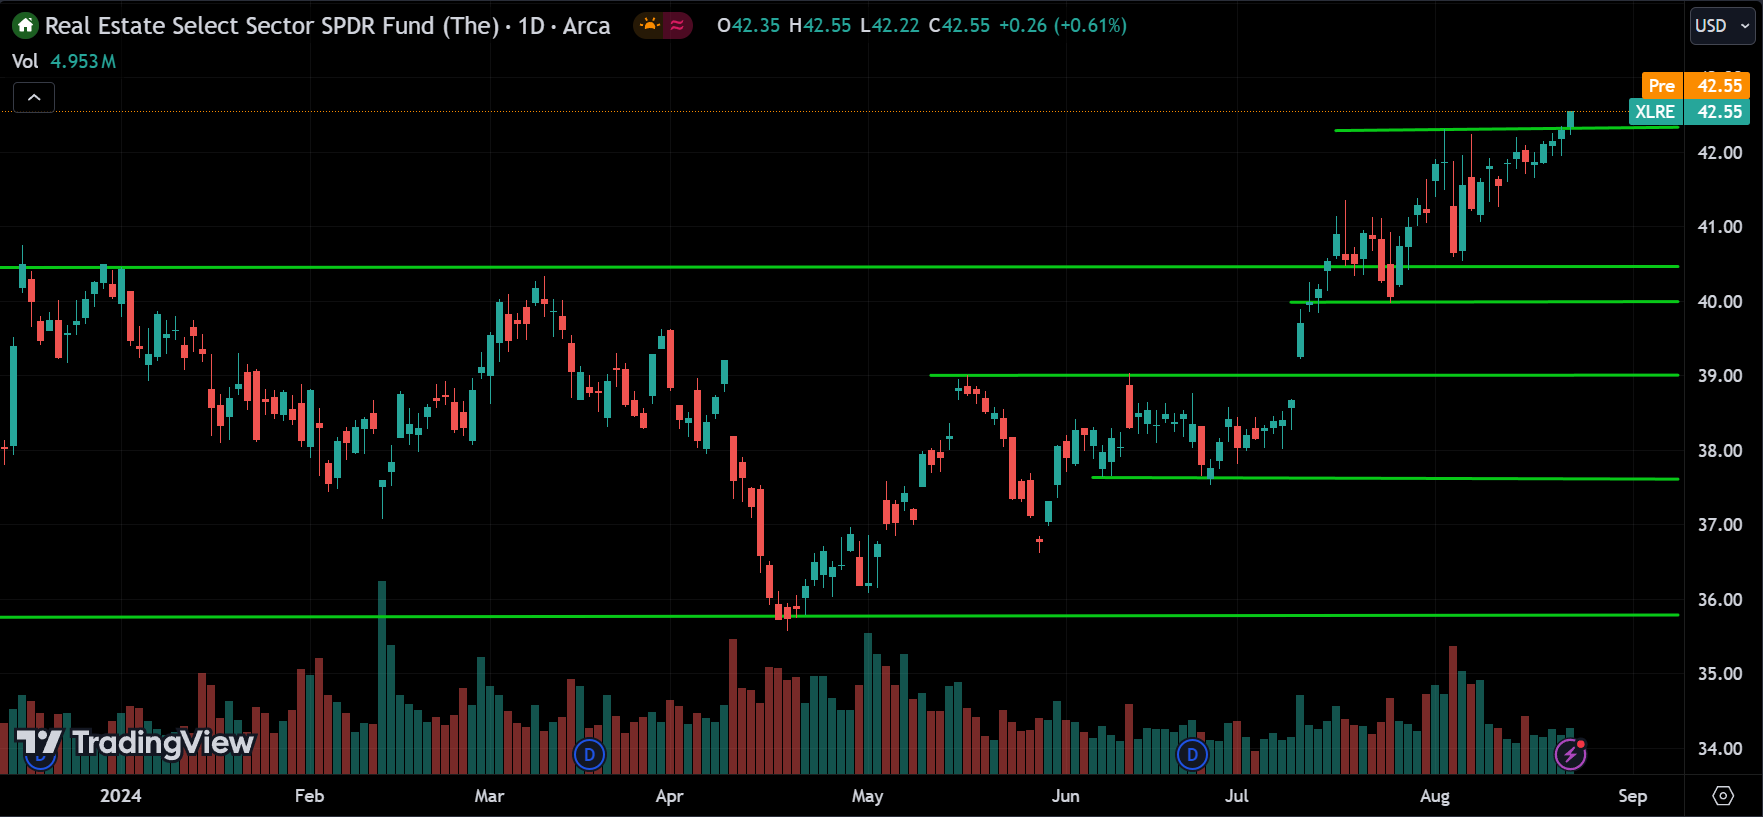
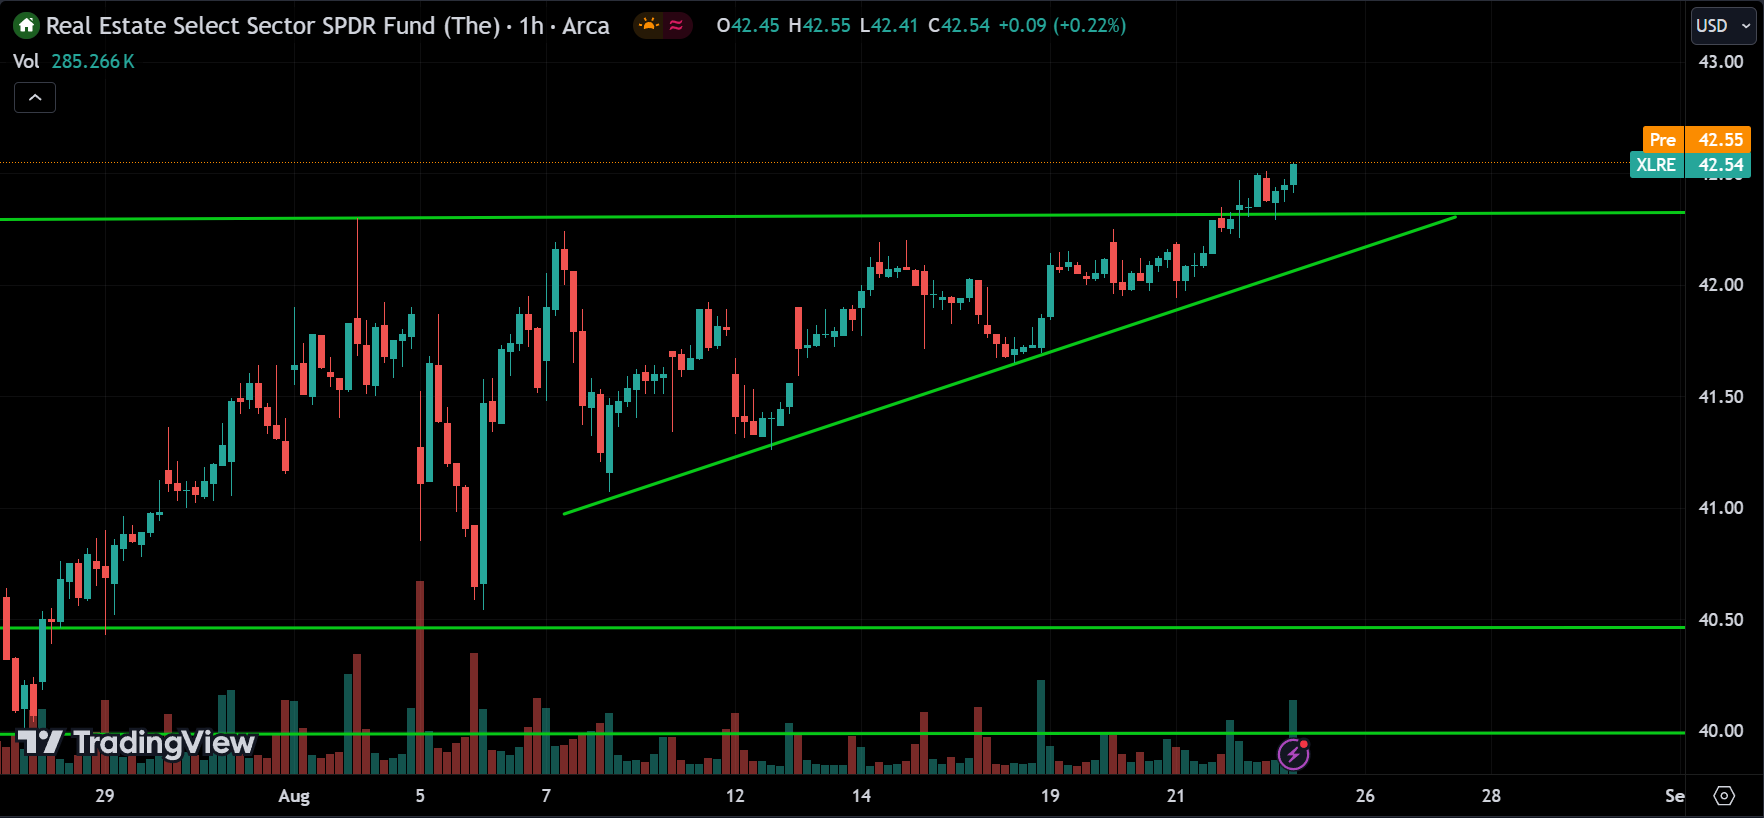
The real estate sector is also trending up, and the price has even broken above the major resistance level, leading the whole S&P 500. We can expect the price to reach new highs, but remember that corrections and pullbacks are important for healthy growth.
Stocks to Watch Today
Nvidia(NVDA):
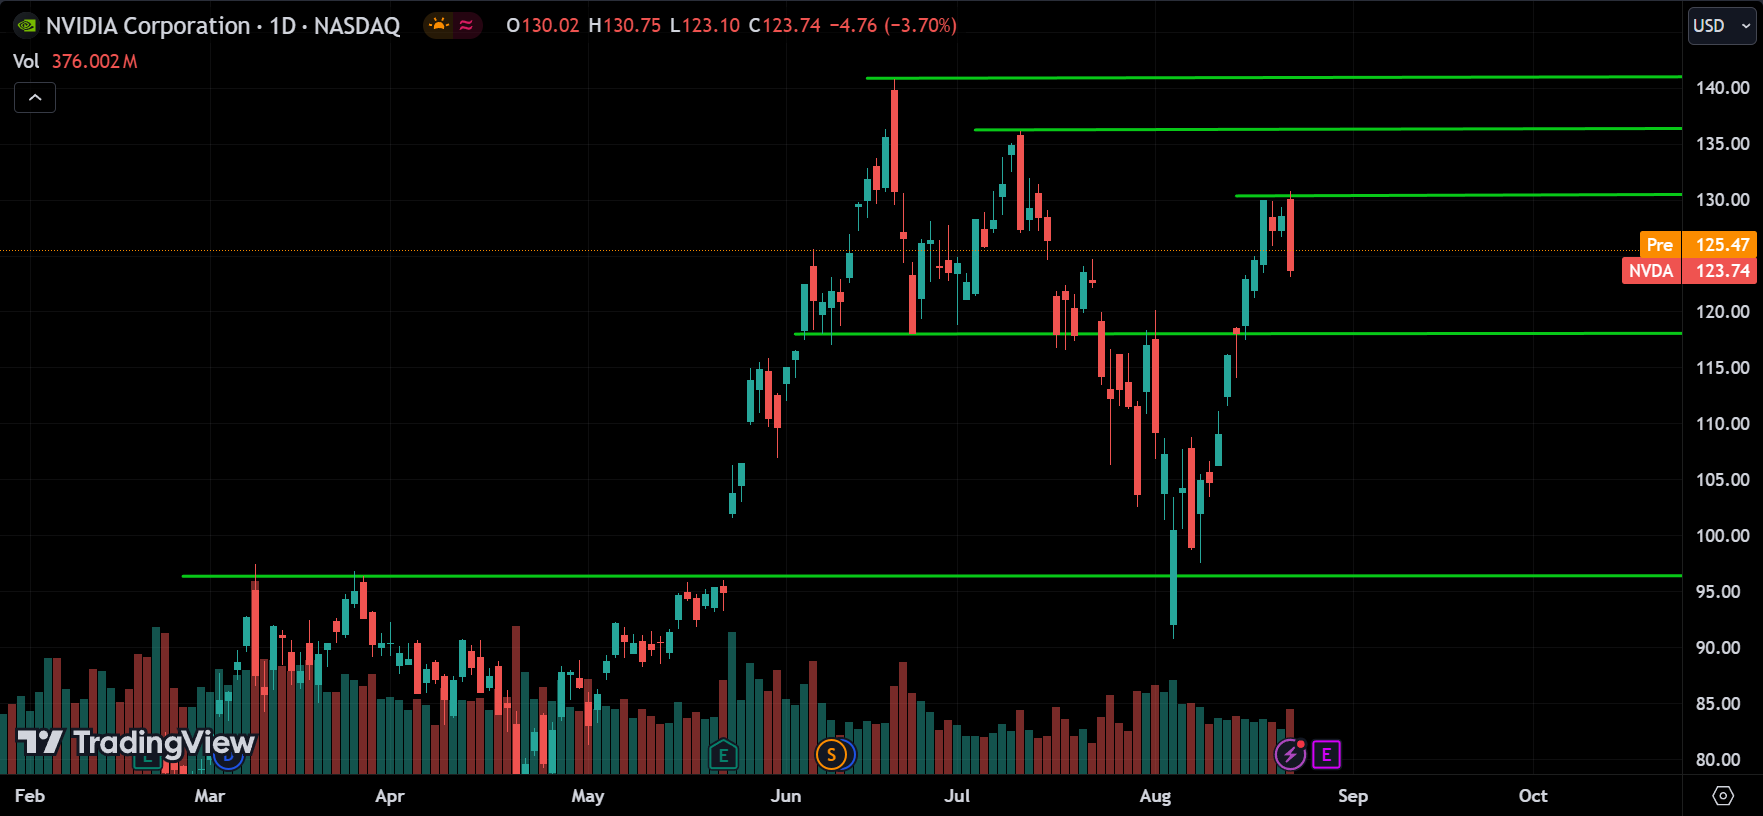
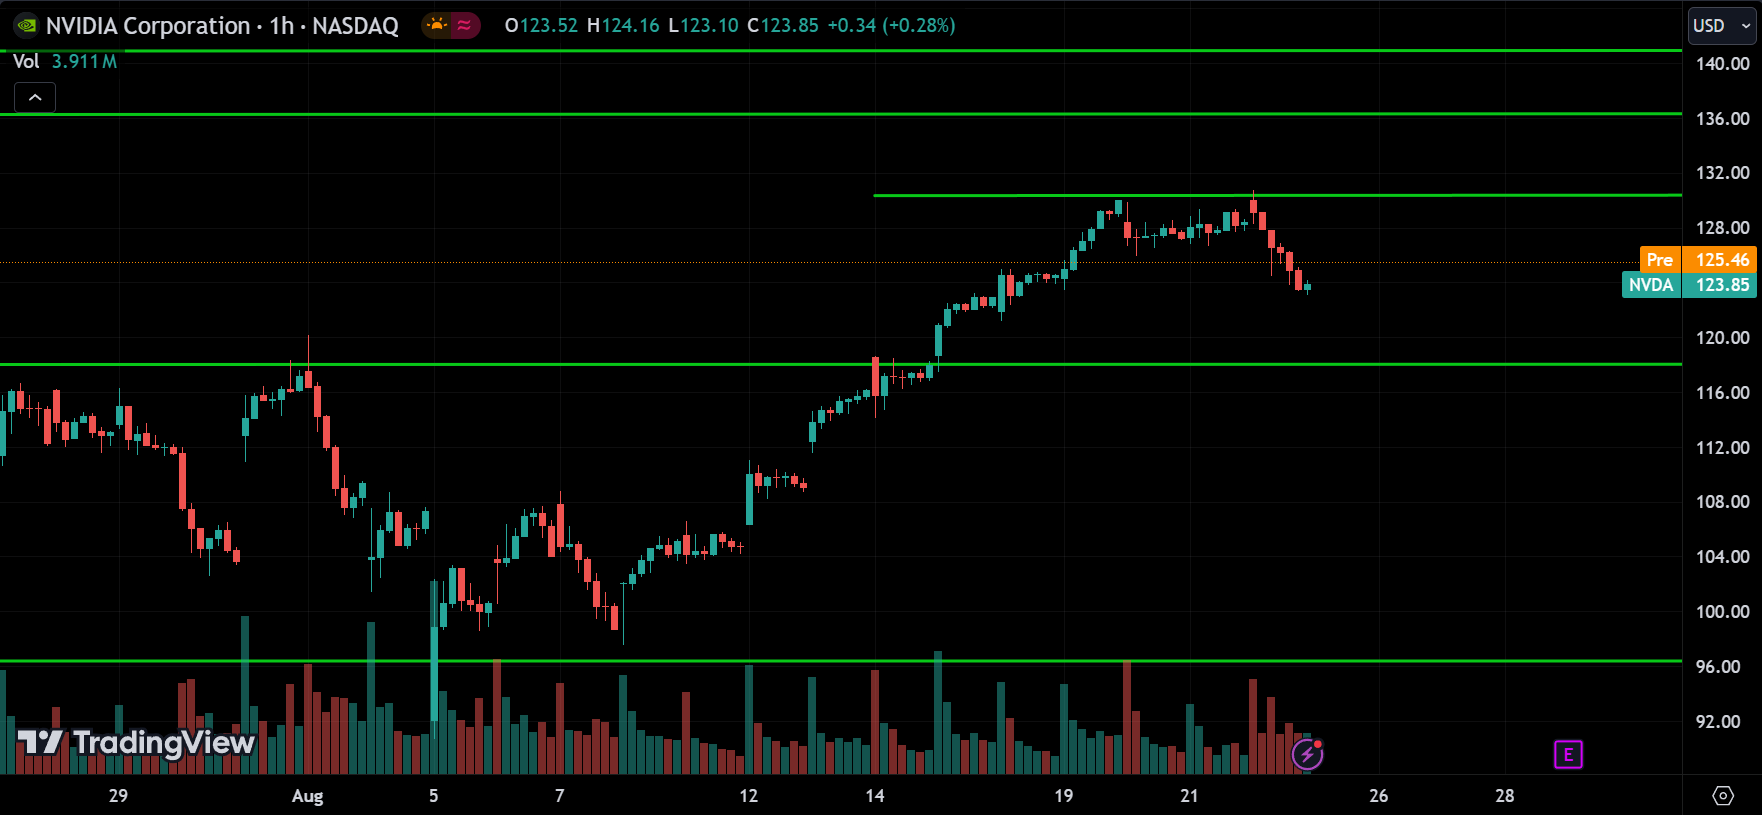
It looks like Nvidia is following the performance of the technology sector. You can compare the charts above to see the similarity. Since the dip is over, we can assume Nvidia is in an uptrend, and the recent pullback is just a correction. The price might start going up soon, possibly from the 120 level. It’s important to understand that AI is like the internet—it offers endless possibilities, but it will take time to develop. To build these AI solutions, you need GPUs for data training, and Nvidia is the best in the market for that. So, you can’t ignore this giant.
Tesla(TSLA):
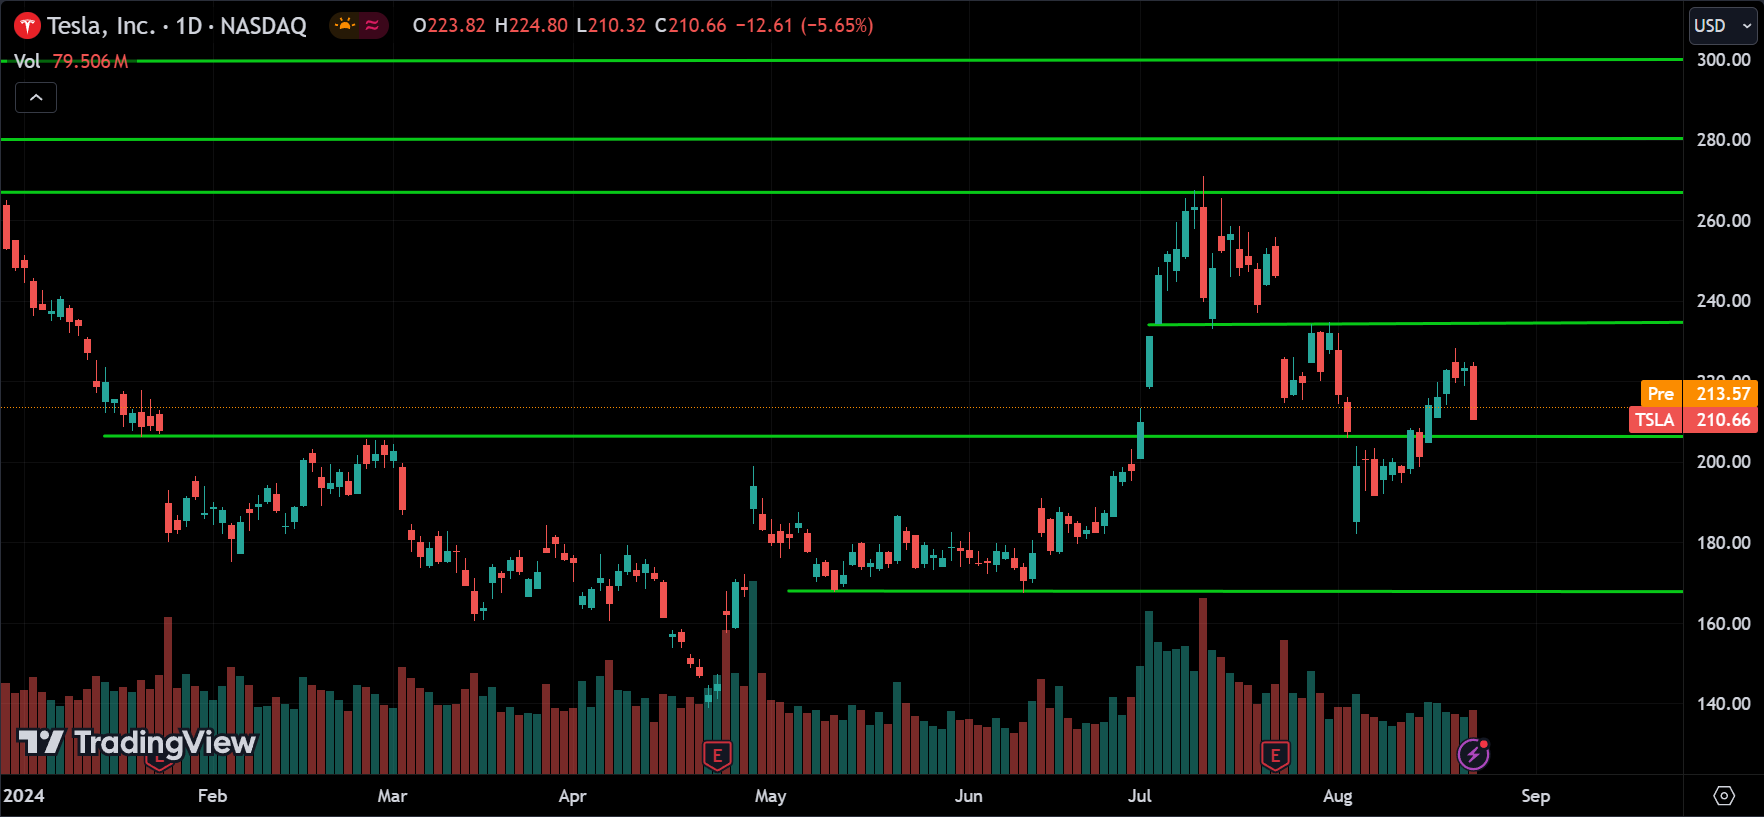
Tesla is trending down but has pulled back along with the technology sector. There’s resistance around 240; if the price breaks above it, we can expect it to continue rising. However, if the price drops to the support around 160, we might see a reversal there, but if it breaks below, the stock could drop further. Tesla is also impacted by giant GPU data centers for projects like Grok. Right now, Tesla is the main stock representing Elon Musk, so if people support what he’s doing, it will reflect in the stock’s performance.
Bank of America(BAC):

Bank of America reported positive earnings last month. After the price dipped to 36, it started to rise and is now nearing a resistance level. Once the price breaks above this resistance, we can confirm the uptrend, so wait for that confirmation. Also, note that a dividend payment is coming up, and the market usually factors this in after earnings.
Conclusion & Disclaimer
Subscribe to our Telegram channel to get instant updates on new articles.
Please provide your feedback on how we can improve this article. Thank you!
We discussed these sectors and markets because when the entire market or sector goes through certain movements, most of the stocks within that market will also experience similar movements. So, by understanding what the market is doing, you can conduct your own analysis on specific stocks.
These analyses are here to help you understand how to analyze the market. They’re not about giving buy or sell signals. It’s simply about observing price action market behavior. I don’t recommend when to buy or sell because trading doesn’t work that way. You need a strategy to guide your decisions about when to enter or exit positions. That’s the key to making consistent profits in the financial markets over time.
The information provided in this market analysis is for educational and informational purposes only. It should not be construed as financial advice or a recommendation to buy, sell, or hold any securities or investments.
All investments involve risk, and past performance is not indicative of future results. The analysis provided may not be suitable for all investors and should be used at their own discretion.
Readers are encouraged to conduct their own research.
Trading and investing in financial markets carry inherent risks, including the risk of losing invested capital. It is important to carefully consider your investment objectives, risk tolerance, and financial situation before making any investment decisions.
GOOD LUCK✌!!!