
In the realm of finance and investing, traders are constantly seeking ways to measure the performance of their investments and strategies.
Among the myriad of metrics available, the Sharpe Ratio stands out as one of the most widely used and respected tools for evaluating risk-adjusted returns. This article will delve into what is Sharpe Ratio, how it is calculated, and why it holds such significance in the world of trading.
What is Sharpe Ratio?
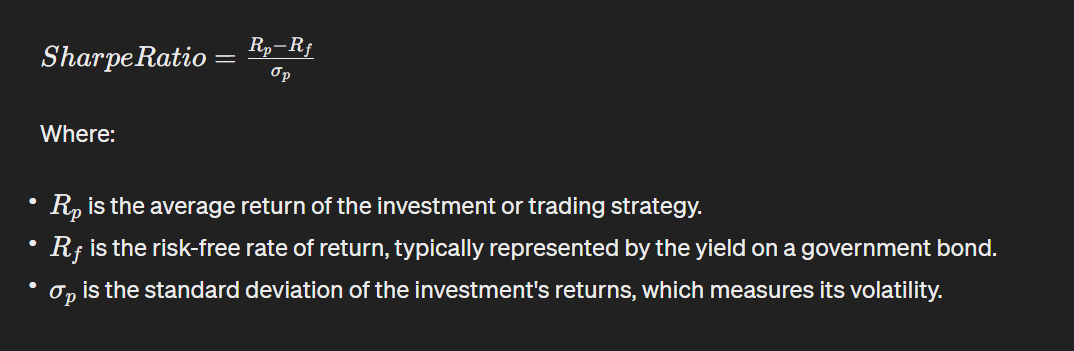
The Sharpe Ratio, named after its creator William F. Sharpe, is a widely used financial metric that helps investors and analysts assess the risk-adjusted return of an investment or portfolio. It measures how much excess return an investment generates for each unit of risk it takes on.
The Sharpe Ratio encourages us to understand the amount of profit we generate for every level of risk we assume. The main goal is to consider not only the returns but also the relationship between returns and risk. It’s crucial to evaluate the extent of risk we’re exposed to.
When the Sharpe Ratio was first introduced, its purpose was to facilitate the comparison of mutual funds. Imagine you have two funds, Fund A and Fund B, each with differing performances over a year. As an investor, you often face the challenge of deciding where to invest your money.
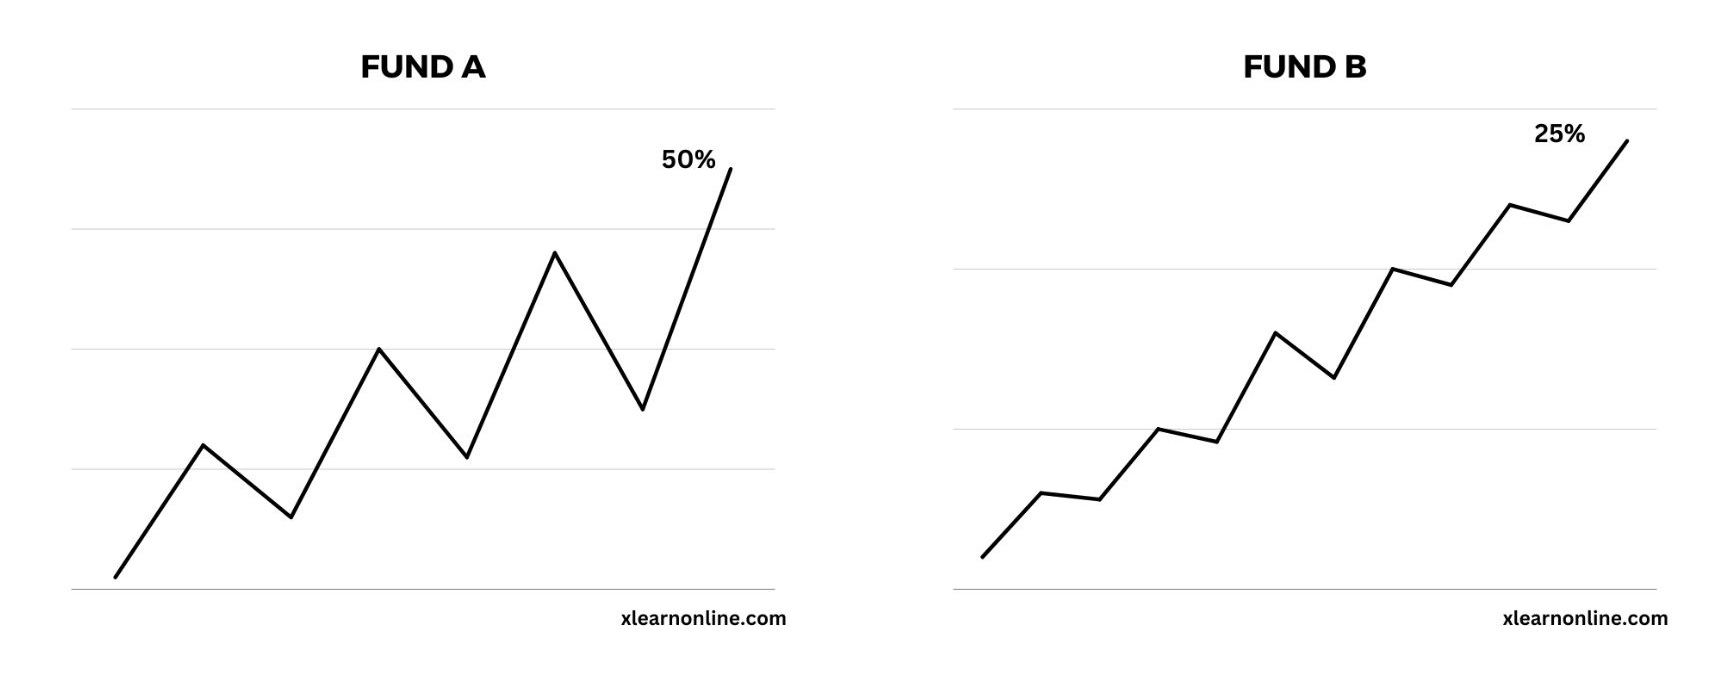
Let’s look at Fund A and Fund B. Fund A gave a 50% return, while Fund B gave 25%. Some might think Fund A is better because of the higher return. But Fund A took a lot more risk than Fund B.
Fund A’s value went up and down a lot, unlike Fund B, which was more stable. If you put your money in Fund A, especially when it was doing really well, you could lose a lot if it suddenly drops. Fund B didn’t have big drops like Fund A did. So, even though it didn’t make as much money, the 25% return it gave was still pretty good, considering it didn’t take on much risk.
We’re not just looking at the final numbers. We’re also looking at how much the numbers changed over time. We use something called “standard deviation” to measure this change.
Let’s say Fund A’s standard deviation is 40%. The Sharpe Ratio comes from comparing the return to the standard deviation. So, with a 50% return and a 40% standard deviation, Fund A’s Sharpe Ratio is 1.25. Now, imagine Fund B’s standard deviation is 4%. Dividing 25 by 4 gives a Sharpe Ratio of 6.25. This means Fund B gives a return of 6.25% for each unit of risk, while Fund A only gives 1.25%.
Clearly, Fund B gives much better returns for the risk it takes, making it a better choice for investment. That’s how people use the Sharpe Ratio to compare different funds and decide which one is better.
Limitations of the Sharpe Ratio
While the Sharpe Ratio provides valuable insights into risk-adjusted returns, it is not without limitations.
Sensitivity to Benchmark: The choice of the risk-free rate and benchmark index can influence the calculated Sharpe Ratio, potentially leading to discrepancies in comparisons.
Assumes Normal Distribution: The Sharpe Ratio assumes that returns follow a normal distribution, which may not hold true in all market conditions, particularly during periods of extreme volatility or market turmoil.
Ignores Non-Normal Risk: It does not account for non-normal risk factors such as tail risk or asymmetric returns, which can impact the reliability of the metric.
Sharpe Ratio for Trading
Similar to how it is applied to funds, the Sharpe Ratio is also employed to compare strategies, assessing their performance in relation to the associated level of risk.
A positive Sharpe Ratio indicates that the trading strategy is generating excess returns above the risk-free rate for the level of risk it’s taking on.
A higher Sharpe Ratio suggests a more attractive risk-adjusted return. Traders generally seek strategies with higher Sharpe Ratios.
A negative Sharpe Ratio implies that the trading strategy is not generating enough returns to compensate for the risk taken.
Calculating Sharpe Ratio for Trading Strategies:
Gather Data: Collect the historical data of the trading strategy’s returns. This data could be daily, weekly, monthly, or any relevant time frame.
Calculate Average Return: Calculate the average (mean) return of the trading strategy over the chosen time frame. Sum up all the returns and divide by the number of periods.
Calculate Standard Deviation: Compute the standard deviation of the trading strategy’s returns. This measures the volatility or risk of the strategy.
Calculate Sharpe Ratio: Compute the Sharpe Ratio by dividing the average return by the standard deviation and then multiplying the outcome by the square root of the number of trading days in a year for that specific trading instrument. This computation yields the Sharpe Ratio value.
The Sharpe Ratio is typically applied to yearly data, but when dealing with daily data, it’s necessary to annualize the returns. If you’re trading stocks, forex, or other weekday markets, you would multiply by the square root of 252, representing the number of trading days in a year. However, in the case of cryptocurrencies, the multiplication factor should be 365, as they trade every day of the year.
Conclusion
By calculating the Sharpe Ratio for each strategy you use, you can understand how they perform compared to each other and how safe they are. As a trader, it’s crucial to figure out the Sharpe Ratio because it tells you about the risk you’re taking compared to the rewards you’re getting. This helps you decide where to put more money, which strategies need work, and which ones you should stop using.
Professional trading firms make sure to use this calculation in their work, showing how crucial it is for traders to know about this metric.
Being successful in any type of trading really depends on how well you can figure out and use Sharpe Ratios in your trading. This becomes even more important as risks show up, and you start seeing how small differences in performance add up, especially if you’re using automated strategies. So, understanding how each strategy performs is a really important part of your journey as a trader.