
Success in the trading world requires a deep understanding of your performance. Just like any other field, relying solely on instinct or gut feeling isn’t enough. Traders need a reliable set of metrics to analyze their strategies, identify weaknesses, and track progress.
This article dives into the most important metrics in trading, explaining what they measure and why they are important. By incorporating these metrics into your strategy, you’ll gain valuable insights and make informed decisions to improve your trading performance.
What is “Batting Average”?
In trading, the term “batting average” is often used as an analogy to describe the success rate or accuracy of a trader’s trades.
The batting average refers to the ratio of winning trades to total trades executed by a trader. It measures the trader’s ability to make successful trades. A higher batting average indicates a higher percentage of winning trades, while a lower batting average suggests a lower winning trades.
The average probability that a trader is right.
The formula for calculating a basic trading batting average is as follows:
Batting Average = (Number of Profitable Trades) / (Total Number of Trades)
For example, let’s say a trader executed 50 trades and 30 of them were profitable. Using the formula, the batting average would be:
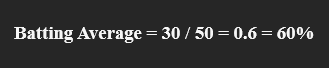
This means that the trader has a batting average of 60%, indicating that, on average, they are successful in 60% of their trades.
Monitoring and improving one’s batting average in trading is important because it reflects the trader’s consistency and effectiveness in making profitable trades.
A higher batting average generally indicates better trading skills and strategies, while a lower batting average may indicate the need for adjustments or improvements in the trader’s approach.
In simple terms, if you have a higher batting average, it means that you are good at predicting where stock is going.
What is “Risk Reward Ratio”?
The risk-reward ratio is a metric used in trading to assess the potential return in relation to the potential risk of a trade. It helps traders evaluate the profitability and risk management of their trading strategy.
The risk-reward ratio compares the amount a trader stands to gain (reward) against the amount they are risking (risk).
It is typically expressed as a ratio, such as 2:1, or as a multiple, such as 2x. A higher risk-reward ratio indicates a potentially more favorable trade setup.
To calculate the risk-reward ratio, you divide the potential reward by the potential risk.
Risk-Reward Ratio = Potential Reward / Potential Risk
For example, if a trader identifies a trade with a potential reward of $500 and a potential risk of $250, the risk-reward ratio would be:
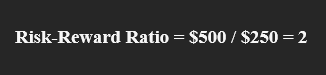
This means that the potential reward is twice the potential risk, in other words, your wins are twice as big as your losses. Indicating a risk-reward ratio of 2:1 or 2x.
A favorable risk-reward ratio suggests that the potential reward outweighs the potential risk.
Traders often aim for a risk-reward ratio that is higher than 1:1, meaning that the potential profit is greater than the potential loss.
A higher risk-reward ratio allows traders to have a greater potential for profitability even if they have a lower percentage of winning trades.
It helps traders focus on trades where the potential reward justifies the risk being taken.
What is “Total Return”?
Total return in trading measures the overall profitability of a trading strategy, taking into account both the capital gains and losses from trades.
The formula for calculating total return in trading can vary depending on the specific circumstances and trading strategy.
To calculate the total return in trading sum up the net profits or losses from all trades as percentage.
Simply add each trade’s return in percentage.
Total Return = Net Profits or Losses / Capital
For example, if a trader starts with an initial trading capital of $50,000 and, after a series of trades, ends up with a net profit of $10,000, the total return would be:
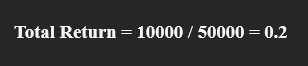
This means that the trading strategy achieved a total return of 20%.
What is “Average Return”?
In trading, average return refers to the average rate of return generated by a trading strategy over a specific period of time. It provides insight into the typical or average performance of the strategy and helps assess its profitability.
To calculate the average return, you would sum up the individual returns of each trade and divide it by the total number of trades.
The formula for calculating the average return can be represented as:
Average Return = (Sum of Individual Returns) / (Total Number of Trades)
For example, let’s say a trader executed five trades with returns of 10%, -5%, 8%, 12%, and -2%. To calculate the average return, you would add up these returns and divide by the total number of trades (in this case, five):
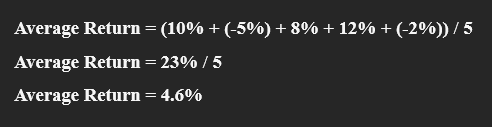
In this example, the average return of the trading strategy is 4.6%, indicating that, on average, each trade has generated a 4.6% return.
Average return is a useful metric for evaluating the performance of a trading strategy over time.
It allows traders to assess the typical profitability of their trades and compare the performance of different strategies.
What is “Average Win-Loss Ratio”?
In trading, the average win-loss ratio is a metric used to measure the average profitability of winning trades compared to losing trades. It provides insight into the relationship between the average gain and the average loss of a trading strategy or system.
To calculate the average win-loss ratio, you would divide the average gain (or profit) from winning trades by the average loss from losing trades. The formula can be represented as:
Average Win-Loss Ratio = (Average Gain from Winning Trades) / (Average Loss from Losing Trades)
For example, let’s assume a trader has executed 8 trades, with winning trades resulting in gains of $1,000, $800, $1,200, and $1,500, while losing trades incurred losses of $500, $700, $600, and $800.
To calculate the average win-loss ratio, you would determine the average gain and the average loss:
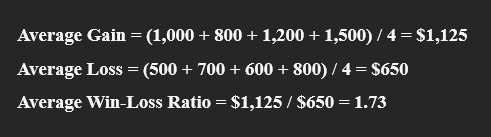
In this example, the average win-loss ratio is 1.73, indicating that, on average, the trader’s winning trades generate 1.73 times more profit compared to their losing trades.
The average win-loss ratio helps traders assess the overall profitability and risk-reward profile of their trading strategy.
A higher average win-loss ratio generally suggests that the strategy is generating larger profits on average compared to losses, indicating a potentially favorable risk-reward relationship.
So when an average win-loss ratio is over 1 then it means you are wins are bigger than your losers.
If the average win-loss ratio is below 1, it suggests that either your winning trades are not substantial enough, you are not allowing them to fully maximize their potential, or your losing trades are significantly larger.
To address this, you should aim to increase the size of your winning trades, allow them to run for longer durations, and implement strategies to minimize losses promptly.
What is “Drawdown”?
In trading, drawdown is a crucial metric used to evaluate the risk associated with a trading strategy or system. It measures the peak-to-trough decline in the equity curve of a trading account, indicating the extent of loss experienced by the trader during a certain period.
To calculate the drawdown, you would first determine the peak equity value and the lowest equity value during a specific timeframe. The formula can be represented as:
Drawdown = ((Peak Equity – Lowest Equity) / Peak Equity) * 100%
For example, let’s consider a trading account that reached a peak equity of $10,000 and then experienced a drawdown resulting in a lowest equity value of $7,000.
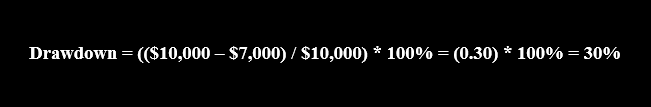
In this example, the drawdown is 30%, indicating that the trading account experienced a 30% decline from its peak value.
Drawdown analysis helps traders assess the risk exposure and resilience of their trading strategies. A lower drawdown implies a more stable and consistent performance, while a higher drawdown suggests higher volatility and risk.
Traders often aim to minimize drawdowns by implementing risk management techniques such as setting stop-loss orders and adhering to disciplined trading practices.
By monitoring and managing drawdown effectively, traders can maintain a healthy balance between risk and reward, ultimately contributing to long-term trading success.
Limitations of Metrics
Looking Back, Not Forward: Metrics are based on historical data and can’t predict future market behavior. Past performance isn’t a guarantee of future results.
Overfitting and Cherry-Picking: Focusing too heavily on specific metrics can lead to overfitting your strategy to past data, making it less effective in new market environments. Similarly, cherry-picking metrics to paint a rosy picture can be misleading.
Focus on the Process, Not Just the Outcome: Obsessing over metrics can lead to chasing short-term gains and neglecting the importance of sound trading principles and risk management.
Conclusion
There’s another measure called the Sharpe ratio that I didn’t discuss here. It’s a bit more advanced and is used to measure returns considering risk. We’ll explore it further in a separate article later on.
Metrics are an essential tool for traders, providing valuable insights into performance and guiding strategy refinement. Among the most critical metrics are Batting Average and Average Win-Loss Ratio, which directly impact profitability.
A desirable Batting Average typically ranges between 60% to 65%, indicating a high percentage of successful trades. Similarly, a favorable Win-Loss Ratio exceeds 1, indicating that gains outweigh losses.
It’s crucial to consider both metrics together, as they complement each other. For instance, while a trader may have a lower Batting Average, a high Win-Loss Ratio can still lead to profitable outcomes.
However, metrics alone do not guarantee success. Responsible trading practices, a well-defined plan, and continuous learning are equally vital for navigating financial markets effectively.
By integrating a data-driven approach with sound risk management and emotional discipline, traders can optimize their chances of achieving their trading objectives.