
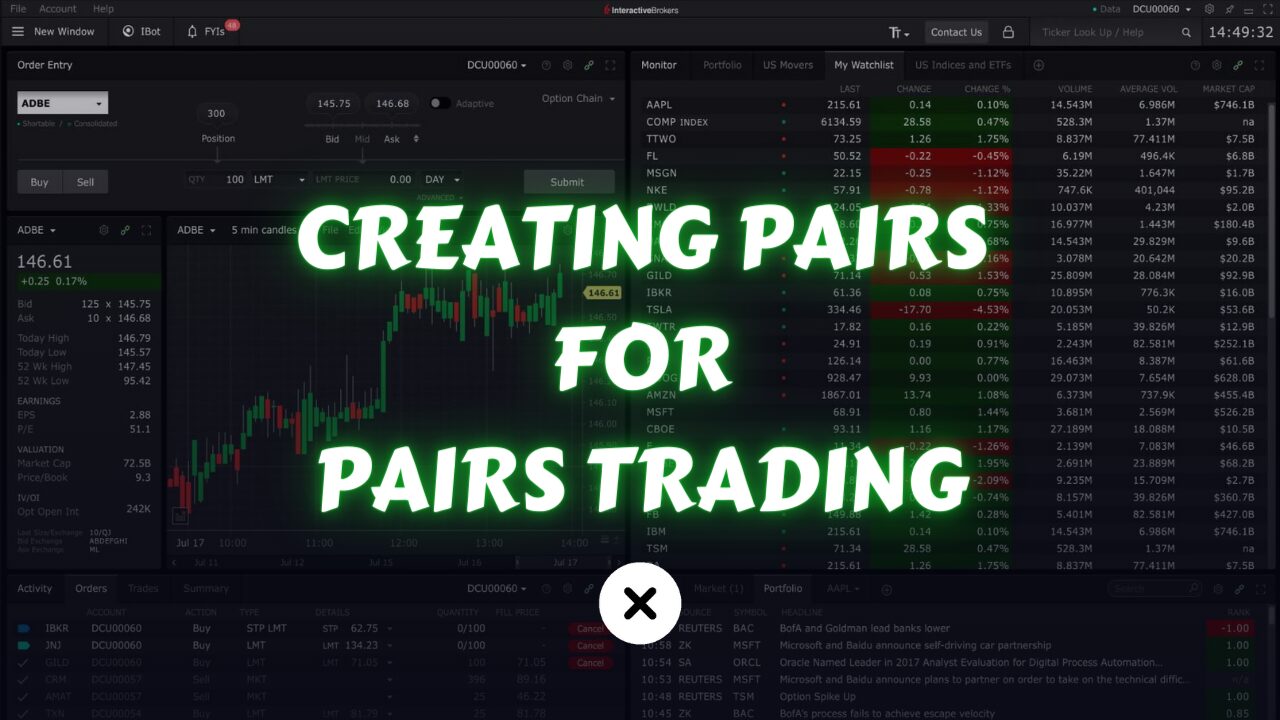
Pairs trading is a popular trading strategy that involves exploiting the relative performance of two correlated assets. The strategy relies on identifying pairs of assets whose prices historically move in tandem but occasionally diverge due to temporary market inefficiencies.
While pairs trading can be highly profitable when executed correctly, the key challenge lies in selecting suitable pairs with a strong correlation. In this article, we delve into the intricacies of creating pairs for pairs trading, exploring the fundamental principles, methodologies, and tools essential for success in this trading strategy.
What is a Pair?
In this strategy, you’re no longer trading individual stocks. Instead, you’re creating a new financial product using two different assets, and that’s what you’re trading. This product is called a “pair,” which combines two symbols.
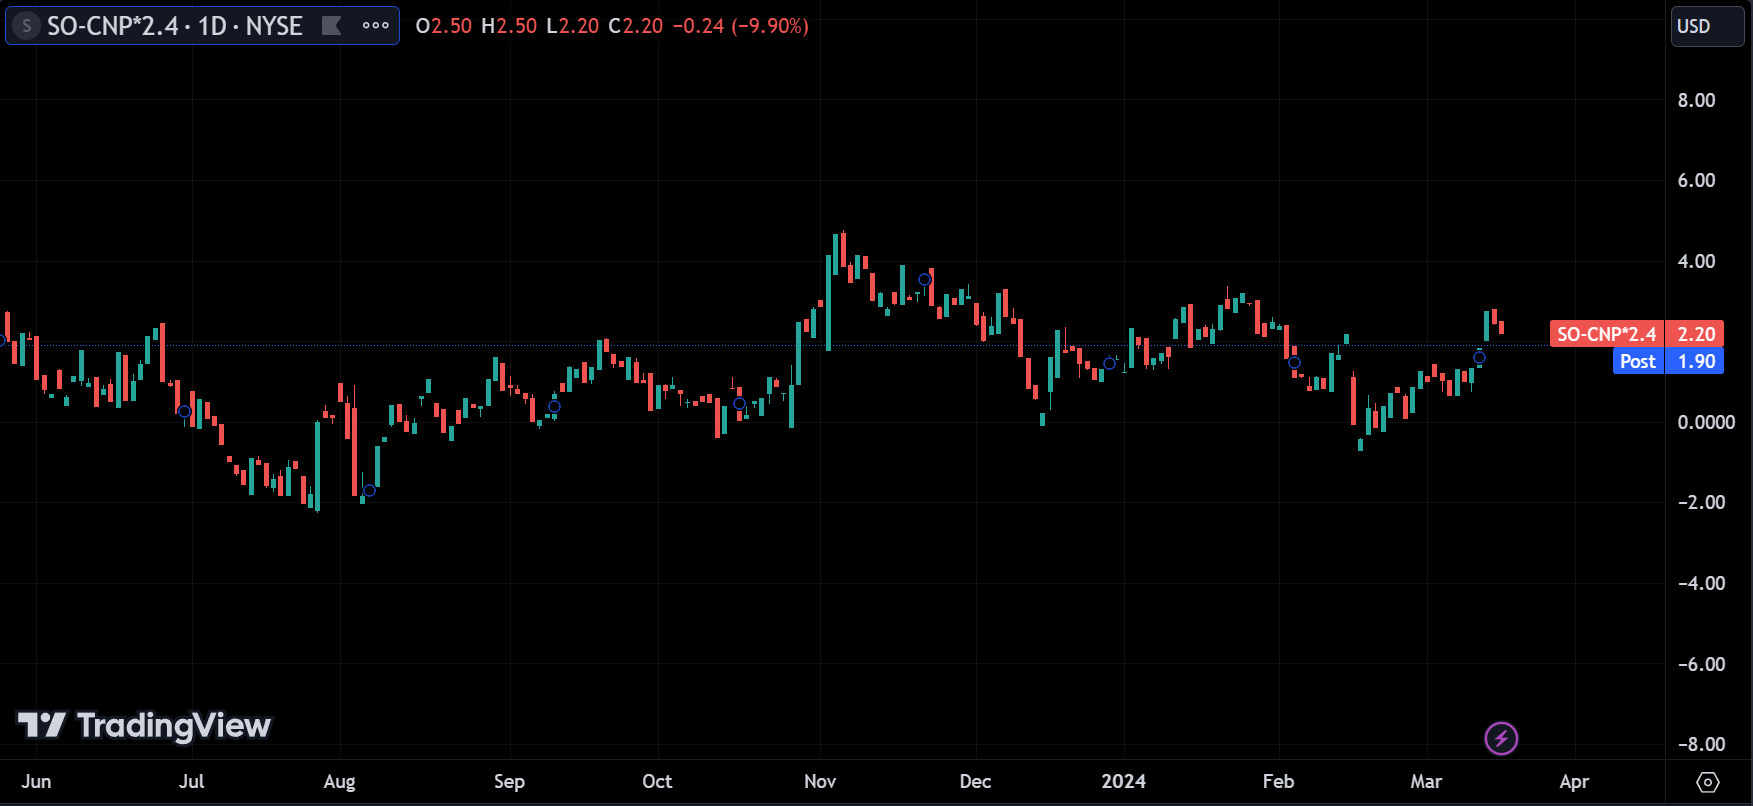
The pair will have its own price chart, similar to the one displayed above. We make our trading decisions by looking at this chart, not at individual assets.
With this, you can trade both assets simultaneously, entering and exiting both positions at the same time.
Creating Pairs for Pairs Trading
What makes a good pair? Which stocks should we consider? With over 9000 stocks available, it might seem like we can compare any of them, right? However, most of them would make poor pairs because the companies are so different.
So, what should we look for in finding good pairs that move together? First, we want to see consistent price behavior. It’s not just about stocks moving together; we need a reason behind their movement to ensure it continues. That’s where fundamental reasons come in.
Companies catering to the same market, product, or industry, or those working together, tend to have correlated performance. For instance, if Apple has a bad quarter, the company producing their products and materials might also struggle.
But there are many ways companies can be related, so exploring different relationship ideas is key to finding robust pairs. Establishing strong relationships between companies leads to more reliable pairs.
Now, how do you find these things? Well, for price behavior, you can simply look at charts to see if their prices move together or not. Alternatively, you can check correlations to spot the relationship between them.
What is Correlation?
Correlation measures the degree to which the prices of two assets move in relation to each other. the higher the correlation the more in tandem they are with one another.
A correlation coefficient close to +1 indicates a strong positive correlation, meaning the prices of the assets tend to move in the same direction. Conversely, a correlation coefficient close to -1 suggests a strong negative correlation, implying that the prices move in opposite directions. A correlation coefficient near 0 indicates little to no correlation.
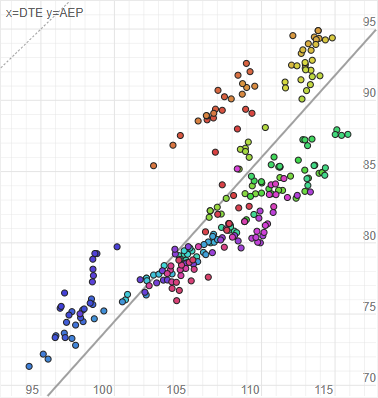
Let’s consider two stocks, DTE and AEP. We track their daily movements over a period of more than 100 days. For instance, on one day, DTE might go up by 1%, and AEP by 2%. On another day, DTE rises by 2%, and AEP by 3%. Then, on yet another day, both DTE and AEP increased by 3%. We plot these movements on a chart.
As we keep adding points to the chart to show their price behavior, we notice a pattern. If we draw a line that fits closely around these points, meaning the distance between the points and the line is minimal, it suggests a strong relationship.
Essentially, when we do this we want to find stocks that align closely with this line, indicating a high correlation between them. This correlation helps us understand how closely their prices move together over time.
When you draw the best-fit line, you’ll get an R score, which is the coefficient value we discussed before. This score basically tells you how correlated the stocks are. The higher the R score, or the closer it is to 1, the stronger the correlation between them.
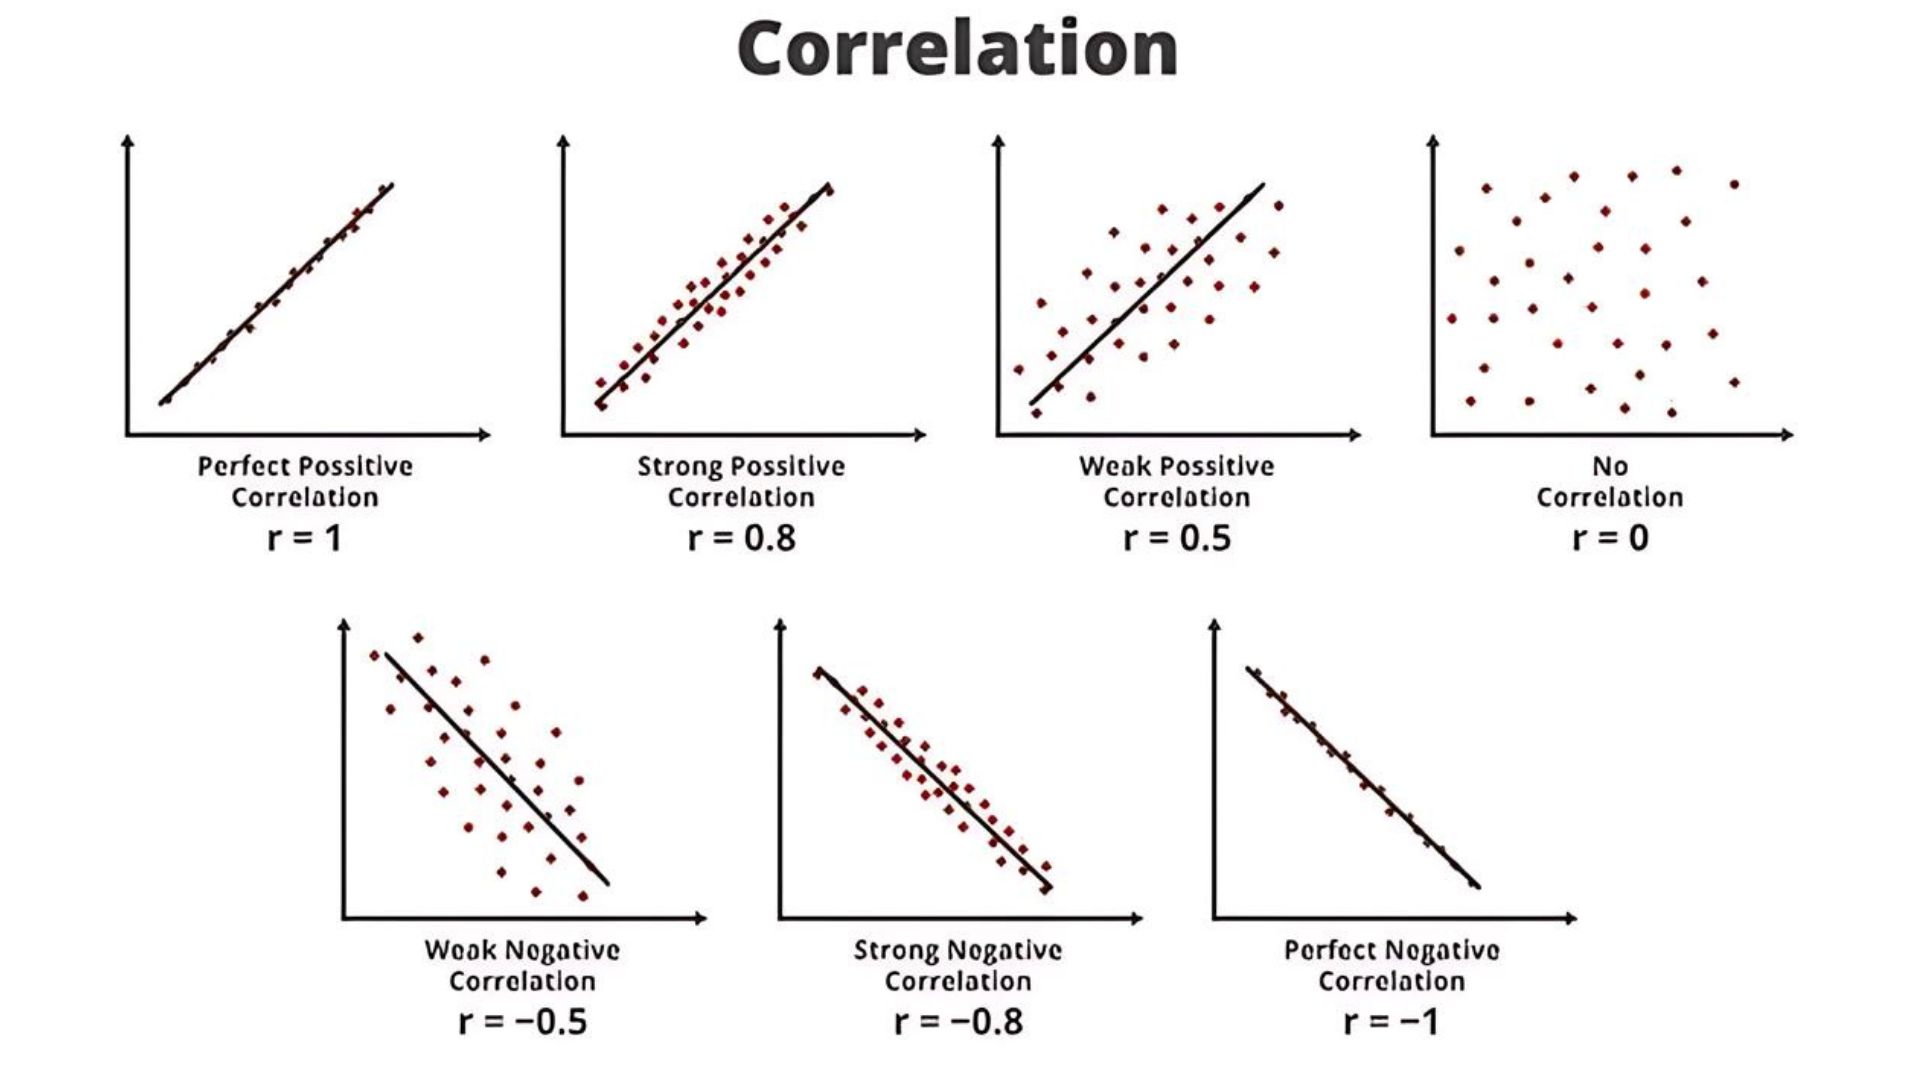
So, when you select pairs, you want to make sure that their correlations or R score is above 0.8.
You might wonder, “How am I supposed to do this? It sounds like a lot of calculations.” Well, hang tight until the end of this article.
Now, another important aspect to consider when selecting stocks is cointegration. But to understand cointegration thoroughly, it’s important to understand how we determine the price of the pair, which is the price of the financial product that we gonna trade, which we discussed earlier.
What is the Hedge Ratio?
What is hedging? Hedging is simply about lowering your risk by taking another type of position. Now, when we hedge in pair trading, we do it by taking both a short and a long position. So, if you’re buying something and then shorting something very similar to that stock, you’re effectively hedging your position.
Now, there’s a function to determine the pair’s price:
Pair Price = STOCK A – STOCK B * Ratio
Let me break it down. We’re looking at two stocks: one is priced at $10, and the other at $20. There’s always a difference between them, let’s say $10. Now, the first stock goes up by 100% from $10 to $20, the second stock also goes up by 100% from $20 to $40. They moved in the exact same percentage returns.
But if you look at their difference or the spread, it’s now $20, even though they both moved the same way. Normally, the spread is around $10 for this pair, but now it’s $20. You might think it should converge back, but it shouldn’t because they moved up in the same percentage, it’s just that they were not the same price to start with.
This is why we need to include a ratio. The ratio is simple: it’s always Stock A divided by Stock B. In this case, 10 is divided by 20, which is 0.5. Basically, one stock is twice as expensive as the other.
Hedge Ratio = STOCK A / STOCK B
So, the pair price is equal to the price of Stock A minus the price of Stock B times the ratio, which in this case is 0.5. So, the pair price is equal to 10 – 20*0.5, which is 0, and that’s what it should be. It means that the stocks are not deviated from one another. If they do deviate, this will change.
In this case, if you’re shorting 1 share of Stock B, you should long 2 shares of Stock A because they are different in value.
So, the positions you take should be equal to each other. In that way, you can hedge your position. You have to make sure that you have the same dollar value in both positions, which is called dollar value hedging.
This is how we create the new financial product “The Pair.” We’ll only make our trading decisions based on this pair price.
Now let’s move on to cointegration.
What is Cointegration?
Cointegration is an advanced topic, so what I’ll do is simply explain what cointegration means for pair trading.
To grasp cointegration, you first need to understand stationarity. Stationarity means price series that tend to return to their average over time. In simpler terms, anything that goes up and then comes back down, staying within a certain range, is considered stationary.
Now, cointegration is found when we find stationarity by combining multiple non-stationary price series together. These price series are called cointegrated.
Let me explain.
Imagine there’s a stock A that moves randomly, not sticking to a pattern, or in other words, not mean-reverting.
Now, maybe stock B also moves in the same way. Sometimes they deviate from each other, but they both move similarly.
If we plot the pair price for these two stocks, we know that if they’re not deviated from each other, the pair price should be 0. But it won’t be 0 every day because they’ll deviate from each other from time to time. This is what we want.
So, our pair price will fluctuate, but it’ll come back to 0. For instance, it might go to 5, then back to 0, then to -5, then to 3, and so on. This is what we call mean-reverting.
It’s hard to find stocks that behave this way, but it’s easy to find stocks that don’t. However, we can create this new mean-reverting financial product using those stocks that don’t behave this way.
With this product, all you have to do is short the pair when the spread increases and long the pair when the spread is low. And you keep doing this because this pair price will show the same price behavior.
We’ll discuss shorting and longing the pair when we talk about how to trade these pairs. So, stick with me for the next article.
Now, why do we focus on cointegration, and what exactly does it mean? Basically, when we talk about two stocks being correlated, it means they might be moving similarly for a while, for some reason. However, we can’t be certain if this pattern will continue in the long run.
A cointegration test helps us determine if two stocks are cointegrated, meaning they have a long-term relationship with each other. This suggests that the stocks are likely to continue exhibiting the same mean-reverting price behavior over time.
So, simply having a correlation between two stocks isn’t enough. What you really want is cointegration as well. If they’re not cointegrated, they won’t exhibit mean-reverting behavior.
To check for cointegration, there are several methods we can use, and here are a few of them.
- Engle-Granger Test
- Johansen Test
- Phillips-Ouliaris (ADF) Test
- Dynamic OLS (DOLS) Test
- Residual-based Cointegration Test (ARIMA)
- Bounds Testing Approach
- Bootstrap Cointegration Test
- Fully Modified OLS (FMOLS) Test
- Canonical Cointegration Regression (CCR) Test
- Autoregressive Distributed Lag (ARDL) Bounds Test
- Error Correction Model (ECM) Test
- Dickey-Fuller Test
Now, I didn’t delve into the math behind these cointegration tests because even the brightest minds don’t crunch these numbers themselves. So, you and I, we’re going to find some shortcuts. We simply want to discover pairs to trade.
Conclusion
Now, we understand that the initial step in creating pairs for pairs trading involves identifying stocks that are fundamentally correlated, meaning they operate in similar business environments, As discussed earlier. most of the time, stocks within the same sector make stronger pairs.
Therefore, when searching for pairs, it’s best to start with companies within the same sector. Simply observe their price movements on charts and gather as many stocks as possible with a fundamental rationale for their correlation.
The next step is to determine if they are both actually correlated and cointegrated. This used to be the trickiest part of pair trading, but guess what? It’s actually quite simple. There’s a website called pairtradinglab.com, which is a must-visit for pair traders.
The tests we discussed earlier, it does all that for you and tells you if these stocks are correlated and cointegrated. All you need to do is enter both tickers and wait for the test to complete. It will provide you with a comprehensive report. We’ll delve into this further when we discuss how to find and backtest pairs in future articles.
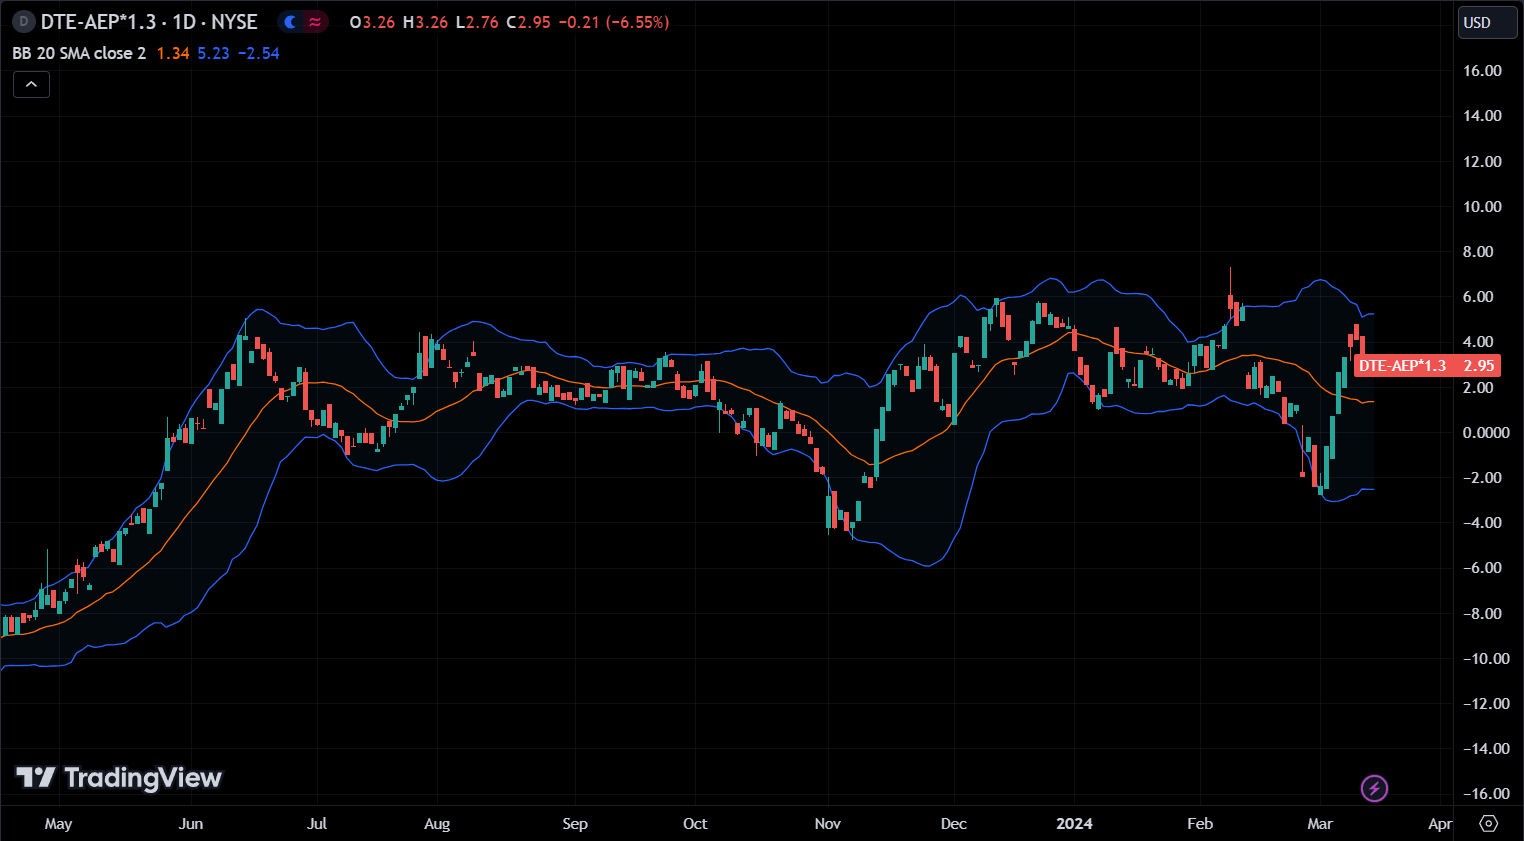
Finally, what you want to do is calculate the hedge ratio and create the pair. For this task, TradingView proves to be the superior choice. However, with the free version, you’re unable to day trade pairs; you’ll need to purchase their paid version for this functionality. Simply input the pair, for instance, if you’re trading DTE and AEP, and if the ratio is 1.5, you just enter DTE-AEP*1.5. It will generate the pair price chart. It’s as straightforward as that.
In the next article, we will talk about the trading plan for pairs trading.