In the big and ever-changing world of trading, learning the basic ideas is super important for doing well. Two really important ideas are support and resistance. They’re like the strong foundation that traders use to make their trading strategies.
Knowing what these terms mean helps traders understand how the market works and helps them make smart choices. So, let’s talk more about what is support and resistance in trading, why they’re important, and how traders can use them to do better in trading.
What is Support?
Support refers to a price level where buying pressure may increase, causing the price of an asset to rebound or stop falling further.
In other words, support is the price point at which demand for an asset is strong enough to overcome selling pressure.
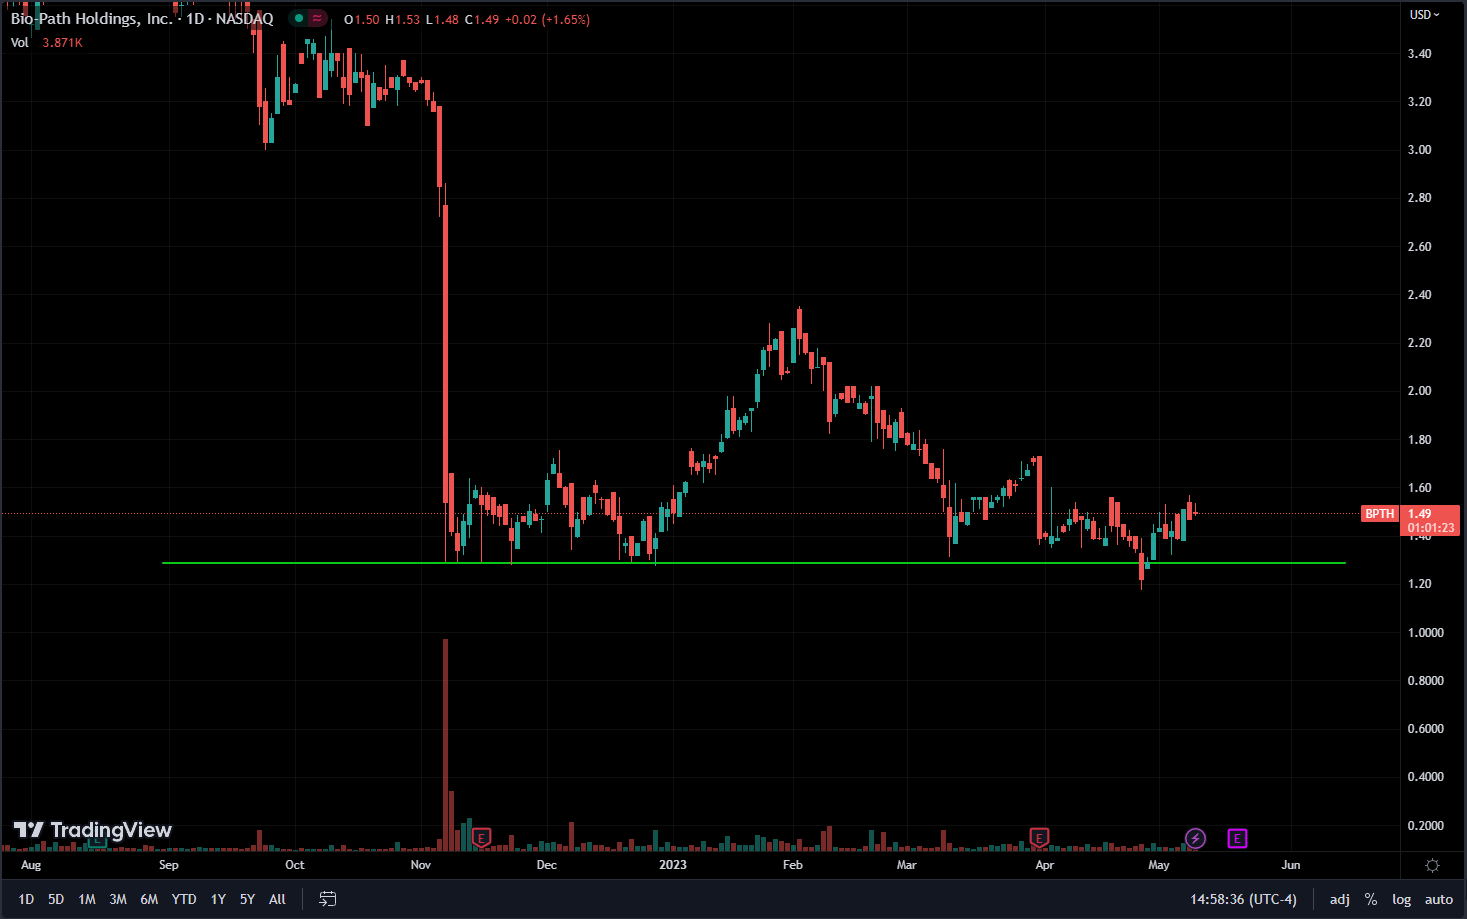
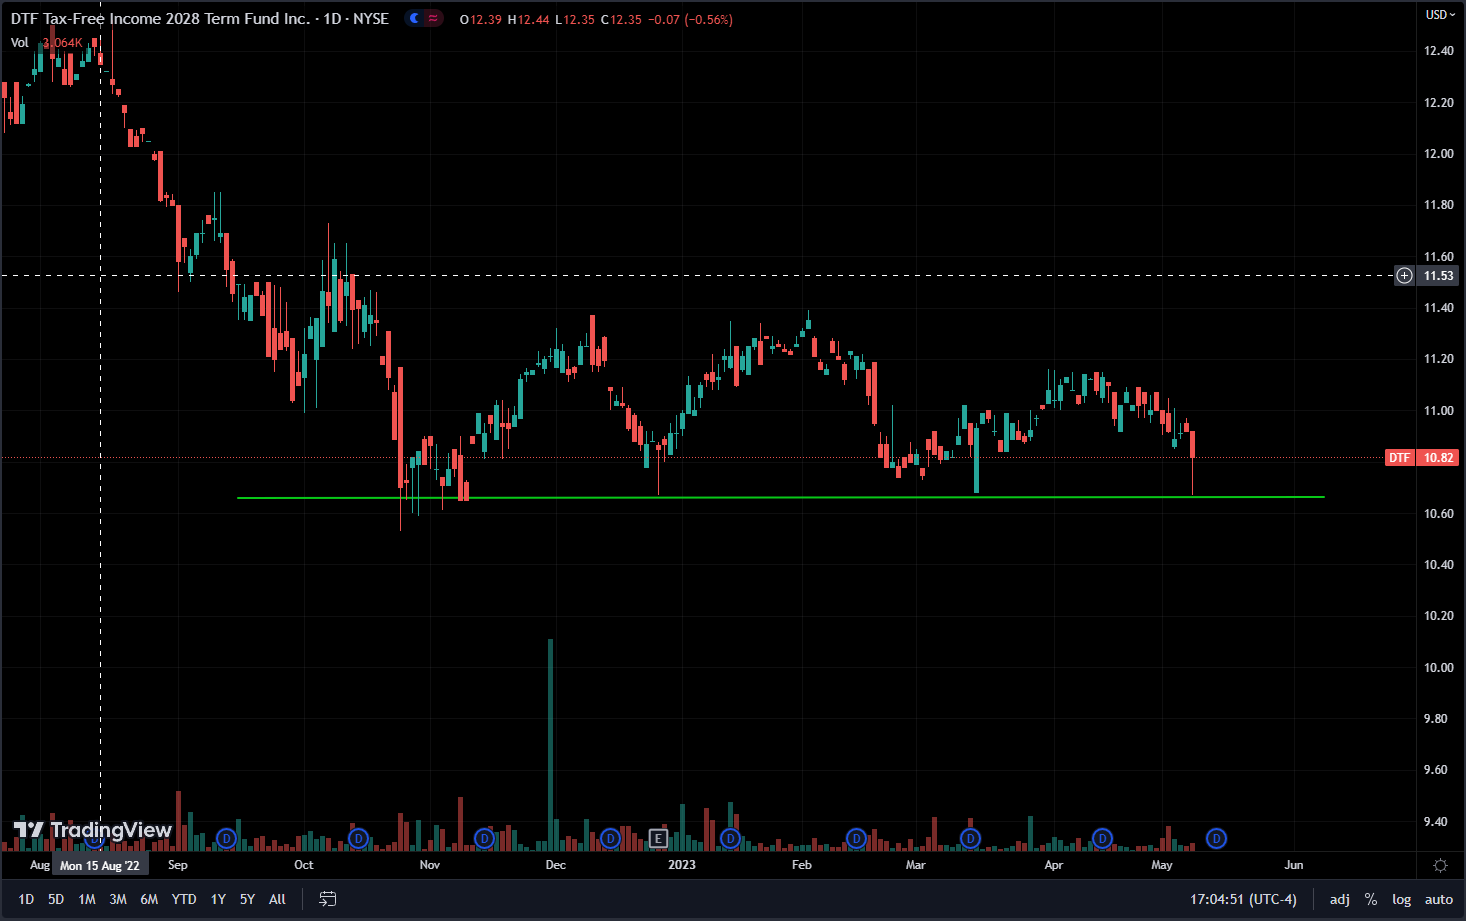
Support levels are often identified by previous lows or areas where the price has found support in the past.
What is Resistance?
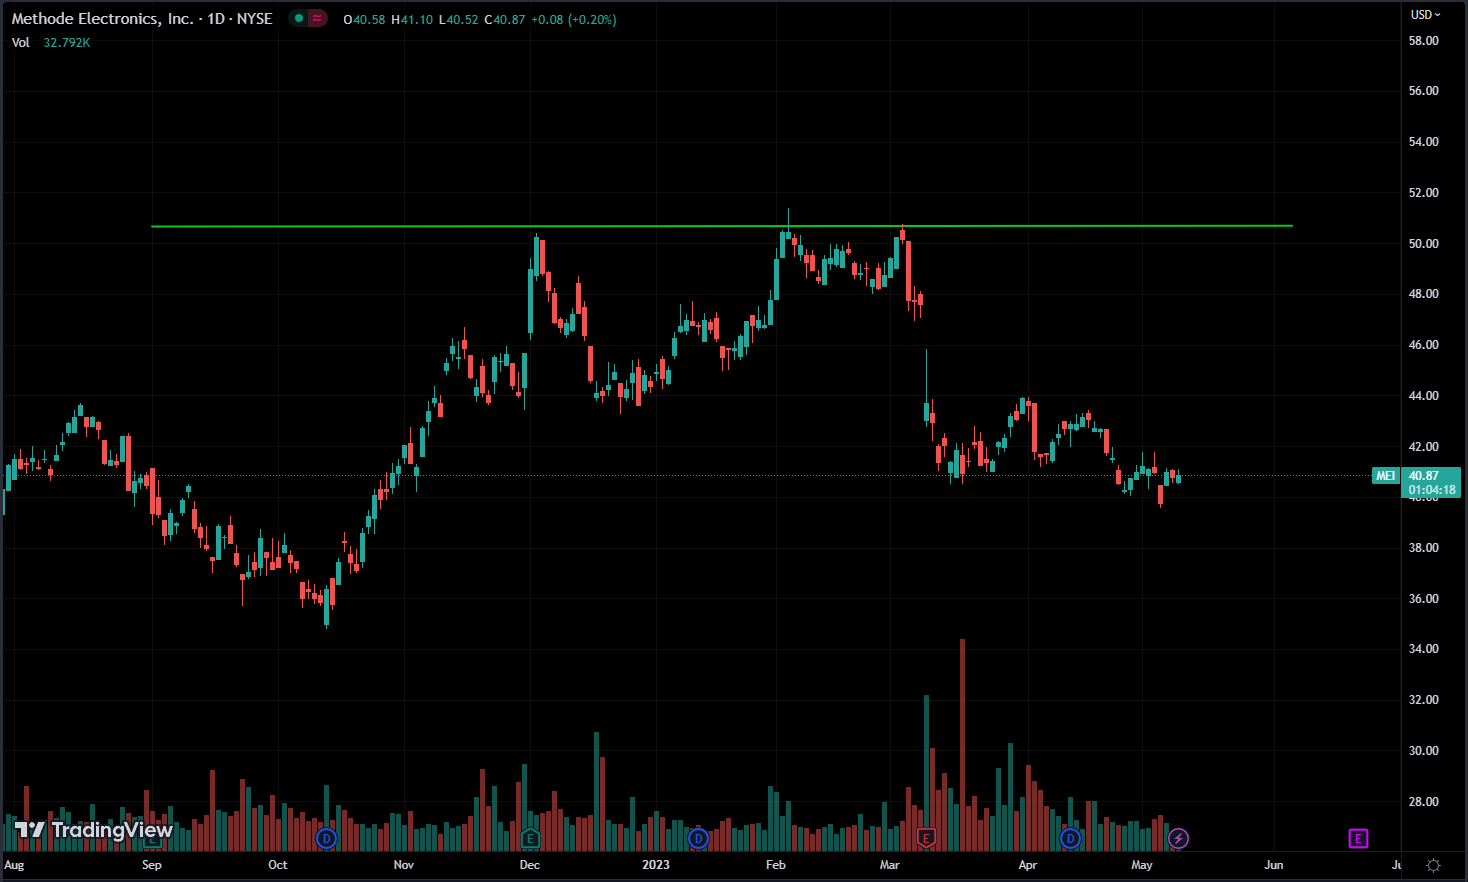
Resistance, on the other hand, is a price level where selling pressure may increase, causing the price of an asset to decrease or stop rising further.
Resistance is the price point at which supply for an asset is strong enough to overcome buying pressure.
Just like the support but resistance levels are often identified by previous highs or areas where the price has found resistance in the past.
Traders use support and resistance levels to identify buying and selling opportunities.
For example, a trader may look to buy an asset near a support level with the expectation that it will rebound from that level. Alternatively, a trader may look to sell an asset near a resistance level with the expectation that the price will fall from that level.
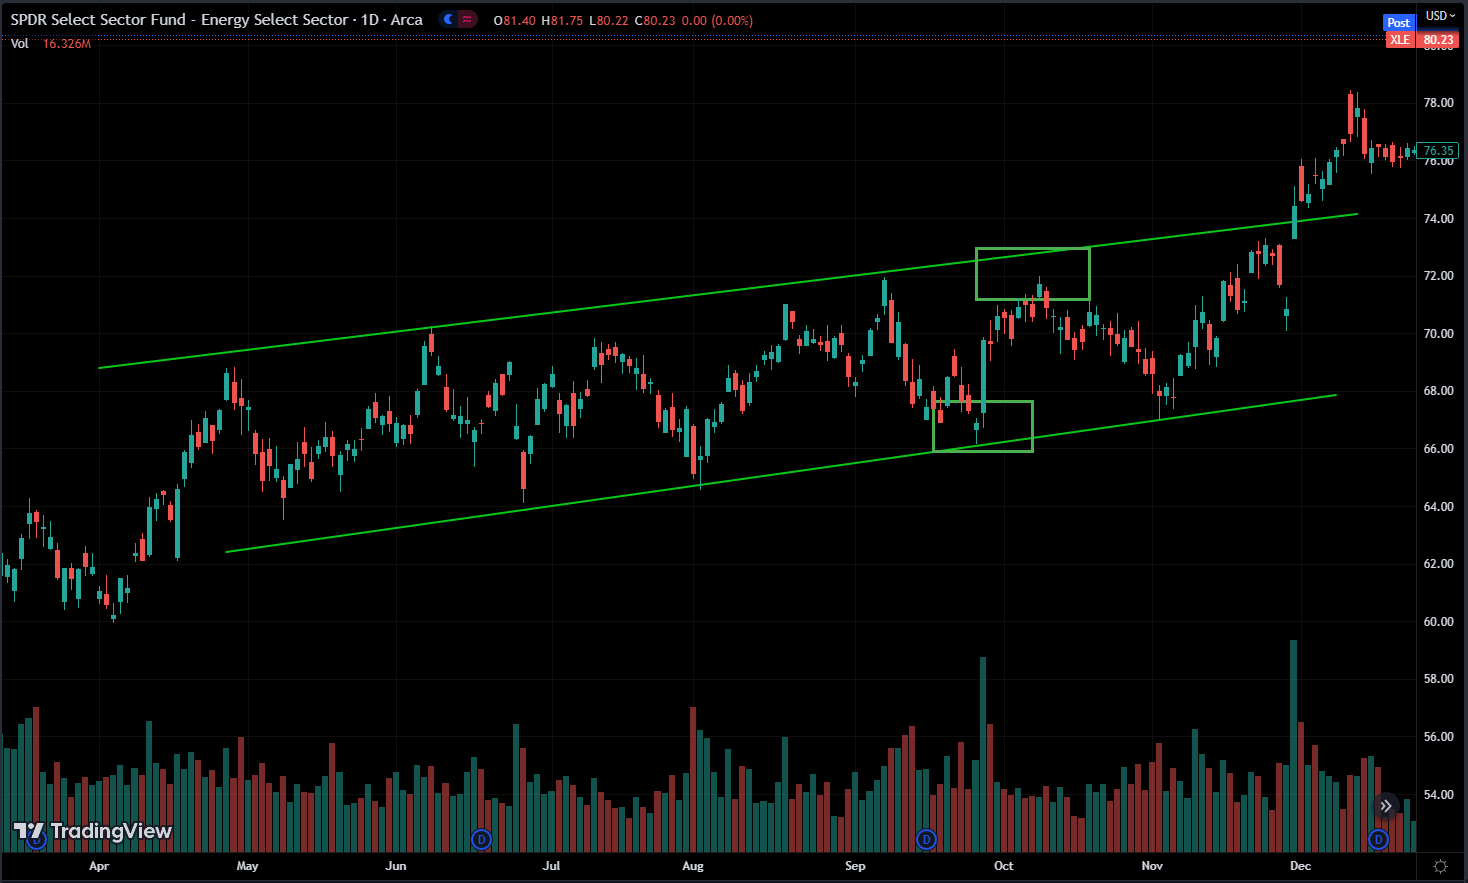
The line at the bottom of the price trend will act as the support line, while the one at the top will be the resistance line.
When you’re trading an asset that’s moving within a support or resistance level, it’s a good idea to buy the stock when it nears the support level and sell it when it gets close to the resistance level.
Traders often rely on channels and trends in their strategies. When you’re in a trading position, it’s essential to identify the direction the asset is moving and adjust your position accordingly.
We can draw trend lines in any timeframes such as 3m, 15m, 1h, Daily, or Weekly.
Now, let’s explore the interesting part: why do these lines support the price? It’s well-known that trends tend to stick around. But why? Could it be because everyone expects them to? Let’s dig deeper to understand why this happens.
Let’s break it down. Imagine you believe trends persist and you spot a trend in a stock. You might decide to buy when the stock hits the lower trend line or support. Why? Because you trust the stock won’t drop below that support line.
But guess what? You’re not alone in thinking that. Others who know about trends and this stock will draw the same line and aim to buy at the support line. It’s like a group effort because everyone believes trends last.
Now, since everyone’s placing buy orders at that line, there’s a ton of demand to buy the stock at that price. When the stock hits that level, it can’t drop below because there are more buyers than sellers. So it bounces back up.
It’s like a prediction that comes true because we all make it happen with our orders. So the trend supports the price because we all trust it will.
Support and resistance levels happen because of all these orders placed at specific prices. Lots of demand at support and lots of supply at resistance.
This concept is super important in trading. Many folks miss out on this understanding and end up losing. I don’t want that for you, hence the repetition.
Now where do we see most of these support and resistance levels in the chart?
Round Numbers Impacts on Support and Resistance
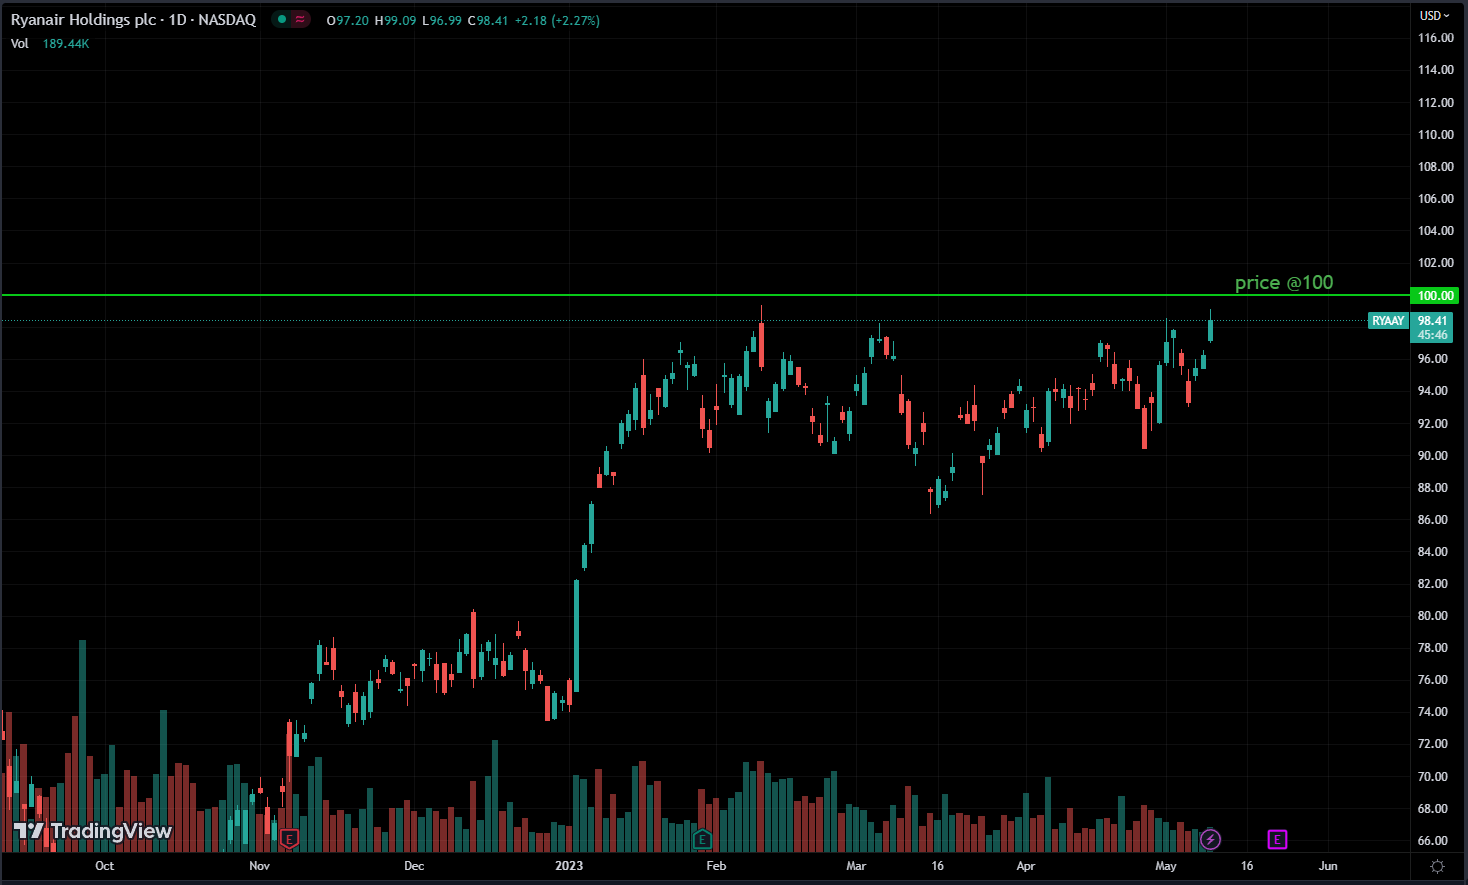
It’s fascinating to see how many people tend to place their buy or sell orders at nice, round numbers like 100, 50, or 20, rather than more specific values like 101.21 or 1002.23.
Round numbers, like 100 or 50, carry more weight as support or resistance levels compared to less familiar numbers such as 12 or 28.
For instance, if a stock has never surpassed $20, its support and resistance levels are likely to cluster around rounded figures like $15, $10, or $12, rather than precise values like $15.34 or $13.32.
The reason is simple: many traders send their orders at these round numbers, leading to a significant accumulation of supply or demand at these levels. This accumulation makes it less probable for prices to move beyond these levels unless there’s a compelling reason, like a significant change in market conditions.
Breaking through a round number level is only likely if all the orders are filled, leaving no more orders available at that price, except above it.
So, round numbers often act as support or resistance levels.
If you’re looking to exit a trade, say you’ve bought something and want to sell it, consider selling it just below the resistance level. Sometimes, the price might never quite reach the resistance, and even if it does, it could sharply fall, leaving you behind.
Similarly, if you’re buying, consider buying just above the support level. And when selling, do it just below the resistance. By doing so, you’re staying ahead of other traders in the market. We want others behind us to take the hit and support that price, making it less likely for the stock to move against us.
It’s all about being proactive and executing orders before others in the market do.
Role Reversals of Support and Resistance
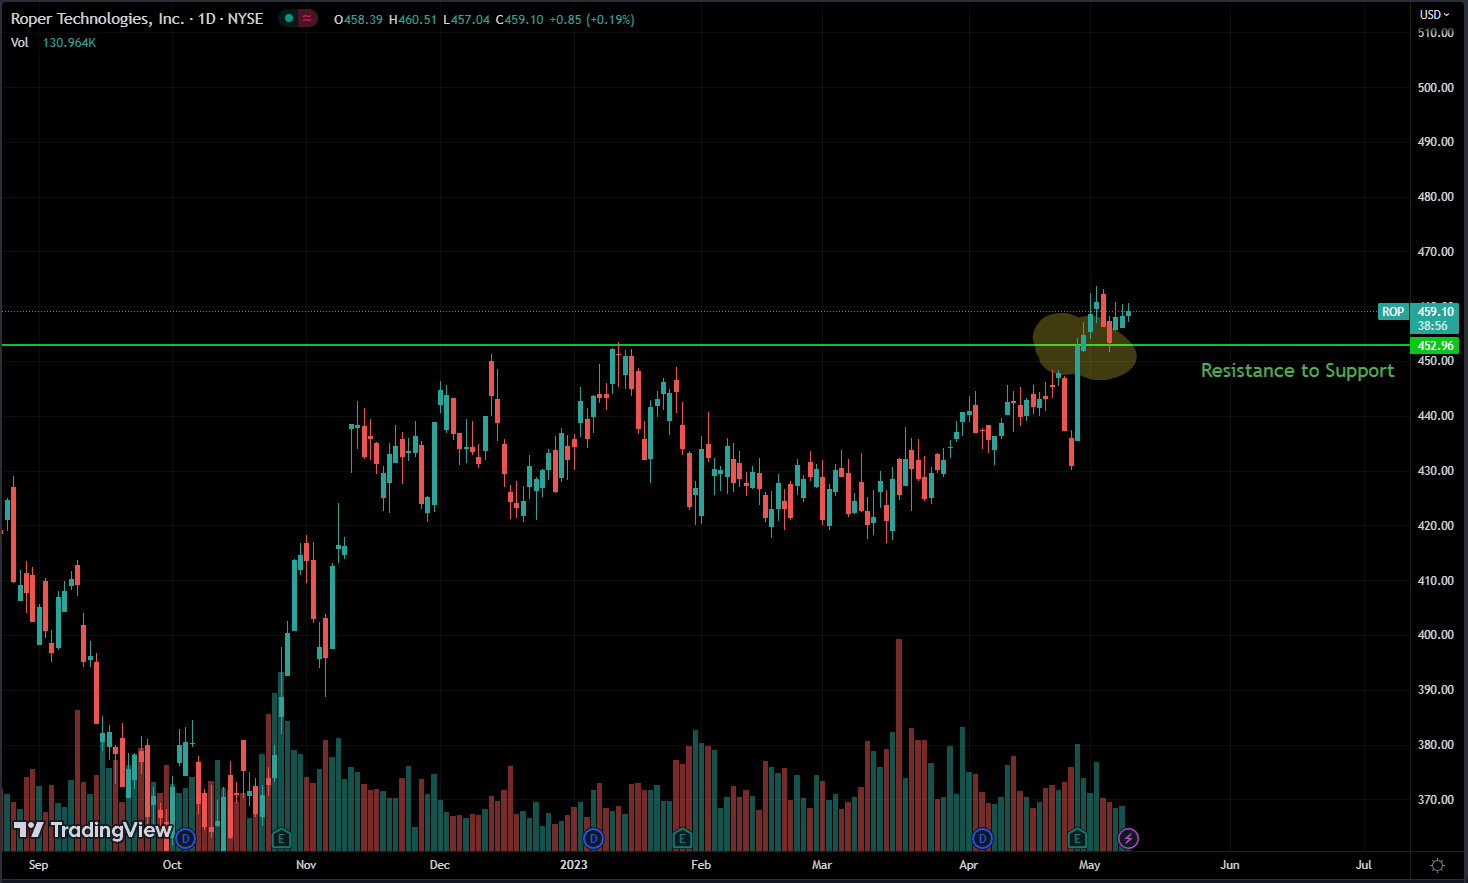
Role reversal is a concept where a former resistance level, once broken, can turn into a new support level, and a former support level, once broken, can become a new resistance level.
This happens because when the price of a security breaks through a resistance level, it suggests that demand for the security has gone up. This leads to a new level of support forming at the former resistance level.
Conversely, when the price breaks through a support level, it indicates that the supply for the security has increased. This results in a new level of resistance forming at the former support level.
Role reversal is a key idea in technical analysis.
For instance, if a stock’s price breaks through a resistance level, turning it into a new support level, traders might consider buying the stock near this new support level.
On the other hand, if a stock’s price breaks through a support level, making it a new resistance level, traders might consider selling the stock near this new resistance level.
Because role reversal is widely recognized, when a support or resistance level is broken, many traders believe it will become the new level of support or resistance.
This leads to a surge in orders at these levels, causing an increase in supply or demand at that price. This, in turn, establishes the new support or resistance level.
Once again, it all comes down to supply and demand, along with the idea of a self-fulfilling prophecy.
Intraday vs Long Term Support and Resistance
Intraday support and resistance levels signify price levels where traders anticipate buying or selling pressure during a single trading day. Conversely, long-term support and resistance levels are price levels that have maintained significance over an extended period.
Long-term levels may be impacted by fundamental factors like economic indicators, geopolitical events, and prevailing market sentiment.
While both intraday and long-term support and resistance levels hold importance, they serve distinct purposes.
Intraday levels aid in pinpointing potential entry and exit points for short-term trades, whereas long-term levels assist traders in identifying significant levels to monitor over an extended timeframe.
It’s important to recognize that intraday levels can be more volatile and prone to sudden shifts in market sentiment, whereas long-term levels typically exhibit greater stability and wield a stronger influence on overall market trends.
However, it’s noteworthy that short-term levels often sustain the price for more iterations than long-term levels.
Let me explain
The chart I’m referring to displays daily data spanning several months and highlights the existence of a support level that traders have previously supported.
With the price approaching this level again after a month, it’s uncertain whether the same traders will still be present as before.
Although it’s possible that they are, if the level is tested again after another two months, there’s a chance that the traders who were previously supporting it may have taken their profits and moved on, leaving the level vulnerable to a potential breakdown.
Because the time horizon is big. you can’t expect people to be there forever, because there are a lot of other better trading opportunities coming to the market all the time. traders don’t want to risk a trade if they are not sure.
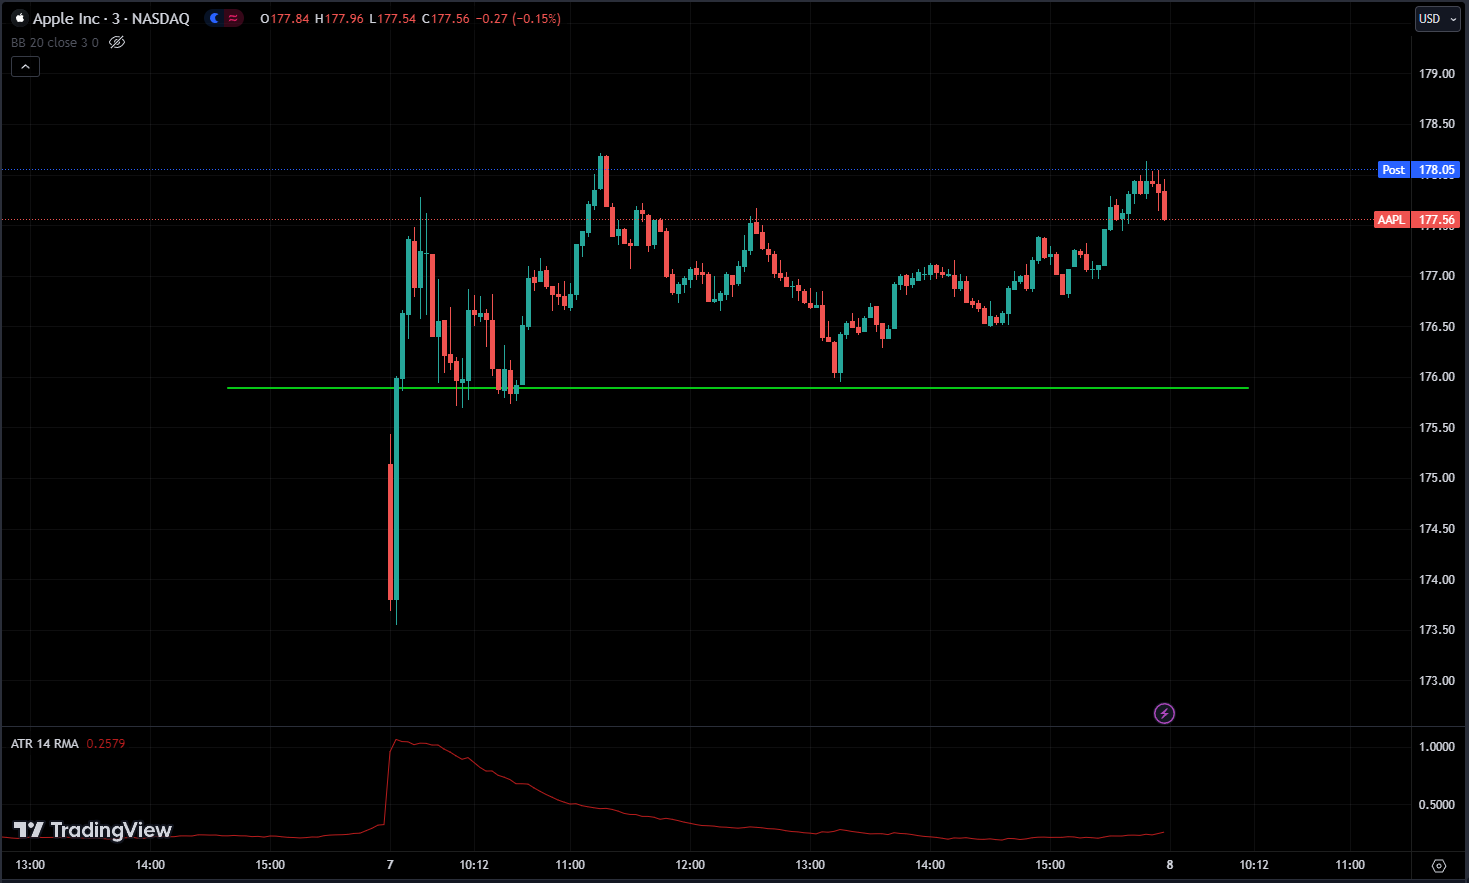
Now a 3-minute chart shows the data for a single trading day.
There was a support level present a couple of times, and the price approached it again after 2 hours, can we expect traders to still support the price as they did earlier? Given that it has only been less than three hours since the first approach, it’s likely that the same traders may still be present to support the price. and they did.
In intraday trading, we can usually have more confidence that we’re trading with the same group of traders, but in the long term, we can’t be certain whether the same traders will continue to support the price or not.
Because it’s the same day and most likely to be the same traders. and we can expect them to be there to support the price.
Conclusion
Support and resistance are foundational concepts in trading, providing invaluable insights into market dynamics and price movements. By understanding these concepts and incorporating them into their trading strategies, traders can enhance their decision-making process, manage risks effectively, and increase their chances of success in the financial markets. Remember, mastering support and resistance takes time and practice, but the rewards in terms of improved trading performance are well worth the effort.