
A trend is just the direction of a price movement.
The principle of technical analysis is that prices move in trends and history tends to repeat itself.
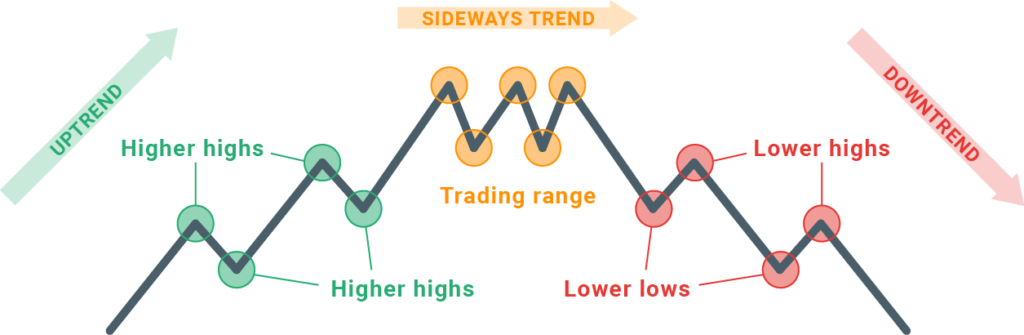
There are three different types of trends in trading, assets such as stocks can exhibit these trends, where they move upwards during an uptrend, downwards during a downtrend, or remain within a relatively narrow price range during a sideways trend.
- UPTREND
- DOWNTREND
- SIDEWAY TREND
Prices in financial markets tend to exhibit fluctuations rather than moving in a straight line. So trends are identified by analyzing the highs and lows of prices during a particular period.
What is an Uptrend?
An uptrend is a pattern where the price of an asset moves in an upward direction over an extended period of time.
During an uptrend, the lows and highs of the asset’s price tend to be higher than those seen in previous periods.
Where the buyers are willing to pay higher prices for the asset, and the overall trend becomes upward.
So higher lows and higher highs indicate an uptrend.
What is a Downtrend?
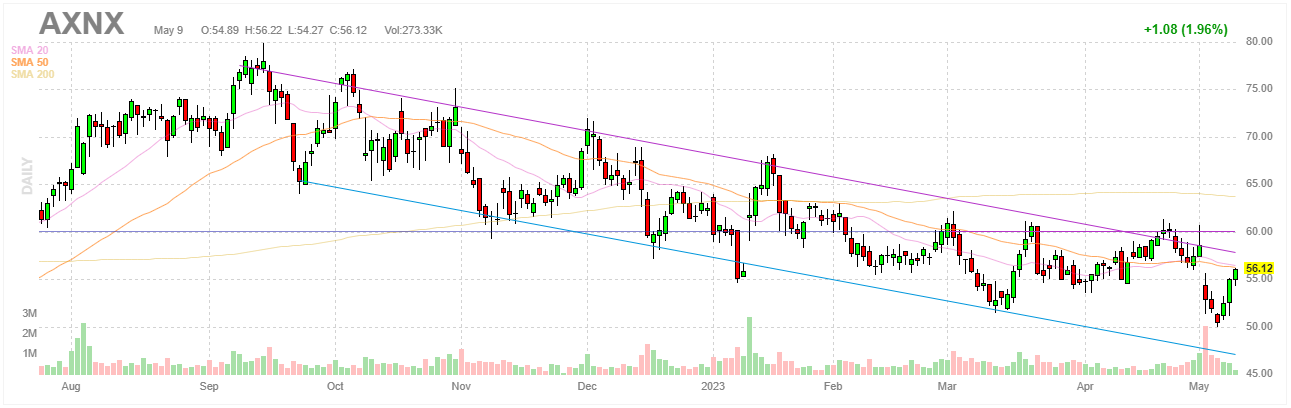
On the other hand, a downtrend is a pattern where the price of an asset moves in a downward direction over an extended period of time.
During a downtrend, the lows and highs of the asset’s price tend to be lower than those seen in previous periods.
A downtrend means more and more people are willing to sell at a lower price.
What is a Sideway Trend?
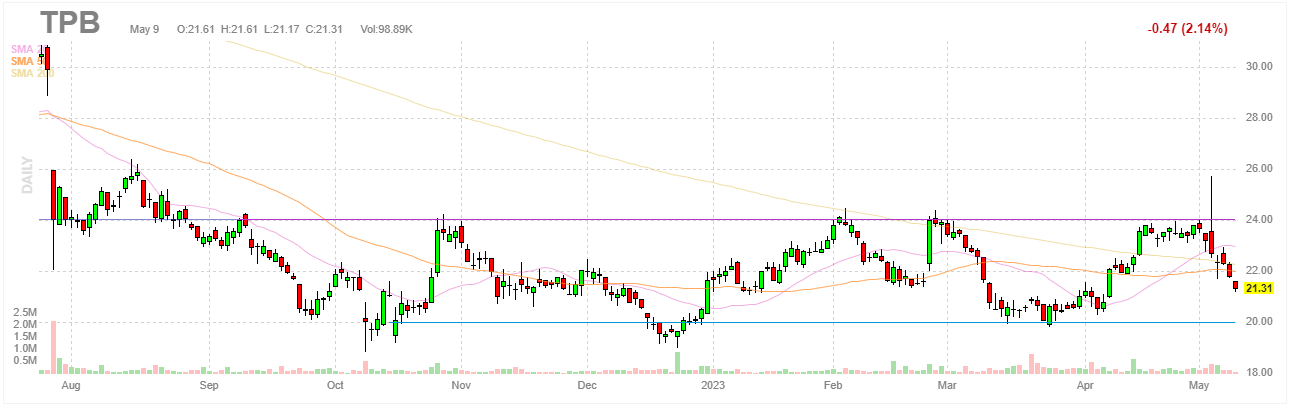
A sideways trend, also known as a horizontal trend, is a pattern where the prices of an asset move within a relatively narrow price range over an extended period of time.
During a sideways trend, the lows and highs of the asset’s price tend to be similar or almost the same as those seen in previous periods.
All movements in financial markets can be classified into these three types, which means that a stock or any other asset can only move in one of these three ways.
Technical analysis suggests that trends tend to persist over time. meaning if something is in an uptrend it’s very likely to stay in uptrend for some time.
This is why there are common saying in finance: “The trend is your friend” and “Don’t go against the trend.”
What are Trend Lines?
A trendline is a line that is drawn on a price chart to help identify the direction of a trend in the market.
It is created by connecting a series of highs or lows in the price of an asset over a specified period of time.
In an uptrend, the trendline is drawn by connecting the series of higher lows, while in a downtrend, it is drawn by connecting the series of lower highs. A sideways trendline is drawn by connecting the highs and lows of a price range in a horizontal direction.
Trends can endure for a considerable period of time, but they are not permanent and will eventually undergo a change. once the stock price crosses the trendline that has been drawn, it is an indication that the trend has ended.
Example:
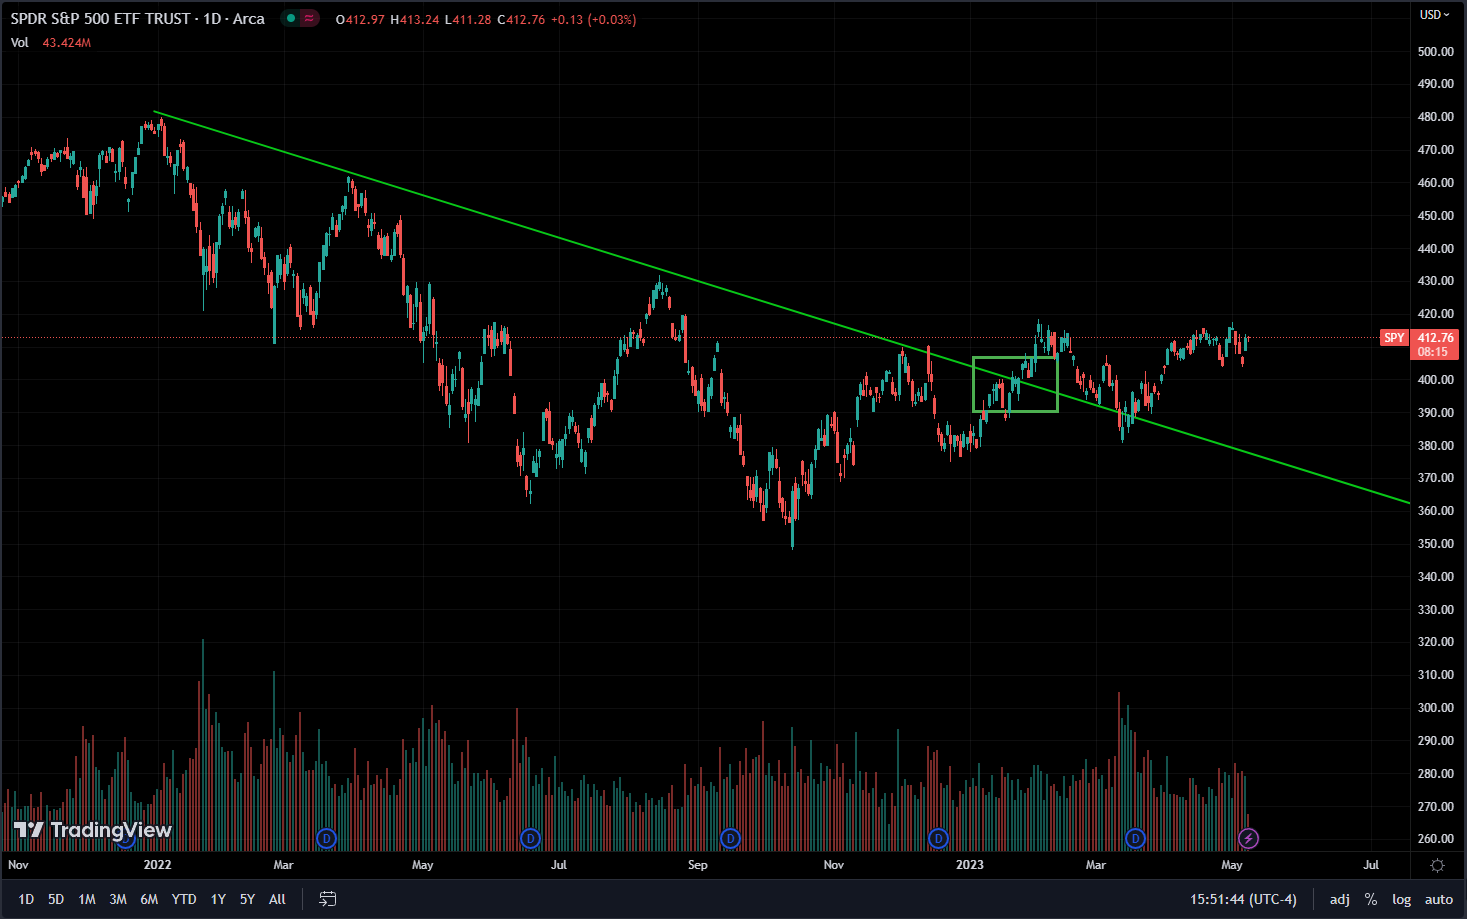
The rectangle indicates the price breakout of the trend line. thus we can assume that the previous trend is over and the market is entering a new trend.
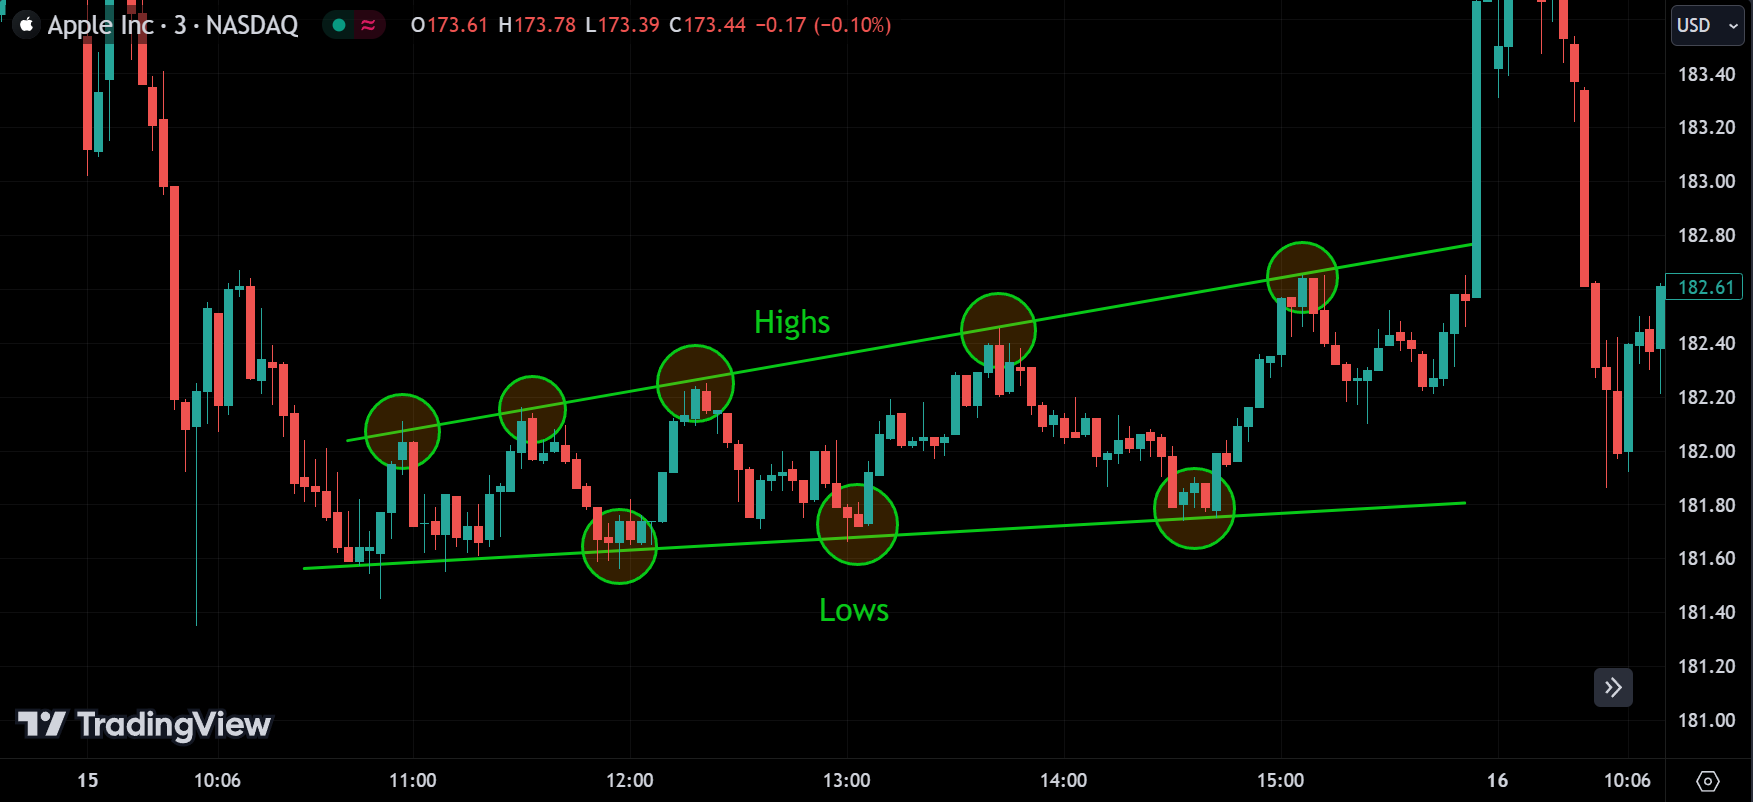
What are Trend Channels?
A channel shows the range of changes in an asset’s price over time.
A channel is composed of two parallel trendlines, one drawn through the highs and the other through the lows of the price range. these trendlines create a boundary that serves as a support level below the price and a resistance level above it.
Hold tight for support and resistance. we will get there in the next article.
Not only do assets move in a direction, but they move within a channel. meaning it moves only within the upper line and lower trend line.
Just as trends we have 3 different channels.
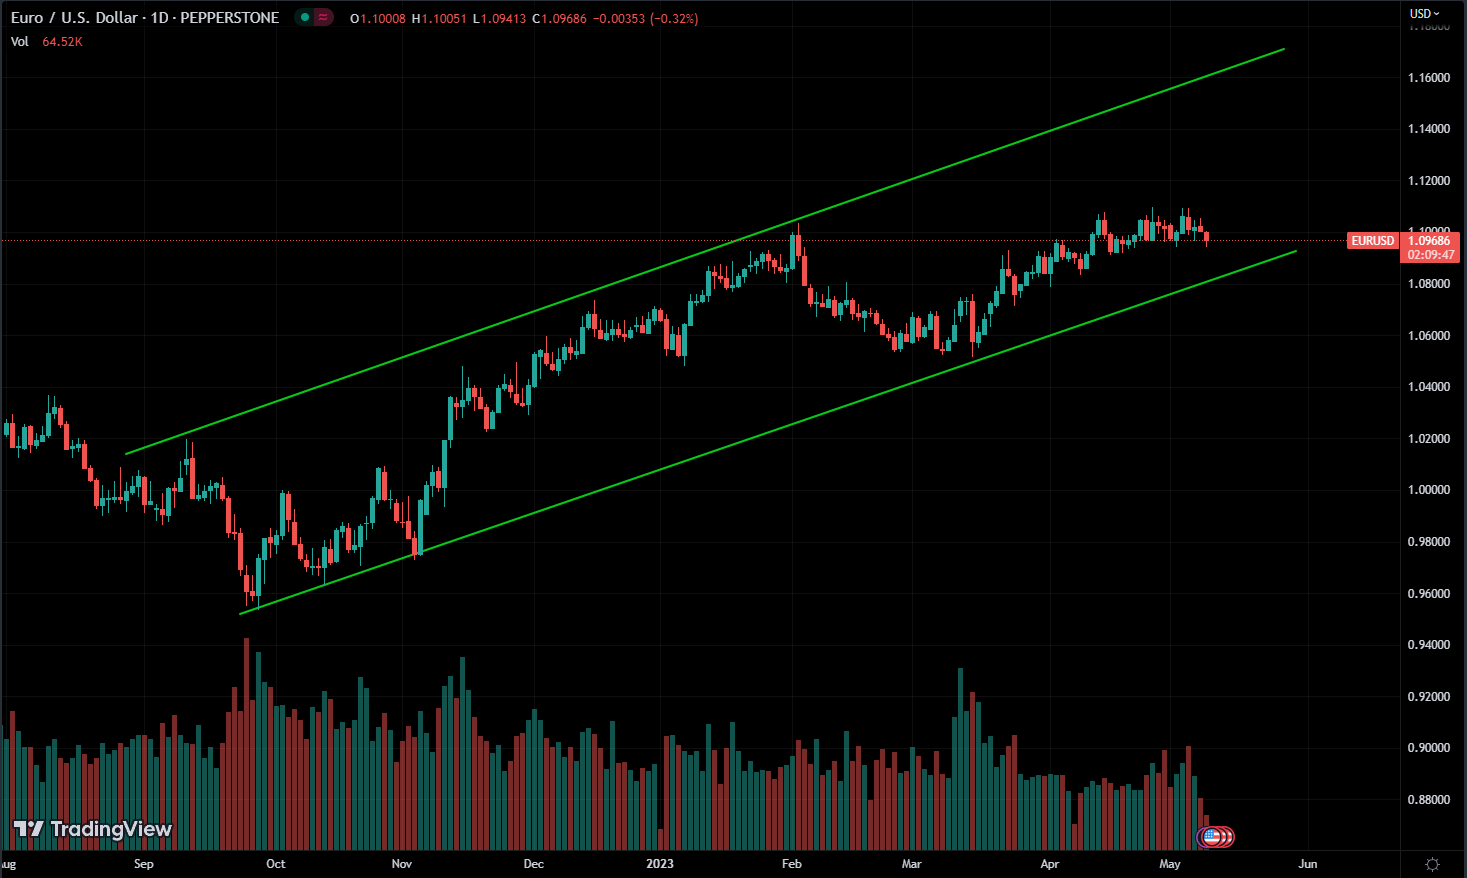
What is an Ascending Channel?
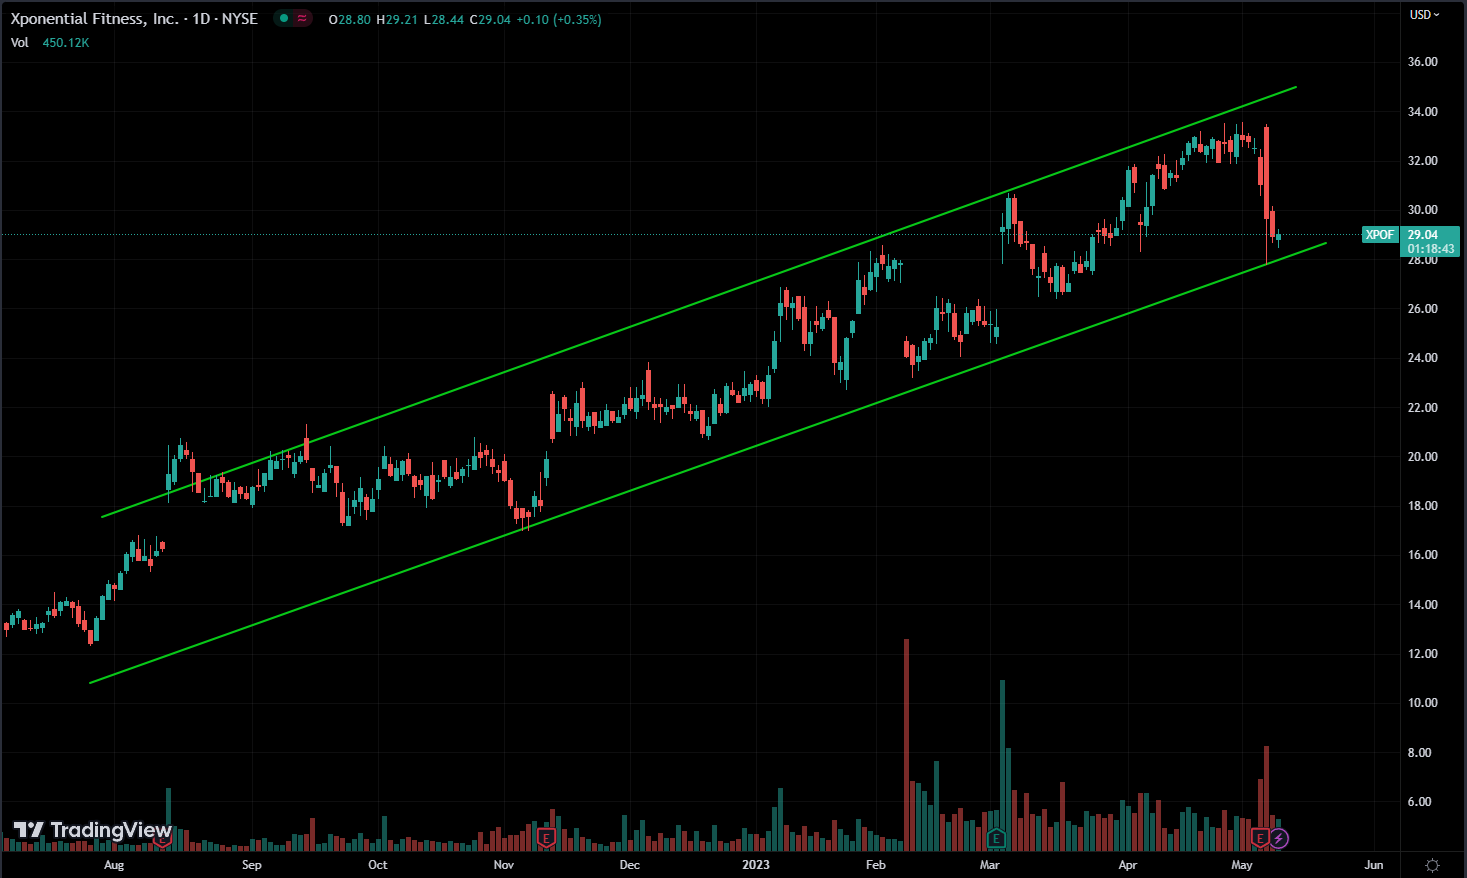
An ascending channel is formed by drawing a trend line that connects the higher lows of an asset’s price, and another trend line that connects the higher highs.
An ascending channel indicates a bullish trend, with buyers in control of the market.
What is a Descending Channel?
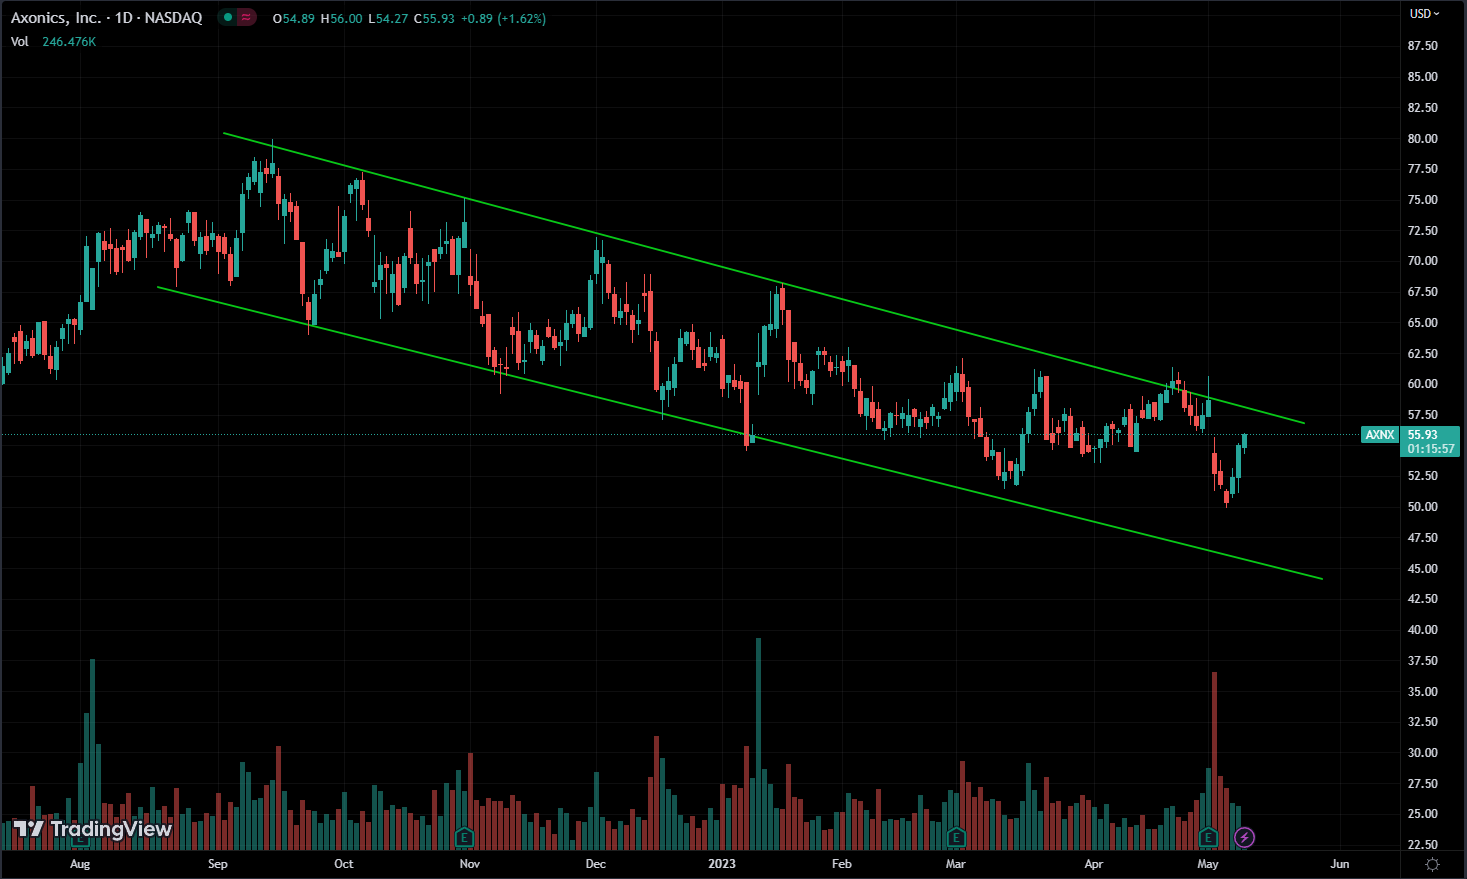
A descending Channel is formed by drawing a trend line that connects the lower highs of an asset’s price and another trend line that connects the lower lows.
A descending channel indicates a bearish trend, with sellers in control of the market.
What is a Horizontal / Sideway Channel?
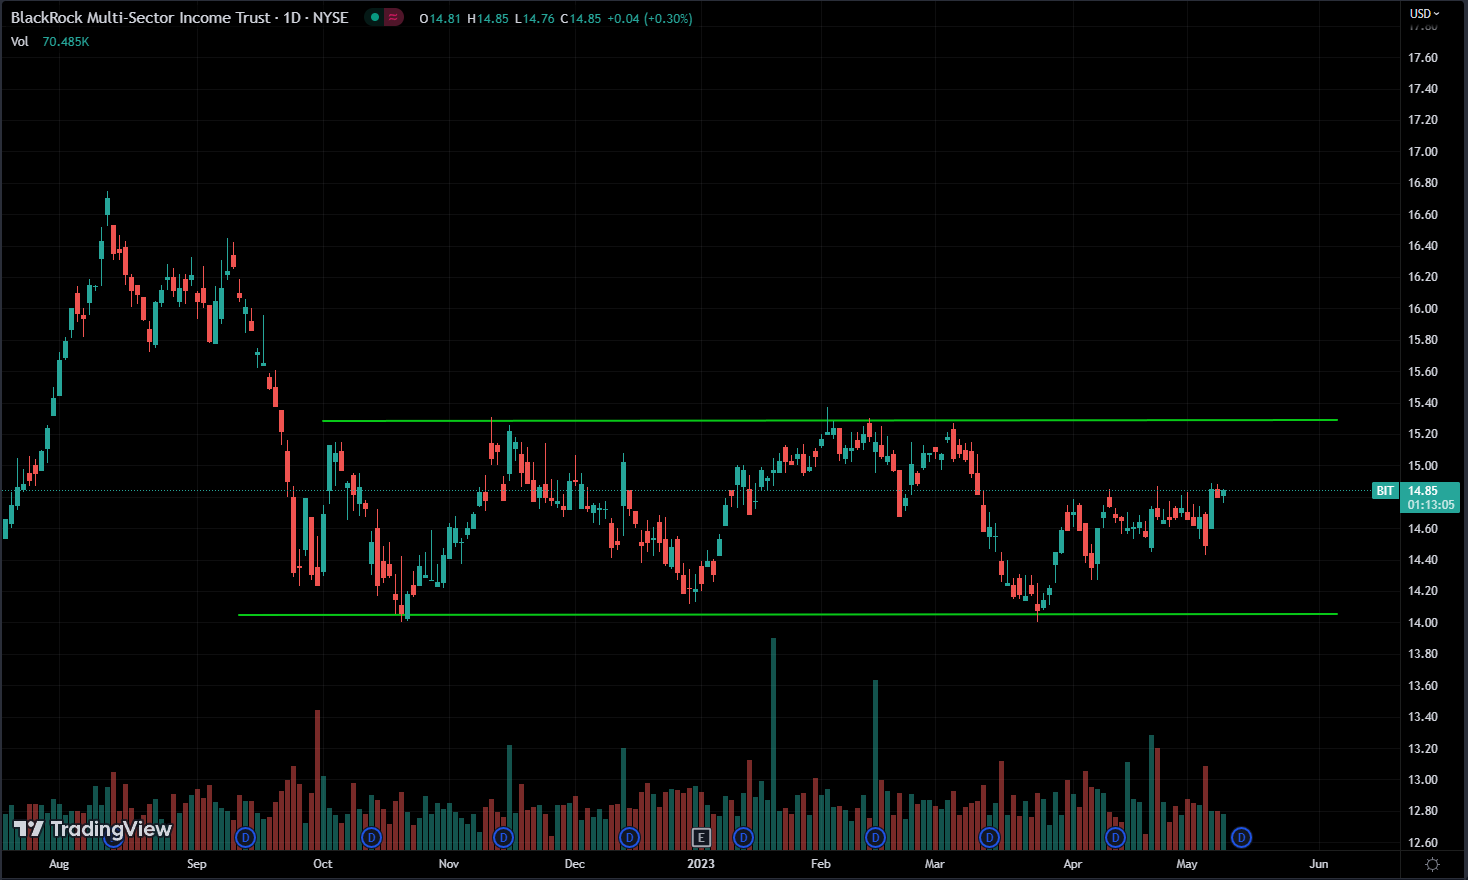
This channel is formed by drawing a trend line that connects the highs and lows of an asset’s price, which remains relatively flat over time.
A horizontal channel indicates a neutral trend, with neither buyers nor sellers in control of the market.
If you want to trade a stock that appears to be in a channel, you want to buy and sell within that channel because the price is unlikely to pass these trend lines.
Now we can come to a conclusion that we draw lines connecting the lows and highs of the price and these trend lines serve as support and resistance to the price.
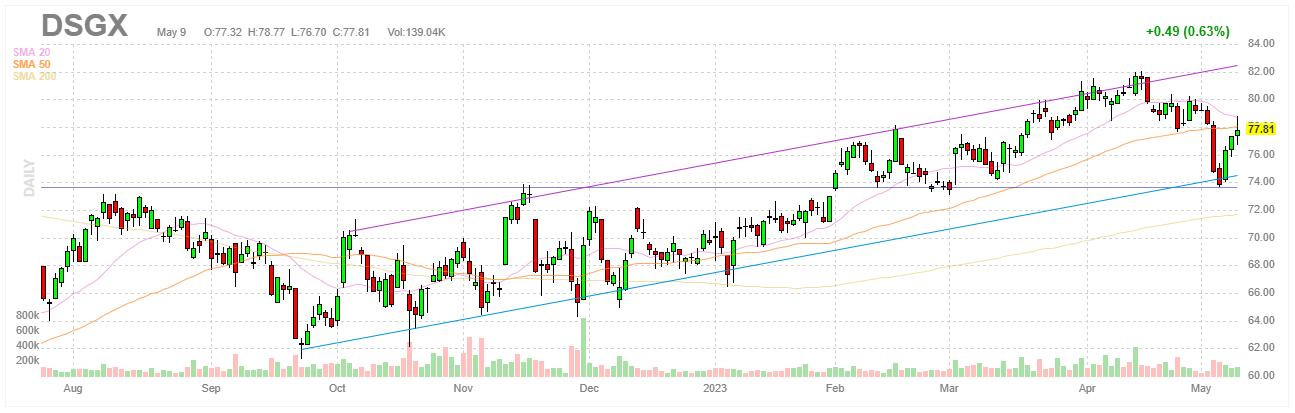
Trend Lengths in Trading
Trend length refers to the duration of a trend. The length of a trend can vary depending on several factors, such as the underlying market conditions, economic data, news events, and investor sentiment. and we can have multiple trend lengths in the same chart.
- LONG TERM TREND
- MEDIUM TERM TREND
- SHORT TERM TREND
Trend length is an important concept in technical analysis, as traders and analysts use historical price data to identify trends and make predictions about future price movements. By studying the length of previous trends, analysts can gain insights into how long a current trend is likely to last, and whether it is likely to continue or reverse.
Example:
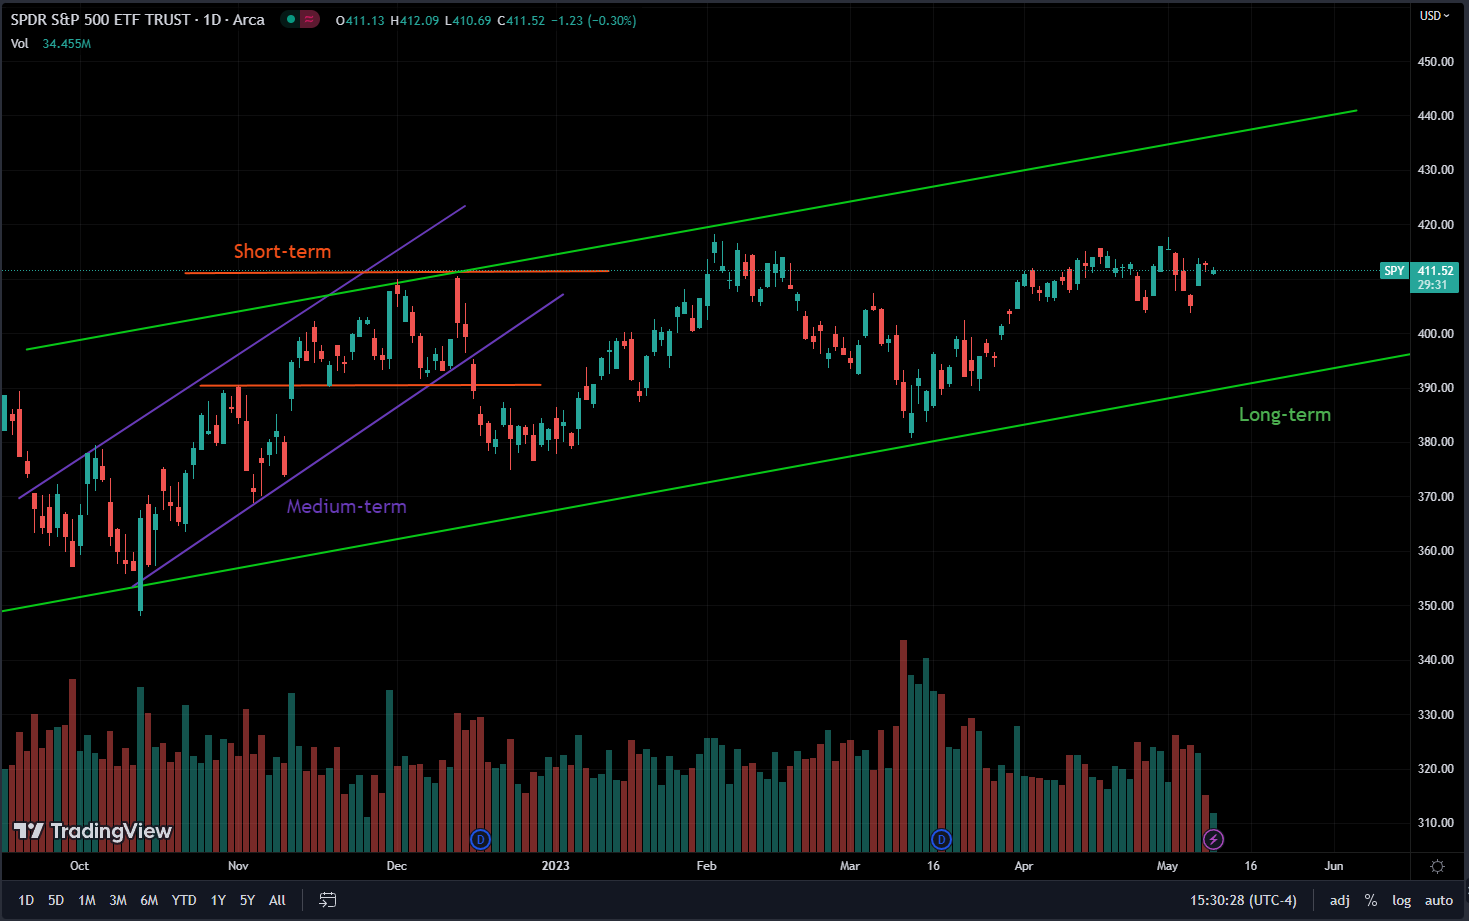
Our upward long-term trend includes a medium-term trend that is also ascending. However, within that medium-term trend, there is a sideways short-term trend.
So which trend we look at? Well, all of them.
Our principle concept is “Don’t go against the whole general trend.”
It depends on how long you expect to stay in your position.
If you are planning to hold a position for a single day, you do not have to focus on the long-term trend. Instead, you should concentrate more on the medium and short-term trends. or If you plan to keep your position for months, then your focus should be on the long-term trend, and short or medium-term trends may not be as relevant.
The optimal trend to consider is when all of these trends are in alignment.
This means that if you see a long-term downward trend, you should only consider short positions and avoid buying. In this case, you should wait for a medium-term downward trend and a short-term downward trend to align before entering a short position.
Conclusion
Now what I want you to do is get over to finviz and find the page for these trend lines and channels.
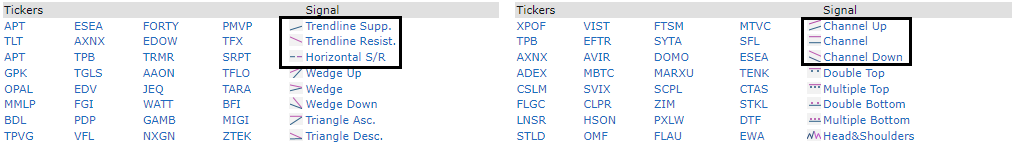
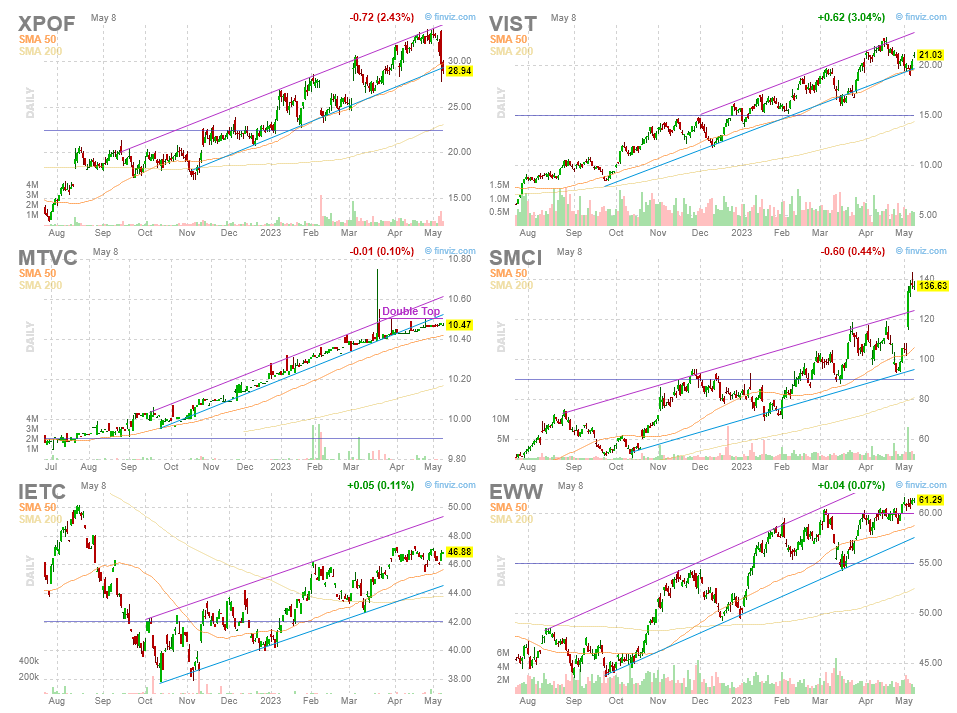
Get some idea of drawing trendlines by looking at these charts on their websites. then use Tradingview to try drawing them in your favorite assets, find many charts, and try different timeframes.
Practice makes perfect, after many iterations your eyes will identify these levels without even drawing lines.
Try not to work too hard to draw these lines, you want to draw something that other people are drawing too, something simple to come up, not very complicated lines, try to make it as simple as possible.
When you know that a big website like Finviz, which everyone uses has a section for these channels and lines, you know that a lot of people are using them. And if a lot of people are using them and looking at them, that means these channels and lines are more likely to persist.
Again, In trading, you don’t want to look at something that nobody looks at, because if nobody looking at it. Then what’s the point of using it? Because prices are going to move only because of other people’s orders.
The movement of prices is not a result of your ability to predict their direction by analyzing technical indicators. Rather, it’s your ability to anticipate the actions of other traders based on these indicators that drive price movements.
By studying these indicators, you can gain insights into what other traders are likely to do, and this in turn can help you to make informed trades that align with the market sentiment. Ultimately, it’s the collective actions of traders that determine the direction in which prices move.
In easy terms;
Prices aren’t moving because you were able to predict by looking at these lines where it’s going, it’s moving because you are able to predict by looking at these lines what other people are going to do. And because what other people are doing that’s going to help price move in the direction that you think that’s going to move in.
To summarize, it’s important to avoid using technical tools that are not widely observed or studied by others. This is because if a tool is not impacting the decisions of other traders, it’s unlikely to have a significant effect on the price of a stock.
Because the price of a stock only going to be affected by what other people are doing with their orders.